Intervenciones para mejorar el acceso a los servicios de cirugía de cataratas y la repercusión sobre la igualdad de condiciones en países de ingresos bajos y medios
Información
- DOI:
- https://doi.org/10.1002/14651858.CD011307.pub2Copiar DOI

- Base de datos:
-
- Cochrane Database of Systematic Reviews
- Versión publicada:
-
- 09 noviembre 2017see what's new
- Tipo:
-
- Intervention
- Etapa:
-
- Review
- Grupo Editorial Cochrane:
-
Grupo Cochrane de Salud ocular y de la visión
- Copyright:
-
- Copyright © 2017 The Cochrane Collaboration. Published by John Wiley & Sons, Ltd.
Cifras del artículo
Altmetric:
Citado por:
Autores
Contributions of authors
JR assessed studies for inclusion and exclusion, assessed risk of bias, extracted data, entered data and authored the first draft of the review.
JP assessed studies for inclusion and exclusion, assessed risk of bias, extracted data, entered data and commented on the text of the review.
VW, IB, CG, KB, RC, AZ, and PT extensively reviewed the protocol and commented on the text of the review.
Sources of support
Internal sources
-
No sources of support supplied
External sources
-
National Institute for Health Research (NIHR), UK.
-
Richard Wormald, Co‐ordinating Editor for Cochrane Eyes and Vision (CEV) acknowledges financial support for his CEV research sessions from the Department of Health through the award made by the National Institute for Health Research to Moorfields Eye Hospital NHS Foundation Trust and UCL Institute of Ophthalmology for a Specialist Biomedical Research Centre for Ophthalmology.
-
This review was supported by the National Institute for Health Research, via Cochrane Infrastructure funding to the CEV UK editorial base.
The views and opinions expressed therein are those of the authors and do not necessarily reflect those of the Systematic Reviews Programme, NIHR, NHS or the Department of Health.
-
Declarations of interest
JR, VW, IB, CG, JP, KB, RC, AZ, and PT have no known conflicts of interest. PT and VW are co‐convenors and JP is Co‐ordinator of the Campbell and Cochrane Equity Methods Group.
Acknowledgements
We thank:
-
Iris Gordon (Cochrane Eyes and Vision (CEV)) who created and executed the electronic searches, Jennifer Evans (CEV) for support with subgroup analysis and completing the review and Anupa Shah (CEV) for her assistance throughout the review process
-
GVS Murthy, Elena Schmidt, Andy Oxman and Nkengafac Villyen Motaze for comments on the protocol or review or both
Version history
| Published | Title | Stage | Authors | Version |
| 2017 Nov 09 | Interventions to improve access to cataract surgical services and their impact on equity in low‐ and middle‐income countries | Review | Jacqueline Ramke, Jennifer Petkovic, Vivian Welch, Ilse Blignault, Clare Gilbert, Karl Blanchet, Robin Christensen, Anthony B Zwi, Peter Tugwell | |
| 2014 Sep 20 | Interventions to improve access to cataract surgical services and their impact on equity in low‐ and middle‐income countries | Protocol | Jacqueline Ramke, Vivian Welch, Ilse Blignault, Clare Gilbert, Jennifer Petkovic, Karl Blanchet, Robin Christensen, Anthony B Zwi, Peter Tugwell | |
Differences between protocol and review
There are four differences between the protocol and review.
1. In the Types of outcome measures section we modified the text from:
Data will be extracted for any of these outcomes reported for any PROGRESS‐Plus groups if an assessment of the effect the intervention had on equity can be made.
to
Data will be extracted for any of these outcomes disaggregated by PROGRESS‐Plus groups if available.
2. In the Selection of studies section we made the underlined addition to the review:
This includes all studies that did not report outcome data in a usable way, or only reported overall effects, without reporting according to any of the PROGRESS‐Plus categories or without focusing on a disadvantaged population.
3. In the Assessment of risk of bias section we added the underlined text:
For RCTs, we assessed risk of bias using Cochrane’s ‘Risk of bias’ tool as described in Chapter 8 (Higgins 2011a) and Chapter 16 (Higgins 2011b) of the Cochrane Handbook for Systematic Reviews of Interventions . We also assessed recruitment bias, baseline imbalance, and loss of clusters for cluster RCTs.
4. In the Subgroup analysis section we separated the text into investigation of heterogeneity (type of investigation) and investigation of impact on equity (PROGRESS‐Plus). Hypotheses in Table 2 remained the same.
In addition, we made minor changes to phrasing and terminology between the protocol and review in response to reviewer comments.
Keywords
MeSH
Medical Subject Headings (MeSH) Keywords
- *Cataract Extraction;
- *Developing Countries;
- *Health Services Accessibility [statistics & numerical data];
- *Rural Health Services;
- Cataract [complications];
- China;
- Patient Education as Topic;
- Randomized Controlled Trials as Topic;
- Referral and Consultation [statistics & numerical data];
- Vision Disorders;
Medical Subject Headings Check Words
Humans;
PICO

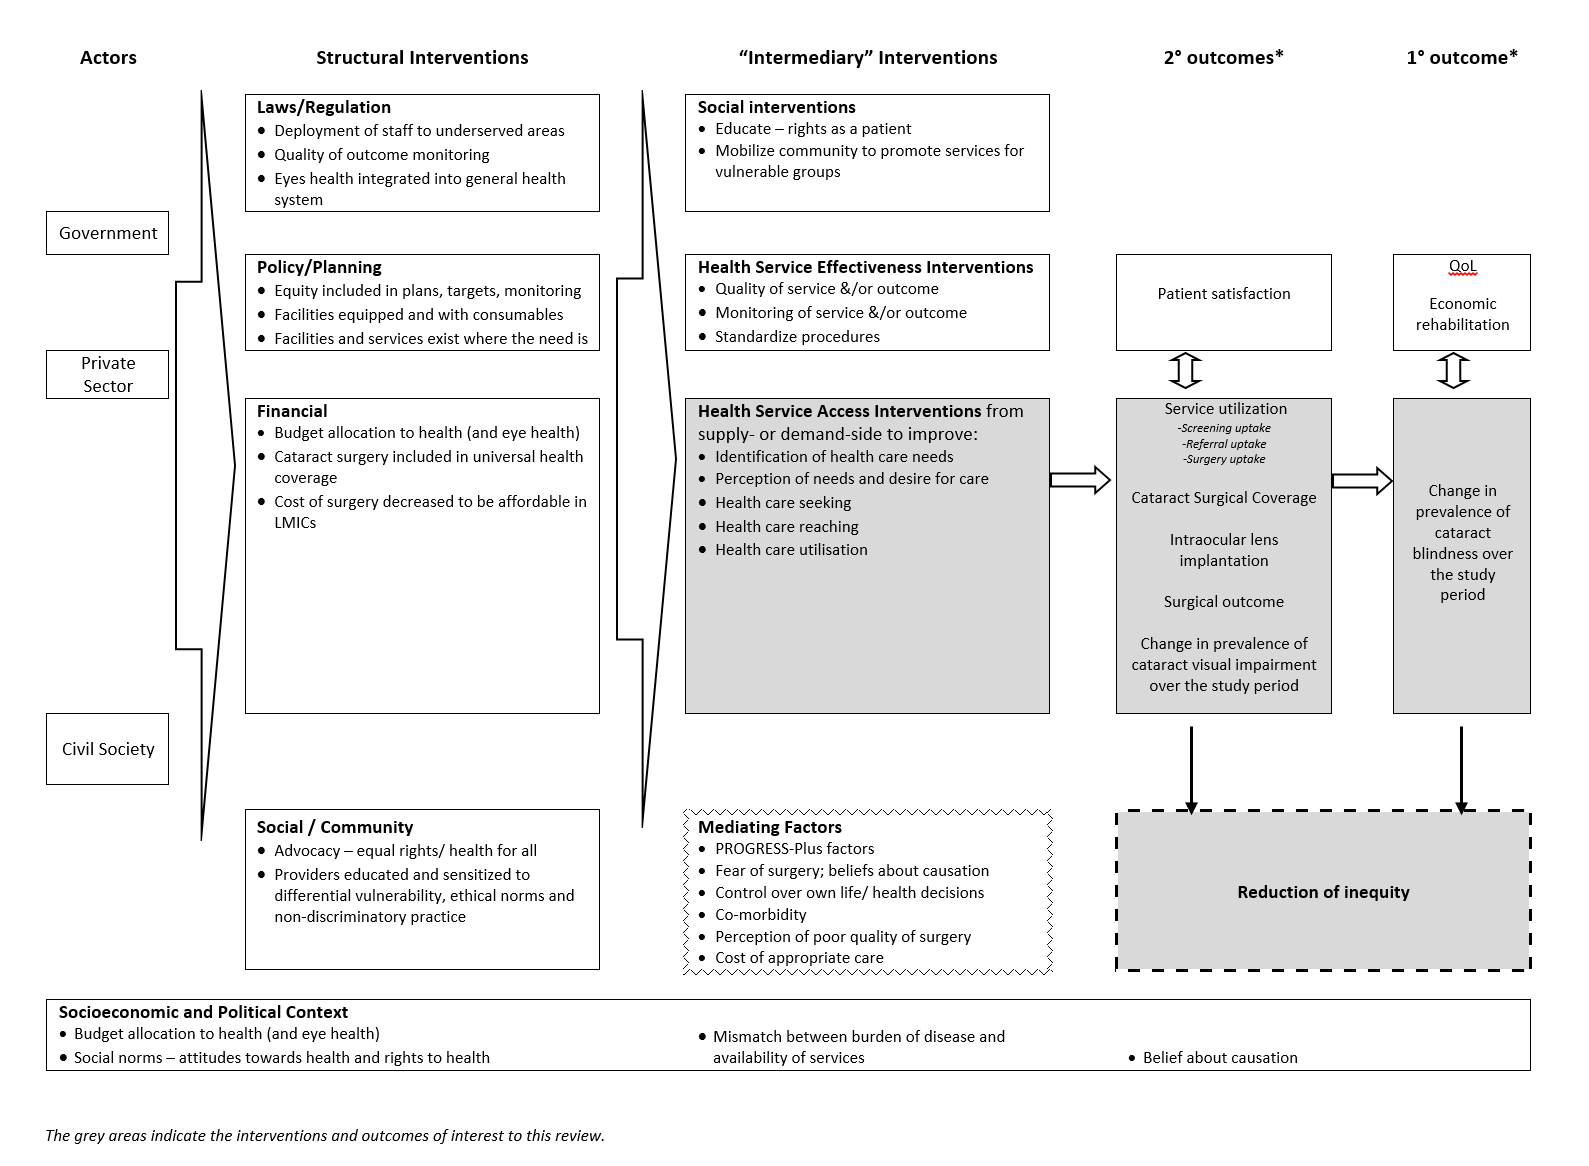
Examples of interventions to improve access to cataract surgical services against Levesque and colleague’s1 conceptual framework of access to health care (Levesque 2013)

Study flow diagram

Risk of bias graph: review authors' judgements about each risk of bias item presented as percentages across all included studies

Risk of bias summary: review authors' judgements about each risk of bias item for each included study
| Information video and counselling to improve access to cataract surgical services compared with standard care for cataract | ||||||
| Patient or population: people with vision impairment caused by cataract Settings: low‐ and middle‐income settings Intervention: information video and counselling* Comparison: standard care | ||||||
| Outcomes | Illustrative comparative risks** (95% CI) | Relative effect | No of participants | Certainty of the evidence | Comments | |
| Assumed risk | Corresponding risk | |||||
| Standard care | Intervention to improve access to cataract surgical services | |||||
| Change in the prevalence of cataract blindness | Not reported | |||||
| Prevalence of visual impairment due to cataract | Not reported | |||||
| Service utilisation: uptake of referral | 400 per 1000 | 407 per 1000 (296 to 527) | OR 1.03 (0.63 to 1.67 | 434 (1) | ⊕⊕⊝⊝ Low1 | |
| Service utilisation: uptake of surgery | 340 per 1000 | 364 per 1000 (257 to 487) | OR 1.11 (0.67 to 1.84 | 434 (1) | ⊕⊕⊝⊝ Low1 | |
| Cataract Surgical Coverage | Not reported | |||||
| Surgical outcome (visual acuity in the operated eye) | Not reported | |||||
| Adverse events | Not reported | |||||
| *In this study, the intervention group (n = 212) watched a five‐minute informational video on cataract and cataract surgery then received a five‐minute counselling session (based on a script) from a trained nurse in groups of two to three, with family members. The control group (n = 222) were given standard care: they were advised they had decreased vision due to cataract and it could be treated, without being shown the video or receiving counselling. **The assumed risk was the risk observed in the control group of this study. The corresponding risk (and its 95% confidence interval) is based on the assumed risk in the comparison group and the relative effect of the intervention (and its 95% CI). | ||||||
| GRADE Working Group grades of evidence | ||||||
| 1We downgraded by one level for imprecision (wide confidence intervals) and one level for indirectness (study was conducted in rural China and may not be applicable to other settings). | ||||||
| Surgery fee waiver with/without transport provision or reimbursement to improve access to cataract surgical services compared with standard care for cataract | ||||||
| Patient or population: people with vision impairment caused by cataract Settings: low‐ and middle‐income settings Intervention: financial incentives and/or reimbursement* Comparison: standard care | ||||||
| Outcomes | Illustrative comparative risks** (95% CI) | Relative effect | No of participants | Certainty of the evidence | Comments | |
| Assumed risk | Corresponding risk | |||||
| Standard care | Intervention to improve access to cataract surgical services | |||||
| Change in the prevalence of cataract blindness | Not reported | |||||
| Prevalence of visual impairment due to cataract | Not reported | |||||
| Service utilisation: uptake of referral | Not reported | |||||
| Service utilisation: uptake of surgery | 150 per 1000 | 291 per 1000 (171 to 497) | RR 1.94 (1.14 to 3.31) | 355 (1) | ⊕⊕⊝⊝ Low1 | |
| Cataract Surgical Coverage | Not reported | |||||
| Surgical outcome (visual acuity in the operated eye) | Not reported | |||||
| Adverse events | ||||||
| * In this study, there were three intervention arms and a comparator arm: we have combined the intervention arms to display the results as there were no differences between them.
**The assumed risk was the risk observed in the control group of this study. The corresponding risk (and its 95% confidence interval) is based on the assumed risk in the comparison group and the relative effect of the intervention (and its 95% CI). | ||||||
| GRADE Working Group grades of evidence | ||||||
| 1We downgraded by one level for imprecision (wide confidence intervals and statistical analysis not adjusted for cluster randomised design) and one level for indirectness (study was conducted in rural China and may not be applicable to other settings). | ||||||
| Category | Presenting distance visual acuity | |
| Worse than: | Equal to or better than: | |
| 0 Mild or no visual impairment | 6/18 | |
| 1 Moderate visual impairment | 6/18 | 6/60 |
| 2 Severe visual impairment | 6/60 | 3/60 |
| 3 Blindness | 3/60 | 1/60* |
| 4 Blindness | 1/60* | light perception |
| 5 Blindness | No light perception | |
| 9 | Undetermined or unspecified | |
| *or counts fingers (CF) at 1 metre | ||
| The term visual impairment comprises categories 1 to 5; blindness comprises categories 3 to 5 (Pascolini 2012). | ||
| Explanatory factors | In which subgroup is the effect hypothesised to be larger |
| Type of intervention | |
| Uni‐faceted versus multi‐faceted | It is hypothesised that multi‐faceted interventions will have a larger effect than uni‐faceted intentions (Chang 2008). |
| Targeted versus universal | It is hypothesised that targeted interventions will produce a larger effect for socially disadvantaged groups than universal interventions; universal interventions may benefit socially advantaged groups more than socially disadvantaged groups, and thereby increase inequity (Lorenc 2013). |
| Supply‐side versus demand‐side | Demand‐side interventions are unlikely to be effective if surgery is not accessible and affordable. Supply‐side interventions might not be effective if there are unaddressed problems with demand. |
| Population characteristics | |
| Gender/sex: | Women have more barriers and less access to cataract surgical services than men (Lewallen 2009). Lack of social support to seek care is a major barrier for women. It is hypothesised that interventions that aim to modify women’s ability to perceive, to seek or to reach care (Figure 1) will produce larger effects for women than men, while universal interventions may produce larger effects for men. |
| SES/education/occupation: | People with low SES/education have more barriers and less access to cataract surgical services than people with higher SES/education (Abubakar 2012; Jadoon 2007; Kuper 2008). It is hypothesised that interventions targeted to low‐SES people (especially in relation to ability to pay in Figure 1) would produce larger effects than for high‐SES people, while universal interventions may produce larger effects for high‐SES. |
| Place of residence: | As services tend to be located in urban areas, rural dwellers tend to have less access to cataract surgical services than urban dwellers (Abubakar 2012; Jadoon 2007). It is hypothesised that interventions that address barriers faced by rural dwellers (such as those relating to availability and accommodation/ability to reach in Figure 1) would produce larger effects for rural dwellers, while other types of interventions may not produce a difference between urban and rural dwellers. |
| SES: socioeconomic status | |
| Number of people | Odds ratio (95% CI) | Test for interaction (P value) | |
| Outcome: uptake of referral | |||
| Place of residence | |||
| < 1 hour from hospital | 225 | 0.86 (0.50 to 1.48) | 0.49 |
| ≥ 1 hour from hospital | 209 | 1.13 (0.65 to 1.95) | |
| Gender | |||
| Men | 185 | 0.77 (0.42 to 1.38) | 0.35 |
| Women | 249 | 1.11 (0.67 to 1.85) | |
| Education | |||
| Received some formal education | 196 | 1.40 (0.80 to 2.47) | 0.09 |
| Received no formal education | 238 | 0.71 (0.42 to 1.21) | |
| Socioeconomic status | |||
| Patient will self‐pay for surgery | 78 | 1.05 (0.42 to 2.62) | 0.81 |
| Patient will not self‐pay for surgery | 356 | 0.93 (0.61 to 1.42) | |
| Higher anticipated loss of income | 246 | 0.89 (0.54 to 1.48) | 0.63 |
| Lower anticipated loss of income | 167 | 1.10 (0.57 to 2.13) | |
| More floor space/resident | 222 | 0.78 (0.45 to 1.33) | 0.28 |
| Less floor space/resident | 212 | 1.19 (0.69 to 2.05) | |
| Social capital | |||
| Family member can accompany to hospital for surgery | 369 | 0.98 (0.65 to 1.49) | 0.66 |
| Family member can not accompany to hospital for surgery | 65 | 0.77 (0.29 to 2.09) | |
| Family member accompanied patient to screening | 188 | 0.95 (0.53 to 1.70) | 0.77 |
| Family member did not accompany patient to screening | 246 | 1.07 (0.63 to 1.82) | |
| Outcome: uptake of surgery | |||
| Place of residence | |||
| < 1 hour from hospital | 225 | 0.63 (0.36 to 1.13) | 0.10 |
| ≥ 1 hour from hospital | 209 | 1.26 (0.71 to 2.22) | |
| Gender | |||
| Men | 185 | 0.88 (0.48 to 1.64) | 0.94 |
| Women | 249 | 0.85 (0.50 to 1.45) | |
| Education | |||
| Received some formal education | 196 | 1.20 (0.67 to 2.15) | 0.17 |
| Received no formal education | 238 | 0.68 (0.39 to 1.19) | |
| Socioeconomic status | |||
| Patient will self‐pay for surgery | 78 | 0.98 (0.37 to 2.59) | 0.80 |
| Patient will not self‐pay for surgery | 356 | 0.85 (0.55 to 1.33) | |
| Higher anticipated loss of income | 246 | 0.85 (0.51 to 1.43) | 0.58 |
| Lower anticipated loss of income | 167 | 1.09 (0.54 to 2.23) | |
| More floor space/resident | 222 | 0.79 (0.44 to 1.40) | 0.57 |
| Less floor space/resident | 212 | 1.00 (0.57 to 1.75) | |
| Social capital | |||
| Family member can accompany to hospital for surgery | 369 | 0.88 (0.57 to 1.36) | 0.86 |
| Family member can not accompany to hospital for surgery | 65 | 0.80 (0.28 to 2.30) | |
| Family member accompanied patient to screening | 188 | 1.05 (0.58 to 1.88) | 0.64 |
| Family member did not accompany patient to screening | 246 | 0.86 (0.48 to 1.53) | |
| Effect measure: odds ratio; analysis model: fixed effects. | |||