Вмешательства для улучшения доступности хирургии катаракты и их влияние на равенство в странах с доходами ниже среднего уровня
Abstract
Background
Cataract is the leading cause of blindness in low‐ and middle‐income countries (LMICs), and the prevalence is inequitably distributed between and within countries. Interventions have been undertaken to improve cataract surgical services, however, the effectiveness of these interventions on promoting equity is not known.
Objectives
To assess the effects on equity of interventions to improve access to cataract services for populations with cataract blindness (and visual impairment) in LMICs.
Search methods
We searched the Cochrane Central Register of Controlled Trials (CENTRAL) (which contains the Cochrane Eyes and Vision Trials Register) (2017, Issue 3), MEDLINE Ovid (1946 to 12 April 2017), Embase Ovid (1980 to 12 April 2017), LILACS (Latin American and Caribbean Health Sciences Literature Database) (1982 to 12 April 2017), the ISRCTN registry (www.isrctn.com/editAdvancedSearch); searched 12 April 2017, ClinicalTrials.gov (www.clinicaltrials.gov); searched 12 April 2017 and the World Health Organization (WHO) International Clinical Trials Registry Platform (ICTRP) (www.who.int/ictrp/search/en); searched 12 April 2017. We did not use any date or language restrictions in the electronic searches for trials.
Selection criteria
We included studies that reported on strategies to improve access to cataract services in LMICs using the following study designs: randomised and quasi‐randomised controlled trials (RCTs), controlled before‐and‐after studies, and interrupted time series studies. Included studies were conducted in LMICs, and were targeted at disadvantaged populations, or disaggregated outcome data by 'PROGRESS‐Plus' factors (Place of residence; Race/ethnicity/ culture/ language; Occupation; Gender/sex; Religion; Education; Socio‐economic status; Social capital/networks. The 'Plus' component includes disability, sexual orientation and age).
Data collection and analysis
Two authors (JR and JP) independently selected studies, extracted data and assessed them for risk of bias. Meta‐analysis was not possible, so included studies were synthesised in table and text.
Main results
From a total of 2865 studies identified in the search, two met our eligibility criteria, both of which were cluster‐RCTs conducted in rural China. The way in which the trials were conducted means that the risk of bias is unclear. In both studies, villages were randomised to be either an intervention or control group. Adults identified with vision‐impairing cataract, following village‐based vision and eye health assessment, either received an intervention to increase uptake of cataract surgery (if their village was an intervention group), or to receive 'standard care' (if their village was a control group).
One study (n = 434), randomly allocated 26 villages or townships to the intervention, which involved watching an informational video and receiving counselling about cataract and cataract surgery, while the control group were advised that they had decreased vision due to cataract and it could be treated, without being shown the video or receiving counselling. There was low‐certainty evidence that providing information and counselling had no effect on uptake of referral to the hospital (OR 1.03, 95% CI 0.63 to 1.67, 1 RCT, 434 participants) and little or no effect on the uptake of surgery (OR 1.11, 95% CI 0.67 to 1.84, 1 RCT, 434 participants). We assessed the level of evidence to be of low‐certainty for both outcomes, due to indirectness of evidence and imprecision of results.
The other study (n = 355, 24 towns randomised) included three intervention arms: free surgery; free surgery plus reimbursement of transport costs; and free surgery plus free transport to and from the hospital. These were compared to the control group, which was reminded to use the "low‐cost" (˜USD 38) surgical service. There was low‐certainty evidence that surgical fee waiver with/without transport provision or reimbursement increased uptake of surgery (RR 1.94, 95% CI 1.14 to 3.31, 1 RCT, 355 participants). We assessed the level of evidence to be of low‐certainty due to indirectness of evidence and imprecision of results.
Neither of the studies reported our primary outcome of change in prevalence of cataract blindness, or other outcomes such as cataract surgical coverage, surgical outcome, or adverse effects. Neither study disaggregated outcomes by social subgroups to enable further assessment of equity effects. We sought data from both studies and obtained data from one; the information video and counselling intervention did not have a differential effect across the PROGRESS‐Plus categories with available data (place of residence, gender, education level, socioeconomic status and social capital).
Authors' conclusions
Current evidence on the effect on equity of interventions to improve access to cataract services in LMICs is limited. We identified only two studies, both conducted in rural China. Assessment of equity effects will be improved if future studies disaggregate outcomes by relevant social subgroups. To assist with assessing generalisability of findings to other settings, robust data on contextual factors are also needed.
PICO
Резюме на простом языке
Вмешательства для улучшения доступности хирургии катаракты и их влияние на равенство в странах с доходами ниже среднего уровня
Какова цель этого обзора?
Целью этого Кокрейновского обзора ‐ обнаружить, существуют ли способы сделать так, чтобы в странах с доходами ниже среднего уровня людям было проще получить хирургическое лечение катаракты и сделать в этих странах хирургию катаракты доступной справедливо (без неравенства).
Исследователи Кокрейн собрали и проанализировали все подходящие исследования для ответа на этот вопрос и обнаружили два исследования.
Ключевые сообщения
Обзор показывает, что предложение бесплатной хирургии может повысить возможности получения хирургического лечения в странах с доходами ниже среднего уровня. Нет доказательств того, что это может снизить уровень потери зрения из‐за катаракты в обществе, или что это помогает снизить неравенство (делает положение вещей более справедливым). Помощь с транспортом, дополнительная информация, консультации могут не улучшить возможности получения хирургии, опять же нет доказательств по уровням слепоты от катаракты и неравенства. Результаты были получены из двух небольших исследований, проведенных в сельской местности в Китае.
Что было изучено в этом обзоре?
По мере того, как люди становятся старше, хрусталик мутнеет, что ведет к снижению зрения и слепоте. Помутнение хрусталика известно как катаракта. Доктора могут убрать катаракту и заменить ее на искусственный хрусталик. Эта хирургия обычно успешна и возвращает зрение.
Хирургия катаракты распространена по миру несправедливо. В странах с доходами ниже среднего уровня много людей, у которых катаракта вызывает снижение зрения и слепоту, так как там сложнее получить хирургическое лечение катаракты. Когда у некоторых людей меньше возможностей получения хорошего лечения, такого как хирургия катаракты, ‐ это известно как неравенство. Также существует неравенство в странах с доходами ниже среднего уровня, при этом у бедных людей и женщин меньше шансов на проведение хирургического лечения катаракты.
При изучении этой проблемы, исследователи Кокрейн хотели узнать, существуют ли способы улучшения возможностей получения хирургического лечения катаракты в странах с доходами ниже среднего уровня. Они также хотели рассмотреть, уменьшает ли это неравенство и помогает каждому получить равные шансы на проведение хирургии катаракты. Они планировали рассмотреть множество аспектов, включающих соответствие требованиям, экономичность и доступность хирургии катаракты.
Каковы главные результаты этого обзора?
Исследователи Кокрейн нашли два подходящих исследования. Оба исследования проводились в Китае в сельской местности. В одном исследовании людям давали дополнительную информацию и консультации в сравнении с отсутствием дополнительной информации или консультаций. В другом исследовании оценивали проведение бесплатной хирургии катаракты и помощь с расходами на транспорт до больницы в сравнении с хирургией катаракты по низкой стоимости и отсутствием помощи с транспортом. Результаты были следующими.
Обеспечение информацией или консультирование могут не увеличивать число направленных на хирургию и получивших ее (доказательства низкой определённости).Предложение бесплатных операций по поводу катаракты может повысить доступность хирургии для людей (доказательства низкой определённости).
Не было данных о том, что происходит с показателями по распространенности катаракты в обществе.
Насколько актуален этот обзор?
Исследователи Кокрейн провели поиск работ, опубликованных по 12 апреля 2017.
Authors' conclusions
Summary of findings
| Information video and counselling to improve access to cataract surgical services compared with standard care for cataract | ||||||
| Patient or population: people with vision impairment caused by cataract Settings: low‐ and middle‐income settings Intervention: information video and counselling* Comparison: standard care | ||||||
| Outcomes | Illustrative comparative risks** (95% CI) | Relative effect | No of participants | Certainty of the evidence | Comments | |
| Assumed risk | Corresponding risk | |||||
| Standard care | Intervention to improve access to cataract surgical services | |||||
| Change in the prevalence of cataract blindness | Not reported | |||||
| Prevalence of visual impairment due to cataract | Not reported | |||||
| Service utilisation: uptake of referral | 400 per 1000 | 407 per 1000 (296 to 527) | OR 1.03 (0.63 to 1.67 | 434 (1) | ⊕⊕⊝⊝ Low1 | |
| Service utilisation: uptake of surgery | 340 per 1000 | 364 per 1000 (257 to 487) | OR 1.11 (0.67 to 1.84 | 434 (1) | ⊕⊕⊝⊝ Low1 | |
| Cataract Surgical Coverage | Not reported | |||||
| Surgical outcome (visual acuity in the operated eye) | Not reported | |||||
| Adverse events | Not reported | |||||
| *In this study, the intervention group (n = 212) watched a five‐minute informational video on cataract and cataract surgery then received a five‐minute counselling session (based on a script) from a trained nurse in groups of two to three, with family members. The control group (n = 222) were given standard care: they were advised they had decreased vision due to cataract and it could be treated, without being shown the video or receiving counselling. **The assumed risk was the risk observed in the control group of this study. The corresponding risk (and its 95% confidence interval) is based on the assumed risk in the comparison group and the relative effect of the intervention (and its 95% CI). | ||||||
| GRADE Working Group grades of evidence | ||||||
| 1We downgraded by one level for imprecision (wide confidence intervals) and one level for indirectness (study was conducted in rural China and may not be applicable to other settings). | ||||||
| Surgery fee waiver with/without transport provision or reimbursement to improve access to cataract surgical services compared with standard care for cataract | ||||||
| Patient or population: people with vision impairment caused by cataract Settings: low‐ and middle‐income settings Intervention: financial incentives and/or reimbursement* Comparison: standard care | ||||||
| Outcomes | Illustrative comparative risks** (95% CI) | Relative effect | No of participants | Certainty of the evidence | Comments | |
| Assumed risk | Corresponding risk | |||||
| Standard care | Intervention to improve access to cataract surgical services | |||||
| Change in the prevalence of cataract blindness | Not reported | |||||
| Prevalence of visual impairment due to cataract | Not reported | |||||
| Service utilisation: uptake of referral | Not reported | |||||
| Service utilisation: uptake of surgery | 150 per 1000 | 291 per 1000 (171 to 497) | RR 1.94 (1.14 to 3.31) | 355 (1) | ⊕⊕⊝⊝ Low1 | |
| Cataract Surgical Coverage | Not reported | |||||
| Surgical outcome (visual acuity in the operated eye) | Not reported | |||||
| Adverse events | ||||||
| * In this study, there were three intervention arms and a comparator arm: we have combined the intervention arms to display the results as there were no differences between them.
**The assumed risk was the risk observed in the control group of this study. The corresponding risk (and its 95% confidence interval) is based on the assumed risk in the comparison group and the relative effect of the intervention (and its 95% CI). | ||||||
| GRADE Working Group grades of evidence | ||||||
| 1We downgraded by one level for imprecision (wide confidence intervals and statistical analysis not adjusted for cluster randomised design) and one level for indirectness (study was conducted in rural China and may not be applicable to other settings). | ||||||
Background
In 2015 cataract was the leading cause of blindness in the world, and a major cause of moderate and severe visual impairment, affecting approximately 70 million people (Flaxman 2017). Due to population growth and increasing life expectancy, cataract blindness and visual impairment are expected to increase unless both coverage and quality of cataract services improve.
Description of the condition
'Cataract' is defined by the World Health Organization (WHO) as a clouding of the lens of the eye that prevents clear vision (WHO). Age‐related cataract occurs as a result of denaturation of lens proteins and is currently thought to be irreversible. These changes often occur in both eyes, although the effects can be asymmetric. Symptoms from cataracts include glare, blurred vision, progressive decrease in visual function and blindness.
Seven categories of visual impairment are outlined in The International Classification of Diseases (ICD)‐10; these are shown in Table 1 (WHO 2008). In this review 'visual impairment' is defined as presenting vision worse than 6/18 in the better eye (categories 1 to 5 in Table 1) and 'blindness' as presenting vision worse than 3/60 in the better eye (categories 3 to 5 in Table 1).
| Category | Presenting distance visual acuity | |
| Worse than: | Equal to or better than: | |
| 0 Mild or no visual impairment | 6/18 | |
| 1 Moderate visual impairment | 6/18 | 6/60 |
| 2 Severe visual impairment | 6/60 | 3/60 |
| 3 Blindness | 3/60 | 1/60* |
| 4 Blindness | 1/60* | light perception |
| 5 Blindness | No light perception | |
| 9 | Undetermined or unspecified | |
| *or counts fingers (CF) at 1 metre | ||
The term visual impairment comprises categories 1 to 5; blindness comprises categories 3 to 5 (Pascolini 2012).
Factors such as genetic predisposition, exposure to sunlight, smoking, diabetes, being female, and ethnicity may play a role in higher rates of cataract (West 2007). However, in low‐ and middle‐income countries (LMICs), high prevalence of cataract blindness may be due to the uptake of services and the quality of available services possibly more than biological factors (Dandona 2001). A systematic review of barriers to surgical care (for any medical condition) in LMICs that was published in 2011 included 52 studies, 28 (54%) of which were based on ophthalmology services (Grimes 2011). The key barriers the review identified were physical access (distance, poor roads, lack of transport), lack of resources and expertise, direct and indirect costs, and fear of surgery. In 2012, Blanchet and colleagues undertook a review of systematic reviews to inform universal coverage of cataract services and identified similar barriers to those listed above (Blanchet 2012).
Surgical removal of the opaque lens is the only treatment option currently available for cataract. An artificial intraocular lens (IOL) is usually implanted to replace the focusing power of the removed lens. There are four main forms of cataract extraction surgery: intracapsular (ICCE), extracapsular (ECCE), phacoemulsification (phaco) and manual small incision (MSICS). ICCE was used in high‐income countries in the 1960s and 1970s and was superseded by ECCE in the early 1980s, which in turn was replaced by phaco. ECCE (and MSICS) surgery became more common in LMICs once non‐commercial entities started to sell IOLs at a much lower price from the 1990s. In 1997, the WHO stated that ECCE with IOL was the surgery of choice in LMICs (WHO 1997), and this probably remains the most common procedure. Regardless of the type of surgical technique used, Cochrane Reviews have found surgery to be an effective treatment with good outcomes (Ang 2012; de Silva 2014; Riaz 2013).
Inequity of cataract blindness
'Health inequity' is defined as differences in health outcomes between population subgroups that are avoidable, unfair and unjust (Whitehead 1992). 'Health inequality' refers to measurable differences in health between individuals and groups (Hosseinpoor 2014). Health inequity cannot be objectively measured, as normative judgements of what makes a difference 'unfair' and 'unjust' are required (Braveman 2003), but we have used the term, 'equity' throughout this review, in keeping with guidance on equity‐focused systematic reviews (Welch 2013).
Cataract blindness is inequitably distributed between countries. The estimate of global age‐standardised adult (50 years and above) prevalence of cataract blindness in 2015 was 0.78% (80% uncertainty interval (UI) 0.21‐1.77), but this varies greatly in different regions of the world. It was lowest in high‐income countries of Asia Pacific (0.08%, 80% UI 0.03 to 0.19), Australasia (0.09%, 80% UI 0.02 to 0.24) and Western Europe (0.09%, 80% UI 0.03 to 0.20), and up to 30 times higher in West (2.35%, 80% UI 0.72 to 5.04) and East Sub‐Saharan Africa (1.97%, 80% UI 0.61 to 4.12) (Flaxman 2017). Inequity within countries is also apparent. Associations have been documented between higher prevalence of blindness (regardless of cause) and being female, living in a rural area, having low socioeconomic status, being less educated and belonging to an ethnic minority (Abubakar 2012; Dandona 2001; Gilbert 2008; Ramke 2017a; Ulldemolins 2012). In 2015 it was estimated that globally women were 1.21 times more likely (80% UI 1.17 to 1.25) to have cataract visual impairment compared to men (Flaxman 2017). Further, it appears that disadvantage accumulates, such that each additional social disadvantage an individual experiences (e.g. being a woman and living rurally and being illiterate) increases the likelihood of cataract blindness (Ramke 2017a).
Cataract surgery and a good outcome have not been available to everyone equally. A systematic review and meta‐analysis of 23 studies from LMICs found that men were 1.7 times more likely to have had cataract surgery than women, and estimated that severe visual impairment (less than 6/60 in the better eye) in LMICs could be reduced by 11% if women received cataract surgery as frequently as men (Lewallen 2009). A systematic review of cataract surgical outcomes in LMICs has not been undertaken, but when cataract surgical coverage (CSC) is combined with a good surgical outcome to measure effective CSC, analysis of surveys from 20 countries showed women tended to fare worse than men in terms of access and quality of cataract services (Ramke 2017b).
In this review we used the PROGRESS‐Plus acronym to consider possible socially‐stratifying factors for inequity in cataract blindness (Kavanagh 2008). The acronym represents Place of residence; Race/ethnicity/ culture/ language; Occupation; Gender/sex; Religion; Education; Socio‐economic status; Social capital/networks. The 'Plus' component includes disability, sexual orientation and age.
Description of the intervention
According to the WHO, treatment of cataract requires community‐based activities (identification of patients, escorting, follow‐up) as well as facility‐based activities (consultations and surgery). To be successful, interventions must attempt to overcome social barriers to improve access to services and to produce good outcomes (WHO 1997).
'Access' is defined as "the opportunity to reach and obtain appropriate health care in situations of perceived need for care" (Levesque 2013). It includes five stages: realisation of healthcare needs, seeking healthcare services, reaching healthcare resources, using healthcare services and being offered appropriate services (Levesque 2013). This definition of access allows consideration of supply‐ and demand‐side features, as well as process factors. The conceptual framework of access to health care proposed by Levesque and colleagues includes five dimensions of accessibility of services and five corresponding abilities of people to interact with these dimensions to generate access (Levesque 2013). These are shown in Figure 1 together with examples of interventions to improve access to cataract services relevant for this review.

Examples of interventions to improve access to cataract surgical services against Levesque and colleague’s1 conceptual framework of access to health care (Levesque 2013)
Measures and targets
While patient satisfaction, quality of life and economic rehabilitation are important outcomes of cataract interventions, the WHO defines outcome in terms of visual acuity, which is a narrower, but more direct measure. The definition includes assessment with full spectacle correction ("best‐corrected vision") or with available correction ("presenting vision"). A good outcome is defined as 6/18 or better (category 0 in Table 1), a borderline outcome as less than 6/18 to 6/60 (category 1 in Table 1), and a poor outcome as worse than 6/60 (categories 2 to 5 in Table 1) (WHO 1998). The WHO target is for at least 80% of postoperative eyes to have a good outcome with available correction, and for less than 5% to have a poor outcome. Studies from a range of LMICs consistently show that these targets are not being met, and that disadvantaged groups are faring worst. For example, a study in India found that women, and people with the lowest socioeconomic status, had worse outcomes than men or people of higher socioeconomic status respectively (Dandona 1999), and a study in Pakistan found that people living in poor households were less likely to have an IOL implanted after cataract removal (Gilbert 2008).
Vision 2020 and Universal eye health
Vision 2020 was a partnership between the WHO and the International Agency for the Prevention of Blindness (IAPB) that was launched in 1999 with a mission to eliminate the main causes of avoidable blindness by the year 2020. The initiative prioritised five conditions for intervention, one of which was cataract. One of the objectives of Vision 2020 was to facilitate the planning, development and implementation of national programmes in all countries, based on disease control, human resource development, infrastructure/technology and community participation, and considering aspects of equity and quality (Vision 2020: The Right to Sight Initiative). In 2013 the 66th World Health Assembly endorsed the current global eye health plan developed by WHO and IAPB, titled Universal eye health: a global action plan 2014‐2019 (WHA 2013). Universal eye health continues to prioritise cataract, and calls for the strengthening of evidence for planning effective services (WHO 2013).
The Vision 2020 and Universal eye health initiatives have generated a more targeted approach to blindness prevention and eye health. Programmatic and research tools have been developed and disseminated and a wide range of operational research has been undertaken. To date no systematic review of cataract interventions in LMICs has been undertaken.
How the intervention might work
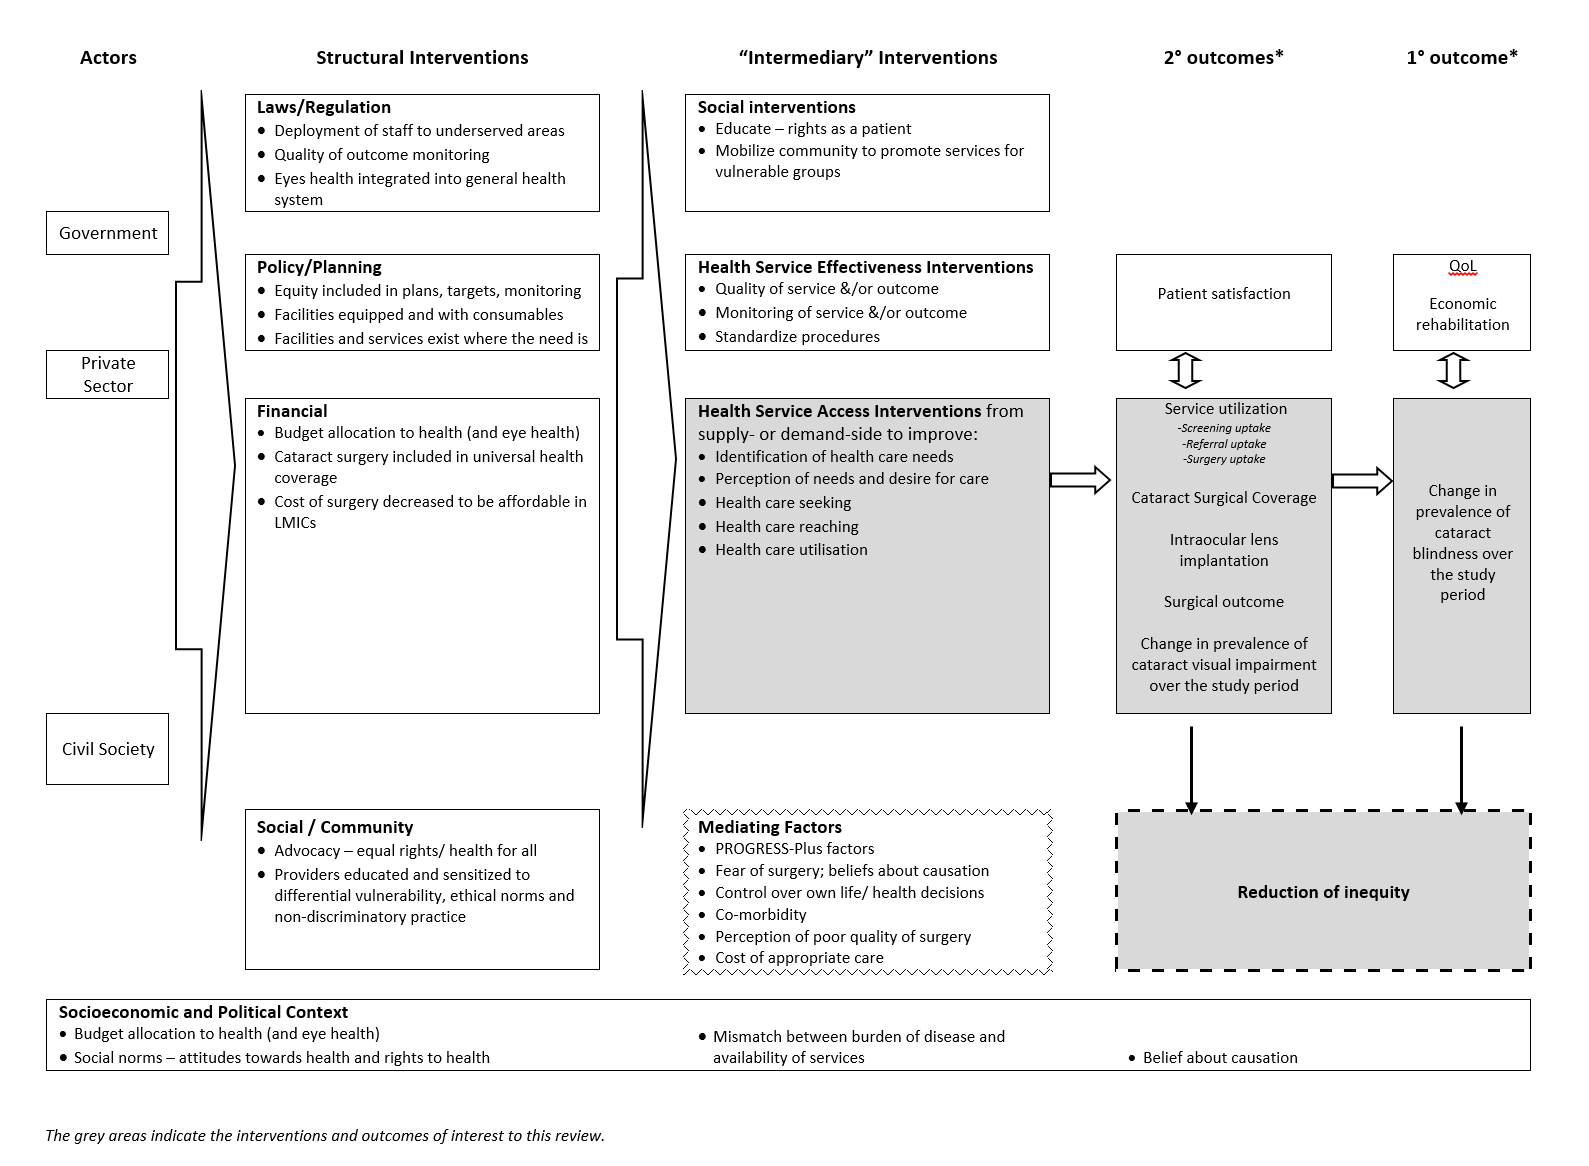
The logic model for the anticipated range of interventions that may reduce inequity in cataract blindness in LMICs is shown in Figure 2. This review focuses only on interventions to improve access to cataract services (shaded box in Figure 2 and outlined in Figure 1), according to Levesque and colleagues' definition of access (Levesque 2013). For the purposes of this review, we have drawn material from Vision 2020 (WHO 1997) and Universal eye health (WHO 2013) guiding documents as well as relevant evidence from systematic reviews (Blanchet 2012; Grimes 2011), the framework outlined by the Commission on Social Determinants of Health (CSDH) Priority Public Health Conditions Knowledge Network (PPCKN) (Blas 2010), and previous logic models for public health interventions in LMICs (Turley 2013).

Logic model
It is recognised that the interventions may be implemented on their own ('uni‐faceted') or in combination with other interventions ('multi‐faceted'). This in turn may lead to one or a combination of the outcomes. The context in which the intervention occurs (Lewallen 2010), as well as the fidelity (i.e. the extent to which the delivered intervention was consistent with the protocol) (Glasziou 2010), of the intervention will also affect the outcomes.
Why it is important to do this review
Cataract is the leading cause of blindness in LMICs. Accordingly, cataract is one of the priority conditions of the Vision 2020 and more recent Universal eye health initiatives. Within these initiatives, interventions have been undertaken to improve cataract surgical services in terms of increasing output, as well as improving quality and equity. However, in terms of equity, the effectiveness of these interventions is not known. The overview of systematic reviews conducted by Blanchet and colleagues identified a lack of cataract‐specific evidence and called for systematic reviews on access to cataract services (Blanchet 2012).
A previous Cochrane Review found that specialist outreach services improved access, outcomes and service use, but the majority of the included studies were from high‐income countries, and equity aspects were not explicitly assessed (Gruen 2003). Elsewhere there is evidence that some universal interventions (i.e. those designed for access by everyone in the same way) may generate inequities in certain areas of health care (Lorenc 2013).
This review provides an opportunity to assess the situation for interventions in cataract services. The findings of the review could inform future cataract interventions in LMICs, as well as contribute to the equity aims of the Vision 2020 and Universal eye health initiatives.
Objectives
To assess the effects on equity of interventions to improve access to cataract services for populations with cataract blindness (and visual impairment) in LMICs.
Methods
Criteria for considering studies for this review
Types of studies
We included studies that reported on strategies to improve access to cataract services using the following study designs: randomised and quasi‐randomised controlled trials (RCTs, including controlled clinical trials (CCTs), and cluster‐RCTs); controlled before‐and‐after studies (CBAs); and interrupted time series studies (ITSs) with a clearly defined point in time at which the intervention occurred and at least three data points before and after implementation of the intervention. Other study designs that met the EPOC (Cochrane Effective Practice and Organisation of Care) study design criteria, regardless of the name (e.g. stepped‐wedge design, controlled interrupted time series) were also eligible for inclusion (EPOC 2013). We excluded studies that focused solely on surgical techniques for cataract, as these are addressed in other Cochrane Reviews (Ang 2012; de Silva 2014; Riaz 2013).
Types of participants
Due to differences in cataract services between high‐income countries and LMICs, and the disproportionate burden of cataract vision impairment in LMICs, we only included studies performed in countries classified by the World Bank as LMICs (World Bank 2012).
Within LMICs, where universal interventions were implemented, data had to be stratified by one or more axes of social differentiation, as outlined by the PROGRESS‐Plus acronym (i.e. Place of residence; Race/ethnicity/culture/language; Occupation; Gender/sex; Religion; Education; Socio‐economic status; Social capital/networks; disability; sexual orientation; age) (Kavanagh 2008). For targeted interventions, the population had to be restricted to disadvantaged populations (e.g. women), or settings in which most people were disadvantaged (e.g. under‐serviced rural areas).
Types of interventions
Examples of interventions that may improve access to cataract services for those with vision impairment from cataract are given in the background section above. The examples outlined in Figure 1 and the framework outlined in Figure 2 were used as a guide to identify and categorise interventions into one of the following: realisation of healthcare needs, seeking healthcare services, reaching healthcare resources, using healthcare services and being offered appropriate services (Levesque 2013).
We included both uni‐faceted and multi‐faceted interventions, and both universal and targeted interventions (that is, those that focus on reaching a specific disadvantaged population). We compared these interventions with 'usual care'.
Types of outcome measures
Studies that measured any primary or secondary outcome were included. Data were extracted for any of the following outcomes, disaggregated by PROGRESS‐Plus groups if available.
(*Indicates a ‘main’ outcome)
Primary outcomes
-
Change in the prevalence of cataract blindness (as defined in Table 1) over the study period*
Secondary outcomes
-
Prevalence of cataract visual impairment (as defined in Table 1)
-
Service utilisation ‐ specifically uptake of:
-
screening
-
referral*
-
surgery*
-
-
Cataract Surgical Coverage (CSC)* (Limburg 1998)
-
Intraocular lens (IOL) implantation rate
-
Surgical outcome (visual acuity in the operated eye)*
-
Unintended outcomes/adverse events of the intervention*
-
Any measure of inequity, for example, concentration index, relative index of inequality
Search methods for identification of studies
Electronic searches
The Cochrane Eyes and Vision Information Specialist conducted systematic searches in the following databases for randomised controlled trials and controlled clinical trials. There were no language or publication year restrictions. The date of the search was 12 April 2017.
-
Cochrane Central Register of Controlled Trials (CENTRAL; 2017, Issue 3) (which contains the Cochrane Eyes and Vision Trials Register) in the Cochrane Library (searched 12 April 2017) (Appendix 1);
-
MEDLINE Ovid (1946 to 12 April 2017) (Appendix 2);
-
Embase Ovid (1980 to 12 April 2017) (Appendix 3);
-
LILACS (Latin American and Caribbean Health Science Information database (1982 to 12 April 2017) (Appendix 4);
-
ISRCTN registry (www.isrctn.com/editAdvancedSearch; searched 12 April 2017) (Appendix 5);
-
US National Institutes of Health Ongoing Trials Register ClinicalTrials.gov (www.clinicaltrials.gov; searched 12 April 2017) (Appendix 6);
-
World Health Organization (WHO) International Clinical Trials Registry Platform (ICTRP)(www.who.int/ictrp; searched 12 April 2017) (Appendix 7).
Searching other resources
We checked the references of included studies to identify any other potentially relevant reports. We did not handsearch conference proceedings for this review.
Data collection and analysis
Selection of studies
Two review authors (JR and JP) independently screened all titles and abstracts of papers identified as potentially relevant. Once potentially eligible papers were retrieved, the same two authors independently screened the full‐text copies against the inclusion criteria. We resolved any differences by discussion and by consulting a third author if necessary.
A PRISMA flow chart (Figure 3) summarises the selection process (Moher 2009).
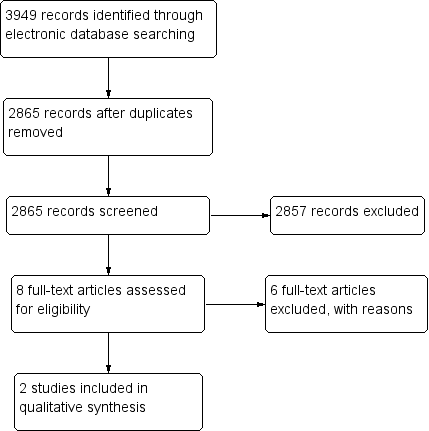
Study flow diagram
Studies that initially appeared to meet the inclusion criteria but were later excluded on the basis of full‐text review are listed in the 'Characteristics of excluded studies' table with reason(s) for exclusion. This includes all studies that did not report outcome data in a usable way, or only reported overall effects, without reporting according to any of the PROGRESS‐Plus categories or without focusing on a disadvantaged population.
We included studies that met the criteria regardless of the direction of effect, that is, we did not exclude studies if the intervention was more beneficial to socially advantaged groups (thereby increasing inequity).
Data extraction and management
Two review authors (JR and JP) independently extracted data from the full text of each eligible study. We resolved differences by discussion and by consulting a third author when necessary.
The data abstraction forms were a modification of Cochrane Public Health's data extraction and assessment template (Cochrane Public Health 2011). Three review authors piloted the form to assess its ability to capture study data and inform risk of bias and intervention fidelity assessments. The review authors followed the reporting guidelines set out in the Methodological Expectations of Cochrane Intervention Reviews (MECIR 2013), as well as the guidelines set out in the PRISMA equity extension (Welch 2012). This review also follows the 10 recommendations for conducting equity‐focused systematic reviews set out in Welch 2013.
We extracted measures relating to the process of implementing the intervention, as well as contextual information that may have an impact on the intervention. This information included factors such as duration, timing and frequency of the intervention, and the personnel delivering it. We also extracted available fidelity information (i.e. adherence to the study protocol, quality of delivery, participant responsiveness and modification) (Dane 1998; Glasziou 2010).
We extracted outcomes at the aggregate level, as well as disaggregated for any of the PROGRESS‐Plus groups.
Assessment of risk of bias in included studies
Two review authors (JR and JP) independently assessed the risk of bias of each study. We resolved any differences by discussion and by consulting a third review author when necessary. Only included studies were assessed and reported in the 'Risk of bias' tables.
For RCTs, we assessed risk of bias using Cochrane’s ‘Risk of bias’ tool as described in Chapter 8 (Higgins 2011a) and Chapter 16 (Higgins 2011b) of the Cochrane Handbook for Systematic Reviews of Interventions. We also assessed recruitment bias, baseline imbalance, and loss of clusters for cluster‐RCTs. For other study designs, we planned to use the risk of bias criteria suggested by EPOC (EPOC 2013).
We also made a summary assessment within and across studies, in accordance with the methods outlined in Chapter 8 of the Cochrane Handbook for Systematic Reviews of Interventions (Higgins 2011a).
Measures of treatment effect
We extracted both relative and absolute measures for all outcomes when available. We report findings from each study separately. We used the adjusted odds ratio (OR) and 95% confidence interval (CI) provided by one study, and calculated a risk ratio (RR) and 95% CI from data provided in the other study.
Had baseline results been available, we planned to report pre‐intervention and post‐intervention means or proportions for both study and control groups and (for any baseline imbalance) calculate unadjusted and adjusted absolute change from baseline with 95% confidence intervals.
If an ITS with an analysis issue had been included we would have used time series regression to reanalyse each comparison, and we would have converted results to risk differences in accordance with EPOC guidelines (EPOC 2013).
Unit of analysis issues
We identified two cluster‐randomised trials. One trial (Liu 2012) adjusted the data for the cluster design. The other trial (Zhang 2013) only provided data on participants and we used these data as reported.
Dealing with missing data
When a study reported PROGRESS categories at baseline but did not disaggregate outcomes by PROGRESS categories, we contacted investigators to request disaggregated data to enable assessment of equity effects.
Assessment of heterogeneity
We described the variability of interventions identified in our review using the framework in Figure 1. If meta‐analysis had been possible, we planned to examine heterogeneity through examination of the forest plot and calculation of the I2 statistic.
Assessment of reporting biases
If meta‐analysis had been possible, we intended to use a funnel plot to assess publication bias.
Data synthesis
We were unable to conduct meta‐analysis as we did not identify more than one study addressing the same PICOS question (i.e. homogeneous regarding populations, interventions, comparisons, outcomes, and study design). Since meta‐analysis was not possible, we synthesised the results for each intervention and population in tables and text.
We reported the overall number of studies included in the review and the main research questions addressed. We described study methods (including study design, duration of intervention, and follow‐up), participants (against PROGRESS‐Plus categories), intervention (e.g. intervention description and its components, means of delivery), outcomes (listing those reported and the time points measured), analytical methods used, generalisability and relevance of study results as well as other important study characteristics. We explored similarities and differences between included studies, taking context and fidelity into account. We categorised interventions into one of Levesque's five stages of access (Levesque 2013), which are listed in the logic model.
One of the included studies did not report a relative measure, so we calculated a risk ratio and 95% confidence interval. The study had three intervention arms and a comparator arm: we combined the intervention arms as there were no differences between them.
We used Review Manager 5 (RevMan 5) (RevMan 2014) for data synthesis and present the main results in a 'Summary of findings' table.
Two review authors (JR and JP) independently assessed the certainty of the evidence for each of our included outcomes using the GRADE (GRADEpro GDT 2015) quality criteria as set out in Chapter 12 of the Cochrane Handbook for Systematic Reviews of Interventions (Schünemann 2011) and then described the different parameters used (e.g. study limitations, imprecision etc). The two review authors resolved any differences by discussion and by consulting a third author when necessary.
We planned to summarise studies and findings against our logic model, but due to the small number of included studies, we did not do this (Figure 2).
Subgroup analysis
Investigation of heterogeneity
Insufficient data prevented the subgroup analysis we had planned to explore heterogeneity according to the type of intervention (uni‐faceted versus multi‐faceted; targeted versus universal; supply versus demand side; hypotheses are listed in Table 2).
| Explanatory factors | In which subgroup is the effect hypothesised to be larger |
| Type of intervention | |
| Uni‐faceted versus multi‐faceted | It is hypothesised that multi‐faceted interventions will have a larger effect than uni‐faceted intentions (Chang 2008). |
| Targeted versus universal | It is hypothesised that targeted interventions will produce a larger effect for socially disadvantaged groups than universal interventions; universal interventions may benefit socially advantaged groups more than socially disadvantaged groups, and thereby increase inequity (Lorenc 2013). |
| Supply‐side versus demand‐side | Demand‐side interventions are unlikely to be effective if surgery is not accessible and affordable. Supply‐side interventions might not be effective if there are unaddressed problems with demand. |
| Population characteristics | |
| Gender/sex: | Women have more barriers and less access to cataract surgical services than men (Lewallen 2009). Lack of social support to seek care is a major barrier for women. It is hypothesised that interventions that aim to modify women’s ability to perceive, to seek or to reach care (Figure 1) will produce larger effects for women than men, while universal interventions may produce larger effects for men. |
| SES/education/occupation: | People with low SES/education have more barriers and less access to cataract surgical services than people with higher SES/education (Abubakar 2012; Jadoon 2007; Kuper 2008). It is hypothesised that interventions targeted to low‐SES people (especially in relation to ability to pay in Figure 1) would produce larger effects than for high‐SES people, while universal interventions may produce larger effects for high‐SES. |
| Place of residence: | As services tend to be located in urban areas, rural dwellers tend to have less access to cataract surgical services than urban dwellers (Abubakar 2012; Jadoon 2007). It is hypothesised that interventions that address barriers faced by rural dwellers (such as those relating to availability and accommodation/ability to reach in Figure 1) would produce larger effects for rural dwellers, while other types of interventions may not produce a difference between urban and rural dwellers. |
SES: socioeconomic status
Investigation of impact on equity
We also used subgroup analysis to explore the impact of interventions on equity (Welch 2013), according to PROGRESS‐Plus categories. The hypotheses are listed in (Table 2). Data to conduct subgroup analysis by PROGRESS‐Plus categories were not included in the manuscripts of included studies, so we requested these data from investigators of both studies, only one of which could provide the data (for place of residence, gender, education, socioeconomic status, and social capital). When a subgroup difference was detected, we applied the seven ‘credibility criteria’ for subgroup analysis proposed by Oxman and Guyatt (Oxman 1992), as well as four additional criteria suggested by Sun and colleagues in 2010 (Sun 2010).
Sensitivity analysis
If sufficient data were available we planned to conduct sensitivity analysis to explore whether a difference in severity of vision impairment affected our findings (e.g. blind versus impaired vision). We also planned to assess the robustness of our results by undertaking sensitivity analysis based on risk of bias by removing those studies which were assessed to be of high risk of bias. Neither of these were possible.
Results
Description of studies
Results of the search
The electronic searches yielded a total of 3949 records (Figure 3). The Cochrane Information Specialist removed 1084 duplicate records and we screened the remaining 2865 reports. We rejected 2857 records after reading the abstracts and obtained the full‐text reports of eight references for further assessment. We identified two studies that met the inclusion criteria (Liu 2012; Zhang 2013) and excluded six reports of five studies see Characteristics of excluded studies for details. We did not identify any ongoing studies from our searches of the clinical trials registries.
Included studies
We included two studies, both of which were cluster‐RCTs (Liu 2012; Zhang 2013) involving rural populations in China. Details of these included studies are contained in the 'Characteristics of included studies' table.
The study by Liu 2012 took place in the Guandong Province of China between June and November 2010. The study by Zhang 2013 took place in Pucheng County, Shaanxi Province, China in November and December 2010.
From those attending screening sessions in the community, Liu 2012 recruited 434 adults and Zhang 2013 recruited 355 adults aged 50 years or older, who had visual impairment (categories 1 to 5 in Table 1) due to cataract in either eye.
In the study by Liu 2012, following screening, the intervention group (n = 212) watched a five‐minute informational video on cataract and cataract surgery then received a five‐minute counselling session (based on a script) from a trained nurse in groups of two to three, with family members. The control group (n = 222) were given standard care: they were advised they had decreased vision due to cataract and it could be treated, without being shown the video or receiving counselling.
The study by Zhang 2013 had three intervention arms and the control group. One person, who was a native Shaanxi speaker, provided the intervention information to all groups. The information was provided three times to each group: at the time of screening; then at two and five days after the screening. Group 1 (n = 86) was reminded to use the "low‐cost" (RMB 240, ˜USD 38) cataract surgery programme at the Pucheng County Hospital; Group 2 (n = 86) was offered free cataract surgery at Pucheng County Hospital; Group 3 (n = 90) was offered free surgery (same as Group 2) plus offered reimbursement of transport costs; Group 4 (n = 93) was offered free surgery (same as Group 2) plus offered free transport to and from the hospital.
Both studies measured uptake of cataract surgery as an outcome. Liu 2012 assessed uptake within 11 months of the intervention while Zhang 2013 assessed uptake within 3 months. In addition, Liu 2012 measured those who attended the hospital when referred from the screening site ("hospital follow‐up").
Both studies used demand‐side interventions (providing information and reducing costs). In rural populations, interventions were offered universally to those identified with vision‐impairing cataract. The intervention in Liu 2012 was uni‐faceted and aimed to improve the realisation of healthcare needs (Levesque 2013). Zhang 2013 offered a similar uni‐faceted intervention to Group 1, and multi‐faceted interventions to the remainder of the groups, addressing the access dimension of 'using health care services' (Groups 2, 3 and 4) and 'reaching healthcare resources' (Groups 3 and 4) (Levesque 2013). Neither study reported any of our fidelity items (adherence to the study protocol, quality of delivery, participant responsiveness and modification).
The study by Liu 2012 was funded by Helen Keller International, the Starr Foundation, the Swarthmore College Lang Center for Civic and Social Responsibility, and the Chinese Government’s Thousand Man Plan programme, while the study by Zhang 2013 was funded by Project Vision Charity Foundation, Hong Kong.
Excluded studies
We excluded six reports of five studies after obtaining the full text (Baruwa 2008; Finger 2012; Kandel 2010; Kuper 2010; Operations Research Group 1991) Further details can be found in the 'Characteristics of excluded studies' table.
Risk of bias in included studies
See the 'Risk of bias' tables, 'Risk of bias' figure (Figure 4); and summary table (Figure 5).

Risk of bias graph: review authors' judgements about each risk of bias item presented as percentages across all included studies

Risk of bias summary: review authors' judgements about each risk of bias item for each included study
Allocation
We rated both studies at low risk of bias for sequence generation, and allocation concealment. Allocation concealment was not clearly specified, however, the unit of allocation was by screening session (Liu 2012) or village (Zhang 2013), and allocation was performed at the start of the study, as recommended by the EPOC 'Risk of bias' tool (EPOC 2015).
Blinding
Neither study provided information on the likelihood of participants in different intervention groups sharing information with one another, so both studies were graded as unclear risk of performance bias.
The outcomes (whether participants presented for hospital follow‐up (Liu 2012), or accepted surgery (Liu 2012; Zhang 2013) were objective, and obtained from hospital records. As such, we graded both studies as having a low risk of detection bias.
Incomplete outcome data
Liu 2012 excluded participants enrolled at one of six hospitals that began the study, as the hospital failed to follow the intervention protocol. As both intervention and control clusters were lost, we assessed this loss of clusters as unclear rather than high risk of bias. All remaining participants, who did not have surgery or did not attend hospital follow‐up were counted as not attaining these outcomes, so there was no attrition from the remaining five centres.
All participants recruited into the study by Zhang 2013 were included in the outcome measurement of undergoing surgery (or not) during the follow‐up period. In addition, there appeared to be no loss of clusters, so this study was assessed at low risk of attrition bias.
Selective reporting
Neither of the two studies provided information on whether the reported methods used in the analysis of outcomes were prespecified or not; nor whether there was a difference between the outcomes measured and reported. Therefore we graded both studies as unclear for selective reporting.
Other potential sources of bias
We considered two additional sources of bias relevant to cluster RCTs. We assessed both studies at unclear risk of recruitment bias, as it was unclear whether individuals were recruited to the trial after the clusters were randomised.
We considered both studies at unclear risk of bias for baseline imbalance. In Liu 2012 the intervention group (75 years) were slightly younger than the control group (76 years), but the logistic regression analysis controls for age. In Zhang 2013 one of the intervention groups (Group 1) was closer to the Pucheng County Hospital compared to the other intervention groups: Group 1 was 15.59 km from the Hospital while the other groups were between 18.42 km and 18.92 km away.
Effects of interventions
See: Summary of findings for the main comparison Information video and counselling to improve access to cataract surgical services compared with standard care for cataract; Summary of findings 2 Surgery fee waiver with/without transport provision or reimbursement to improve access to cataract surgical services compared with standard care for cataract
Information video and counselling to improve access to cataract surgical services compared with standard care
See summary of findings Table for the main comparison.
Service utilisation: uptake of referral
In multivariable regression models (adjusted for age, sex, and significant predictors in univariate analysis), Liu 2012 found being a member of the intervention group was not a significant predictor of presenting to the hospital (OR 1.03, 95% CI 0.63 to 1.67).
Service utilisation: uptake of surgery
In multivariable regression models Liu 2012 found being a member of the intervention group was not a significant predictor of accepting surgery (OR 1.11, 95% CI 0.67 to 1.84).
Using the GRADE criteria, we assessed the certainty of the evidence for both of these outcomes to be low. We downgraded by one level for imprecision because the confidence intervals were wide, and we downgraded by one level for indirectness because the study was conducted in rural China and the results may not apply to other settings.
No data were available for our other outcomes: change in prevalence of cataract blindness; prevalence of visual impairment due to cataract; uptake of screening; cataract surgical coverage; IOL implantation rate, surgical outcome, adverse events, inequality measure.
Surgery fee waiver with/without transport provision or reimbursement to improve access to cataract surgical services compared with standard care
See summary of findings Table 2.
Service utilisation: uptake of surgery
Zhang 2013 reported uptake of surgery overall as well as across the four intervention arms:
-
Group 1: reminded to use the low‐cost (RMB 240) cataract surgery program at the Pucheng County Hospital = 15.1% (n = 13/86);
-
Group 2: reminded + offered free cataract surgery at Pucheng County Hospital = 29.1% (n = 25/86);
-
Group 3: same as Group 2 plus offered reimbursement of transport costs = 31.1% (n = 28/90); and
-
Group 4: same as Group 2 plus offered free transport to and from the hospital = 28.0% (n = 26/93).
When we combined the three intervention arms (Groups 2, 3 and 4; as there were no differences between them) and compared them to the control arm, uptake of surgery was higher among those who were offered free surgery with/without transport reimbursement or provision (RR 1.94, 95% CI 1.14 to 3.31).
Using the GRADE criteria, we assessed the certainty of the evidence for this outcome to be low. We downgraded by one level for imprecision because the confidence intervals were wide, and we downgraded by one level for indirectness because the study was conducted in rural China and the results may not apply to other settings. Note this analysis does not incorporate adjustment for the cluster design so the confidence intervals are narrower than they should be but this is taken into account in the GRADE assessment (downgrading for imprecision).
No data were available for our other outcomes: change in prevalence of cataract blindness; prevalence of visual impairment due to cataract; uptake of screening; uptake of referral; cataract surgical coverage; IOL implantation rate, surgical outcome, adverse events, inequality measure.
Equity
Neither study reported outcomes for intervention and control groups disaggregated by the PROGRESS‐Plus factors collected at baseline. We requested data from authors of both studies and these were provided by Liu 2012. We did eight subgroup analyses for each of the two outcomes reported by the authors (Table 3): place of residence, gender, education, socioeconomic status, and social capital. The only difference between subgroups was in uptake of referral between those who had and did not have some level of formal education, with the more highly educated group more likely to benefit from the intervention (Table 3). However, only a few subgroup criteria (Oxman 1992; Sun 2010) were met, suggesting considerable uncertainty about the plausibility of this subgroup difference. There was no other evidence of any difference in subgroups, and therefore equity impacts of video and counselling.
| Number of people | Odds ratio (95% CI) | Test for interaction (P value) | |
| Outcome: uptake of referral | |||
| Place of residence | |||
| < 1 hour from hospital | 225 | 0.86 (0.50 to 1.48) | 0.49 |
| ≥ 1 hour from hospital | 209 | 1.13 (0.65 to 1.95) | |
| Gender | |||
| Men | 185 | 0.77 (0.42 to 1.38) | 0.35 |
| Women | 249 | 1.11 (0.67 to 1.85) | |
| Education | |||
| Received some formal education | 196 | 1.40 (0.80 to 2.47) | 0.09 |
| Received no formal education | 238 | 0.71 (0.42 to 1.21) | |
| Socioeconomic status | |||
| Patient will self‐pay for surgery | 78 | 1.05 (0.42 to 2.62) | 0.81 |
| Patient will not self‐pay for surgery | 356 | 0.93 (0.61 to 1.42) | |
| Higher anticipated loss of income | 246 | 0.89 (0.54 to 1.48) | 0.63 |
| Lower anticipated loss of income | 167 | 1.10 (0.57 to 2.13) | |
| More floor space/resident | 222 | 0.78 (0.45 to 1.33) | 0.28 |
| Less floor space/resident | 212 | 1.19 (0.69 to 2.05) | |
| Social capital | |||
| Family member can accompany to hospital for surgery | 369 | 0.98 (0.65 to 1.49) | 0.66 |
| Family member can not accompany to hospital for surgery | 65 | 0.77 (0.29 to 2.09) | |
| Family member accompanied patient to screening | 188 | 0.95 (0.53 to 1.70) | 0.77 |
| Family member did not accompany patient to screening | 246 | 1.07 (0.63 to 1.82) | |
| Outcome: uptake of surgery | |||
| Place of residence | |||
| < 1 hour from hospital | 225 | 0.63 (0.36 to 1.13) | 0.10 |
| ≥ 1 hour from hospital | 209 | 1.26 (0.71 to 2.22) | |
| Gender | |||
| Men | 185 | 0.88 (0.48 to 1.64) | 0.94 |
| Women | 249 | 0.85 (0.50 to 1.45) | |
| Education | |||
| Received some formal education | 196 | 1.20 (0.67 to 2.15) | 0.17 |
| Received no formal education | 238 | 0.68 (0.39 to 1.19) | |
| Socioeconomic status | |||
| Patient will self‐pay for surgery | 78 | 0.98 (0.37 to 2.59) | 0.80 |
| Patient will not self‐pay for surgery | 356 | 0.85 (0.55 to 1.33) | |
| Higher anticipated loss of income | 246 | 0.85 (0.51 to 1.43) | 0.58 |
| Lower anticipated loss of income | 167 | 1.09 (0.54 to 2.23) | |
| More floor space/resident | 222 | 0.79 (0.44 to 1.40) | 0.57 |
| Less floor space/resident | 212 | 1.00 (0.57 to 1.75) | |
| Social capital | |||
| Family member can accompany to hospital for surgery | 369 | 0.88 (0.57 to 1.36) | 0.86 |
| Family member can not accompany to hospital for surgery | 65 | 0.80 (0.28 to 2.30) | |
| Family member accompanied patient to screening | 188 | 1.05 (0.58 to 1.88) | 0.64 |
| Family member did not accompany patient to screening | 246 | 0.86 (0.48 to 1.53) | |
Effect measure: odds ratio; analysis model: fixed effects.
Discussion
Summary of main results
We included two studies, both of which were cluster RCTs conducted in rural China. Both studies recruited adults with vision impairing cataract following vision and eye health assessment, and assessed whether their intervention(s) had an effect on uptake of cataract surgery. The study by Liu 2012 found that providing additional information and counselling about cataract and surgery had no effect on uptake of referral to the hospital (400 per 1000) or uptake of surgery (340 per 1000) compared to the control group (407 and 364 per 1000 respectively). The study by Zhang 2013 found that compared to receiving a reminder (uptake of surgery 15.1%), removing the surgical fee increased uptake of surgery (to 29.1%), but offering to reimburse transport costs (31.1%) or providing transport (28.0%) to the hospital had no additional effect on the uptake of surgery.
We could assess equity implications for five PROGRESS‐Plus categories in one study (Liu 2012). We found only one differential effect of the intervention among subgroups, but this may be due to the study not being powered to detect subgroup differences.
Overall completeness and applicability of evidence
There is currently a dearth of evidence on this topic, and an absolute lack of evidence for the majority of our pre‐specified outcomes (i.e. coverage and quality of services, prevalence of cataract blindness, inequality; Figure 2). We identified only two studies for inclusion in this review, both of which were undertaken in rural China, so we were unable to assess effects in different settings where health care systems are different. Data were only available to assess equity implications in one study and we found only one differential effect of the intervention among PROGRESS subgroups, which may be due to insufficient sample size. The participant group included in these studies (50 years or older) is the most relevant to include when exploring access to cataract services, as the majority of cataract blindness occurs in those aged over 50 years (Dineen 2006). Insufficient data were available to undertake all of our planned subgroup and sensitivity analyses, and we were also unable to summarise the evidence against the logic model.
The interventions assessed in the two studies represent only a small portion of those we pre‐specified (Figure 1). Both studies applied their interventions universally to rural populations, so there is no evidence on the effect of targeted interventions on access to services. One study (Liu 2012) implemented a uni‐faceted intervention, which had no effect; while the other study (Zhang 2013) applied both uni‐ and multi‐faceted interventions, which did not show increased effect with additional interventions. The interventions implemented in these studies included three of the five access dimensions: realisation of healthcare needs, reaching healthcare resources and using healthcare services (Levesque 2013). The findings from these studies may translate to other settings, but ideally context‐specific research would be undertaken in a broader range of settings to expand the evidence base.
Quality of the evidence
This review included two studies that we generally judged at low or unclear risk of bias.
Using GRADE criteria, we judged the certainty of the evidence to be low, reflecting that both studies contributing to the review were conducted in rural China, and measures of effect were imprecise.
Potential biases in the review process
We followed standard procedures expected by Cochrane, including double screening and data extraction to reduce the risk of reviewer bias. We searched without language restrictions, but only searched English language databases. As the review included fewer than 10 studies, we were unable to investigate publication bias using a funnel plot.
Agreements and disagreements with other studies or reviews
This question has not previously been addressed in a systematic review.

Examples of interventions to improve access to cataract surgical services against Levesque and colleague’s1 conceptual framework of access to health care (Levesque 2013)

Study flow diagram

Risk of bias graph: review authors' judgements about each risk of bias item presented as percentages across all included studies

Risk of bias summary: review authors' judgements about each risk of bias item for each included study
| Information video and counselling to improve access to cataract surgical services compared with standard care for cataract | ||||||
| Patient or population: people with vision impairment caused by cataract Settings: low‐ and middle‐income settings Intervention: information video and counselling* Comparison: standard care | ||||||
| Outcomes | Illustrative comparative risks** (95% CI) | Relative effect | No of participants | Certainty of the evidence | Comments | |
| Assumed risk | Corresponding risk | |||||
| Standard care | Intervention to improve access to cataract surgical services | |||||
| Change in the prevalence of cataract blindness | Not reported | |||||
| Prevalence of visual impairment due to cataract | Not reported | |||||
| Service utilisation: uptake of referral | 400 per 1000 | 407 per 1000 (296 to 527) | OR 1.03 (0.63 to 1.67 | 434 (1) | ⊕⊕⊝⊝ Low1 | |
| Service utilisation: uptake of surgery | 340 per 1000 | 364 per 1000 (257 to 487) | OR 1.11 (0.67 to 1.84 | 434 (1) | ⊕⊕⊝⊝ Low1 | |
| Cataract Surgical Coverage | Not reported | |||||
| Surgical outcome (visual acuity in the operated eye) | Not reported | |||||
| Adverse events | Not reported | |||||
| *In this study, the intervention group (n = 212) watched a five‐minute informational video on cataract and cataract surgery then received a five‐minute counselling session (based on a script) from a trained nurse in groups of two to three, with family members. The control group (n = 222) were given standard care: they were advised they had decreased vision due to cataract and it could be treated, without being shown the video or receiving counselling. **The assumed risk was the risk observed in the control group of this study. The corresponding risk (and its 95% confidence interval) is based on the assumed risk in the comparison group and the relative effect of the intervention (and its 95% CI). | ||||||
| GRADE Working Group grades of evidence | ||||||
| 1We downgraded by one level for imprecision (wide confidence intervals) and one level for indirectness (study was conducted in rural China and may not be applicable to other settings). | ||||||
| Surgery fee waiver with/without transport provision or reimbursement to improve access to cataract surgical services compared with standard care for cataract | ||||||
| Patient or population: people with vision impairment caused by cataract Settings: low‐ and middle‐income settings Intervention: financial incentives and/or reimbursement* Comparison: standard care | ||||||
| Outcomes | Illustrative comparative risks** (95% CI) | Relative effect | No of participants | Certainty of the evidence | Comments | |
| Assumed risk | Corresponding risk | |||||
| Standard care | Intervention to improve access to cataract surgical services | |||||
| Change in the prevalence of cataract blindness | Not reported | |||||
| Prevalence of visual impairment due to cataract | Not reported | |||||
| Service utilisation: uptake of referral | Not reported | |||||
| Service utilisation: uptake of surgery | 150 per 1000 | 291 per 1000 (171 to 497) | RR 1.94 (1.14 to 3.31) | 355 (1) | ⊕⊕⊝⊝ Low1 | |
| Cataract Surgical Coverage | Not reported | |||||
| Surgical outcome (visual acuity in the operated eye) | Not reported | |||||
| Adverse events | ||||||
| * In this study, there were three intervention arms and a comparator arm: we have combined the intervention arms to display the results as there were no differences between them.
**The assumed risk was the risk observed in the control group of this study. The corresponding risk (and its 95% confidence interval) is based on the assumed risk in the comparison group and the relative effect of the intervention (and its 95% CI). | ||||||
| GRADE Working Group grades of evidence | ||||||
| 1We downgraded by one level for imprecision (wide confidence intervals and statistical analysis not adjusted for cluster randomised design) and one level for indirectness (study was conducted in rural China and may not be applicable to other settings). | ||||||
| Category | Presenting distance visual acuity | |
| Worse than: | Equal to or better than: | |
| 0 Mild or no visual impairment | 6/18 | |
| 1 Moderate visual impairment | 6/18 | 6/60 |
| 2 Severe visual impairment | 6/60 | 3/60 |
| 3 Blindness | 3/60 | 1/60* |
| 4 Blindness | 1/60* | light perception |
| 5 Blindness | No light perception | |
| 9 | Undetermined or unspecified | |
| *or counts fingers (CF) at 1 metre | ||
| The term visual impairment comprises categories 1 to 5; blindness comprises categories 3 to 5 (Pascolini 2012). | ||
| Explanatory factors | In which subgroup is the effect hypothesised to be larger |
| Type of intervention | |
| Uni‐faceted versus multi‐faceted | It is hypothesised that multi‐faceted interventions will have a larger effect than uni‐faceted intentions (Chang 2008). |
| Targeted versus universal | It is hypothesised that targeted interventions will produce a larger effect for socially disadvantaged groups than universal interventions; universal interventions may benefit socially advantaged groups more than socially disadvantaged groups, and thereby increase inequity (Lorenc 2013). |
| Supply‐side versus demand‐side | Demand‐side interventions are unlikely to be effective if surgery is not accessible and affordable. Supply‐side interventions might not be effective if there are unaddressed problems with demand. |
| Population characteristics | |
| Gender/sex: | Women have more barriers and less access to cataract surgical services than men (Lewallen 2009). Lack of social support to seek care is a major barrier for women. It is hypothesised that interventions that aim to modify women’s ability to perceive, to seek or to reach care (Figure 1) will produce larger effects for women than men, while universal interventions may produce larger effects for men. |
| SES/education/occupation: | People with low SES/education have more barriers and less access to cataract surgical services than people with higher SES/education (Abubakar 2012; Jadoon 2007; Kuper 2008). It is hypothesised that interventions targeted to low‐SES people (especially in relation to ability to pay in Figure 1) would produce larger effects than for high‐SES people, while universal interventions may produce larger effects for high‐SES. |
| Place of residence: | As services tend to be located in urban areas, rural dwellers tend to have less access to cataract surgical services than urban dwellers (Abubakar 2012; Jadoon 2007). It is hypothesised that interventions that address barriers faced by rural dwellers (such as those relating to availability and accommodation/ability to reach in Figure 1) would produce larger effects for rural dwellers, while other types of interventions may not produce a difference between urban and rural dwellers. |
| SES: socioeconomic status | |
| Number of people | Odds ratio (95% CI) | Test for interaction (P value) | |
| Outcome: uptake of referral | |||
| Place of residence | |||
| < 1 hour from hospital | 225 | 0.86 (0.50 to 1.48) | 0.49 |
| ≥ 1 hour from hospital | 209 | 1.13 (0.65 to 1.95) | |
| Gender | |||
| Men | 185 | 0.77 (0.42 to 1.38) | 0.35 |
| Women | 249 | 1.11 (0.67 to 1.85) | |
| Education | |||
| Received some formal education | 196 | 1.40 (0.80 to 2.47) | 0.09 |
| Received no formal education | 238 | 0.71 (0.42 to 1.21) | |
| Socioeconomic status | |||
| Patient will self‐pay for surgery | 78 | 1.05 (0.42 to 2.62) | 0.81 |
| Patient will not self‐pay for surgery | 356 | 0.93 (0.61 to 1.42) | |
| Higher anticipated loss of income | 246 | 0.89 (0.54 to 1.48) | 0.63 |
| Lower anticipated loss of income | 167 | 1.10 (0.57 to 2.13) | |
| More floor space/resident | 222 | 0.78 (0.45 to 1.33) | 0.28 |
| Less floor space/resident | 212 | 1.19 (0.69 to 2.05) | |
| Social capital | |||
| Family member can accompany to hospital for surgery | 369 | 0.98 (0.65 to 1.49) | 0.66 |
| Family member can not accompany to hospital for surgery | 65 | 0.77 (0.29 to 2.09) | |
| Family member accompanied patient to screening | 188 | 0.95 (0.53 to 1.70) | 0.77 |
| Family member did not accompany patient to screening | 246 | 1.07 (0.63 to 1.82) | |
| Outcome: uptake of surgery | |||
| Place of residence | |||
| < 1 hour from hospital | 225 | 0.63 (0.36 to 1.13) | 0.10 |
| ≥ 1 hour from hospital | 209 | 1.26 (0.71 to 2.22) | |
| Gender | |||
| Men | 185 | 0.88 (0.48 to 1.64) | 0.94 |
| Women | 249 | 0.85 (0.50 to 1.45) | |
| Education | |||
| Received some formal education | 196 | 1.20 (0.67 to 2.15) | 0.17 |
| Received no formal education | 238 | 0.68 (0.39 to 1.19) | |
| Socioeconomic status | |||
| Patient will self‐pay for surgery | 78 | 0.98 (0.37 to 2.59) | 0.80 |
| Patient will not self‐pay for surgery | 356 | 0.85 (0.55 to 1.33) | |
| Higher anticipated loss of income | 246 | 0.85 (0.51 to 1.43) | 0.58 |
| Lower anticipated loss of income | 167 | 1.09 (0.54 to 2.23) | |
| More floor space/resident | 222 | 0.79 (0.44 to 1.40) | 0.57 |
| Less floor space/resident | 212 | 1.00 (0.57 to 1.75) | |
| Social capital | |||
| Family member can accompany to hospital for surgery | 369 | 0.88 (0.57 to 1.36) | 0.86 |
| Family member can not accompany to hospital for surgery | 65 | 0.80 (0.28 to 2.30) | |
| Family member accompanied patient to screening | 188 | 1.05 (0.58 to 1.88) | 0.64 |
| Family member did not accompany patient to screening | 246 | 0.86 (0.48 to 1.53) | |
| Effect measure: odds ratio; analysis model: fixed effects. | |||