Estrategias de transfusión de glóbulos rojos restrictivas versus liberales para los pacientes con neoplasias hematológicas malignas tratados con radioterapia o quimioterapia intensiva, o ambas, con o sin apoyo de células madre hematopoyéticas
Información
- DOI:
- https://doi.org/10.1002/14651858.CD011305.pub2Copiar DOI

- Base de datos:
-
- Cochrane Database of Systematic Reviews
- Versión publicada:
-
- 27 enero 2017see what's new
- Tipo:
-
- Intervention
- Etapa:
-
- Review
- Grupo Editorial Cochrane:
-
Grupo Cochrane de Hematología
- Copyright:
-
- Copyright © 2017 The Cochrane Collaboration. Published by John Wiley & Sons, Ltd.
Cifras del artículo
Altmetric:
Citado por:
Autores
Contributions of authors
Lise Estcourt: protocol development, searching, selection of studies, eligibility and quality assessment, data extraction and analysis, and content expert.
Reem Malouf: searching, selection of studies, eligibility and quality assessment, data extraction and analysis, and drafting.
Marialena Trivella: protocol development and statistical expert.
Dean Fergusson: a content and methodological expert for this review and contributed to the preparation of the protocol and the proposed analysis.
Sally Hopewell: protocol development and methodological expert.
Mike Murphy: protocol development and content expert
Sources of support
Internal sources
-
NHS Blood and Transplant, Research and Development, UK.
External sources
-
No sources of support supplied
Declarations of interest
Lise Estcourt is partly funded by NIHR Cochrane Programme Grant ‐ Safe and Appropriate Use of Blood Components. Award of this national government grant by NIHR does not lead to a conflict of interest.
Reem Malouf is partly funded by NIHR Cochrane Programme Grant ‐ Safe and Appropriate Use of Blood Components. Award of this national government grant by NIHR does not lead to a conflict of interest.
Marialena Trivella is partly funded by NIHR Cochrane Programme Grant ‐ Safe and Appropriate Use of Blood Components. Award of this national government grant by NIHR does not lead to a conflict of interest.
Sally Hopewell is partly funded by NIHR Cochrane Programme Grant ‐ Safe and Appropriate Use of Blood Components. Award of this national government grant by NIHR does not lead to a conflict of interest.
Dean A Fergusson: None known
Mike Murphy: None known.
Acknowledgements
We thank the National Institute of Health Research (NIHR). This review was part of a series of reviews that have been funded by the NIHR Cochrane Programme Grant ‐ Safe and Appropriate Use of Blood Components. This research was also supported by the National Institute for Health Research (NIHR) Oxford Biomedical Research Centre Programme. The views expressed were those of the authors and not necessarily those of the NHS, the NIHR or the Department of Health (DoH).
We thank the editorial base of the Cochrane Haematological Malignancies Review Group.
We thank the authors of the protocol: Alan Tinmouth, Susan Brunskill, Caroline Butler and Jason Tay.
We thank Caroline Butler and Jason Tay for assisting in screening of the search results.
We also thank David Burke for help in screening of studies for inclusion in the review.
Version history
| Published | Title | Stage | Authors | Version |
| 2017 Jan 27 | Restrictive versus liberal red blood cell transfusion strategies for people with haematological malignancies treated with intensive chemotherapy or radiotherapy, or both, with or without haematopoietic stem cell support | Review | Lise J Estcourt, Reem Malouf, Marialena Trivella, Dean A Fergusson, Sally Hopewell, Michael F Murphy | |
| 2014 Sep 30 | Restrictive versus liberal red blood cell transfusion strategies for patients with haematological malignancies treated with intensive chemotherapy or radiotherapy, or both, with or without haematopoietic stem cell support | Protocol | Caroline Butler, Jason Tay, Carolyn Doree, Susan J Brunskill, Marialena Trivella, Dean A Fergusson, Alan Tinmouth, Michael F Murphy | |
Differences between protocol and review
Aspects listed in the review protocol (Butler 2014) that were not implemented due to lack of data.
Publication bias: We did not perform a formal assessment of potential publication bias (small‐trial bias) because we included fewer than 10 trials within this review (Sterne 2011). With only a few studies were included this was not applicable.
Review outcome and reporting results: We performed meta‐analyses when appropriate. However, due to the small number of studies included in this review and the heterogeneity across these studies this was not always possible. We therefore, summarised and discussed results.
Subgroup analyses: We could not perform any of the subgroup analyses that we initially planned, this was because of absence of data and ultimately we were only able to conduct one meta‐analysis involving the three included randomised controlled trials (RCTs).
Meta‐regression: This was not possible as this was advised with a subgroup that contained more than 10 studies (Deeks 2011)
Sensistivity analyses: This was not possible as we were only able to combine relevant data extracted from the three included studies in one meta‐analysis.
Summary of findings: We listed the most important clinical outcomes for the comparison of the two transfusion methods in the review protocol. However, the hospital rate admission outcome was not reported in any of the included studies.
Keywords
MeSH
Medical Subject Headings (MeSH) Keywords
- Acute Disease;
- Anemia [blood, etiology, *therapy];
- Erythrocyte Transfusion [adverse effects, *methods];
- Hematologic Neoplasms [blood, *drug therapy, *radiotherapy];
- Hematopoietic Stem Cell Transplantation;
- Hemoglobin A [analysis];
- Leukemia [blood, drug therapy, radiotherapy];
- Prospective Studies;
- Quality of Life;
- Randomized Controlled Trials as Topic;
Medical Subject Headings Check Words
Adult; Child; Humans;
PICO
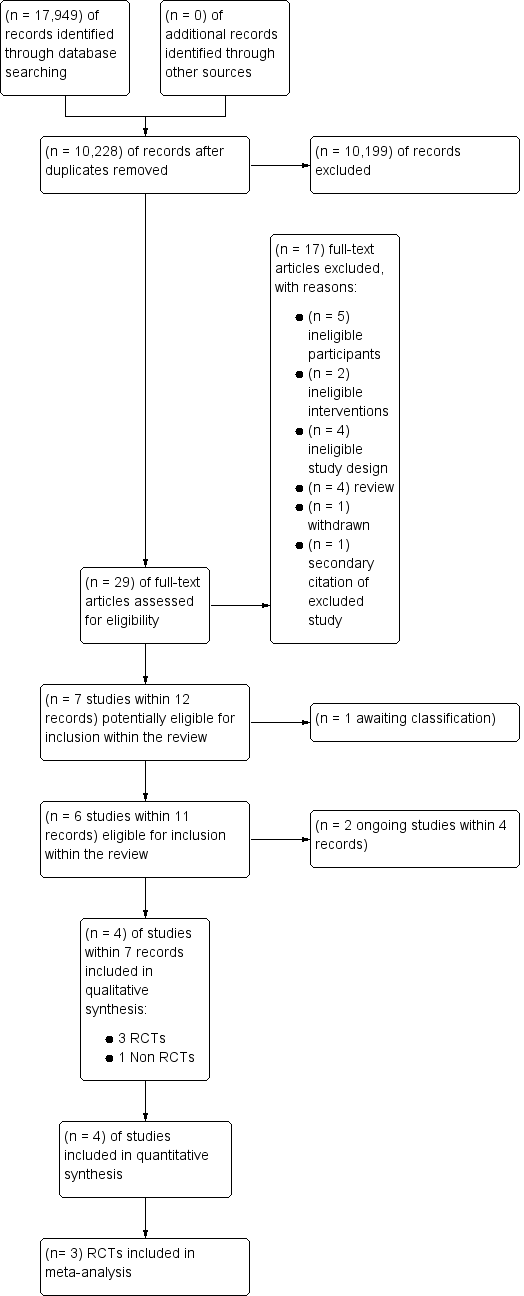
Study flow diagram for study selection
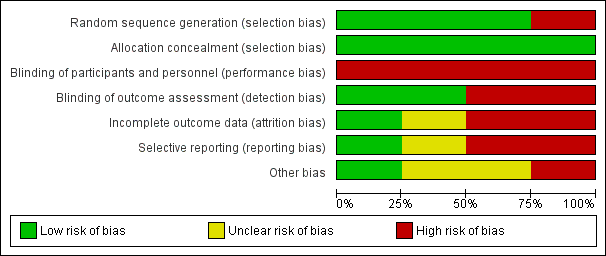
Risk of bias graph: review authors' judgements about each risk of bias item presented as percentages across all included studies.
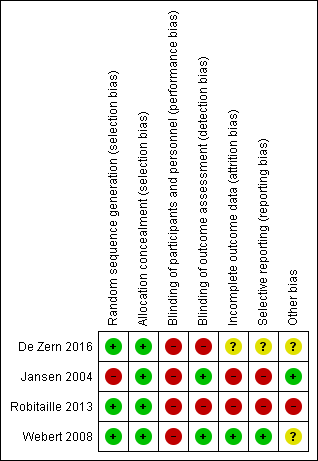
Risk of bias summary: review authors' judgements about each risk of bias item for each included study.
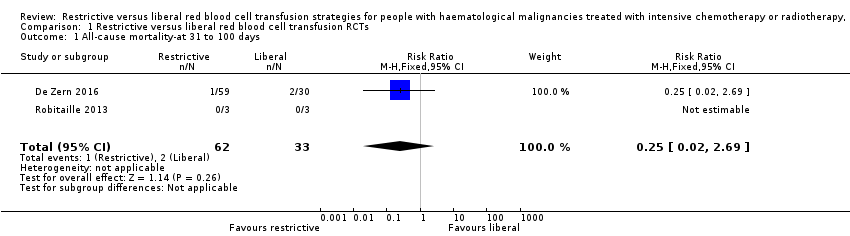
Comparison 1 Restrictive versus liberal red blood cell transfusion RCTs, Outcome 1 All‐cause mortality‐at 31 to 100 days.

Comparison 1 Restrictive versus liberal red blood cell transfusion RCTs, Outcome 2 Mortality due to chemotherapy.

Comparison 1 Restrictive versus liberal red blood cell transfusion RCTs, Outcome 3 Number of participants with any bleeding.

Comparison 1 Restrictive versus liberal red blood cell transfusion RCTs, Outcome 4 Number of participants with clinically significant bleeding.
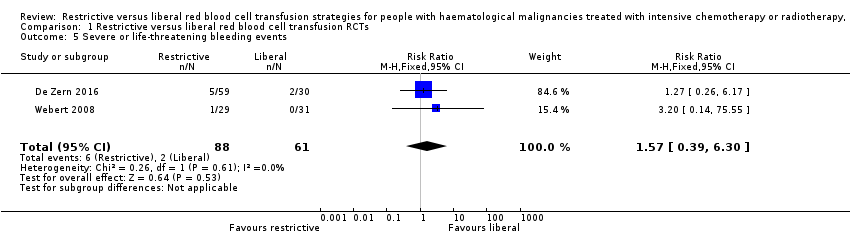
Comparison 1 Restrictive versus liberal red blood cell transfusion RCTs, Outcome 5 Severe or life‐threatening bleeding events.
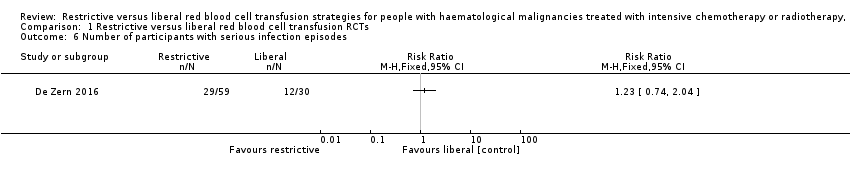
Comparison 1 Restrictive versus liberal red blood cell transfusion RCTs, Outcome 6 Number of participants with serious infection episodes.
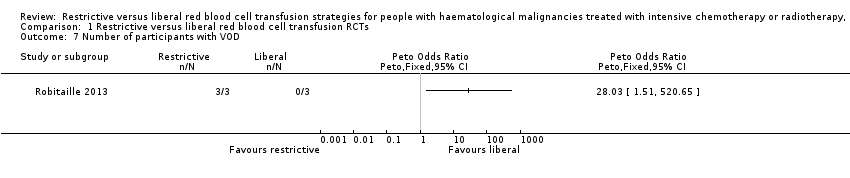
Comparison 1 Restrictive versus liberal red blood cell transfusion RCTs, Outcome 7 Number of participants with VOD.
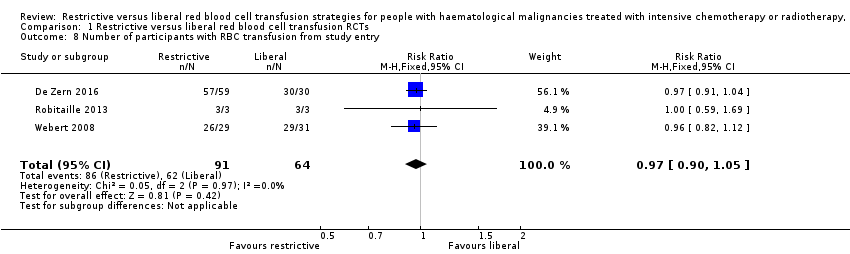
Comparison 1 Restrictive versus liberal red blood cell transfusion RCTs, Outcome 8 Number of participants with RBC transfusion from study entry.

Comparison 1 Restrictive versus liberal red blood cell transfusion RCTs, Outcome 9 Number of participants with RBC Transfusion after reaching Hb >80 g/L for restrictive & Hb > 120 g/L for liberal.
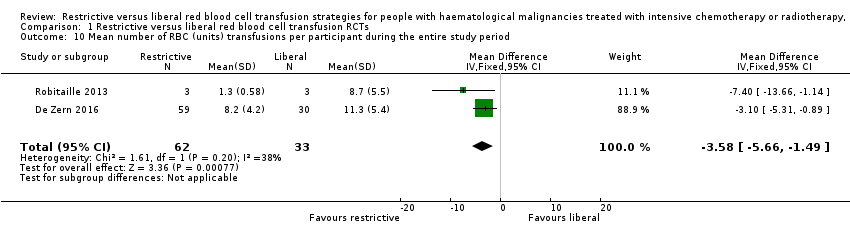
Comparison 1 Restrictive versus liberal red blood cell transfusion RCTs, Outcome 10 Mean number of RBC (units) transfusions per participant during the entire study period.
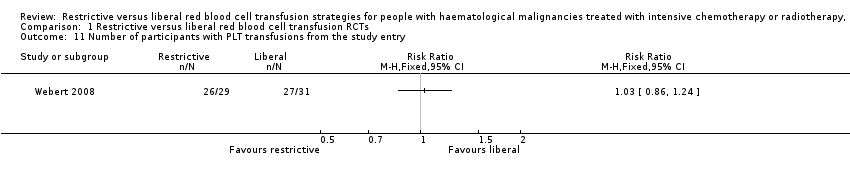
Comparison 1 Restrictive versus liberal red blood cell transfusion RCTs, Outcome 11 Number of participants with PLT transfusions from the study entry.
| Restrictive compared with liberal for people with haematological malignancies treated with intensive chemotherapy or radiotherapy, or both, with or without haematopoietic stem cell support | ||||||
| Patient or population: people with haematological malignancies treated with intensive chemotherapy or radiotherapy, or both, with or without haematopoietic stem cell support | ||||||
| Outcomes | Anticipated absolute effects* (95% CI) | Relative effect | No of Participants | Quality of the evidence | Comments | |
| Risk with liberal red blood cell transfusion RCTs | Risk with Restrictive | |||||
| All‐cause mortality at 31 to 100 days | Study population 61 per 1000 | 15 per 1000 (1 to 163) | RR 0.25 (0.02 to 2.69) | 95 (2 RCTs) | ⊕⊕⊝⊝ LOW1 | |
| Quality of life | Liberal group: median 4.5 (IQR: 3.6 to 5) Restrictive: median 4.8 (IQR: 4 to 5.2)a | 89 (1 RCT) | ⊕⊕⊝⊝ VERY LOW2,3,4 | |||
| Number of participants with any bleeding | Study population 639 per 1,000 | 595 per 1000 | RR 0.93 | 149 | ⊕⊕⊝⊝ | |
| Number of participants with clinically significant bleeding | Study population 443 per 1,000 | 456 per 1000 | RR 1.03 | 149 | ⊕⊕⊝⊝ | |
| Serious infections | Study population 400 per 1,000 | 492 per 1000 (296 to 816) | RR 1.23 | 89 (1 RCT) | ⊕⊝⊝⊝ VERY LOW2,3,4 | |
| Length of hospital admission (days) | Liberal: median 36 days (IQR: 29.2 to 44) Restrictive: median: 35.5 days (IQR: 31.2 to 43.8) | 89 (1 RCT) | ⊕⊕⊝⊝ LOW2,3 | |||
| Hospital readmission rate ‐ not reported | ‐ | ‐ | ‐ | ‐ | ‐ | |
| *The risk in the intervention group (and its 95% confidence interval) is based on the assumed risk in the comparison group and the relative effect of the intervention (and its 95% CI). | ||||||
| GRADE Working Group grades of evidence | ||||||
| 1The level of evidence was downgraded by 2 due to imprecision. aThis is a ten‐point scale with a score of zero indicating no fatigue and a score of ten indicating the worst possible fatigue. The median fatigue scare was similar for both groups; P = 0.53. Interquartile range: IQR | ||||||
| Restrictive compared with liberal for people with haematological malignancies treated with intensive chemotherapy or radiotherapy, or both, with or without haematopoietic stem cell support | ||||||
| Patient or population: people with haematological malignancies treated with intensive chemotherapy or radiotherapy, or both, with or without haematopoietic stem cell support | ||||||
| Outcomes | Anticipated absolute effects* (95% CI) | Relative effect | No of Participants | Quality of the evidence | Comments | |
| Risk with liberal red blood cell transfusion RCTs | Risk with Restrictive | |||||
| All‐cause mortality at 31 to 100 days | Liberal: 1 death (46 participants) Restrictive: 1 death (38 participants) | 84 | ⊕⊝⊝⊝ | Mean 31 days follow‐up | ||
| Quality of life ‐ not reported | ‐ | ‐ | ‐ | ‐ | ||
| Number of participants with any bleeding ‐ not reported | ‐ | ‐ | ‐ | ‐ | ||
| Number of participants with clinically significant bleeding | Liberal: 8 (46 participants) Restrictive: 3 (38 participants) | 84 | ⊕⊝⊝⊝ | The study authors reported that there was no significant difference between the two groups. | ||
| Serious infections ‐ not reported | ‐ | ‐ | ‐ | ‐ | ||
| Length of hospital admission ‐ not reported | ‐ | ‐ | ‐ | ‐ | ||
| Hospital readmission rate ‐ not reported | ‐ | ‐ | ‐ | ‐ | ||
| *The risk in the intervention group (and its 95% confidence interval) is based on the assumed risk in the comparison group and the relative effect of the intervention (and its 95% CI). | ||||||
| GRADE Working Group grades of evidence | ||||||
| 1The level of evidence was downgraded by 1 due to imprecision. | ||||||
| Transfusion Risk | Frequency in the UK (units transfused) ( Bolton‐Maggs 2014) | Frequency in low income countries ( WHO 2015 ) |
| ABO incompatible red cell transfusion | 3.7 in 1 million (10 cases per 2663488 transfusions) | unknown |
| Transfusion‐related acute lung injury | 0.4 in 1 million (10 cases per 2663488 transfusions) | unknown |
| Transfusion associated circulatory overload | 34.1 in 1 million (91 cases per 2663488 transfusions) | unknown |
| Transfusion transmitted infection | Frequency in high income countries | Frequency in low income countries |
| HIV | 2 in 100,000 (IQR 0.4 in 100,000 to 20 in 100,000) | 850 in 100,000 (IQR 480 in 100,000 to 2000 in 100,000) |
| HBV | 20 in 100,000 (IQR 8 in 100,000 to 24 in 100,000) | 3590 in 100,000 (IQR 2010 in 100,000 to 6080 in 100,000) |
| HCV | 20 in 100,000 (IQR 0.4 in 100,000 to 22 in 100,000) | 1070 in 100,000 (IQR 630 in 100,000 to 1690 in 100,000) |
| IQR=interquartile range | ||
| Risk of Bias | Assessment | Support for judgement |
| Selection (one star each, maximum four stars) | 2 stars | |
| Representativeness of the exposed cohort | 0 stars | This study only included participants with AML as opposed to all patients with haematological malignancies |
| Selection of the non‐exposed cohort | 0 star | Participants in the control were from a second haematology centre, but there was no information to reassure that this cohort was drawn from the same community as exposed cohort |
| Ascertainment of exposure | 1 star | Secondary analyses from HOVON 29, prospective randomised controlled trial |
| Demonstration that outcome of interest was not present at start of study | 1 stars | The primary outcome and other outcomes were defined and were based on events that occurred after the study started |
| Comparability of cohort on design and analyses (maximum of two stars) Recognition of at least 75% of the main potential confounding factors (2 stars) Recognition of 50% to 75% of the main potential confounding factors (1 star) | 0 stars | < 50% of potential cofounders considered and sex, age and AML type were adjusted for in the multiple regression model. There was no discussion on previous severe bleeding, use of anticoagulation, use of radiotherapy in addition to chemotherapy, previous cardiovascular disease, previous alloimmunisation or performance status |
| Outcome (one star each, maximum of four stars) | 2 stars | |
| Assessment of outcome | 0 stars | Not described |
| Was follow‐up long enough for outcomes to occur? | 1 star | Yes, 31 days from chemotherapy |
| Adequacy of follow‐up of cohorts | 0 star | Reported for all, except unclear for infection, mean Hb during follow‐up, total number of platelet/red blood cell units received |
| Follow‐up equal between groups for primary and secondary outcomes? | 1 star | Follow‐up not significantly different |
| Additional concerns | None | |
| Overall assessment | 4 stars | |
| AML = acute myeloid leukaemia | ||
| Study | No. of participants received RBC transfusion during the study period | Mean no. RBC units transfusions/participant during study period | Number of participant‐days with RBC transfusions | Proportion of participant‐days with RBC transfusions | Mean Hb within first +100 days: | Number of RBC units per transfusion | Interval between RBC transfusions (mean) (days) |
| RCTs | |||||||
| Restrictive: 57/59 Liberal: 30/30 | Restrictive: mean 8.2 (SD 4.2) Liberal: mean 11.3 (SD 5.4) | NR | NR | Restrictive: mean 33.6 (SD 1.4) Liberal: mean 33.2 (SD 2.0) | NR | NR | |
| Restrictive: 3/3 Liberal: 3/3 | Restrictive: (mean 1.3 [SD 0.58]; median 1 [range 1 to 2; SE 0.33]) Liberal: (mean 8.7 [SD 5.5]; median 9 [range 3 to 14; SE 3.2]) | NR | NR | Restrictive: [mean pre transfusion Hb 69 g/L (range 69 g/L to 70 g/L) no SD] Liberal: [mean pre transfusion Hb 106 g/L (range 118 g/L to 132 g/L) no SD] | NR | NR | |
| Restrictive: 26/29 (24/29 from when Hb ≥80 g/L) Liberal: 29/31 (28/28 from when Hb ≥ 120g/L) | NR | Restrictive: 75 (70/467 days of observation once reached target Hb) Liberal: 113 g/L (72/410 days of observation once reached target Hb) | Restrictive: 0.151 (0.150 after study Hb threshold reached) Liberal: 0.233 (0.176 after study Hb threshold reached) [RR 1.56; 95% CI 1.16 to 2.10] [RR 1.18: 95% CI 0.90 to 1.54; once study Hb threshold reached]a | NR | NR | NR | |
| NRS | |||||||
| NR | Restrictive: mean 9.6 (SD 3.9); Median 9 (SE 0.6); Range 3 to 21 Liberal: mean 10.8 (SD 2.9); Median 11.0 (SE 0.4); Range 6 to 21 | NR | NR | Restrictive: Age < 25 Hb 7.5 (n = 3); 25‐50 yrs Hb 8.0 (n = 22); Age 50‐70 years Hb 8.3 (n = 13) Liberal: Age < 25 years Hb 8.8 (n = 3); 25‐50 years Hb 9.3 (n = 32); 50‐70 years Hb 9.5 (n = 11) | Restrictive: Mean 1.3 (SD 0.5); Median 1.0 (SE 0.03); range 1‐4 Liberal: Mean 1.82 (SD 0.4); Median 2 (SE 0.03); Range 1‐5 | Restrictive: 3.1 days (No SD) Liberal: 3 days (No SD) | |
| CI = confidence interval Trial HB: Restrictive ≥ 80g/L and Liberal ≥ 120g/L aData analysed by study authors, reported as relative risks derived from adjusted Cox regression models, allowing for repeated measures. | |||||||
| Study ID | Number of PLTs transfused per participant | Number of participant‐days with PLT transfusions | Proportion of participant‐days with RBC transfusions | Interval between PLT transfusions (mean & SD)(days) | Number of PLT units per transfusion (mean & SD) (units) | Nmber of PLT transfusion per participant |
| RCTs | ||||||
| NR | NR | NR | NR | NR | Restrictive: median:9 (IQR: 5.5 to 12.5) Liberal; median: 9 (IQR: 7 to 12) | |
| NR | NR | NR | NR | NR | NR | |
| Restrictive: 26/29 from study entry, 26 from when target Hb reached Liberal: 27/31 from study entry; 26 from when target Hb reached | Restrictive: 124 from study entry; 122 from Hb 80 g/L to 100 g/L Liberal: 0.265 from study entry; 0.283 from when Hb > 120 g/L | Restrictive: 0.249 from study entry; 0.261 from when Hb 8‐10 Liberal: 0.265 from study entry; 0.283 from when Hb > 12 [RR 1.06; 95% CI 0.74 to 1.52] [RR 1.02: 95% CI 0.73 to 1.44; once study Hb threshold reached]a | NR | NR | NR | |
| NRS | ||||||
| Restrictive: Mean 7.5 (SD 3.8); median 7 (SE 0.6); range 2 to 18 Liberal: Mean 8.5 (SD 4.9); median 7 (SE 0.7); range 2 to 30 P > 0.05 | NR | NR | Restrictive: 4 days (No SD) Liberal: 3.8 days (No SD) | Restrictive: Mean 1.1 (SD 0.4); median 1 (SE 0.03); range 1 to 4 Liberal: Mean 1.2 (SD 0.5); Median 1 (SE 0.03); range 1 to 4 | NR | |
| aData analysed by study authors, reported as relative risks derived from Cox regression models. IQR = Interquartile range | ||||||
| Outcome or subgroup title | No. of studies | No. of participants | Statistical method | Effect size |
| 1 All‐cause mortality‐at 31 to 100 days Show forest plot | 2 | 95 | Risk Ratio (M‐H, Fixed, 95% CI) | 0.25 [0.02, 2.69] |
| 2 Mortality due to chemotherapy Show forest plot | 1 | Risk Ratio (M‐H, Fixed, 95% CI) | Totals not selected | |
| 3 Number of participants with any bleeding Show forest plot | 2 | 149 | Risk Ratio (M‐H, Fixed, 95% CI) | 0.93 [0.73, 1.18] |
| 4 Number of participants with clinically significant bleeding Show forest plot | 2 | 149 | Risk Ratio (M‐H, Fixed, 95% CI) | 1.03 [0.75, 1.43] |
| 5 Severe or life‐threatening bleeding events Show forest plot | 2 | 149 | Risk Ratio (M‐H, Fixed, 95% CI) | 1.57 [0.39, 6.30] |
| 6 Number of participants with serious infection episodes Show forest plot | 1 | Risk Ratio (M‐H, Fixed, 95% CI) | Totals not selected | |
| 7 Number of participants with VOD Show forest plot | 1 | Peto Odds Ratio (Peto, Fixed, 95% CI) | Totals not selected | |
| 8 Number of participants with RBC transfusion from study entry Show forest plot | 3 | 155 | Risk Ratio (M‐H, Fixed, 95% CI) | 0.97 [0.90, 1.05] |
| 9 Number of participants with RBC Transfusion after reaching Hb >80 g/L for restrictive & Hb > 120 g/L for liberal Show forest plot | 1 | Risk Ratio (M‐H, Fixed, 95% CI) | Totals not selected | |
| 10 Mean number of RBC (units) transfusions per participant during the entire study period Show forest plot | 2 | 95 | Mean Difference (IV, Fixed, 95% CI) | ‐3.58 [‐5.66, ‐1.49] |
| 11 Number of participants with PLT transfusions from the study entry Show forest plot | 1 | Risk Ratio (M‐H, Fixed, 95% CI) | Totals not selected | |