مقایسه رویکردهای ترانسفیوژن گلبولهای قرمز خون محدود در برابر رویکردهای آزاد در افراد مبتلا به بدخیمیهای خونی تحت درمان با شیمیدرمانی شدید یا پرتودرمانی، یا هر دو، با یا بدون حمایت از سلول بنیادی خونساز
چکیده
پیشینه
بسیاری از افراد مبتلا به بدخیمیهای خونی، دچار آنمی میشوند و ترانسفیوژن گلبولهای قرمز خون (red blood cell; RBC)، نقش حمایتی اساسی در مدیریت آنها ایفا میکند. رویکردهای مختلفی برای ترانسفیوژن RBC ایجاد شده است. رویکرد ترانسفیوژن محدود، به دنبال حفظ سطح پائینتر هموگلوبین است (معمولا بین 70 گرم/لیتر تا 90 گرم/لیتر) همراه با محرکی برای ترانسفیوژن هنگام رسیدن هموگلوبین به زیر 70 گرم/لیتر)؛ در حالی که هدف رویکرد ترانسفیوژن آزاد (liberal)، حفظ هموگلوبین بالاتر است (معمولا بین 100 گرم/لیتر تا 120 گرم/لیتر همراه با آستانهای برای ترانسفیوژن هنگام رسیدن هموگلوبین به زیر 100 گرم/لیتر). رویکرد ترانسفیوژن محدود در افرادی که تحت جراحی قرار دارند یا در بخش مراقبتهای ویژه بستری شدهاند، ایمن بوده و در برخی موارد، ایمنتر از رویکرد ترانسفیوژن آزاد بوده است. با این وجود، نمیدانیم که در افراد مبتلا به بدخیمیهای خونی ایمن است یا خیر.
اهداف
تعیین ایمنی و اثربخشی رویکردهای ترانسفیوژن محدود در برابر آزاد برای افراد مبتلا به بدخیمیهای خونی که تحت درمان با شیمیدرمانی شدید یا پرتودرمانی، یا هر دو، با یا بدون پیوند سلول بنیادی خونساز (haematopoietic stem cell transplant; HSCT) قرار دارند.
روشهای جستوجو
ما به دنبال کارآزماییهای تصادفیسازی و کنترل شده (randomised controlled trials; RCTs) و کارآزماییهای غیر‐تصادفیسازی شده (NRS) تا 15 جون 2016، در MEDLINE (از 1946)، Embase (از 1974)، CINAHL (از 1982)، پایگاه ثبت مرکزی کارآزماییهای کنترل شده کاکرین (CENTRAL) (کتابخانه کاکرین 2016، شماره 6) و 10 بانک اطلاعاتی دیگر (از جمله چهار پایگاه ثبت کارآزمایی) جستوجو کردیم. همچنین منابع علمی منتشر نشده را جستوجو کرده و برای یافتن کارآزماییهای بیشتر، با متخصصان در زمینه ترانسفیوژن تماس گرفتیم. هیچ محدودیتی از لحاظ زبان، زمان یا وضعیت انتشار، وجود نداشت.
معیارهای انتخاب
ما RCTها و NRSهای آیندهنگری را وارد کردیم که رویکرد ترانسفیوژن RBC محدود را با رویکرد آزاد در کودکان یا بزرگسالان مبتلا به اختلالات بدخیمی خونی یا تحت HSCT، مقایسه کرده بودند.
گردآوری و تجزیهوتحلیل دادهها
روشهای استاندارد روششناسی مورد نظر کاکرین را به کار بردیم.
نتایج اصلی
شش کارآزمایی واجد شرایط را برای ورود به این مرور شناسایی کردیم؛ پنج RCT و یک NRS. سه RCT کامل (156 شرکتکننده)، یک NRS کامل (84 شرکتکننده) و دو RCT در حال انجام بودند. یک RCT دیگر را نیز شناسایی کردیم که در انتظار طبقهبندی بود. مطالعات تکمیل شده، بین 1997 تا 2015 انجام شده و دارای میانگین دوره پیگیری از 31 روز تا 2 سال بودند. یک مطالعه شامل کودکان دریافت کننده HSCT (شش شرکتکننده) و سه مطالعه دیگر فقط شامل بزرگسالان بودند. 218 شرکتکننده مبتلا به لوکمی حاد بوده و شیمیدرمانی میگرفتند و 16 نفر مبتلا به بدخیمی خونی بوده و HSCT دریافت میکردند. استراتژیهای محدود از 70 گرم/لیتر تا 90 گرم/لیتر متفاوت بودند. استراتژیهای آزاد نیز از 80 گرم/لیتر تا 120 گرم/لیتر متفاوت بودند.
کیفیت کلی مطالعات وارد شده بر مبنای رتبهبندی متدولوژی درجهبندی توصیه، ارزیابی، توسعه و ارزشیابی (GRADE)، از بسیار پائین تا پائین میان پیامدهای مختلف، متفاوت بود. هیچ یک از این مطالعات وارد شده، در همه زمینههای «خطر سوگیری (bias)»، عاری از سوگیری نبودند. یکی از این سه RCT، به دلیل نگرانیهای مربوط به ایمنی پس از استخدام فقط شش کودک، به سرعت متوقف شد، هر سه شرکتکننده در گروه آزاد، مبتلا به بیماری انسداد ورید (veno‐occlusive disease; VOD) شدند.
شواهد به دست آمده از RCTها
سیاست ترانسفیوژن محدود RBC ممکن است تفاوتی اندک یا عدم تفاوت در این موارد ایجاد کند: تعداد شرکتکنندگانی که درون 100 روز مردند (دو کارآزمایی، 95 شرکتکننده؛ RR: 0.25؛ 95% CI؛ 0.02 تا 2.69؛ شواهد با کیفیت پائین)؛ تعداد شرکتکنندگانی که دچار هرگونه خونریزی (دو مطالعه، 149 شرکتکننده؛ RR: 0.93؛ 95% CI؛ 0.73 تا 1.18، شواهد با کیفیت پائین)، یا خونریزی قابل توجه از نظر بالینی شدند (دو مطالعه، 149 شرکتکننده؛ RR: 1.03؛ 95% CI؛ 0.75 تا 1.43؛ شواهد با کیفیت پائین)؛ تعداد شرکتکنندگانی که نیازمند ترانسفیوژن RBC بودند (سه کارآزمایی، 155 شرکتکننده: RR: 0.97؛ 95% CI؛ 0.90 تا 1.05، شواهد با کیفیت پائین)؛ یا طول بستری در بیمارستان (میانه محدود 35.5 روز (دامنه بین‐چارکی (interquartile range; IQR): 31.2 تا 43.8)؛ رویکرد آزاد 36 روز (IQR: 29.2 تا 44)، شواهد با کیفیت پائین).
ما مطمئن نیستیم که استراتژی ترانسفیوژن محدود RBC، کیفیت زندگی (یک کارآزمایی، 89 شرکتکننده، نمره خستگی: میانه روش محدود: 4.8 (IQR؛ 4 تا 5.2)؛ میانه روش آزاد: 4.5 (IQR؛ 3.6 تا 5) (شواهد با کیفیت بسیار پائین)؛ یا خطر ابتلا به هرگونه عفونت جدی (یک مطالعه: 89 شرکتکننده؛ RR: 1.23؛ 95% CI؛ 0.74 تا 2.04، شواهد با کیفیت بسیار پائین) را کاهش میدهد.
سیاست ترانسفیوژن محدود RBC میتواند تعداد ترانسفیوژنهای RBC را به ازای هر شرکتکننده کاهش دهد (دو کارآزمایی، 95 شرکتکننده؛ تفاوت میانگین (MD): 3.58‐؛ 95% CI؛ 5.66‐ تا 1.49‐؛ شواهد با کیفیت پائین).
شواهد به دست آمده از NRS
ما مطمئن نیستیم که استراتژی ترانسفیوژن محدود RBC، خطر مرگومیر درون 100 روز را کاهش میدهد (یک مطالعه، 84 شرکتکننده؛ روش محدود: 1 مورد مرگومیر؛ روش آزاد: 1 مورد مرگومیر؛ شواهد با کیفیت بسیار پائین)؛ خطر خونریزی قابل توجه از لحاظ بالینی را کم میکند (یک مطالعه، 84 شرکتکننده؛ روش محدود: 3؛ روش آزاد: 8؛ شواهد با کیفیت بسیار پائین)؛ یا تعداد ترانسفیوژنهای RBC را کاهش میدهد (تعدیل شده از نظر سن، جنسیت و نوع لوکمی حاد میلوئیدی با میانگین هندسی: 1.25؛ 95% CI؛ 1.07 تا 1.47؛ تجزیهوتحلیل دادهها به وسیله نویسندگان مطالعه انجام شد).
هیچ NRSای یافت نشد که این موارد را بررسی کرده باشد: کیفیت زندگی، تعداد شرکتکنندگان با هرگونه خونریزی، عفونت جدی، یا طول اقامت در بیمارستان.
مطالعهای یافت نشد که این موارد را بررسی کرده باشد: واکنشهای جانبی ترانسفیوژن، حوادث ترومبوآمبولیک وریدی یا شریانی، طول بستری در بخش مراقبتهای ویژه، یا بستری مجدد در بیمارستان.
نتیجهگیریهای نویسندگان
یافتههای این مرور، بر مبنای چهار مطالعه و 240 شرکتکننده بود.
شواهد با کیفیت پائین نشان میدهد که سیاست ترانسفیوژن محدود RBC، تعداد ترانسفیوژنهای RBC را به ازای هر شرکتکننده کاهش میدهد. شواهد با کیفیت پائین وجود دارد که نشان میدهد سیاست ترانسفیوژن RBC محدود، دارای تاثیری اندک یا عدم تاثیر بر مرگومیر طی 30 تا 100 روز، خونریزی یا بستری در بیمارستان است. این شواهد عمدتا بر بزرگسالان مبتلا به لوکمی حاد تحت شیمیدرمانی بنا شده است. از آنجایی که دو مطالعه در حال انجام (530 شرکتکننده) تا ژانویه 2018 تکمیل شده و اطلاعات بیشتری راجع به بزرگسالان مبتلا به بدخیمیهای خونی ارائه خواهند کرد، قادر به پاسخگویی به این پیامد اولیه مرور نبودیم. اگر ما نرخ مرگومیر درون 100 روز را 3% در نظر بگیریم، به 1492 شرکتکننده برای داشتن شانس 80% شناسایی با معناداری در سطح 5% و افزایش در مورتالیتی به هر علتی از 3% تا 6% نیاز خواهیم داشت. RCTهای بیشتری در کودکان مورد احتیاج هستند.
PICO
خلاصه به زبان ساده
سیاست ترانسفیوژن محدود یا آزاد گلبولهای قرمز خون برای افراد مبتلا به سرطان خون
سوال مطالعه مروری
تعیین مزایا و آسیبهای استراتژی ترانسفیوژن محدود گلبول قرمز در مقایسه با استراتژی ترانسفیوژن آزاد گلبول قرمز خون برای افرادی که مبتلا به سرطان خون هستند (به عنوان مثال لوکمی، لنفوم، میلوما) و تحت درمانهای فشرده برای بیماری خود قرار دارند (شیمیدرمانی یا پیوند سلول بنیادی).
پیشینه
افراد مبتلا به سرطانهای خون به علت سرطان زمینهای خود یا درمان آن (شیمیدرمانی یا پیوند سلول بنیادی) اغلب دچار آنمی (میزان هموگلوبین کم) هستند. هموگلوبین برای حمل اکسیژن در بدن ضروری است.
ترانسفیوژن گلبولهای قرمز خون برای افزایش سطح هموگلوبین جهت پیشگیری از وقوع نشانههای آنمی یا درمان نشانههای آنمی، انجام میگیرد. تصمیم برای ترانسفیوژن گلبولهای قرمز، باید مزایای آن را در برابر خطرات احتمالی بسنجد (به عنوان مثال راش، تب، لرز، ابتلا به مشکلات تنفسی). این واکنشها معمولا خفیف و به آسانی قابل درمان هستند، واکنشهای شدید به ترانسفیوژن گلبولهای قرمز خون، به شدت نادر است. در کشورهای با سطح درآمد بالا، احتمال ابتلا به عفونت ناشی از ترانسفیوژن گلبولهای قرمز خون بسیار پائین است، با این حال، این خطر در کشورهای با سطح درآمد پائین بسیار بیشتر است. نیاز به ترانسفیوژن گلبولهای قرمز، به طور معمول توسط میزان هموگلوبین هدایت میشود. ترانسفیوژن در افراد مبتلا به سایر بیماریها، معمولا در صورت کاهش سطح هموگلوبین به حدود 70 گرم/لیتر تا 80 گرم/لیتر انجام میشود (استراتژی ترانسفیوژن محدود). افراد مبتلا به سرطانهای خون میتوانند از میزان هموگلوبین بالاتر مزیت ببرند (100 گرم/لیتر تا 120 گرم/لیتر، استراتژی ترانسفیوژن آزاد)، آنها ممکن است کمتر خونریزی کرده و دارای کیفیت زندگی بهتر باشند. نشان داده شده که استراتژی ترانسفیوژن محدود در افرادی که تحت جراحی قرار میگیرند یا کسانی که در بخش مراقبتهای ویژه بستری میشوند، به همان اندازه استراتژی ترانسفیوژن آزاد یا حتی از آن هم بیشتر ایمن است.
ویژگیهای مطالعه
ما در جستوجوی کارآزماییهای تصادفیسازی و غیر‐تصادفیسازی شده آیندهنگر بودیم. شش مطالعه دارای معیارهای ورود بودند، چهار مورد از آنها کامل و دو مورد در حال انجام بودند. یک مطالعه دیگر در انتظار طبقهبندی بود. مطالعات تکمیل شده، بین 1997 تا 2015 انجام شده و شامل 240 شرکتکننده بودند. یک مطالعه متشکل از کودکانی بود که پیوند سلول بنیادی دریافت میکردند و به سرعت به خاطر نگرانیهای مربوط به ایمنی متوقف شد (شش کودک)، سه مطالعه دیگر فقط شامل بزرگسالان بودند، 218 بزرگسال مبتلا به لوکمی حاد که تحت شیمیدرمانی قرار داشتند و 16 فرد مبتلا به سرطان خون که پیوند سلول بنیادی دریافت میکردند. سه مطالعه، کارآزمایی تصادفیسازی و کنترل شده و مطالعه چهارم، غیر‐تصادفیسازی شده بود. آستانه هموگلوبین برای استراتژیهای محدود، میان مطالعات متفاوت بود.
منابع بودجه در هر چهار مطالعه گزارش شده بود. بودجه یک مطالعه توسط صنعت تامین شده بود.
نتایج کلیدی
شواهد تا جون 2016 موجود بوده و عمدتا بر مبنای بزرگسالان مبتلا به لوکمی حادی است که تحت شیمیدرمانی قرار داشتند.
سیاست ترانسفیوژن محدود گلبول قرمز خون ممکن است تعداد ترانسفیوژنهای گلبول قرمز خون دریافتی را توسط یک فرد کاهش دهد.
سیاست ترانسفیوژن گلبول قرمز خون محدود میتواند دارای تاثیری اندک یا عدم تاثیر بر این موارد باشد: دریافت ترانسفیوژن گلبولهای قرمز خون در فرد، مرگومیر به هر علتی، خونریزی یا بستری در بیمارستان.
ما مطمئن نیستیم که سیاست ترانسفیوژن محدود گلبول قرمز خون، کیفیت زندگی یا خطر ابتلا به یک عفونت جدی را تحت تاثیر قرار میدهد یا خیر.
هیچ مطالعهای این موارد را بررسی نکرده بود: واکنشهای جانبی به ترانسفیوژن، ایجاد لختههای خونی، طول اقامت در بخش مراقبتهای ویژه، یا احتیاج به بستری مجدد در بیمارستان.
دو کارآزمایی در حال انجام (با برنامهریزی برای استخدام 530 بزرگسال) وجود دارند که قرار است تا ژانویه 2018 تکمیل شوند و اطلاعات بیشتری را در بزرگسالان مبتلا به سرطانهای خون فراهم کنند. هیچ کارآزمایی در حال انجامی برای کودکان وجود نداشت.
کیفیت شواهد
کیفیت کلی شواهد، از بسیار پائین تا پائین بود، زیرا مطالعات وارد شده دارای خطر سوگیری (bias) چشمگیر و تخمینهای غیر‐دقیق بوده و اکثر شواهد فقط مربوط به بزرگسالان مبتلا به لوکمی حاد بودند.
Authors' conclusions
Summary of findings
| Restrictive compared with liberal for people with haematological malignancies treated with intensive chemotherapy or radiotherapy, or both, with or without haematopoietic stem cell support | ||||||
| Patient or population: people with haematological malignancies treated with intensive chemotherapy or radiotherapy, or both, with or without haematopoietic stem cell support | ||||||
| Outcomes | Anticipated absolute effects* (95% CI) | Relative effect | No of Participants | Quality of the evidence | Comments | |
| Risk with liberal red blood cell transfusion RCTs | Risk with Restrictive | |||||
| All‐cause mortality at 31 to 100 days | Study population 61 per 1000 | 15 per 1000 (1 to 163) | RR 0.25 (0.02 to 2.69) | 95 (2 RCTs) | ⊕⊕⊝⊝ LOW1 | |
| Quality of life | Liberal group: median 4.5 (IQR: 3.6 to 5) Restrictive: median 4.8 (IQR: 4 to 5.2)a | 89 (1 RCT) | ⊕⊕⊝⊝ VERY LOW2,3,4 | |||
| Number of participants with any bleeding | Study population 639 per 1,000 | 595 per 1000 | RR 0.93 | 149 | ⊕⊕⊝⊝ | |
| Number of participants with clinically significant bleeding | Study population 443 per 1,000 | 456 per 1000 | RR 1.03 | 149 | ⊕⊕⊝⊝ | |
| Serious infections | Study population 400 per 1,000 | 492 per 1000 (296 to 816) | RR 1.23 | 89 (1 RCT) | ⊕⊝⊝⊝ VERY LOW2,3,4 | |
| Length of hospital admission (days) | Liberal: median 36 days (IQR: 29.2 to 44) Restrictive: median: 35.5 days (IQR: 31.2 to 43.8) | 89 (1 RCT) | ⊕⊕⊝⊝ LOW2,3 | |||
| Hospital readmission rate ‐ not reported | ‐ | ‐ | ‐ | ‐ | ‐ | |
| *The risk in the intervention group (and its 95% confidence interval) is based on the assumed risk in the comparison group and the relative effect of the intervention (and its 95% CI). | ||||||
| GRADE Working Group grades of evidence | ||||||
| 1The level of evidence was downgraded by 2 due to imprecision. aThis is a ten‐point scale with a score of zero indicating no fatigue and a score of ten indicating the worst possible fatigue. The median fatigue scare was similar for both groups; P = 0.53. Interquartile range: IQR | ||||||
| Restrictive compared with liberal for people with haematological malignancies treated with intensive chemotherapy or radiotherapy, or both, with or without haematopoietic stem cell support | ||||||
| Patient or population: people with haematological malignancies treated with intensive chemotherapy or radiotherapy, or both, with or without haematopoietic stem cell support | ||||||
| Outcomes | Anticipated absolute effects* (95% CI) | Relative effect | No of Participants | Quality of the evidence | Comments | |
| Risk with liberal red blood cell transfusion RCTs | Risk with Restrictive | |||||
| All‐cause mortality at 31 to 100 days | Liberal: 1 death (46 participants) Restrictive: 1 death (38 participants) | 84 | ⊕⊝⊝⊝ | Mean 31 days follow‐up | ||
| Quality of life ‐ not reported | ‐ | ‐ | ‐ | ‐ | ||
| Number of participants with any bleeding ‐ not reported | ‐ | ‐ | ‐ | ‐ | ||
| Number of participants with clinically significant bleeding | Liberal: 8 (46 participants) Restrictive: 3 (38 participants) | 84 | ⊕⊝⊝⊝ | The study authors reported that there was no significant difference between the two groups. | ||
| Serious infections ‐ not reported | ‐ | ‐ | ‐ | ‐ | ||
| Length of hospital admission ‐ not reported | ‐ | ‐ | ‐ | ‐ | ||
| Hospital readmission rate ‐ not reported | ‐ | ‐ | ‐ | ‐ | ||
| *The risk in the intervention group (and its 95% confidence interval) is based on the assumed risk in the comparison group and the relative effect of the intervention (and its 95% CI). | ||||||
| GRADE Working Group grades of evidence | ||||||
| 1The level of evidence was downgraded by 1 due to imprecision. | ||||||
Background
Description of the condition
Approximately 30% to 100% of people diagnosed with haematological malignancies experience anaemia during the course of their disease and red blood cell (RBC) transfusions play an essential supportive role in their management (Knight 2004). Intensive chemotherapy administered to treat people with haematological malignancies often results in prolonged periods of myelosuppression necessitating frequent RBC transfusions, especially in the setting of haematopoietic stem cell transplantation (HSCT). Indeed, people with haematology‐oncology medical conditions are amongst the largest consumers of RBC transfusions (Borkent‐Raven 2010; Javadzadeh Shahshahani 2015; Tinegate 2016; Whitaker 2015).
Of an estimated 108 million blood donations collected worldwide, over 50% are collected in high‐income countries, which represent only 18% of the world’s population (WHO 2015). Blood availability, distribution and safety vary widely throughout the world. In developing countries, blood supply is inadequate and the most common source is family or paid blood donors (WHO 2015). The prevalence of transfusion‐transmissible infections (TTI) in blood donations is extremely low in high‐income countries but is significantly higher in low‐ and middle‐income countries (Table 1; Bolton‐Maggs 2014). Although all donated blood should be screened for infections before use, currently 25 countries are not able to screen for one or more of the minimum mandatary blood screening infections: human immunodeficency virus (HIV), hepatitis B (HBV), hepatitis C (HCV) and syphilis (Table 2; WHO 2015). Irregular supply of test kits is one of the most commonly reported barriers to screening blood donations (WHO 2015). As well as the risk from infection, the risk of immune modulation, alloimmunisation, and iron overload are not uncommon events associated with blood transfusions (Bolton‐Maggs 2014; Vamvakas 2007). The limited supply and increasing cost of blood has placed additional emphasis on appropriate transfusion practice (Murphy 2011; Shander 2011).
| Transfusion Risk | Frequency in the UK (units transfused) ( Bolton‐Maggs 2014) | Frequency in low income countries ( WHO 2015 ) |
| ABO incompatible red cell transfusion | 3.7 in 1 million (10 cases per 2663488 transfusions) | unknown |
| Transfusion‐related acute lung injury | 0.4 in 1 million (10 cases per 2663488 transfusions) | unknown |
| Transfusion associated circulatory overload | 34.1 in 1 million (91 cases per 2663488 transfusions) | unknown |
| Transfusion transmitted infection | Frequency in high income countries | Frequency in low income countries |
| HIV | 2 in 100,000 (IQR 0.4 in 100,000 to 20 in 100,000) | 850 in 100,000 (IQR 480 in 100,000 to 2000 in 100,000) |
| HBV | 20 in 100,000 (IQR 8 in 100,000 to 24 in 100,000) | 3590 in 100,000 (IQR 2010 in 100,000 to 6080 in 100,000) |
| HCV | 20 in 100,000 (IQR 0.4 in 100,000 to 22 in 100,000) | 1070 in 100,000 (IQR 630 in 100,000 to 1690 in 100,000) |
IQR=interquartile range
Description of the intervention
Marked progress has been made on developing strategies for RBC transfusion. For many years, based on the findings of Adam 1942, RBC transfusion was recommended when the haemoglobin level dropped below 100 g/L or the haematocrit was below 30%. Although originally recommended to improve outcomes in people undergoing surgery with poor anaesthetic risk, this perioperative threshold was adopted in many other areas of clinical practice. This was challenged by the Transfusion Requirements In Critical Care (TRICC) trial, a landmark randomised controlled trial (RCT) that assessed the rates of death and severity of organ dysfunction using restrictive versus liberal transfusion strategies in the critical care setting (Hébert 1999). The restrictive strategy was to maintain the haemoglobin between 70 g/L to 90 g/L with a trigger for transfusion when the haemoglobin dropped below 70 g/L, whereas the liberal transfusion strategy was to maintain the haemoglobin between the range of 100 g/L to 120 g/L, with a threshold for transfusion when the haemoglobin dropped below 100 g/L. The restrictive transfusion strategy was seen to be as safe as the liberal transfusion strategy with similar 30‐day overall mortality rates. In a recent systematic review that assessed a restrictive versus liberal RBC transfusion strategies (31 trials, 9813 participants), the restrictive strategy was associated with a reduction in the number of RBC units transfused, with no differences in mortality and overall morbidity compared to a liberal strategy (Holst 2016). Moreover, results from a Cochrane review (19 trials, 6264 participants) also highlighted that restrictive transfusion strategies are safe, with no impact on mortality, cardiac events, myocardial infarction, stroke, pneumonia and thromboembolism when compared with liberal strategies (Carson 2016).
The current NICE guidelines recommend implementing restrictive RBC transfusion thresholds of a haemoglobin level after transfusion of between 70 g/L to 90 g/L, when major haemorrhage, acute coronary syndrome and chronic anaemia are absent (NICE 2015). In addition, the transfusion of a single RBC unit is also recommended for adults who do not have active bleeding.
Carson 2016 indicated that on average, restrictive transfusion strategies reduced the risk of receiving a transfusion by 39% compared to the liberal transfusion strategy. Similar findings were also seen from a retrospective cohort study in 139 people with haematological malignancies receiving intensive chemotherapy, this also Implementing a single‐unit transfusion policy that saved 25% of RBC units and, in addition to reducing the risks associated with allogeneic blood transfusions (Berger 2012).
People receiving intensive therapy for haematological malignancy have different physiological requirements to the critical care population as they are generally more physically active as well as experiencing more profound periods of erythropoietic suppression. Great uncertainty remains about whether it is safe to 'withhold' blood for patients with haematological malignancy until a lower threshold level is reached, and about the impact this poses on mortality, bleeding and adverse events, in addition to quality of life (Valeri 1998).
How the intervention might work
The aim of RBC transfusion is generally to improve oxygen delivery to the organs ‐ which could minimise morbidity, improve anaemia symptoms and enhance quality of life. However, unnecessary and unsafe blood transfusion practices could expose recipients to the risk of serious adverse transfusion reactions and TTI (WHO 2015).
The traditional transfusion threshold is a haemoglobin level of 100 g/L. This level has been lowered to haemoglobin levels between 60 g/L to 80 g/L. The Transfusion Requirement in Critical Care (TRICC) trial was the first to suggest that a 70 g/L was a safe threshold and perhaps safer than the traditional 100 g/L threshold (Hébert 1999). Several later trials assessed transfusion strategies in different clinical areas concluding that a restrictive transfusion strategy would trigger transfusion of a certain number of RBC units below a defined haemoglobin concentration (Carson 2011; Colomo 2008; Hajjar 2010). A liberal transfusion strategy would adopt a higher haemoglobin threshold and patients would tend to receive more blood components. However, the liberal transfusion strategy is still in use, especially when treating coronary artery syndromes (Carson 2013). A Cochrane review on this topic including 19 RCTs with over 6000 trial participants enrolled from many different clinical settings ‐ mainly surgical, trauma and critical care (Carson 2016) ‐ concluded that restrictive transfusion strategies did not appear to impact the rate of adverse events or the 30‐day mortality compared to liberal transfusion strategies. It was actually associated with a significant decline in hospital mortality.
In the recent systematic review on this topic (Holst 2016), only one RCT specifically included people with haematological malignancies. This study recruited 60 people with leukaemia undergoing chemotherapy or HSCT (Webert 2008). This multicentre, single‐blinded pilot RCT assessed the feasibility of a larger trial to identify the effect of the haemoglobin concentration on bleeding risk using higher transfusion thresholds and determined that a larger RCT was feasible.
Why it is important to do this review
Both anaemia and transfusion are associated with increased morbidity and mortality and national clinical guidelines on the appropriate use of blood transfusion and systems to monitor its safety are not currently in place throughout the world (WHO 2015). The optimal RBC transfusion strategy remains unclear in patients with haematological malignancy receiving intensive treatment. Due to the lack of available good quality evidence, no clear transfusion strategies are recommended in national guidelines for haematology patients or for those receiving chemotherapy (Carson 2012; Gunn 2012; McCelland 2010). Therefore, great variability exists at a local level. In Canada, the majority of centres have adopted a transfusion trigger of 80 g/L with a general reluctance to use a lower trigger of 70 g/L in all but one of 15 centres surveyed (Tay 2011). In the UK, a national audit also showed great variability in practice (Tinegate 2016).
In a variety of patient populations, including critical care patients, RBC transfusions have been associated with increased mortality and morbidity including more frequent infections, poor wound healing and increased arterial and venous thrombotic events (Blajchman 2005; Hébert 1999; Khorana 2008). The accumulated evidence showed restrictive RBC transfusion could improve outcomes for critically ill people (Salpeter 2014), or people with acute upper gastro‐intestinal bleeding (Villanueva 2013). Therefore, there is growing evidence to suggest that a restrictive RBC transfusion strategy is more beneficial than the liberal strategy in many clinical situations. However, this has not been systematically addressed in people with haematological malignancies.
A low haemoglobin level has been associated with an increased bleeding time (Ho 1998; Valeri 1998), and RBC transfusions have been shown to improve haemostasis in people with anaemia who are thrombocytopenic (Ho 1996) or uraemic (Livio 1982). Therefore, in people with haematological malignancies, a restrictive RBC transfusion policy may increase their risk of bleeding further in addition to their increased risk due to thrombocytopenia.
Objectives
To determine the efficacy and safety of restrictive versus liberal red blood cell (RBC) transfusion strategies for people diagnosed with haematological malignancies treated with intensive chemotherapy or radiotherapy, or both, with or without haematopoietic stem cell transplantation (HSCT).
Methods
Criteria for considering studies for this review
Types of studies
As it was likely that the number of randomised controlled trials (RCTs) that could be included in this review were small given the authors' tacit knowledge of the subject, we included data from non‐randomised studies (NRS) for all outcome evaluations. We only included NRS which were prospective in design and included a rigorous definition of the interventions and outcomes measured as an attempt to assess as wide a data volume as possible. Such studies included quasi‐randomised, non‐RCTs and prospective cohort studies. We excluded retrospective and uncontrolled studies (e.g. case series) due to the potential for unacceptable bias. Despite the inferiority of study quality that most NRS offered, a review of eligible NRS might identify a need for further RCTs and prove informative to the design of such a trial.
Types of participants
We included studies conducted on people with haematological malignancies requiring a red blood cell (RBC) transfusion whilst receiving intensive chemotherapy or radiotherapy, or both, with or without HSCT. We Included studies on participants of all ages, with the exception of neonates (up to 28 days old). We accepted the individual study's definition of intensive chemotherapy or radiotherapy, sufficient to cause myelosuppression. The number of potential intensive chemotherapy or radiotherapy regimens, or both was broad. We listed some examples, but these were not limited to, chemotherapeutic regimes listed on public oncology web sites such as:
-
Public Health England, Systemic anti‐cancer therapy Chemotherapy Dataset;
-
BC Cancer Agency Lymphoma and Myeloma Chemotherapy Protocols;
-
Royal Surrey County Hospital NHS Foundation Trust Haematology Chemotherapy.
We included studies that involved participants at all stages of treatment. We included studies on people with high risk myelodysplasia (refractory anaemia with excess of blasts (RAEB), and RAEB in transformation into acute leukaemia, (RAEB‐t)) if intensive chemotherapy or radiotherapy, or both was received. We excluded studies on people with a haematological malignancy requiring transfusion support only.
Where a study included mixed populations of participants, we planned to only use data relevant to haematological malignancies. There were no studies with mixed populations of participants with haematological and solid tumours or non‐intensive and intensive chemotherapy. In future updates of this review, when a study includes mixed populations of participants with haematological and solid tumours, we will only use data relevant to haematological malignancies. If the data are not available within the published literature or through direct author contact, we will exclude the study if fewer than 80% of the study population had haematological malignancies or high‐risk myelodysplasia. In future updates of this review, when studies include participants receiving intensive and non‐intensive chemotherapy or radiotherapy for haematological malignancies, we will only include data from the former group. If these data are not available, we will exclude the study if fewer than 80% of the study population were receiving intensive chemotherapy or radiotherapy for haematological malignancies.
Types of interventions
We included allogeneic red blood cell (RBC) transfusion strategies defined as 'restrictive' and 'liberal'. We expected that such definitions varied between studies, however, we accepted the individual study definitions of these strategies such that the restrictive (intervention) group in all included studies should receive a transfusion of allogeneic RBC units below a certain 'trigger' or 'threshold' haemoglobin or haematocrit level. The control group should receive a transfusion of RBC in accordance with a more liberal transfusion policy such as when a higher haemoglobin or haematocrit threshold was reached. For the purposes of this Cochrane review, we applied a standard published equation to convert haematocrit to haemoglobin: Haemoglobin (g/dL) = Haematocrit (%)/3 (Quintó 2006).
Types of outcome measures
We reported the outcomes from RCTs and NRS separately (Reeves 2011).
Primary outcomes
All‐cause mortality: all deaths (undefined time period); deaths during a defined period: short‐ (zero to seven days), medium‐ (eight to 30 days), and long‐term intervals (31 to 100 days) where day zero is the start of the follow‐up period or randomisation, or both.
Secondary outcomes
Mortality
-
Deaths due to:
-
Infection;
-
Bleeding;
-
Adverse transfusion reactions.
-
-
Death within 30 days of receiving:
-
Intensive radiotherapy;
-
Intensive chemotherapy;
-
HSCT.
-
Adverse events
-
Bleeding episodes
-
Any bleeding (e.g. World Health Organization (WHO) grades 1 to 4, National Cancer Institute's common terminology criteria for adverse events (CTCAE 2009), grades 1 to 5 or equivalent)
-
Clinically significant bleeding (e.g. WHO/CTCAE grades > 2 or equivalent)
-
Severe bleeding (e.g. WHO/CTCAE grade > 3 or equivalent)
-
-
Adverse transfusion reactions (e.g. TRALI, TACO, ABO incompatibility, TTI)
-
Serious infections (e.g. CTCAE > grade 3 or equivalent (CTCAE 2009))
-
Arterial or venous thromboembolic events
-
Toxicity score for HSCT recipients (e.g. Bearman Toxicity Score > grade 3 or equivalent (Bearman 1988))
Blood product requirements
-
RBC transfusion requirements and intervals
-
Platelet transfusion requirements and intervals
Other
-
Quality of life
-
Length of hospital admission
-
Length of intensive care admission
-
Hospital readmission
We tried to report secondary outcomes over meaningful periods common to as many studies as possible, such as the number and severity of bleeding episodes per person per day of study.
Search methods for identification of studies
The Information Specialist of the Systematic Review Initiative (CD) formulated the search strategies in collaboration with the Cochrane Haematological Malignancies Group. The searches for this review were performed in to phases the first phase was run until December 2012, thereafter the second phase was run until November 2015.
Electronic searches
Bibliographic databases
We searched for RCTs and NRS in the following databases:
-
Cochrane Central Register of Controlled Trials (CENTRAL, the Cochrane Library 2016, Issue 6 ‐Appendix 1);
-
MEDLINE (1946 to 15 June 2016‐ Appendix 2);
-
Embase (1974 to 15 June 2016 ‐ Appendix 3);
-
CINAHL (1982 to 15 June 2016 ‐ Appendix 4);
-
PubMed (epublications only ‐ Appendix 5);
-
Transfusion Evidence Library (www.transfusionevidencelibrary.com) (1980 to 15 June 2016 ‐ Appendix 6);
-
LILACS (1982 to 15 June 2016 ‐ Appendix 7);
-
IndMed (1986 to 15 June 2016 ‐ Appendix 8);
-
KoreaMed (1995 to 15 June 2016 ‐ Appendix 9);
-
Web of Science: Conference Proceedings Citation Index‐Science (CPCI‐S) (Thomson Reuters, 1990 to 15 June 2016 ‐ Appendix 10).
We combined searches in MEDLINE with the Cochrane RCT highly sensitive search filter, as detailed in Lefebvre 2011 and with the SIGN observational studies filter for MEDLINE. Also, we merged searches in Embase and CINAHL with the relevant SIGN RCT and observational studies filters (www.sign.ac.uk/methodology/filters.html).
Ongoing studies databases
We also checked for ongoing RCTs and NRS in the following databases to 15 June 2016:
-
ClinicalTrials.gov (Appendix 11);
-
ISRCTN Register (Appendix 12);
-
WHO International Clinical Trials Registry (ICTRP) (Appendix 13);
-
EU Clinical Trials Register (EUDRACT) (Appendix 14).
Searches were not limited by date, language or publication status.
Searching other resources
We augmented database searching with the following.
Handsearching reference lists
We checked the reference lists of all included studies, relevant reviews, conference abstracts and current treatment guidelines to identify additional studies that were not retrieved through databases searches.
Personal contact
We contacted the lead authors of relevant studies, study groups and international experts working in this field to identify any unpublished material, or to gather information regarding ongoing studies.
Data collection and analysis
Selection of studies
We selected studies according to Chapter 7 of the Cochrane Handbook for Systematic Reviews of Interventions (Higgins 2011a). The Systematic Review Initiative’s Information Specialist (CD) initially screened all search hits for relevance against the eligibility criteria and discarded all those that were clearly irrelevant. Thereafter, two review authors (LE, RM) independently screened all the remaining references for relevance against the full eligibility criteria. We retrieved full‐text papers for all references for which a decision on eligibility could not be made from title and abstract alone. We assessed study design features against the review inclusion criteria. Additional information was requested from study authors as necessary to assess the eligibility for inclusion of individual studies. Two review authors (LE, RM) discussed the results of study selection and resolved all disagreements by discussion without the need to consult a third review author (MM). We recorded the reasons why potentially relevant studies failed to meet the eligibility criteria. We reported the results of study selection using a PRISMA flow diagram (Moher 2009) (Figure 1).

Study flow diagram for study selection
We initially assessed the RCTs. As there were not two or more well‐conducted eligible RCTs including at least 1000 patients, we extended the assessment and selection of studies to NRS.
Data extraction and management
As recommended in Higgins 2011a, two review authors (RM, LE) independently extracted data onto standardised forms and performed a cross‐check. The two review authors piloted the data extraction form for included RCTs and NRS. Any disagreements between the review authors were resolved by consensus. We were not blinded to the names of the study authors, institutions, journals or the study outcomes. If a trial had multiple publications we used one form only to extracted relevant data. When these sources provided insufficient information, we contacted the authors and study groups for additional details. One review author (RM) performed data entry into software, which a second review author (LE) checked for accuracy.
We extracted the following information for each study:
1. Source: Study ID; report ID; review author ID; date of extraction; ID of author checking extracted data; citation of paper; contact authors details;
2. Eligibility: Fate of study; reason for exclusion (as appropriate);
3. General study information: Publication type; study objectives; funding source; conflict of interest declared; other relevant study publication reviewed;
4. Study design: Was there a comparison; how were participants allocated to groups?; which part of the study were prospective?; on which variables was comparability between groups assessed?; type of study;
5. Study details and methods: Location; country; setting; number of centres; total study duration; recruitment dates; length of follow‐up; power calculation; primary analysis (and definition); stopping rules; method of sequence generation; allocation concealment; blinding (of clinicians, participants and outcome assessors); concerns regarding bias; inclusion & exclusion criteria; primary outcome(s); secondary outcomes;
6. Characteristics of interventions: Number of study arms; description of experimental arm; description of control arm; duration of red cell storage; frequency of minor ABO mismatched transfusions; other treatment (e.g. gamma irradiation);
7. Characteristics of participants: Age; gender; ethnicity; body surface area; primary diagnosis; stage of disease; category of intensive chemotherapy received; details of radiotherapy received; type of HSCT received; additional therapy received; risk of alloimmunisation; baseline haematology laboratory; subgroups evaluated; cofounders reported;
8. Participant flow: Total number screened for inclusion; total number recruited; total number excluded; total number allocated to each study arm; total number analysed (for primary outcome); number of allocated patients who received planned treatment; number of drop‐outs with reasons (percentage in each arm); protocol violations; missing data;
9. Outcomes: All cause mortality (undefined and within short, medium and long term periods); mortality due to infection, bleeding, TRALI, TACO, ABO incompatibility, TTI, other (with details); number and severity of bleeding episodes, adverse transfusion reactions, serious infections, toxicity score and quality of life scores; number and volume of red cell transfusion units received per patient; interval between red cell transfusions, number and volume of platelet doses received per patient; interval between platelet transfusion; duration of hospital admission; duration of intensive care admission; readmission to hospital during follow‐up period.
10. In the case of the NRS, we additionally extracted information on confounding factors, results from adjusted models and variables adjusted for.
Assessment of risk of bias in included studies
We assessed the quality of all included trials (RCTs) using the Cochrane risk of bias tool as described in Higgins 2011b. Two review authors (RM, LE) independently assessed each element of potential bias listed below as either 'high', 'low' or 'unclear risk of bias'. We also provided a brief description in the Characteristics of included studies table of the judgement statements upon which the review authors assessed potential bias. We reached a consensus on the degree of risk of bias through comparison of the review authors' statements and, where necessary, through consultation with a third author (SH).
To assess risk of bias, we addressed the following questions in the ’Risk of bias’ table for each included study.
-
Selection bias: Was the allocation sequence randomly generated? Was allocation adequately concealed prior to assignment?
-
Performance bias: Where possible, were the study participants and personnel adequately blinded?
-
Detection bias: Was blinding of the outcome assessors effective in preventing systematic differences in the way in which the outcomes were determined?
-
Attrition bias: Were incomplete outcome data adequately addressed for every outcome?
-
Reporting bias: Are reports of the study free of selective outcome reporting?
-
Other issues: Was the study apparently free of other problems that could put it at risk?
We assessed the quality of the NRS using an adapted Newcastle‐Ottawa scale (Wells 2013). We included an expansion of the comparability of cohorts section with the inclusion of a list of important confounding factors we felt should be addressed in the studies methods or analysis. Also, we included an additional question concerning equal follow‐up durations for mortality, the primary and secondary outcomes of this review. We scored the studies with reference to the Ottawa Hospital Research Institute's coding manual and scale guidelines. We provided judgement statements for each score in tabular form as for the 'Risk of bias' assessment of interventional trials. The score was reported out of a maximum of 10 stars using the following categories.
Selection (one star each, maximum four stars).
-
Representiveness of the exposed cohort
-
Selection of the non‐exposed cohort
-
Ascertainment of exposure
-
Demonstration that outcome of interest was not present at start of study
Comparability (maximum of two stars).
-
Recognition of at least 75% of the main potential confounding factors as listed below within study design or adjustment in analysis (two stars).
-
-
Primary diagnosis, separated by: haematological malignancy (acute leukaemia, high risk myelodysplasia, chronic lymphocytic leukaemia (CLL), myeloma, lymphoma) or natural history of primary diagnosis e.g. a) 'Indolent' (myeloma, low grade lymphoproliferative disorders (e.g. CLL, low grade lymphoma), acute lymphoblastic leukaemia/acute myeloid leukaemia in complete remission (CR1), chronic myeloid leukaemia in chronic phase, high risk myelodysplastic syndrome) or b) 'aggressive' (high grade lymphomas (e.g. diffuse large B‐cell lymphoma (DLBCL), Burkitt), all other stages of acute leukaemia, chronic myeloid leukaemia in accelerated or blast phase).
-
Age: variability in the age of patients included, e.g. paediatric (< 18 years) versus adult (> 18 years).
-
Gender: male to female ratio.
-
Previous severe bleeding (e.g. WHO/CTCAE grade > 3 or equivalent).
-
Use of anticoagulation during study.
-
Previous alloimmunisation.
-
Co‐existing cardiovascular disease.
-
Performance Status (e.g. ECOG, KPS).
-
HSCT: autograft versus allograft (allograft source: sibling, matched unrelated, cord donation; conditioning type: myeloablative including total body irradiation versus reduced intensity conditioning); harvest type: peripheral blood stem cell versus bone marrow harvest); ABO compatibility; cytomegalovirus (CMV) compatibility, stem cell dose received.
-
Radiation use in addition to intensive chemotherapy.
-
-
Recognition of 50% to 75% of the main potential confounding factors within study design or adjustment in analysis (one star).
Outcome (one star each, maximum of four stars).
-
Assessment of outcome.
-
Was follow‐up long enough for outcomes to occur?
-
Adequacy of follow‐up of cohorts.
-
Follow‐up equal between groups for primary and secondary outcomes?
We requested additional information from study authors as necessary to address the quality of individual studies. Two review authors discussed the results of the study quality assessment and try to resolve any discrepancies between themselves.
We planned to use the 'Risk of bias' assessment to explore statistical heterogeneity in each included study and to perform sensitivity analyses, but no meta‐analyses were performed. For both RCTs and NRS, we planned to exclude monocentric studies from a sensitivity analysis due to their higher likelihood of bias, but no meta‐analyses were performed.
Measures of treatment effect
We did not combine data retrieved from RCTs and NRS in a single meta‐analysis, but reported data separately (Reeves 2011).
We undertook quantitative assessments using Review Manager (RevMan) 2014.
Randomised controlled trials (RCTs)
For dichotomous outcomes, we recorded the number of outcomes in the treatment and control groups and estimated the treatment effect measures across individual studies as the relative effect measures (risk ratio with 95% confidence intervals (CIs)). Where the number of observed events was small (< 5% of sample per group), we used Peto odds ratio (Peto OR) method for analysis (Deeks 2011). For continuous outcomes using the same scale, we assessed the mean difference (MD) with 95% confidence intervals (CI), and continuous outcomes measured with different scales we planned to present the standard mean difference (SMD). No hazard ratios (HR) were reported, and we were unable to estimate the HR using the available data and a purpose built method based on the Parmar and Tierney tool (Parmar 1998; Tierney 2007).
Non‐randomised studies (NRS)
For the NRS, we planned to report the adjusted odds ratios (OR) with 95% confidence intervals (CIs), but none were reported. If the adjusted ORs were not available, we planned to make every effort before pooling to establish whether the groups were comparable at base‐line. No meta‐analyses were performed, we planned to use the random‐effects model for all analyses of NRS.
We were aware that after collecting the data and assessing the quality of the included studies, it might be necessary to alter the analysis plan based on methodological considerations. No changes were made because we only included one NRS.
All studies
We did not report the number needed to treat to benefit (NNTB) with CIs and the number needed to treat to harm (NNTH) with CIs because there were no differences between any of the outcomes.
If we could not report the available data in any of the formats described above, we performed a narrative report.
Unit of analysis issues
There were no cluster‐randomised trials or cross‐over studies eligible for inclusion in this review.
We treated other unit of analysis issues in accordance with the advice given in Higgins 2011c. There was a unit of analysis issue for this review for the number of RBC or platelet transfusions reported in Webert 2008. Data were reported per participant day rather than per participant. However, the authors used a recurrent events analysis to take into account the repeated events data (Cook 1997).
Dealing with missing data
Where we identified data as missing or unclear in published literature, we contacted study authors directly. We recorded the number of patients lost to follow‐up for each study. Where possible, we planned to analyse data by intention‐to‐treat (ITT) but if insufficient data were available, we planned to present per protocol (PP) analyses (Higgins 2011c).
Assessment of heterogeneity
We only performed one meta‐analysis due to the small number of eligible studies and the lack of studies reporting similar outcomes.
We had planned to perform separate meta‐analyses for data extracted from RCTs and observational studies, if the clinical and methodological characteristics of studies were sufficiently homogeneous. We had also planned to assess the statistical heterogeneity of treatment effects between pooled studies using a Chi2 test with a significance level at P < 0.1. We would have used the I2 statistic to quantify the degree of potential heterogeneity and classify it as moderate if I2 > 30% or considerable if I2 > 75%.
We also anticipated that there would be at least moderate clinical and methodological heterogeneity within the included studies and the random‐effects model would be appropriate. If the heterogeneity was still considerable, we also planned to not report the overall summary statistic. In addition, we planned to assess potential causes of heterogeneity by sensitivity and subgroup analyses (Deeks 2011).
Assessment of reporting biases
We did not perform a formal assessment of potential publication bias (small‐trial bias) (Sterne 2011), because the review included fewer than 10 trials.
Data synthesis
We performed analyses according to the recommendations of Deeks 2011 using aggregated data for analysis. For statistical analysis, we entered data into the Cochrane statistical package of Review Manager (RevMan) 2014. One review author (RM) entered the data into the software. A second author (LE) checked data for accuracy. We were only able to perform a limited number of meta‐analyses due to the small number of eligible studies and the perceived clinical and methodological heterogeneity between these studies. Aditionally, we provided a narrative quantitative summary for relevant outcome data retrieved from RCTs and NRS separately. If the qualitative assessment was not feasible, we therefore described outcome data extracted from each study individually and we also commented on any apparent trends.
We used the GRADE system to build a 'Summary of Findings' table, as suggested in Schünemann 2011a and Schünemann 2011b. In the review protocol we considered the following most relevant outcomes.
-
All‐cause mortality
-
Quality of life
-
Bleeding episodes
-
Serious infections
-
Length of hospital admission
-
Hospital readmission rate
Subgroup analysis and investigation of heterogeneity
No subgroup analyses were performed because we only performed a limited number of meta‐analyses. We had planned to perform subgroup analysis for each outcome if data were available for the following.
-
Intensive chemotherapy versus radiotherapy.
-
Paediatric (less than 18 years) versus adult (18 years or older).
-
HSCT versus no HSCT.
-
For those that received HSCT:
-
autologous HSCT versus allogeneic HSCT;
-
reduced intensity transplant versus myeloablative HSCT.
-
-
For those that received intensive chemotherapy without HSCT:
-
induction versus consolidation chemotherapy (at least for acute leukaemia);
-
acute leukaemia versus non acute leukaemia.
-
We had also planned to undertake a subgroup analysis of results from studies including participants with pre‐existing cardiovascular diseases, if the relevant data were given separately in the study.
Sensitivity analysis
This was not feasible as we only performed a limited number of meta‐analyses and one of which was where data from the three included RCTs were combined. However, we originally planned to assess the robustness of our findings by performing the following sensitivity analyses where appropriate:
-
including only those studies with a 'low risk of bias' (e.g. RCTs with methods assessed as low risk for random sequence generation and concealment of treatment allocation);
-
including only those studies with less than a 20% dropout rate;
-
including only multicentric studies.
Results
Description of studies
See Characteristics of included studies; Characteristics of excluded studies; Characteristics of studies awaiting classification and Characteristics of ongoing studies.
Results of the search
See the PRISMA Flow Diagram (Figure 1). We identified a total of 17,949 potentially‐relevant records in the search conducted on 15 June 2016. There were 10,228 records after we removed duplicates. Two out of four reviewers (CB, LE, RM, JT) excluded 10,199 records on the basis of the abstract (two were review authors and two were protocol authors). The full texts of 29 articles were assessed for eligibility. Of those, 16 studies within 17 records were excluded with reasons; details were listed in the Characteristics of excluded studies table. We identified seven studies, within 12 records that met or may meet the review inclusion criteria. One of these is awaiting classification (NCT02099669), two of these are ongoing studies (Chantepie 2015; Tay 2011), three were randomised controlled trials (RCTs) (Robitaille 2013; Webert 2008; De Zern 2016) and one was a prospective non‐randomised study (NRS) (Jansen 2004).
We contacted the author of one potentially eligible for inclusion study (Mear 2014), as the study was only available as an abstract. We requested additional information related to the study design, study detailed data and whether the study authors were aware of any relevant ongoing or completed studies. The authors provided us with the requested information and thereafter we excluded the study as data were collected retrospectively.
We did not find any additional studies from other sources: checking lists of reference from the included studies and relevant reviews or by contacting experts in the field. All included studies were published in English.
Included studies
See Characteristics of included studies for full details of each study.
The four studies eligible for inclusion in this review were conducted between 1997 and 2015 and published between 2004 and 2016.
Three were RCTs, two were conducted in Canada (Robitaille 2013; Webert 2008), and one (De Zern 2016), in the USA. The remaining study was an NRS (Jansen 2004) conducted in the Netherlands.
Description of included RCTs
Study design and duration
We included three RCTs in this review, two were planned to be multicentre parallel RCTs (Robitaille 2013; Webert 2008) and De Zern 2016 was a single‐centre trial. Robitaille 2013 planned to recruit participants from six centres, however only one centre recruited participants prior to the trial's closure by the Data Safety Monitoring Board (DSMB). Two RCTs were open‐label trials (Robitaille 2013; De Zern 2016 ) and the other one was a single‐blinded trial (Webert 2008). Robitaille 2013 was closed after recruiting six participants because all three participants in the liberal transfusion arm were diagnosed with veno‐occlusive disease (VOD). The DSMB made their decision based on clinical observations, statistical comparison of the data in the two study arms, and statistical comparison of the data in the liberal transfusion arm with historical (non‐trial) data that used a restrictive threshold.
In Webert 2008, the mean follow‐up period was 25.9 days (standard deviation (SD), 8.4) in the restrictive group and 23.6 days (SD, 10.0) in the liberal group for a total of 1482 days of observation. In Robitaille 2013, all participants were followed up until day +100 from randomisation and in De Zern 2016, both groups had a similar follow‐up time, the median duration was 5.6 weeks for participants in the restrictive group and 6.1 weeks for the liberal group.
Study size and setting
The number of participants recruited ranged from six (Robitaille 2013) to 90 (De Zern 2016). In Robitaille 2013, the six participants were recruited from paediatric transplant centres, and in both Webert 2008 and De Zern 2016, 150 participants were inpatients recruited from tertiary referral haematology centres.
Two trials were conducted in Canada (Robitaille 2013; Webert 2008) and the third (De Zern 2016) was conducted in the USA. The studies were conducted between 2000 and 2015.
Study participants
In total, 156 participants were randomised, and 155 were included in the analyses, one participant withdrew from the De Zern 2016 study prior to any study transfusion. One hundred and fifty participants were adults: 134 with acute leukaemia receiving chemotherapy, and 16 with a haematological malignancy receiving an allogeneic stem cell transplant (De Zern 2016; Webert 2008). Six were children (mean age 11.7 years): three with acute myeloid leukaemia, two with myelodysplasia, and one with immune deficiency; all children received an allogeneic bone marrow transplant (Robitaille 2013).
In Webert 2008, there was no significant difference in the baseline haemoglobin level between the two groups ( restrictive: 96.3 g/L, liberal: 96.5 g/L, P = 0.96), in De Zern 2016, the baseline haemoglobin levels were significantly lower in the restrictive group (restrictive: median 83 g/L, liberal: median 89 g/L, P = 0.03) . The baseline haemoglobin levels were not reported in Robitaille 2013.
Participants with active bleeding were included in Robitaille 2013, however they were excluded in both Webert 2008 and De Zern 2016.
Participants with a history of cardiovascular disease were included in Robitaille 2013, excluded in Webert 2008, and only participants with acute coronary syndrome were excluded in De Zern 2016.
Study Interventions
The restrictive red blood cell (RBC) transfusion trigger thresholds varied between the three studies (70 g/L in Robitaille 2013 and De Zern 2016) and 80 g/L in Webert 2008).
The liberal RBC transfusion trigger threshold was the same in two RCTs (120 g/L) (Webert 2008; Robitaille 2013), and it was much lower at 80g/L in De Zern 2016.
The amount of RBC components transfused in each study arm were the same if a transfusion was required (10 mL/kg to 15 mL/kg) in Robitaille 2013; and two units of RBC components in Webert 2008 and De Zern 2016.
One trial reported the mean length of RBC component storage and this did not differ between the two groups (Robitaille 2013).
All trials reported off‐protocol RBC transfusions. In Webert 2008, about a third of RBC transfusions were given in the restrictive group and liberal group when the haemoglobin level was above the study thresholds. In De Zern 2016, there were two off‐protocol deviations, one participant in each trial arm received a blood transfusion above the study haemoglobin thresholds. In Robitaille 2013, protocol deviations were recorded and none of the participants received off‐protocol transfusions.
In two trials (Robitaille 2013; Webert 2008), prophylactic platelets transfusions were given when the platelet count fell below 10 x 109/L. In Robitaille 2013, the platelet count threshold was increased to 20 x 109/L when infection or fever occurred, in Webert 2008 this depended on the protocol of the treating institution or physician. No information on when a platelet transfusion was given to participants was provided by De Zern 2016.
All other chemotherapeutic and other interventions were performed according to standard treatment protocols.
Study outcomes
In Webert 2008, no single primary ocutome was prioritised and all five determined outcomes were considered equally important for the study feasibility, these included: bleeding; proportions of days of thrombocytopenia; usage of RBC and platelet components and blood donor exposure, bleeding symptoms and severity.
In Robitaille 2013, time to neutrophil recovery was the study's primary outcome. Secondary outcomes included: time to platelet recovery, usage of RBC and platelet components, length of hospital stay, immune reconstitution, overall survival, transplant‐related mortality, relapse, acute and chronic graft versus host disease (GvHD) and chimerism (Robitaille 2013). Several of these outcomes, including the planned primary outcome were not reported. The assessment of all long‐term events was planned to be performed at one, two and five years follow‐up.
In De Zern 2016, the safety and tolerability of a restrictive transfusion strategy in comparison with a liberal strategy was the primary outcome of the study. Secondary outcomes included fatigue, bleeding, response to therapy, vital status on day 60, length of hospital stay and the number of RBC units transfused, the number of platelets transfused per participant and the feasibility of conducting a larger RCT. Some outcomes were planned in the trial registration but not reported in the published paper, these were treatment‐related mortality, end‐organ dysfunction, number of participants with Eastern Cooperative Oncology Group (ECOG) < 2 performance status, the incidence of cross‐over between the two groups due to symptomatic anaemia, and cost‐effective analysis. All outcomes were planned to be assessed at day 60 from the trial onset.
Study funding
All three included trials were publicly funded; De Zern 2016 was sponsored by Sidney Kimmel Comprehensive Cancer Center; Robitaille 2013 was funded by Fonds de la Recherche en Sante (grant 9967 and 24460) and C17 research network and Webert 2008 was funded by Canadian Blood Services & CIHR Canada Research Chair.
Description of included NRS
Study design and duration
We included one NRS with prospective data collection, the mean follow‐up period was 30 days for the restrictive group and 32 days for the liberal group (Jansen 2004). Data were collected as part of a previous RCT of chemotherapy agents in acute myeloid leukaemia.
Study size and setting
Eighty‐four participants were recruited from two inpatient haematology units within the department of haematology in Rotterdam (the Netherlands) from June 1997 to December 2001.
Study participants
Participants were aged 15 to 60 years with newly diagnosed acute myeloid leukaemia treated with induction chemotherapy (ARA‐C and Idarubicin) . Participants were assigned to one of the following transfusion strategies based on where they were treated for their acute leukaemia. The two groups were comparable with no significant differences with regard to age, gender or French America British (FAB) classification of acute myeloid leukaemia. Participants with active bleeding were included, but participants with severe cardiac dysfunction were excluded.
Study intervention
Restrictive transfusion strategy: (age dependent): participants aged less than 25 years received a RBC transfusion when their haemoglobin was less than 72 g/L; participants aged 25 to 50 years received a RBC transfusion when their haemoglobin was less than 80 g/L; participants aged 50 to 70 received a RBC transfusion when their haemoglobin was less than 88 g/L. They received one unit of RBCs.
Liberal transfusion strategy: participants received a RBC transfusion when their when haemoglobin level was less than 96 g/L. They received two units of RBCs at each transfusion.
Off‐protocol transfusion: No off‐protocol transfusion was reported, though the plan was to always transfuse blood regardless of the haemoglobin readings when signs and symptoms of decreased oxygen transportation capacity occurred.
Study outcomes
The study's primary outcome measures were to show the differences of the total number of RBC transfusions and the number of units of RBCs given per transfusion between the two groups. Secondary outcomes included: mortality, bleeding, infections, cardiac arrhythmia and cardiac dysfunction, response to chemotherapy and the myeloid:erythroid ratio of the bone marrow smears.
Study funding
The initial RCT (HOVON 29 study) was partially funded by pharmaceutical companies.
Ongoing studies
We found two ongoing RCTs, published within three records, eligible for inclusion in this review (Chantepie 2015; Tay 2011). Both included ongoing studies are open‐label parallel RCTs with two intervention groups. One is a single‐centre RCT (Chantepie 2015) conducted in France and the second RCT is a multicentre Canadian RCT (Tay 2011). A total of 530 adult participants are planned to be recruited across the two ongoing trials by 2018. See Characteristics of ongoing studies.
Excluded studies
See Characteristics of excluded studies for further details. Reasons for exclusion were mainly involving non‐haematological oncological participants, retrospective study design and reviews, and interventions that were not compatible with our inclusion criteria.
-
Five studies were conducted on non‐haematological participants (Almeida 2013; Bruun 2011; ISRCTN26088319; NTR2684; Yakymenko 2015).
-
Five studies were not RCTs or NRS with no prospective design (Bercovitz 2011; Lightdale 2012; Mear 2014; Paananen 2009; Patil 2013).
-
Two studies compared different interventions such as one versus two RBC units (Abels 1991; Berger 2012).
-
Four records were reviews (Bercovitz 2011; Carson 2014; Holst 2013; Prescott 2016).
Risk of bias in included studies
See Figure 2 and Figure 3 for visual representations of the ’Risk of bias’ assessments across all studies and for each item in the included studies. See the Characteristics of included studies section of the ’Risk of bias’ table for further information about the bias identified within the individual trials.

Risk of bias graph: review authors' judgements about each risk of bias item presented as percentages across all included studies.

Risk of bias summary: review authors' judgements about each risk of bias item for each included study.
Risk of bias for included RCTs
Allocation
We assessed all three RCTS as low risk of selection bias due to adequate methods of sequence generation and allocation concealment.
Randomisation sequence generation:
All three trials provided information on method of randomisation. In Robitaille 2013 and De Zern 2016, randomisation was generated by computer and an Internet‐based randomisation web site was used to assign participants to either intervention or control in Webert 2008. In Webert 2008, participants were stratified by their treatment centre and diagnosis, and treatment allocation was scheduled by using a computer‐based generated random treatment allocation; this was developed with variable blocking factors and the size of the blocks selected randomly from a limited number of possibilities. In De Zern 2016, the random‐number sequence was generated using computer software.
Allocation concealment:
All three trials provided an adequate description of allocation concealment. Two trials used a web‐based randomisation system (Robitaille 2013; Webert 2008). One trial used sealed opaque sequentially numbered envelopes to allocate participants to either study arm (De Zern 2016).
Blinding
Blinding of participants and personnel:
We assessed all three trials as 'high risk' of performance bias. In Webert 2008, the study participants were aware of the intervention status and in both De Zern 2016 and Robitaille 2013 the study design was open‐label.
Blinding of clinical assessors:
We assessed Webert 2008, as 'low risk'' of detection bias, the personnel performing the clinical assessments were blinded to the participants' treatment allocation and to the haemoglobin levels.
We assessed De Zern 2016 and Robitaille 2013, as 'high risk'' of detection bias, both trials were open‐label design studies with no blinding.
Incomplete outcome data
We assessed one trial as 'low risk' of attrition bias (Webert 2008). All participants were accounted for within the study flow diagram and there were no withdrawals.
We assessed one trial as 'unclear risk' of attrition bias as the number of participants who withdrew from study was slightly higher from the restrictive group (De Zern 2016).
We assessed Robitaille 2013, as 'high risk' of attrition bias because all participants in the liberal transfusion arm were withdrawn from the study prior to day 100.
Selective reporting
We assessed Webert 2008 as 'low risk' of reporting bias as all study outcomes were prespecified by the authors and were provided for the study two groups.
We assessed De Zern 2016 as 'unclear risk' of reporting bias as some of the outcomes listed by the authors in the trial registration were not mentioned in the published paper. These outcomes were: mortality related to treatment, end‐organ dysfunction, number of participants with Eastern Cooperative Oncology Group (ECOG) performance status < 2, the incidence of treatment cross‐over because of symptomatic anaemia and cost‐effective analysis of restrictive RBC transfusion. The authors responded to our request for clarification by stating these outcomes would be the subject of a second paper.
We assessed Robitaille 2013 as 'high risk' of reporting bias due to the early discontinuing of the study, many of the planned outcomes were not reported or their analysis was not performed.
Other potential sources of bias
We assessed two trials as 'unclear risk' of other bias (De Zern 2016;Webert 2008). In De Zern 2016, the baseline haemoglobin level was significantly lower in the restrictive group, the analysis was adjusted for baseline haemoglobin, and a risk of contamination between the two groups reported as some participants crossed over from the restrictive to the liberal group. The two groups in Webert 2008 were not totally comparable as the number of study days after reaching the target haemoglobin levels differed between the groups, and it took longer for the liberal group to reach the threshold.
We assessed Robitaille 2013 as 'high risk' of other bias because the study was stopped early due to an increase incidence of VOD and therefore may substantially overestimate the risk of harm associated with a liberal RBC transfusion strategy.
Risk of bias for included NRS:
We used the Newcastle‐Ottawa Quality assessment scale (a star rating tool of risk of bias in three broad areas: selection of cohort, comparability cohort and outcomes) to assess the risk of bias for the one included NRS (Jansen 2004) . Details are presented in Table 3.
| Risk of Bias | Assessment | Support for judgement |
| Selection (one star each, maximum four stars) | 2 stars | |
| Representativeness of the exposed cohort | 0 stars | This study only included participants with AML as opposed to all patients with haematological malignancies |
| Selection of the non‐exposed cohort | 0 star | Participants in the control were from a second haematology centre, but there was no information to reassure that this cohort was drawn from the same community as exposed cohort |
| Ascertainment of exposure | 1 star | Secondary analyses from HOVON 29, prospective randomised controlled trial |
| Demonstration that outcome of interest was not present at start of study | 1 stars | The primary outcome and other outcomes were defined and were based on events that occurred after the study started |
| Comparability of cohort on design and analyses (maximum of two stars) Recognition of at least 75% of the main potential confounding factors (2 stars) Recognition of 50% to 75% of the main potential confounding factors (1 star) | 0 stars | < 50% of potential cofounders considered and sex, age and AML type were adjusted for in the multiple regression model. There was no discussion on previous severe bleeding, use of anticoagulation, use of radiotherapy in addition to chemotherapy, previous cardiovascular disease, previous alloimmunisation or performance status |
| Outcome (one star each, maximum of four stars) | 2 stars | |
| Assessment of outcome | 0 stars | Not described |
| Was follow‐up long enough for outcomes to occur? | 1 star | Yes, 31 days from chemotherapy |
| Adequacy of follow‐up of cohorts | 0 star | Reported for all, except unclear for infection, mean Hb during follow‐up, total number of platelet/red blood cell units received |
| Follow‐up equal between groups for primary and secondary outcomes? | 1 star | Follow‐up not significantly different |
| Additional concerns | None | |
| Overall assessment | 4 stars |
AML = acute myeloid leukaemia
Hb = haemoglobin
Selection of cohort
We awarded two out of a possible four stars for selection of cohort, one for the ascertainment of exposure as this study was part of a randomised controlled trial (HOVON 29), and the second star was given because the outcomes of interest were prespecified. No stars were awarded for the representative of the exposed cohort; only participants with acute myeloid leukaemia were included. Additionally, the selection of the non‐exposed cohort, was not clear with insufficient information to suggest that participants in the control group (non‐exposed), were drawn from the same community as the exposed cohort.
Comparability of the cohort
We gave zero out of a possible two stars for comparability of the cohort because the multiple regression model only adjusted for gender, age and acute myeloid leukaemia type. There was no considerations to other possible confounders such as severe bleeding, use of anticoagulation, use of radiotherapy in addition to chemotherapy, cardiovascular disease, previous alloimmunisation or performance status.
Assessment of outcomes
We awarded two out of a possible four stars for assessment of outcomes, one for adequate follow‐up time for the assessed outcomes and the second for the equal follow‐up between the two groups for both primary and secondary outcomes. We did not give any stars for assessment of outcomes. Hence, no information was given whether the outcomes were assessed blindly, and whether the follow‐up period was adequate. Some information was missing with regard to the incidence of infections, mean haemoglobin during follow‐up, total number of platelets and RBC units received.
Effects of interventions
See: Summary of findings for the main comparison ; Summary of findings 2 Summary of findings of NRS
We reported results from the three included RCTs and the one NRS individually in this review.
Effects of the interventions from included RCTs
Primary outcome: all‐cause mortality
All‐cause short‐term mortality, within zero to seven days from the study start
One of the three included RCTs provided data for this outcome (Robitaille 2013). No deaths occurred in either treatment arm; all six participants were alive at seven days.
All‐cause medium‐term mortality, within eight to 30 days from the study start
One of the three included RCTs provided data for this outcome (Robitaille 2013). No deaths occurred in either treatment arm; all six participants were alive at 30 days.
All‐cause long‐term mortality, within (31 to 100 days) from the study start
Two of the three included RCTs provided data for this outcome (De Zern 2016; Robitaille 2013). No deaths occurred in one of the studies (Robitaille 2013), and in De Zern 2016 one death occurred in the restrictive group and two deaths in the liberal group. There was no evidence for a difference in the number of participants who died between a restrictive and liberal RBC transfusion strategy (two studies; 95 participants; risk ratio (RR) 0.25, 95% CI 0.02 to 2.69, P = 0.26) (low‐quality evidence) (Analysis 1.1)
The small number of children enrolled in Robitaille 2013 were followed up for two years with one death occurred at six months from the liberal group due to relapse from leukaemia.
Secondary outcomes
Mortality
Deaths due to: infection; bleeding; adverse transfusion reactions
One of the three included RCTs reported: death due to infection; death due to bleeding or death due to transfusion reactions (Robitaille 2013). No deaths occurred in either treatment arm; all six participants were alive at 100 days.
Deaths within 30 days of receiving: intensive radiotherapy; intensive chemotherapy; haematopoietic stem cell transplant (HSCT)
Death due to intensive radiotherapy
None of the three included RCTs looked at this outcome.
Death due to intensive chemotherapy
One of the three included RCTs reported death within 30 days of receiving intensive chemotherapy (De Zern 2016). We are very uncertain whether there is any difference in death due to intensive chemotherapy between the two groups (one study; 89 participants;RR 0.51, 95% CI 0.03 to 7.85) (Analysis 1.2).
Death due HSCT
One of the three included RCTs reported death within 30 days of receiving a HSCT (Robitaille 2013), no deaths occurred in either treatment arm; all six participants were alive at 30 days.
Adverse Events
Bleeding episodes
Bleeding was reported in two of the three studies (De Zern 2016; Webert 2008).
-
Participants with any bleeding
There may be little or no difference in the number of participants who suffered from any bleeding between a restrictive versus liberal RBC transfusion strategies (two studies; 149 participants;RR 0.93, 95% CI 0.73 to 1.18, P = 0.54) (low‐quality evidence) (Analysis 1.3).
-
Clinically significant bleeding (WHO grade 2 and above)
There may be little or no difference in the number of participants who experienced clinically significant bleeding between the restrictive and liberal groups (two studies; 149 participants; RR: 1.03, 95% CI 0.75 to 1.43, P = 0.85) (low‐quality evidence) (Analysis 1.4)
-
Severe bleeding (WHO grade 3 and above)
We are very uncertain whether there is any difference between a restrictive versus liberal RBC transfusion strategies in the number of participants who suffered from severe bleeding (WHO grade 3 and above) (two studies; 149 participants; RR: 1.57, 95% CI 0.39 to 6.30) (Analysis 1.5) (Data from the Webert 2008 study was unpublished data provided by the study authors).
Webert 2008 also reported number of days with bleeding (RR: 1.19, 95%CI 0.84 to 1.70, P = 0.323) and time to first bleeding episode (RR: 1.36, 95%CI 0.79 to 2.34, P = 0.27) with no difference between treatment arms was seen. (Authors' own data).
Adverse transfusion reactions: such as transfusion‐related acute lung injury (TRALI), transfusion‐related circulatory overload (TACO), ABO incompatibility or transfusion transmitted infection (TTI)
None of the included trials provided data for these outcomes.
Serious infections
De Zern 2016 reported the episodes of neutropenic fever. We are very uncertain whether there is any difference in the number of participants who had experienced fever with positive blood culture between the restrictive and liberal transfusion strategy groups (one study; 89 participants; RR: 1.23, 95% CI 0.74 to 2.04) (very low‐quality evidence) (Analysis 1.6) (unpublished data provided by the author).
Arterial or venous thromboembolic events
None of the included trials provided data for this outcome.
Toxicity score for HSCT recipients
No data were provided for a toxicity score from the two included RCTs that included HSCT recipients (Robitaille 2013; Webert 2008). However, Robitaille 2013, reported the occurrence of veno‐occlusive disease (VOD) (a complication of HSCT). There was an increase in the risk of VOD in the liberal transfusion arm (Peto OR 28.03, 95% CI 1.51 to 520.65; six participants) (Analysis 1.7).
Blood product utilisation
Red blood cell (RBC) transfusion requirements and intervals
All three RCTs reported RBC transfusion requirements (Robitaille 2013; Webert 2008; De Zern 2016 ); no RCTs reported RBC transfusion intervals (see Table 4 for details).
| Study | No. of participants received RBC transfusion during the study period | Mean no. RBC units transfusions/participant during study period | Number of participant‐days with RBC transfusions | Proportion of participant‐days with RBC transfusions | Mean Hb within first +100 days: | Number of RBC units per transfusion | Interval between RBC transfusions (mean) (days) |
| RCTs | |||||||
| Restrictive: 57/59 Liberal: 30/30 | Restrictive: mean 8.2 (SD 4.2) Liberal: mean 11.3 (SD 5.4) | NR | NR | Restrictive: mean 33.6 (SD 1.4) Liberal: mean 33.2 (SD 2.0) | NR | NR | |
| Restrictive: 3/3 Liberal: 3/3 | Restrictive: (mean 1.3 [SD 0.58]; median 1 [range 1 to 2; SE 0.33]) Liberal: (mean 8.7 [SD 5.5]; median 9 [range 3 to 14; SE 3.2]) | NR | NR | Restrictive: [mean pre transfusion Hb 69 g/L (range 69 g/L to 70 g/L) no SD] Liberal: [mean pre transfusion Hb 106 g/L (range 118 g/L to 132 g/L) no SD] | NR | NR | |
| Restrictive: 26/29 (24/29 from when Hb ≥80 g/L) Liberal: 29/31 (28/28 from when Hb ≥ 120g/L) | NR | Restrictive: 75 (70/467 days of observation once reached target Hb) Liberal: 113 g/L (72/410 days of observation once reached target Hb) | Restrictive: 0.151 (0.150 after study Hb threshold reached) Liberal: 0.233 (0.176 after study Hb threshold reached) [RR 1.56; 95% CI 1.16 to 2.10] [RR 1.18: 95% CI 0.90 to 1.54; once study Hb threshold reached]a | NR | NR | NR | |
| NRS | |||||||
| NR | Restrictive: mean 9.6 (SD 3.9); Median 9 (SE 0.6); Range 3 to 21 Liberal: mean 10.8 (SD 2.9); Median 11.0 (SE 0.4); Range 6 to 21 | NR | NR | Restrictive: Age < 25 Hb 7.5 (n = 3); 25‐50 yrs Hb 8.0 (n = 22); Age 50‐70 years Hb 8.3 (n = 13) Liberal: Age < 25 years Hb 8.8 (n = 3); 25‐50 years Hb 9.3 (n = 32); 50‐70 years Hb 9.5 (n = 11) | Restrictive: Mean 1.3 (SD 0.5); Median 1.0 (SE 0.03); range 1‐4 Liberal: Mean 1.82 (SD 0.4); Median 2 (SE 0.03); Range 1‐5 | Restrictive: 3.1 days (No SD) Liberal: 3 days (No SD) | |
CI = confidence interval
Hb = haemoglobin
RBC = red blood cell
RR ‐ risk ratio
SD = standard deviation
SE = standard error
Trial HB: Restrictive ≥ 80g/L and Liberal ≥ 120g/L
aData analysed by study authors, reported as relative risks derived from adjusted Cox regression models, allowing for repeated measures.
-
Number of participants who received a RBC transfusion
All three trials reported the number of participants who received a RBC transfusion (De Zern 2016; Robitaille 2013; Webert 2008). There may be little or no difference in the number of participants who required RBC transfusions from study entry between the restrictive and liberal RBC transfusion groups (three studies; 155 participants: RR: 0.97, 95% CI 0.90 to 1.05) (Analysis 1.8). However, in the Webert 2008 study there was a reduction in the number of participants who required RBC transfusions in the restrictive RBC transfusion group after the study haemoglobin threshold was reached (one study; 57 participants: RR: 0.83, 95% CI 0.70 to 0.99) (Analysis 1.9).
-
Number of RBC transfusions per participant
We calculated the mean number of RBC transfusions per participant based on individual patient data provided in the study report (Robitaille 2013) (Table 4). There was a reduction in the mean number of transfusions in the restrictive RBC transfusion group (two studies; 95 participants; mean difference (MD) ‐3.58, 95%CI ‐5.66 to ‐1.49, P < 0.0001) (Analysis 1.10).
-
Proportion of participant days with a RBC transfusion
One trial reported the proportion of participant‐days with a RBC transfusion.There was a reduction in the proportion of participant‐days with a RBC transfusion in the restrictive RBC transfusion group from study entry ((Table 4). There was no evidence for a difference once the target haemoglobin levels were reached (Table 4).
Platelet transfusion requirements and intervals
Two trials provided data on platelet transfusion requirements (De Zern 2016; Webert 2008). See details in Table 5. No trials provided data on platelet transfusion intervals.
| Study ID | Number of PLTs transfused per participant | Number of participant‐days with PLT transfusions | Proportion of participant‐days with RBC transfusions | Interval between PLT transfusions (mean & SD)(days) | Number of PLT units per transfusion (mean & SD) (units) | Nmber of PLT transfusion per participant |
| RCTs | ||||||
| NR | NR | NR | NR | NR | Restrictive: median:9 (IQR: 5.5 to 12.5) Liberal; median: 9 (IQR: 7 to 12) | |
| NR | NR | NR | NR | NR | NR | |
| Restrictive: 26/29 from study entry, 26 from when target Hb reached Liberal: 27/31 from study entry; 26 from when target Hb reached | Restrictive: 124 from study entry; 122 from Hb 80 g/L to 100 g/L Liberal: 0.265 from study entry; 0.283 from when Hb > 120 g/L | Restrictive: 0.249 from study entry; 0.261 from when Hb 8‐10 Liberal: 0.265 from study entry; 0.283 from when Hb > 12 [RR 1.06; 95% CI 0.74 to 1.52] [RR 1.02: 95% CI 0.73 to 1.44; once study Hb threshold reached]a | NR | NR | NR | |
| NRS | ||||||
| Restrictive: Mean 7.5 (SD 3.8); median 7 (SE 0.6); range 2 to 18 Liberal: Mean 8.5 (SD 4.9); median 7 (SE 0.7); range 2 to 30 P > 0.05 | NR | NR | Restrictive: 4 days (No SD) Liberal: 3.8 days (No SD) | Restrictive: Mean 1.1 (SD 0.4); median 1 (SE 0.03); range 1 to 4 Liberal: Mean 1.2 (SD 0.5); Median 1 (SE 0.03); range 1 to 4 | NR | |
aData analysed by study authors, reported as relative risks derived from Cox regression models.
IQR = Interquartile range
-
Number of participants who received a platelet transfusion
There may be little or no difference in the number of participants who required platelets transfusions between the restrictive and liberal groups from study entry (one trial; 60 participants; RR:1.03, 95% CI 0.86 to 1.24) (Analysis 1.11).
-
Number of platelet transfusions per participant
In De Zern 2016, there may be little or no difference in the number of platelet transfusions per participant between the groups (restrictive group: median 9, Interquartile range (IQR) 5.5 to 12.5; liberal group: median 9, IQR 7 to 12) (Table 5) (Authors' own data).
-
Proportion of participant days with a platelet transfusion
In Webert 2008, there may be little or no difference in the proportion of participant days with platelet transfusions between the restrictive and liberal groups from study entry, or after the study haemoglobin threshold was reached (Table 5) (Authors' own data).
Quality of life
One RCT reported quality of life (De Zern 2016), and a fatigue‐self scoring tool was implemented (Mendoza 1999). This is a 10‐point scale with a score of zero indicating no fatigue and a score of 10 indicating the worst possible fatigue. The median fatigue scare was similar for both groups; for restrictive group: 4.8 (IQR: 4 to 5.2) and for the liberal group: 4.5 (IQR: 3.6 to 5), P = 0.53 (Authors’ own data).
Length of hospital admission
De Zern 2016 reported no difference in the length of hospital stay between the two groups; the median stay for restrictive group was 35.5 days (IQR; 31.2 to 43.8) compared with 36 days, IQR: 29.2 to 44, ( P = 0.53) (Authors's own data).
Length of intensive care admission
None of the included RCTs measured this outcome.
Hospital readmission
None of the included RCTs measured this outcome.
Effects of the interventions from included NRS
All the following outcomes were reported from the one included NRS (Jansen 2004).
Primary outcome: all‐cause‐mortality
All‐cause short‐term mortality, within zero to seven days and eight to 30 days from the study start
The Jansen 2004 study did not report these outcomes.
All‐cause long‐term mortality, within (31 to 100 days) from the study start
The Jansen 2004 study reported this outcome.Two deaths occurred over a mean 31 days follow‐up, one participant died from each group (very low‐quality evidence). No adjusted analysis was reported.
Secondary outcomes
Mortality causes
Mortality: death due to infection; bleeding; or adverse transfusion reactions
Jansen 2004, did not report on any of these outcomes.
Mortality within 30 days: due to intensive radiotherapy; or intensive chemotherapy
Jansen 2004, did not report on any of these outcomes.
Mortality within 30 days: due to HSCT
No participant in the Jansen 2004 study had a HSCT.
Adverse events
Bleeding episodes
-
Participants with any bleeding
Jansen 2004, did not report the number of participants with any bleeding.
-
Clinically significant bleeding (WHO grade 2 and above)
The authors did not report an adjusted analysis. Three participants had clinically significant bleeding in the restrictive group (38 participants) and eight participants had clinically significant bleeding in the liberal group (46 participants). The authors reported that there was no significant difference between the two groups.
-
Severe bleeding (WHO grade 3 and above)
Jansen 2004, did not report the number of participants with severe bleeding.
Adverse transfusion reactions: such as transfusion‐related acute lung injury (TRALI), transfusion‐related circulatory overload (TACO), ABO incompatibility or transfusion transmitted infection (TTI)
Jansen 2004, did not report on adverse transfusion reactions.
Serious infections
In Jansen 2004, it was stated that "No differences were found in incidence of infections and type of infective agents" between the two transfusion strategies. However, no data were provided to support this.
Arterial or venous thromboembolic events
Jansen 2004, did not report on arterial or venous thrombosis incidence.
Toxicity score for HSCT recipients
No participant in the Jansen 2004 study had a HSCT.
Blood product utilisation
Red blood cell (RBC) requirements and intervals
-
The total number of RBC transfusions was lower in the restrictive group compared to the liberal RBC transfusion group (unadjusted ratio of the geometric means 1.17, 95% CI 1.01 to 1.37: adjusted for age, sex and acute myeloid leukaemia type geometric mean 1.25; 95% CI 1.07 to 1.47 ‐ data analysis performed by the study authors)
-
The study authors stated that the number of RBC units given per transfusion was lower in the restrictive strategy group in comparison with the liberal strategy (Table 4). The study authors did not report an adjusted analysis.
-
The mean interval between RBC transfusions was 3.1 days in the restrictive group compared to 3.0 days in the liberal group (Table 4). The study authors did not report an adjusted analysis.
Platelet requirements and intervals
-
The study authors stated that there was no difference in the number of platelet transfusions per participant between the restrictive and liberal groups (Table 5). The study authors did not report an adjusted analysis.
-
The study authors stated that there was no difference in the number of platelet units per participant between the restrictive and liberal groups (Table 5). The study authors did not report an adjusted analysis.
-
The mean interval between platelets transfusions was 4.0 days in the restrictive group and 3.8 days in the liberal group (Table 5). The study authors did not report an adjusted analysis.
Other outcomes
Quality of life
This outcome was not assessed in Jansen 2004.
Length of hospital admission
This outcome was not assessed in Jansen 2004.
Length of intensive care admission
This outcome was not assessed in Jansen 2004.
Hospital readmission
This outcome was not assessed in Jansen 2004.
Discussion
Our main objective of conducting such a review was to compare participants safety and clinical outcomes of a restrictive blood transfusion strategy and a liberal blood transfusion strategy for people with haematological disorders undergoing myelosuppressive chemotherapy or stem cell transplantation. In recent years, a more conservative blood transfusion policy had been implemented in other populations.
Summary of main results
We identified four studies for inclusion in this review, three randomised controlled trials (RCTs) and one non‐randomised study (NRS) involving in total 240 participants.
We identified six studies eligible for inclusion in this review; five RCTs and one NRS. Three completed RCTs (156 participants), one completed NRS (84 participants), and two ongoing RCTs. The completed studies were conducted between 1997 and 2015. One study included children receiving a haematopoietic stem cell transplantation (HSCT) (six participants), the other three studies only included adults, 218 participants with acute leukaemia receiving chemotherapy, and 16 with a haematological malignancy receiving a HSCT. The restrictive strategies varied from 70 g/L to 90 g/L. The liberal strategies also varied from 80 g/L to 120 g/L. There is one additional study awaiting classification.
The follow‐up time from randomisation to outcome reporting was short, four to six weeks, in three studies (De Zern 2016; Jansen 2004; Webert 2008). In Robitaille 2013, mortality was assessed at two years from the initial enrolment day.
Summary of main results from included RCTs
A restrictive red blood cell (RBC) transfusion policy may reduce the number of RBC transfusions per participant (two trials; 95 participants; mean difference (MD) ‐3.58, 95%CI ‐5.66 to ‐1.49).
A restrictive RBC transfusion policy may make little or no difference to:
-
the number of participants who require RBC transfusions (three trials; 155 participants: RR: 0.97, 95% CI 0.90 to 1.05);
-
the number of participants who die within 100 days (two trials, 95 participants: RR: 0.25, 95% CI 0.02 to 2.69. low‐quality evidence);
-
the number of participants who experienced any bleeding (two studies, 149 participants; RR:0.93, 95% CI 0.73 to 1.18, low‐quality evidence), or clinically significant bleeding (two studies, 149 participants, RR: 1.03, 95% CI 0.75 to 1.43, low‐quality evidence);
-
the length of hospital stay (restrictive median 35.5 days (IQR: 31.2 to 43.8); liberal 36 days (IQR: 29.2 to 44)).
We are very uncertain whether the restrictive RBC transfusion strategy reduces:
-
the risk of developing any serious infection (one study, 89 participants, RR: 1.23, 95% CI 0.74 to 2.04, very low‐quality evidence).
-
quality of life (one trial, 89 participants, fatigue score: restrictive median 4.8 (interquartile range (IQR) 4 to 5.2); liberal median 4.5 (IQR 3.6 to 5)).
Summary of main results from included NRS
We are very uncertain whether the restrictive RBC transfusion strategy decreases:
-
the risk of death within 100 days (one study, 84 participants, restrictive 1 death; liberal 1 death);
-
the risk of clinically significant bleeding (one study, 84 participants, restrictive 3; liberal 8;very low‐quality evidence);
-
the number of RBC transfusions (adjusted for age, sex and acute myeloid leukaemia type geometric mean 1.25; 95% CI 1.07 to 1.47 ‐ data analysis performed by the study authors).
No NRS were found that looked at: quality of life; number of participants with any bleeding; serious infection; or length of hospital stay.
No studies were found that looked at: adverse transfusion reactions; arterial or venous thromboembolic events; length of intensive care admission; or readmission to hospital.
Overall completeness and applicability of evidence
This review provides the most up‐to‐date assessment of the effectiveness and safety of a restrictive RBC transfusion strategy compared to a liberal RBC transfusion strategy for people diagnosed with haematological malignancies treated with intensive chemotherapy or radiotherapy, or both, with or without a haematopoietic stem cell transplant (HSCT).
There was low‐quality evidence that a restrictive RBC transfusion strategy has little or no effect on all‐cause mortality, any bleeding or clinically significant bleeding. These were the only meta‐analyses performed within this review
The results of these meta‐analyses should not be interpreted without considering the impact of the following factors.
-
The majority of participants in this review were adults with acute leukaemia treated with chemotherapy, the findings of this review may not be generalisable to children; people with other blood cancers; or people treated with a HSCT.
-
Data on the review’s primary outcome, all‐cause mortality, was not provided by one trial (Webert 2008) (60 participants), therefore data were missing for over one third of participants within the included RCTs (155 participants).
-
The recording of bleeding is subjective, and only one of the three studies that reported bleeding reported the method of assessing and grading bleeding (Webert 2008).
-
There was little or no difference in all‐cause mortality, this review's primary outcome, but the 95% confidence interval (0.25 to 2.69) demonstrates that a clinically important difference in the proportion of participants who died could have been missed. If we assume a mortality rate of 3% within 100 days (data from De Zern 2016). We would need 1492 participants to have a 80% chance of detecting, as significant at the 5% level, an increase in all‐cause mortality from 3% to 6%. The ongoing studies are planning to recruit 530 participants and therefore we may not be able to answer this review's primary outcome even when the ongoing studies have been completed.
-
The early termination of one trial after recruiting only six participants influenced the availability of results (Robitaille 2013).
-
Different restrictive triggers were tested in the RCTs; less than 70 g/L in both Robitaille 2013 and De Zern 2016, and less than 80 g/L in Webert 2008.
-
Different restrictive triggers were tested in the RCTs; less than 120 g/L in both Webert 2008 and Robitaille 2013, and a much lower Hb transfusion threshold 80 g/L in De Zern 2016.
-
The evidence of the safety of restrictive transfusion strategies among people with existing cardiovascular disease were also lacking as this subset of participants was excluded from the three of the included studies. Less stable participants were considered for inclusion in De Zern 2016 only.
Other important considerations in this review are:
-
not all endpoints from all the studies could be incorporated into a meta‐analysis due to differences in the ways the studies had reported the outcomes;
-
some review outcomes were not reported by any of the included studies, for example, none of the studies reported transfusion reactions.
Quality of the evidence
There was evidence from three RCTs and one NRS.
The NRS only reported one outcome (number of RBC transfusions) that had been adjusted for confounding factors, and this analysis adjusted for only some of the potentially important confounding factors (age, sex and acute myeloid leukaemia type). The evidence from the NRS was very low according to GRADE criteria.
All of the RCTs were prone to bias. In all three RCTs participants and personnel were unblinded to the intervention, and in only one of the trials were outcome assessors blinded (Webert 2008). This is likely to reflect the inherent difficulties with blinding RBC transfusion trials because medical staff caring for participants cannot be blinded to their patients’ blood results.
In De Zern 2016, some participants crossed over between the two transfusion strategies. Seven of 59 (11.9%; 95% CI, 4.91% to 22.93%) allocated to the restrictive transfusion strategy and two of 30 (6.7%; 95% CI, 0.82% to 22.07%) allocated to the liberal transfusion strategy crossed over during the study. Analysis was by intention‐to‐treat and therefore the ability to detect a difference between the two arms would have been reduced.
The ability to detect bias was limited by only two of the included studies having a trial registration or published protocol (De Zern 2016; Robitaille 2013).
We assessed the GRADE quality of evidence as low for:
-
all cause mortality (RCT);
-
bleeding episodes (RCT);
-
length of hospital admission (RCT).
We downgraded the quality of evidence due to: the imprecision of the estimates (small number of included participants and there was a low number of events) and the indirectness of the evidence (most of the included participants were adults with acute leukaemia). We did not downgrade the evidence due to risk of bias due to lack of blinding because all‐cause mortality is an objective outcome and the majority of the evidence for bleeding episodes was from a study in which outcome assessors were blinded (Webert 2008).
We assessed the GRADE quality of evidence as very low for:
-
serious infection (RCT);
-
quality of life (RCT);
-
all‐cause mortality (NRS);
-
bleeding episodes (NRS).
For serious infection and quality of life, we downgraded the quality of evidence due to: the imprecision of the estimates, indirectness of the evidence (included participants were adults with acute leukaemia), and risk of bias (unblinded study).
For evidence from the NRS, we downgraded the quality of the evidence due to imprecision of the estimates.
Potential biases in the review process
There were no obvious biases within the review process. We conducted a wide search, which included ongoing trial databases and contact with researchers in the field; we carefully assessed the relevance of each paper identified; and we made no restrictions for the language in which the paper was originally published or its publication status. We performed all screening and data extractions in duplicate.We prespecified all outcomes and subgroups prior to analysis. The numbers of included studies were insufficient for us to combine to complete a funnel plot in order to examine the risk of publication bias.
None of the review authors were involved in the included or excluded studies.
Agreements and disagreements with other studies or reviews
Several reviews support the implementation of a more restrictive RBC transfusion strategies in a range of clinical settings. This has been shown in another Cochrane systematic review with a meta‐analysis of 31 randomised controlled trials, involving 12,587 participants from mainly surgical and intensive‐care settings (Carson 2016). The authors stated that the restrictive transfusion strategies were as safe as the liberal strategies for all‐cause mortality, myocardial infarction, stroke, and thromboembolism. This review agreed with the findings from Carson 2016 regarding all‐cause mortality, but we could not comment on myocardial infarction, stroke, and thromboembolism because none of our included studies reported these outcomes. The Carson 2016 review did not include some of this review's secondary outcomes. These outcomes were bleeding (not due to surgical procedures) and quality of life, both of which are relevant to people with haematological disorders. Carson 2016 did not perform a subgroup analysis for people with cardiac disease.
Several reviews have shown that a restrictive transfusion strategy decreases the number or RBC units transfused and number of participants being transfused (Carson 2016; Holst 2015). Carson 2016 and Holst 2015 had similar inclusion criteria, and both excluded trials in neonates. Holst 2015 (31 trials, 9813 participants) included data on six trials not included in Carson 2016 (two trials in infants and children undergoing cardiac surgery (Cholette 2011; De Gast‐Bakker 2013), one trial in orthotopic liver transplantation reported as an abstract (Wu 2011), and three trials excluded from Carson 2016 for various reasons (Fortune 1987; Robertson 2014; Zygun 2009)). Carson 2016 included data from six trials not included in Holst 2015 (five more recent trials (De Zern 2016; Fan 2014; Jairath 2015; Murphy 2015; Nielsen 2014), and one older trial (Fisher 1956)). Our review agreed that a restrictive transfusion strategy reduced the number of transfusions a patient receives, but did not find a difference in the number of participants who received a RBC transfusion. This may be because the majority of trials in these other reviews are in people receiving surgery or who are in intensive care rather than people who have an underlying haematological disorder.
Docherty 2016 assessed the risk of a restrictive transfusion policy in people undergoing non‐cardiac surgery who have cardiovascular disease (11 trials, 3033 participants). The results show that it may not be safe to use a restrictive transfusion threshold of less than 80 g/L in patients with ongoing acute coronary syndrome or chronic cardiovascular disease, although some of the results were uncertain. In this review we were unable to comment about people with cardiovascular disease due to lack of data.
Rohde 2014 focused on the risk of healthcare‐associated infection such as pneumonia, wound infection, and sepsis (17 trials, 7593 participants). None of these trials were in people with haematological disorders. Rohde 2014 showed that a restrictive RBC transfusion strategy was associated with a significant reduction in the incidence of serious infection in hospital‐admitted participants. Rohde 2014's finding agreed with Salpeter 2014 (three trials, 2364 participants), but disagreed with Carson 2016, which showed no difference in the risk of infection. The reviews differed, Rohde 2014 included unpublished data from four studies and data from neonatal studies; Salpeter 2014 only included published data for trials that used a restrictive threshold of 70 g/L in people in critical care or bleeding, and Carson 2016 included data from seven recently published trials not included in Rohde 2014 or Salpeter 2014. In this review, due to the lack of data we were very uncertain whether there was any difference in the risk of infection.
A possible association between the liberal transfusion strategy and a high incidence of developing veno‐occlusive disease (VOD) was highlighted in Robitaille 2013, the study was stopped after enrolment of only six children because of this concern. In contrast, results from another RCT, on critically ill children reported no differences in the survival or adverse events between the two strategies (Lacroix 2007). However, the trigger for blood transfusion in the liberal group was below 95 g/L in comparison to 120 g/L for the liberal group in Robitaille 2013. Increased blood viscosity due to a high RBC level is one of the mechanisms known to increase the risk of VOD (Beck 1998).
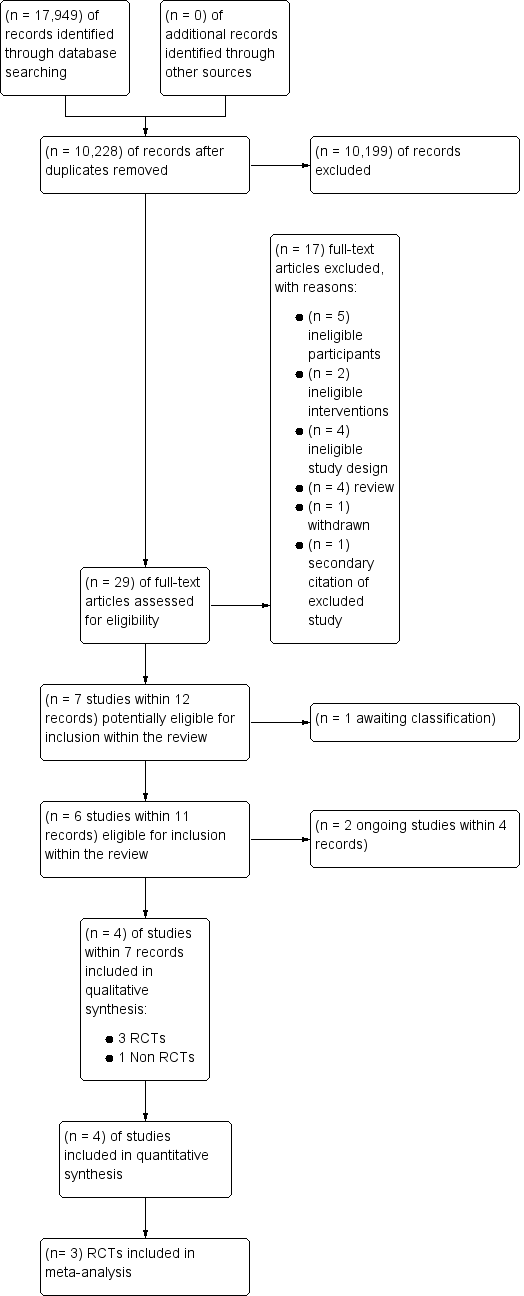
Study flow diagram for study selection
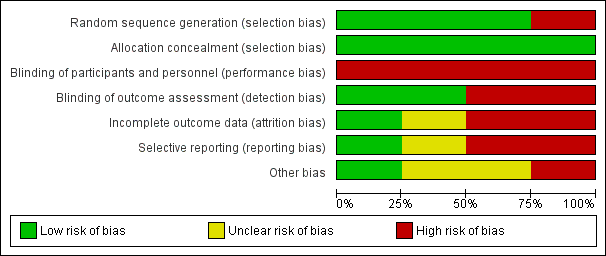
Risk of bias graph: review authors' judgements about each risk of bias item presented as percentages across all included studies.
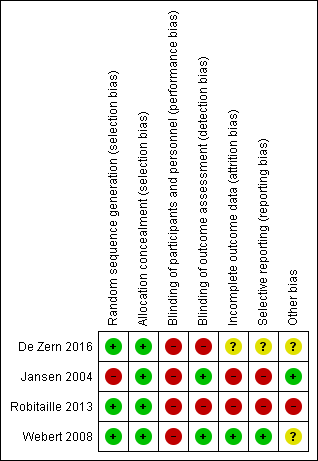
Risk of bias summary: review authors' judgements about each risk of bias item for each included study.
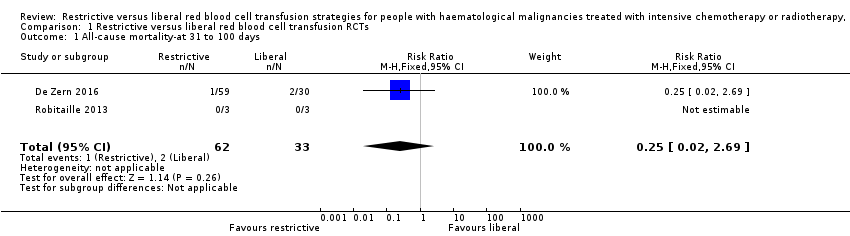
Comparison 1 Restrictive versus liberal red blood cell transfusion RCTs, Outcome 1 All‐cause mortality‐at 31 to 100 days.

Comparison 1 Restrictive versus liberal red blood cell transfusion RCTs, Outcome 2 Mortality due to chemotherapy.

Comparison 1 Restrictive versus liberal red blood cell transfusion RCTs, Outcome 3 Number of participants with any bleeding.

Comparison 1 Restrictive versus liberal red blood cell transfusion RCTs, Outcome 4 Number of participants with clinically significant bleeding.
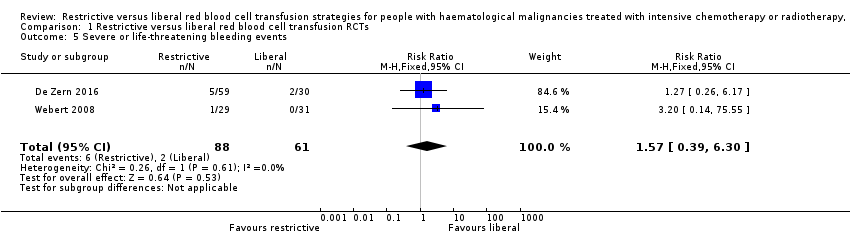
Comparison 1 Restrictive versus liberal red blood cell transfusion RCTs, Outcome 5 Severe or life‐threatening bleeding events.
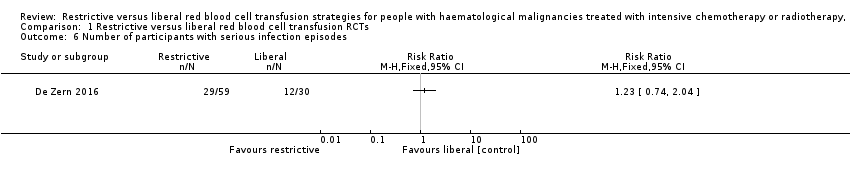
Comparison 1 Restrictive versus liberal red blood cell transfusion RCTs, Outcome 6 Number of participants with serious infection episodes.
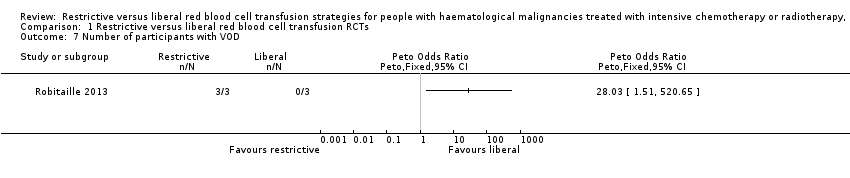
Comparison 1 Restrictive versus liberal red blood cell transfusion RCTs, Outcome 7 Number of participants with VOD.
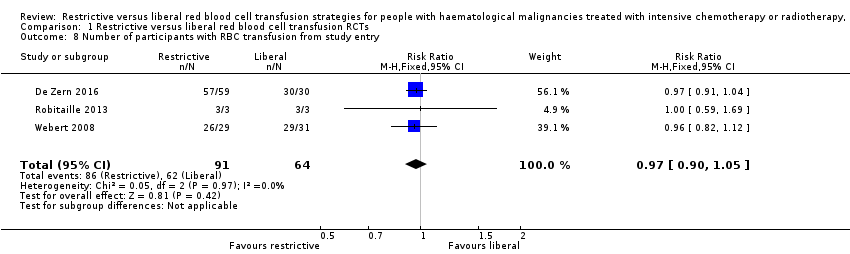
Comparison 1 Restrictive versus liberal red blood cell transfusion RCTs, Outcome 8 Number of participants with RBC transfusion from study entry.

Comparison 1 Restrictive versus liberal red blood cell transfusion RCTs, Outcome 9 Number of participants with RBC Transfusion after reaching Hb >80 g/L for restrictive & Hb > 120 g/L for liberal.
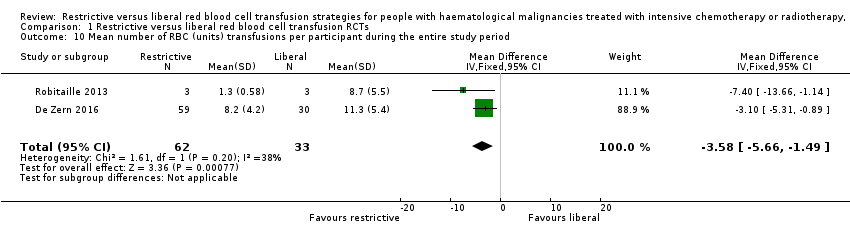
Comparison 1 Restrictive versus liberal red blood cell transfusion RCTs, Outcome 10 Mean number of RBC (units) transfusions per participant during the entire study period.
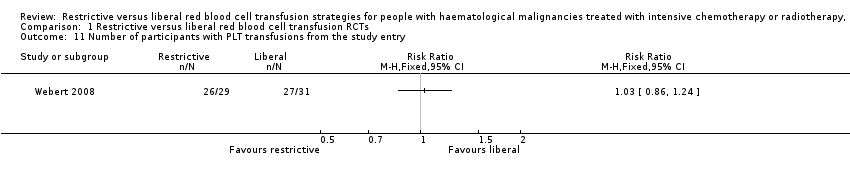
Comparison 1 Restrictive versus liberal red blood cell transfusion RCTs, Outcome 11 Number of participants with PLT transfusions from the study entry.
| Restrictive compared with liberal for people with haematological malignancies treated with intensive chemotherapy or radiotherapy, or both, with or without haematopoietic stem cell support | ||||||
| Patient or population: people with haematological malignancies treated with intensive chemotherapy or radiotherapy, or both, with or without haematopoietic stem cell support | ||||||
| Outcomes | Anticipated absolute effects* (95% CI) | Relative effect | No of Participants | Quality of the evidence | Comments | |
| Risk with liberal red blood cell transfusion RCTs | Risk with Restrictive | |||||
| All‐cause mortality at 31 to 100 days | Study population 61 per 1000 | 15 per 1000 (1 to 163) | RR 0.25 (0.02 to 2.69) | 95 (2 RCTs) | ⊕⊕⊝⊝ LOW1 | |
| Quality of life | Liberal group: median 4.5 (IQR: 3.6 to 5) Restrictive: median 4.8 (IQR: 4 to 5.2)a | 89 (1 RCT) | ⊕⊕⊝⊝ VERY LOW2,3,4 | |||
| Number of participants with any bleeding | Study population 639 per 1,000 | 595 per 1000 | RR 0.93 | 149 | ⊕⊕⊝⊝ | |
| Number of participants with clinically significant bleeding | Study population 443 per 1,000 | 456 per 1000 | RR 1.03 | 149 | ⊕⊕⊝⊝ | |
| Serious infections | Study population 400 per 1,000 | 492 per 1000 (296 to 816) | RR 1.23 | 89 (1 RCT) | ⊕⊝⊝⊝ VERY LOW2,3,4 | |
| Length of hospital admission (days) | Liberal: median 36 days (IQR: 29.2 to 44) Restrictive: median: 35.5 days (IQR: 31.2 to 43.8) | 89 (1 RCT) | ⊕⊕⊝⊝ LOW2,3 | |||
| Hospital readmission rate ‐ not reported | ‐ | ‐ | ‐ | ‐ | ‐ | |
| *The risk in the intervention group (and its 95% confidence interval) is based on the assumed risk in the comparison group and the relative effect of the intervention (and its 95% CI). | ||||||
| GRADE Working Group grades of evidence | ||||||
| 1The level of evidence was downgraded by 2 due to imprecision. aThis is a ten‐point scale with a score of zero indicating no fatigue and a score of ten indicating the worst possible fatigue. The median fatigue scare was similar for both groups; P = 0.53. Interquartile range: IQR | ||||||
| Restrictive compared with liberal for people with haematological malignancies treated with intensive chemotherapy or radiotherapy, or both, with or without haematopoietic stem cell support | ||||||
| Patient or population: people with haematological malignancies treated with intensive chemotherapy or radiotherapy, or both, with or without haematopoietic stem cell support | ||||||
| Outcomes | Anticipated absolute effects* (95% CI) | Relative effect | No of Participants | Quality of the evidence | Comments | |
| Risk with liberal red blood cell transfusion RCTs | Risk with Restrictive | |||||
| All‐cause mortality at 31 to 100 days | Liberal: 1 death (46 participants) Restrictive: 1 death (38 participants) | 84 | ⊕⊝⊝⊝ | Mean 31 days follow‐up | ||
| Quality of life ‐ not reported | ‐ | ‐ | ‐ | ‐ | ||
| Number of participants with any bleeding ‐ not reported | ‐ | ‐ | ‐ | ‐ | ||
| Number of participants with clinically significant bleeding | Liberal: 8 (46 participants) Restrictive: 3 (38 participants) | 84 | ⊕⊝⊝⊝ | The study authors reported that there was no significant difference between the two groups. | ||
| Serious infections ‐ not reported | ‐ | ‐ | ‐ | ‐ | ||
| Length of hospital admission ‐ not reported | ‐ | ‐ | ‐ | ‐ | ||
| Hospital readmission rate ‐ not reported | ‐ | ‐ | ‐ | ‐ | ||
| *The risk in the intervention group (and its 95% confidence interval) is based on the assumed risk in the comparison group and the relative effect of the intervention (and its 95% CI). | ||||||
| GRADE Working Group grades of evidence | ||||||
| 1The level of evidence was downgraded by 1 due to imprecision. | ||||||
| Transfusion Risk | Frequency in the UK (units transfused) ( Bolton‐Maggs 2014) | Frequency in low income countries ( WHO 2015 ) |
| ABO incompatible red cell transfusion | 3.7 in 1 million (10 cases per 2663488 transfusions) | unknown |
| Transfusion‐related acute lung injury | 0.4 in 1 million (10 cases per 2663488 transfusions) | unknown |
| Transfusion associated circulatory overload | 34.1 in 1 million (91 cases per 2663488 transfusions) | unknown |
| Transfusion transmitted infection | Frequency in high income countries | Frequency in low income countries |
| HIV | 2 in 100,000 (IQR 0.4 in 100,000 to 20 in 100,000) | 850 in 100,000 (IQR 480 in 100,000 to 2000 in 100,000) |
| HBV | 20 in 100,000 (IQR 8 in 100,000 to 24 in 100,000) | 3590 in 100,000 (IQR 2010 in 100,000 to 6080 in 100,000) |
| HCV | 20 in 100,000 (IQR 0.4 in 100,000 to 22 in 100,000) | 1070 in 100,000 (IQR 630 in 100,000 to 1690 in 100,000) |
| IQR=interquartile range | ||
| Risk of Bias | Assessment | Support for judgement |
| Selection (one star each, maximum four stars) | 2 stars | |
| Representativeness of the exposed cohort | 0 stars | This study only included participants with AML as opposed to all patients with haematological malignancies |
| Selection of the non‐exposed cohort | 0 star | Participants in the control were from a second haematology centre, but there was no information to reassure that this cohort was drawn from the same community as exposed cohort |
| Ascertainment of exposure | 1 star | Secondary analyses from HOVON 29, prospective randomised controlled trial |
| Demonstration that outcome of interest was not present at start of study | 1 stars | The primary outcome and other outcomes were defined and were based on events that occurred after the study started |
| Comparability of cohort on design and analyses (maximum of two stars) Recognition of at least 75% of the main potential confounding factors (2 stars) Recognition of 50% to 75% of the main potential confounding factors (1 star) | 0 stars | < 50% of potential cofounders considered and sex, age and AML type were adjusted for in the multiple regression model. There was no discussion on previous severe bleeding, use of anticoagulation, use of radiotherapy in addition to chemotherapy, previous cardiovascular disease, previous alloimmunisation or performance status |
| Outcome (one star each, maximum of four stars) | 2 stars | |
| Assessment of outcome | 0 stars | Not described |
| Was follow‐up long enough for outcomes to occur? | 1 star | Yes, 31 days from chemotherapy |
| Adequacy of follow‐up of cohorts | 0 star | Reported for all, except unclear for infection, mean Hb during follow‐up, total number of platelet/red blood cell units received |
| Follow‐up equal between groups for primary and secondary outcomes? | 1 star | Follow‐up not significantly different |
| Additional concerns | None | |
| Overall assessment | 4 stars | |
| AML = acute myeloid leukaemia | ||
| Study | No. of participants received RBC transfusion during the study period | Mean no. RBC units transfusions/participant during study period | Number of participant‐days with RBC transfusions | Proportion of participant‐days with RBC transfusions | Mean Hb within first +100 days: | Number of RBC units per transfusion | Interval between RBC transfusions (mean) (days) |
| RCTs | |||||||
| Restrictive: 57/59 Liberal: 30/30 | Restrictive: mean 8.2 (SD 4.2) Liberal: mean 11.3 (SD 5.4) | NR | NR | Restrictive: mean 33.6 (SD 1.4) Liberal: mean 33.2 (SD 2.0) | NR | NR | |
| Restrictive: 3/3 Liberal: 3/3 | Restrictive: (mean 1.3 [SD 0.58]; median 1 [range 1 to 2; SE 0.33]) Liberal: (mean 8.7 [SD 5.5]; median 9 [range 3 to 14; SE 3.2]) | NR | NR | Restrictive: [mean pre transfusion Hb 69 g/L (range 69 g/L to 70 g/L) no SD] Liberal: [mean pre transfusion Hb 106 g/L (range 118 g/L to 132 g/L) no SD] | NR | NR | |
| Restrictive: 26/29 (24/29 from when Hb ≥80 g/L) Liberal: 29/31 (28/28 from when Hb ≥ 120g/L) | NR | Restrictive: 75 (70/467 days of observation once reached target Hb) Liberal: 113 g/L (72/410 days of observation once reached target Hb) | Restrictive: 0.151 (0.150 after study Hb threshold reached) Liberal: 0.233 (0.176 after study Hb threshold reached) [RR 1.56; 95% CI 1.16 to 2.10] [RR 1.18: 95% CI 0.90 to 1.54; once study Hb threshold reached]a | NR | NR | NR | |
| NRS | |||||||
| NR | Restrictive: mean 9.6 (SD 3.9); Median 9 (SE 0.6); Range 3 to 21 Liberal: mean 10.8 (SD 2.9); Median 11.0 (SE 0.4); Range 6 to 21 | NR | NR | Restrictive: Age < 25 Hb 7.5 (n = 3); 25‐50 yrs Hb 8.0 (n = 22); Age 50‐70 years Hb 8.3 (n = 13) Liberal: Age < 25 years Hb 8.8 (n = 3); 25‐50 years Hb 9.3 (n = 32); 50‐70 years Hb 9.5 (n = 11) | Restrictive: Mean 1.3 (SD 0.5); Median 1.0 (SE 0.03); range 1‐4 Liberal: Mean 1.82 (SD 0.4); Median 2 (SE 0.03); Range 1‐5 | Restrictive: 3.1 days (No SD) Liberal: 3 days (No SD) | |
| CI = confidence interval Trial HB: Restrictive ≥ 80g/L and Liberal ≥ 120g/L aData analysed by study authors, reported as relative risks derived from adjusted Cox regression models, allowing for repeated measures. | |||||||
| Study ID | Number of PLTs transfused per participant | Number of participant‐days with PLT transfusions | Proportion of participant‐days with RBC transfusions | Interval between PLT transfusions (mean & SD)(days) | Number of PLT units per transfusion (mean & SD) (units) | Nmber of PLT transfusion per participant |
| RCTs | ||||||
| NR | NR | NR | NR | NR | Restrictive: median:9 (IQR: 5.5 to 12.5) Liberal; median: 9 (IQR: 7 to 12) | |
| NR | NR | NR | NR | NR | NR | |
| Restrictive: 26/29 from study entry, 26 from when target Hb reached Liberal: 27/31 from study entry; 26 from when target Hb reached | Restrictive: 124 from study entry; 122 from Hb 80 g/L to 100 g/L Liberal: 0.265 from study entry; 0.283 from when Hb > 120 g/L | Restrictive: 0.249 from study entry; 0.261 from when Hb 8‐10 Liberal: 0.265 from study entry; 0.283 from when Hb > 12 [RR 1.06; 95% CI 0.74 to 1.52] [RR 1.02: 95% CI 0.73 to 1.44; once study Hb threshold reached]a | NR | NR | NR | |
| NRS | ||||||
| Restrictive: Mean 7.5 (SD 3.8); median 7 (SE 0.6); range 2 to 18 Liberal: Mean 8.5 (SD 4.9); median 7 (SE 0.7); range 2 to 30 P > 0.05 | NR | NR | Restrictive: 4 days (No SD) Liberal: 3.8 days (No SD) | Restrictive: Mean 1.1 (SD 0.4); median 1 (SE 0.03); range 1 to 4 Liberal: Mean 1.2 (SD 0.5); Median 1 (SE 0.03); range 1 to 4 | NR | |
| aData analysed by study authors, reported as relative risks derived from Cox regression models. IQR = Interquartile range | ||||||
| Outcome or subgroup title | No. of studies | No. of participants | Statistical method | Effect size |
| 1 All‐cause mortality‐at 31 to 100 days Show forest plot | 2 | 95 | Risk Ratio (M‐H, Fixed, 95% CI) | 0.25 [0.02, 2.69] |
| 2 Mortality due to chemotherapy Show forest plot | 1 | Risk Ratio (M‐H, Fixed, 95% CI) | Totals not selected | |
| 3 Number of participants with any bleeding Show forest plot | 2 | 149 | Risk Ratio (M‐H, Fixed, 95% CI) | 0.93 [0.73, 1.18] |
| 4 Number of participants with clinically significant bleeding Show forest plot | 2 | 149 | Risk Ratio (M‐H, Fixed, 95% CI) | 1.03 [0.75, 1.43] |
| 5 Severe or life‐threatening bleeding events Show forest plot | 2 | 149 | Risk Ratio (M‐H, Fixed, 95% CI) | 1.57 [0.39, 6.30] |
| 6 Number of participants with serious infection episodes Show forest plot | 1 | Risk Ratio (M‐H, Fixed, 95% CI) | Totals not selected | |
| 7 Number of participants with VOD Show forest plot | 1 | Peto Odds Ratio (Peto, Fixed, 95% CI) | Totals not selected | |
| 8 Number of participants with RBC transfusion from study entry Show forest plot | 3 | 155 | Risk Ratio (M‐H, Fixed, 95% CI) | 0.97 [0.90, 1.05] |
| 9 Number of participants with RBC Transfusion after reaching Hb >80 g/L for restrictive & Hb > 120 g/L for liberal Show forest plot | 1 | Risk Ratio (M‐H, Fixed, 95% CI) | Totals not selected | |
| 10 Mean number of RBC (units) transfusions per participant during the entire study period Show forest plot | 2 | 95 | Mean Difference (IV, Fixed, 95% CI) | ‐3.58 [‐5.66, ‐1.49] |
| 11 Number of participants with PLT transfusions from the study entry Show forest plot | 1 | Risk Ratio (M‐H, Fixed, 95% CI) | Totals not selected | |