Estrategias para mejorar el uso de métodos anticonceptivos posparto: pruebas de estudios no aleatorios
Información
- DOI:
- https://doi.org/10.1002/14651858.CD011298.pub2Copiar DOI

- Base de datos:
-
- Cochrane Database of Systematic Reviews
- Versión publicada:
-
- 27 noviembre 2014see what's new
- Tipo:
-
- Intervention
- Etapa:
-
- Review
- Grupo Editorial Cochrane:
-
Grupo Cochrane de Regulación de la fertilidad
- Copyright:
-
- Copyright © 2014 The Cochrane Collaboration. Published by John Wiley & Sons, Ltd.
Cifras del artículo
Altmetric:
Citado por:
Autores
Contributions of authors
LM Lopez initiated the project, conducted the searches, did the primary data extraction, and drafted the review. TW Grey examined search results and conducted the secondary data extraction for study characteristics and outcomes. M Chen contributed to the Methods section, did the secondary extraction for evidence quality and helped with data interpretation. J Hiller provided content expertise. All authors reviewed and commented on the manuscript.
Sources of support
Internal sources
-
No sources of support supplied
External sources
-
National Institute of Child Health and Human Development, USA.
Support for conducting the review at FHI 360
-
US Agency for International Development, USA.
This report is made possible by the generous support of the American people through the United States Agency for International Development (USAID) under the terms of The Evidence Project, co‐operative agreement no. AID‐OAA‐A‐13‐00087. The findings and conclusions are the sole responsibility of the authors and do not necessarily reflect the views of USAID or the United States Government.
Declarations of interest
LM Lopez, TW Grey, M Chen, and JE Hiller: none
Acknowledgements
From FHI 360, Florence Carayon helped examine preliminary search results.
Version history
| Published | Title | Stage | Authors | Version |
| 2014 Nov 27 | Strategies for improving postpartum contraceptive use: evidence from non‐randomized studies | Review | Laureen M Lopez, Thomas W Grey, Mario Chen, Janet E Hiller | |
| 2014 Sep 17 | Strategies for improving postpartum contraceptive use: evidence from non‐randomized studies | Protocol | Laureen M Lopez, Thomas W Grey, Mario Chen, Janet E Hiller | |
Keywords
MeSH
Medical Subject Headings (MeSH) Keywords
Medical Subject Headings Check Words
Adolescent; Adult; Female; Humans; Pregnancy;

Study flow diagram.

Comparison 1 Postpartum FP counseling plus LAM versus traditional FP counseling, Outcome 1 Pregnancy by 12 months.
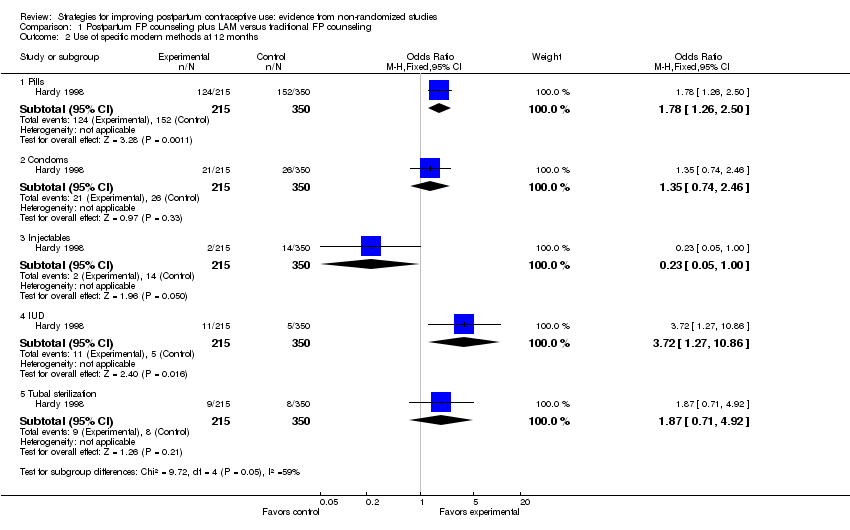
Comparison 1 Postpartum FP counseling plus LAM versus traditional FP counseling, Outcome 2 Use of specific modern methods at 12 months.

Comparison 1 Postpartum FP counseling plus LAM versus traditional FP counseling, Outcome 3 No contraceptive use at 12 months.
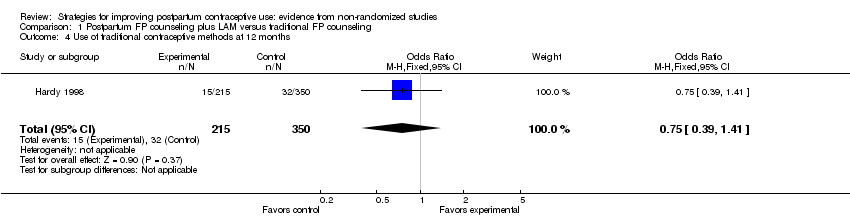
Comparison 1 Postpartum FP counseling plus LAM versus traditional FP counseling, Outcome 4 Use of traditional contraceptive methods at 12 months.
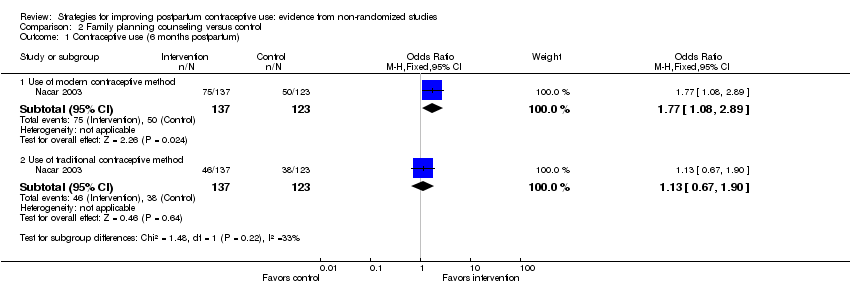
Comparison 2 Family planning counseling versus control, Outcome 1 Contraceptive use (6 months postpartum).
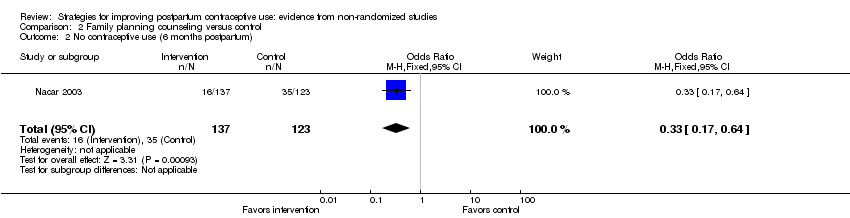
Comparison 2 Family planning counseling versus control, Outcome 2 No contraceptive use (6 months postpartum).

Comparison 3 Interactive education versus interactive pamphlet versus routine teaching, Outcome 1 Effectiveness of contraceptive method used most often (intervention versus pamphlet).

Comparison 3 Interactive education versus interactive pamphlet versus routine teaching, Outcome 2 Effectiveness of contraceptive method used most often (intervention versus routine).

Comparison 3 Interactive education versus interactive pamphlet versus routine teaching, Outcome 3 Sexual health knowledge at 2 months postpartum.
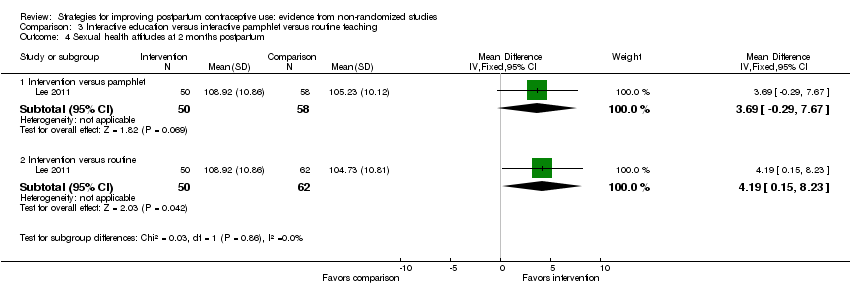
Comparison 3 Interactive education versus interactive pamphlet versus routine teaching, Outcome 4 Sexual health attitudes at 2 months postpartum.

Comparison 4 Family planning counseling and method provision versus no intervention, Outcome 1 Pregnancy at 6 months postpartum.

Comparison 4 Family planning counseling and method provision versus no intervention, Outcome 2 IUD use postpartum.
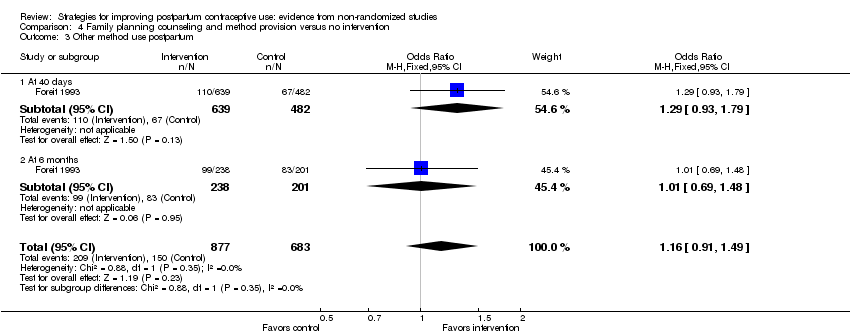
Comparison 4 Family planning counseling and method provision versus no intervention, Outcome 3 Other method use postpartum.

Comparison 4 Family planning counseling and method provision versus no intervention, Outcome 4 No contraceptive method use postpartum.

Comparison 5 Birth‐spacing message models: health service (HSM) versus community awareness (CAM) versus standard care, Outcome 1 Contraceptive use postpartum (HSM versus standard care).

Comparison 5 Birth‐spacing message models: health service (HSM) versus community awareness (CAM) versus standard care, Outcome 2 Contraceptive use postpartum (HSM versus CAM).

Comparison 5 Birth‐spacing message models: health service (HSM) versus community awareness (CAM) versus standard care, Outcome 3 Use of LAM at 4 months postpartum.
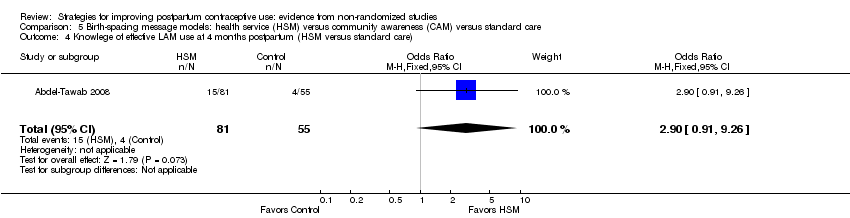
Comparison 5 Birth‐spacing message models: health service (HSM) versus community awareness (CAM) versus standard care, Outcome 4 Knowlege of effective LAM use at 4 months postpartum (HSM versus standard care).
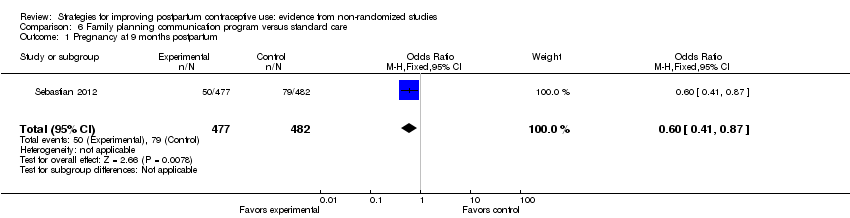
Comparison 6 Family planning communication program versus standard care, Outcome 1 Pregnancy at 9 months postpartum.

Comparison 6 Family planning communication program versus standard care, Outcome 2 Use of modern contraceptive method at 9 months postpartum.
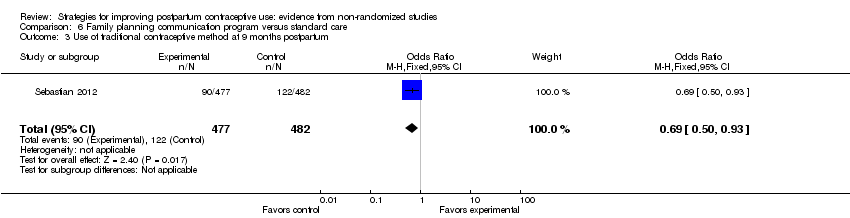
Comparison 6 Family planning communication program versus standard care, Outcome 3 Use of traditional contraceptive method at 9 months postpartum.
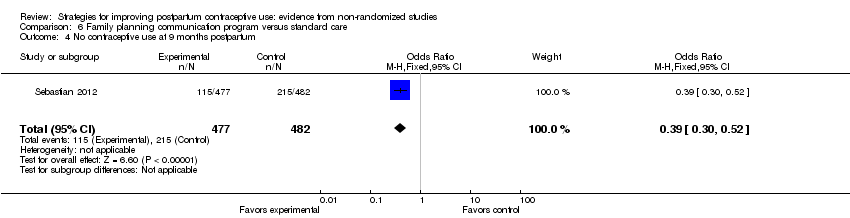
Comparison 6 Family planning communication program versus standard care, Outcome 4 No contraceptive use at 9 months postpartum.
| Study | Curriculum or manual | Provider credentials | Training for intervention | Assessed adherence | Assessed intervention | Fidelity criteria |
| ‐‐‐ | Educators for counseling; physicians for IUD insertion | 5 days for educators on FP; 4 days for physicians on IUD insertion | ‐‐‐ | ‐‐‐ | 2 | |
| Counseling material; leaflet on LAM for participants | ‐‐‐ | Training of all personnel on FP, including LAM as method | ‐‐‐ | ‐‐‐ | 2 | |
| 20‐minute educational session plus pamphlet | Researchers | ‐‐‐ | ‐‐‐ | ‐‐‐ | 2 | |
| Birth‐spacing messages and material for education and communication | Health care (HC) providers (physicians, nurses, Raedat Refiyat (community workers); community leaders | 3 days for HC managers and supervisors as trainers; 3 days for HC providers; 2 days for community leaders | Monthly supervision and monitoring visits by MCH and FP supervisors; checklists for monitoring intervention components. | Clinic exit interview had several knowledge and attitude items. | 5 | |
| Sexual health program (pamphlet) and educator guide booklet | Obstetric nurse educator | ‐‐‐ | ‐‐‐ | Assessed sexual health knowledge and attitudes and contraceptive self‐efficacy. | 3 | |
| Educational materials and counseling aids | Community midwife for antenatal clinic (18 months training); social health activist for counseling in homes (3 weeks training); anganwadi workers for counseling (1 month plus on‐job training) | 1 day for medical and child development officers, who trained community workers over 2 days (with counseling practice) | Supervisors spot‐checked knowledge of women; project staff observed counseling quality and content. | Knowledge assessed at 4 and 9 months postpartum. | 5 | |
| aAssessed participants' understanding and skills regarding the intervention. | ||||||
| Outcome at 12 months postpartum1 | Variable | Reported | Reported | Reported | Odds Ratio | 95% CI |
| Cumulative pregnancy rate | ‐‐‐ | ‐‐‐ | ‐‐‐ | ‐‐‐ | ‐‐‐ | ‐‐‐ |
| Contraceptive use | Having partner | 1.8914 | 0.2020 | <0.0001 | 6.63 | 4.46 to 9.85 |
| Experimental group | 1.1113 | 0.2931 | 0.0002 | 3.04 | 1.71 to 5.40 | |
| >= 2 living children | ‐0.6636 | 0.2670 | 0.0129 | 0.51 | 0.31 to 0.87 | |
| 1Logistic regression model included age, schooling (>= high school), # living children (>= 2), marital state (with partner), study group. | ||||||
| Outcome1 | Variable | Reported adjusted | Reported | Reported |
| Use of modern contraceptive method (9 months postpartum) | intervention group | 3.66 | 2.72 to 4.91 | < 0.01 |
| education >= high school | 1.88 | 1.27 to 2.79 | < 0.01 | |
| caste: other backward‐caste Hindu | 1.60 | 1.07 to 2.38 | < 0.05 | |
| Change in knowledge of >= 2 healthy spacing messages (4 months postpartum)2 | intervention group | 2.07 | ‐‐‐ | < 0.01 |
| age 20 to 24 years | 1.65 | ‐‐‐ | < 0.05 | |
| caste: high‐caste Hindu | 1.93 | ‐‐‐ | < 0.01 | |
| Change in knowledge of >= 2 spacing methods (9 months postpartum)2 | intervention group | 1.96 | ‐‐‐ | < 0.01 |
| baseline value | 1.53 | ‐‐‐ | < 0.05 | |
| education: middle school | 2.07 | ‐‐‐ | < 0.01 | |
| education: >= high school | 3.18 | ‐‐‐ | < 0.01 | |
| 1Logistic regression models did not include LAM use or knowledge because only 0.2% of control‐group women knew about the method. Models included study group, education, age, age at initiation of cohabitation, caste, and parity. Modern methods included pill, condoms, IUD, and sterilization. Models for change in knowledge also included baseline value. | ||||
| NOS criteria for cohort studies | ||||||
| Exposed cohort representativeness | ‐‐‐ | ‐‐‐ | ‐‐‐ | ‐‐‐ | ‐‐‐ | ‐‐‐ |
| Nonexposed cohort selection | ✸ | ‐‐‐ | ✸ | ‐‐‐ | ✸ | ‐‐‐ |
| Exposure ascertainment: method used | ✸ | ‐‐‐ | ✸ | ✸ | ✸ | ✸ |
| Comparability of groups: design or analysis | ‐‐‐ | ✸✸ | ‐‐‐ | ✸ | ‐‐‐ | ✸✸ |
| Outcome assessment: method used | ‐‐‐ | ‐‐‐ | ‐‐‐ | ‐‐‐ | ‐‐‐ | ‐‐‐ |
| Follow‐up length | ✸ | ✸ | ✸ | ✸ | ✸ | ✸ |
| Follow‐up adequacy | ‐‐‐ | ‐‐‐ | ✸ | ✸ | ‐‐‐ | ‐‐‐ |
| Intervention fidelity (>= 4 criteria) | ‐‐‐ | ‐‐‐ | ‐‐‐ | ✸ | ‐‐‐ | ✸ |
| Quality of evidence1,2 | Poor | Very low | Very low | Low | Poor | Low |
| 1Evidence was initially considered moderate quality and then downgraded for 1) no stars for comparability (not controlling for confounding), 2) not meeting >= 4 of remaining 6 NOS criteria, and 3) not having intervention fidelity information for >= 4 categories. Quality grades were moderate, low, very low, or poor. | ||||||
| Outcome or subgroup title | No. of studies | No. of participants | Statistical method | Effect size |
| 1 Pregnancy by 12 months Show forest plot | 1 | 565 | Odds Ratio (M‐H, Fixed, 95% CI) | 0.48 [0.27, 0.87] |
| 2 Use of specific modern methods at 12 months Show forest plot | 1 | Odds Ratio (M‐H, Fixed, 95% CI) | Subtotals only | |
| 2.1 Pills | 1 | 565 | Odds Ratio (M‐H, Fixed, 95% CI) | 1.78 [1.26, 2.50] |
| 2.2 Condoms | 1 | 565 | Odds Ratio (M‐H, Fixed, 95% CI) | 1.35 [0.74, 2.46] |
| 2.3 Injectables | 1 | 565 | Odds Ratio (M‐H, Fixed, 95% CI) | 0.23 [0.05, 1.00] |
| 2.4 IUD | 1 | 565 | Odds Ratio (M‐H, Fixed, 95% CI) | 3.72 [1.27, 10.86] |
| 2.5 Tubal sterilization | 1 | 565 | Odds Ratio (M‐H, Fixed, 95% CI) | 1.87 [0.71, 4.92] |
| 3 No contraceptive use at 12 months Show forest plot | 1 | 565 | Odds Ratio (M‐H, Fixed, 95% CI) | 0.37 [0.21, 0.67] |
| 4 Use of traditional contraceptive methods at 12 months Show forest plot | 1 | 565 | Odds Ratio (M‐H, Fixed, 95% CI) | 0.75 [0.39, 1.41] |
| Outcome or subgroup title | No. of studies | No. of participants | Statistical method | Effect size |
| 1 Contraceptive use (6 months postpartum) Show forest plot | 1 | Odds Ratio (M‐H, Fixed, 95% CI) | Subtotals only | |
| 1.1 Use of modern contraceptive method | 1 | 260 | Odds Ratio (M‐H, Fixed, 95% CI) | 1.77 [1.08, 2.89] |
| 1.2 Use of traditional contraceptive method | 1 | 260 | Odds Ratio (M‐H, Fixed, 95% CI) | 1.13 [0.67, 1.90] |
| 2 No contraceptive use (6 months postpartum) Show forest plot | 1 | 260 | Odds Ratio (M‐H, Fixed, 95% CI) | 0.33 [0.17, 0.64] |
| Outcome or subgroup title | No. of studies | No. of participants | Statistical method | Effect size |
| 1 Effectiveness of contraceptive method used most often (intervention versus pamphlet) Show forest plot | 1 | Mean Difference (IV, Fixed, 95% CI) | Subtotals only | |
| 1.1 At 2 months postpartum | 1 | 108 | Mean Difference (IV, Fixed, 95% CI) | 3.74 [‐5.07, 12.55] |
| 1.2 At 3 months postpartum | 1 | 93 | Mean Difference (IV, Fixed, 95% CI) | 13.26 [3.16, 23.36] |
| 2 Effectiveness of contraceptive method used most often (intervention versus routine) Show forest plot | 1 | Mean Difference (IV, Fixed, 95% CI) | Subtotals only | |
| 2.1 At 2 months postpartum | 1 | 112 | Mean Difference (IV, Fixed, 95% CI) | 3.96 [‐4.31, 12.23] |
| 2.2 At 3 months postpartum | 1 | 90 | Mean Difference (IV, Fixed, 95% CI) | ‐0.58 [‐7.07, 5.91] |
| 3 Sexual health knowledge at 2 months postpartum Show forest plot | 1 | Mean Difference (IV, Fixed, 95% CI) | Subtotals only | |
| 3.1 Intervention versus pamphlet | 1 | 108 | Mean Difference (IV, Fixed, 95% CI) | 0.54 [0.06, 1.02] |
| 3.2 Intervention versus routine | 1 | 112 | Mean Difference (IV, Fixed, 95% CI) | 1.55 [1.13, 1.97] |
| 4 Sexual health attitudes at 2 months postpartum Show forest plot | 1 | Mean Difference (IV, Fixed, 95% CI) | Subtotals only | |
| 4.1 Intervention versus pamphlet | 1 | 108 | Mean Difference (IV, Fixed, 95% CI) | 3.69 [‐0.29, 7.67] |
| 4.2 Intervention versus routine | 1 | 112 | Mean Difference (IV, Fixed, 95% CI) | 4.19 [0.15, 8.23] |
| Outcome or subgroup title | No. of studies | No. of participants | Statistical method | Effect size |
| 1 Pregnancy at 6 months postpartum Show forest plot | 1 | 439 | Odds Ratio (M‐H, Fixed, 95% CI) | 0.21 [0.02, 1.87] |
| 2 IUD use postpartum Show forest plot | 1 | 1560 | Odds Ratio (M‐H, Fixed, 95% CI) | 2.35 [1.82, 3.02] |
| 2.1 At 40 days | 1 | 1121 | Odds Ratio (M‐H, Fixed, 95% CI) | 2.76 [1.99, 3.82] |
| 2.2 At 6 months | 1 | 439 | Odds Ratio (M‐H, Fixed, 95% CI) | 1.79 [1.20, 2.69] |
| 3 Other method use postpartum Show forest plot | 1 | 1560 | Odds Ratio (M‐H, Fixed, 95% CI) | 1.16 [0.91, 1.49] |
| 3.1 At 40 days | 1 | 1121 | Odds Ratio (M‐H, Fixed, 95% CI) | 1.29 [0.93, 1.79] |
| 3.2 At 6 months | 1 | 439 | Odds Ratio (M‐H, Fixed, 95% CI) | 1.01 [0.69, 1.48] |
| 4 No contraceptive method use postpartum Show forest plot | 1 | 1560 | Odds Ratio (M‐H, Fixed, 95% CI) | 0.45 [0.36, 0.56] |
| 4.1 At 40 days | 1 | 1121 | Odds Ratio (M‐H, Fixed, 95% CI) | 0.43 [0.34, 0.56] |
| 4.2 At 6 months | 1 | 439 | Odds Ratio (M‐H, Fixed, 95% CI) | 0.48 [0.31, 0.75] |
| Outcome or subgroup title | No. of studies | No. of participants | Statistical method | Effect size |
| 1 Contraceptive use postpartum (HSM versus standard care) Show forest plot | 1 | Odds Ratio (M‐H, Fixed, 95% CI) | Subtotals only | |
| 1.1 At 4 months | 1 | 935 | Odds Ratio (M‐H, Fixed, 95% CI) | 2.07 [1.58, 2.71] |
| 1.2 At 10 to 12 months (if at risk) | 1 | 930 | Odds Ratio (M‐H, Fixed, 95% CI) | 2.08 [1.58, 2.74] |
| 2 Contraceptive use postpartum (HSM versus CAM) Show forest plot | 1 | Odds Ratio (M‐H, Fixed, 95% CI) | Subtotals only | |
| 2.1 At 4 months | 1 | 1031 | Odds Ratio (M‐H, Fixed, 95% CI) | 1.79 [1.40, 2.30] |
| 2.2 At 10 to 12 months (if at risk) | 1 | 1025 | Odds Ratio (M‐H, Fixed, 95% CI) | 1.24 [0.97, 1.59] |
| 3 Use of LAM at 4 months postpartum Show forest plot | 1 | Odds Ratio (M‐H, Fixed, 95% CI) | Subtotals only | |
| 3.1 HSM versus standard care | 1 | 935 | Odds Ratio (M‐H, Fixed, 95% CI) | 1.04 [0.72, 1.50] |
| 3.2 HSM versus CAM | 1 | 1031 | Odds Ratio (M‐H, Fixed, 95% CI) | 41.36 [10.11, 169.20] |
| 4 Knowlege of effective LAM use at 4 months postpartum (HSM versus standard care) Show forest plot | 1 | 136 | Odds Ratio (M‐H, Fixed, 95% CI) | 2.90 [0.91, 9.26] |
| Outcome or subgroup title | No. of studies | No. of participants | Statistical method | Effect size |
| 1 Pregnancy at 9 months postpartum Show forest plot | 1 | 959 | Odds Ratio (M‐H, Fixed, 95% CI) | 0.60 [0.41, 0.87] |
| 2 Use of modern contraceptive method at 9 months postpartum Show forest plot | 1 | 959 | Odds Ratio (M‐H, Fixed, 95% CI) | 3.08 [2.36, 4.02] |
| 3 Use of traditional contraceptive method at 9 months postpartum Show forest plot | 1 | 959 | Odds Ratio (M‐H, Fixed, 95% CI) | 0.69 [0.50, 0.93] |
| 4 No contraceptive use at 9 months postpartum Show forest plot | 1 | 959 | Odds Ratio (M‐H, Fixed, 95% CI) | 0.39 [0.30, 0.52] |