Aktiviti fizikal untuk wanita dengan barah payudara selepas terapi adjuvan
Referencias
References to studies included in this review
References to studies excluded from this review
References to studies awaiting assessment
References to ongoing studies
Additional references
References to other published versions of this review
Characteristics of studies
Characteristics of included studies [ordered by study ID]
| Methods | Study design: single‐centre RCT Number randomised: 18; 9 to yoga intervention, 9 to wait‐list control Study start: not reported; stop date: not reported Length of intervention: 8 weeks Length of follow‐up: to end of intervention Country: USA | |
| Participants | Age, years (mean SD):
Stage, n (%):
Inclusion criteria: • Women with stage II‐IV breast cancer who were at least 2 months post treatment Exclusion criteria: • Receiving Herceptin therapy (an immune modifier). • Pregnant or lactating • Past or current history of another neoplasm • Active serious infection, or immune deficiency • History of psychiatric disorders requiring use of psychoactive medications or of documented alcohol or drug abuse • Physical condition preventing participation in yoga | |
| Interventions | 9 participants assigned to exercise intervention:
Adherence: Seven participants in the yoga group who completed the study attended an average of 14 of 16 possible yoga sessions (87.5%) with a range of 12 to 15 sessions. 9 participants assigned to control:
Contamination of control group: not reported | |
| Outcomes | Outcomes:
Numbers of participants assessed:
Adverse events: not reported | |
| Notes | Trial registration link: none available Trial authors contacted: no Intention‐to‐treat analysis: no Funding: in part by University of Washington Center for Women’s Health and Gender Research, Washington State University Cancer Prevention and Research Center, and in part by Washington State University College of Nursing | |
| Risk of bias | ||
| Bias | Authors' judgement | Support for judgement |
| Random sequence generation (selection bias) | Unclear risk | “Randomly assigned”; method of randomisation was not reported. |
| Allocation concealment (selection bias) | Unclear risk | Whether allocation was concealed was not reported. |
| Blinding of participants and personnel (performance bias) | High risk | Owing to the nature of the intervention, it was not possible to conceal allocation to the intervention from participants. |
| Blinding of outcome assessment (detection bias) | Unclear risk | Blinding of outcome assessments was not described. |
| Incomplete outcome data (attrition bias) | High risk | Analyses included only 14 participants ‐ 7 in each group ‐ who completed the study. |
| Selective reporting (reporting bias) | High risk | Summary outcomes of FACT‐B were not provided (FACT‐B, FACT‐G, and TOI). |
| Other bias | Low risk | Trial appears to be free of other problems that could put it at high risk of bias. |
| Methods | Study design: single‐centre RCT Number randomised: 32; 20 to intervention, 12 to control Study start: not reported; stop date: not reported Length of intervention: 12 weeks Length of follow‐up: to end of intervention Country: USA | |
| Participants | Age, years (mean SD):
Stage, n (%):
Inclusion criteria: • Given a diagnosis of stage I‐III cancer, had completed adjuvant treatment within the previous 12 months, and were postmenopausal • Free of cardiovascular disease and major orthopaedic limitations • Not regularly active (< 5 days/week) | |
| Interventions | 20 participants assigned to exercise intervention:
Adherence:
12 participants assigned to control:
Contamination of control group: not reported | |
| Outcomes | Outcomes:
Numbers of participants assessed:
Adverse events: none reported | |
| Notes | Trial registration link: none available Trial authors contacted: yes, for additional data (means and SDs for outcomes), but trial authors did not reply Intention‐to‐treat analysis: no Funding: supported by the US Army, Grant # DAMD17‐01‐1‐0628 | |
| Risk of bias | ||
| Bias | Authors' judgement | Support for judgement |
| Random sequence generation (selection bias) | Unclear risk | "Participants were randomized 2:1 (intervention: control)". It is unclear how the allocation sequence was generated. |
| Allocation concealment (selection bias) | Unclear risk | Whether treatment assignment was concealed from study personnel and participants was not described. |
| Blinding of participants and personnel (performance bias) | High risk | Owing to the nature of the intervention, it was not possible to conceal allocation to the intervention from participants. |
| Blinding of outcome assessment (detection bias) | Unclear risk | Blinding of outcome assessments was not described. |
| Incomplete outcome data (attrition bias) | High risk | Post‐test data at 12 weeks were collected on 94% of participants; only completers were analysed. |
| Selective reporting (reporting bias) | High risk | Physical activity data post intervention were not reported. |
| Other bias | Low risk | Trial appears to be free of other problems that could put it at high risk of bias. |
| Methods | Study design: single‐centre RCT Number randomised: 60; 30 to intervention, 25 to standard care Study start: April 2003; stop date: April 2004 Length of intervention: 6 months Length of follow‐up: to end of intervention Country: USA | |
| Participants | Age, years (mean SD):
Stage, n (%):
Inclusion criteria: • Within 7 years of a breast cancer diagnosis • No longer receiving treatment for breast cancer (except hormone therapy) • Not engaging in focussed moderate physical activity for 30 minutes or longer a day most days of the week Exclusion criteria: • Clearance received from physician to ensure that they had no medical conditions contraindicating moderately intensive exercise | |
| Interventions | 35 participants assigned to exercise intervention:
Adherence: Among those who started the intervention, the mean number of sessions attended was 14.6 out of 21 (SD 5.1), with a range of 2 to 21 sessions. 25 participants assigned to control:
| |
| Outcomes | Outcomes:
Numbers of participants assessed:
Adverse events: The intervention group did not show a significantly larger number of increases in arm circumference compared with the standard care group. | |
| Notes | Trial registration link: none available Trial authors contacted: no Intention‐to‐treat analysis: yes Funding: grants R21 CA89519 and R25 CA57730 from the National Cancer Institute | |
| Risk of bias | ||
| Bias | Authors' judgement | Support for judgement |
| Random sequence generation (selection bias) | Low risk | “Participants were assigned to study arms using a form of adaptive randomization called minimization”. |
| Allocation concealment (selection bias) | Unclear risk | Whether the allocation was concealed is unclear. |
| Blinding of participants and personnel (performance bias) | High risk | Owing to the nature of the intervention, it was not possible to conceal allocation to the intervention from participants. |
| Blinding of outcome assessment (detection bias) | Low risk | Staff conducting assessments were blind to participants’ study condition. |
| Incomplete outcome data (attrition bias) | Low risk | All participants who were randomised were included in the analysis, regardless of their attendance at intervention sessions. Data for participants who did not complete the 6‐month assessment were imputed based on regression models predicting outcomes in the remaining sample, using covariates and design variables. |
| Selective reporting (reporting bias) | Unclear risk | No selective reporting of outcomes is apparent. |
| Other bias | High risk | Imbalance between numbers allocated to intervention and control groups could potentially lead to additional bias. |
| Methods | Study design: single‐centre RCT Number randomised: 18; 9 to intervention, 9 to control Study start, not reported; stop date, not reported Length of intervention: 8 weeks Length of follow‐up: to end of intervention Country: USA | |
| Participants | Age:
Stage:
Inclusion criteria: • Minimum of 8 weeks post chemotherapy • Oestrogen receptor positive status • Surgery for lumpectomy, modified mastectomy, or full mastectomy (with/without reconstruction) • Life expectancy greater than 6 months • Adequate blood cell counts and kidney, liver, and cardiac function • Physical and mental ability to attend all yoga training sessions Exclusion criteria: • Receiving Herceptin therapy, current steroid therapy, or other known immunomodulating medications • Pregnancy or current lactation • Past or current history of another neoplasm, active serious infection, or immune deficiency • History of psychiatric disorders requiring use of psychotropic medications | |
| Interventions | 9 participants assigned to exercise intervention:
Adherence: not reported 9 participants assigned to control:
| |
| Outcomes | Outcomes:
Numbers of participants assessed:
Adverse events: not reported | |
| Notes | Trial registration link: none available Trial authors contacted: no Intention‐to‐treat analysis: unclear Funding: not reported | |
| Risk of bias | ||
| Bias | Authors' judgement | Support for judgement |
| Random sequence generation (selection bias) | Unclear risk | "Women were randomized", but it was unclear how the allocation sequence was generated. |
| Allocation concealment (selection bias) | Unclear risk | Whether treatment assignment was concealed from study personnel and participants was not described. |
| Blinding of participants and personnel (performance bias) | High risk | Owing to the nature of the intervention, it was not possible to conceal allocation to the intervention from participants. |
| Blinding of outcome assessment (detection bias) | Unclear risk | Blinding of outcome assessments was not described. |
| Incomplete outcome data (attrition bias) | Unclear risk | It is unclear how many participants were included in each outcome assessment. |
| Selective reporting (reporting bias) | High risk | Outcome measures were poorly described and reported. Scores for each question were not reported. |
| Other bias | High risk | Outcomes were not assessed at baseline, so it was not possible to assess whether outcomes changed as a result of intervention. |
| Methods | Study design: single‐centre RCT Country: USA | |
| Participants | Age, years (mean SD):
Stage, n (%):
Inclusion criteria: • Original diagnosis of stage 0‐II breast cancer • Completed local and/or adjuvant cancer therapy (with the exception of hormone therapy) at least 6 months previously • Ages 40 to 65 years • Postmenopausal • No other cancer in the past 5 years • Experiencing persistent cancer‐related fatigue Exclusion criteria: • Chronic medical conditions or regular use of medications associated with fatigue (e.g. untreated hypothyroidism, diabetes, autoimmune disease, anaemia (defined as haematocrit < 24), chronic fatigue syndrome) • Evidence that fatigue was driven primarily by a medical or psychiatric disorder other than cancer (e.g. current major depression, insomnia, sleep apnoea) • Evidence that fatigue was driven primarily by other non‐cancer‐related factors (e.g. shift work, recent change in activity or schedule) • Body mass index (BMI) > 31 kg/m² | |
| Interventions | 16 participants assigned to exercise intervention: Adherence: Over 80% of participants attending at least 20 of the 24 yoga classes offered. Mean number of classes attended was 18.9 of 24 classes (78%), and median number was 22 of 24 classes (92%). At 3‐month follow‐up, 9 of 14 women who attended the yoga classes (64%) were continuing to use techniques learned in class. Control group: 15 assigned to control: Adherence: In the education group, the mean number of classes attended was 9.2 of 12 classes (77%), and the median number was 11 of 12 classes (92%). | |
| Outcomes | Primary outcome:
Secondary outcomes:
Numbers of participants assessed:
.Adverse events: none reported | |
| Notes | Trial registration link: none available Trial authors contacted: no Intention‐to‐treat analysis: yes Funding: National Center for Complementary and Alternative Medicine/National Institutes of Health (NCCAM/NIH U01‐AT003682; Iyengar Yoga for Breast Cancer Survivors with Persistent Fatigue) | |
| Risk of bias | ||
| Bias | Authors' judgement | Support for judgement |
| Random sequence generation (selection bias) | Unclear risk | "Allocation sequence was generated independently by the study statistician", but it is unclear how the allocation sequence was generated. |
| Allocation concealment (selection bias) | Unclear risk | "Allocation was concealed in opaque envelopes" but whether "sequential" is not mentioned. |
| Blinding of participants and personnel (performance bias) | High risk | Owing to the nature of the intervention, it was not possible to blind participants; however, it is unclear whether the outcome was influenced by lack of masking. |
| Blinding of outcome assessment (detection bias) | Low risk | "Outcomes assessors for the performance tasks were blinded to group assignment, and all were trained in standardized testing procedures". |
| Incomplete outcome data (attrition bias) | Low risk | "All statistical analyses were performed on an intent‐to‐treat basis". Mixed model analysis was used to account for missing data. |
| Selective reporting (reporting bias) | Low risk | No selective reporting of outcomes is apparent. |
| Other bias | Low risk | Trial appears to be free of other problems that could put it at high risk of bias. |
| Methods | Study design: single‐centre RCT Number randomised for 6‐month study: 75; to intervention; 37, to control, 38 Number randomised for 12‐month study: 50; to intervention, 25; to control, 25 Study start: March 2004; stop date: July 2006 Length of intervention: 6 months; subsample study: 12 months Length of follow‐up: to end of intervention Country: USA | |
| Participants | Age, years (mean SD):
Stage, n (%):
Inclusion criteria: • Postmenopausal women • Ages 40 to 75 years • Stage 0‐IIIA breast cancer • 1 to 10 years post diagnosis • ≥ 12 months post completion of adjuvant treatment • Physically able to exercise and physician consent to begin an exercise programme • Sedentary activity pattern (< 60 minutes/week) Exclusion criteria: • Diagnosis of recurrent or other primary cancer event • Current smoker • Diabetes mellitus • Current or planned enrolment in a structured weight loss programme | |
| Interventions | 37 participants assigned to exercise intervention:
Adherence:
38 participants assigned to control:
| |
| Outcomes | Outcomes:
Numbers of participants assessed:
Adverse events: none reported | |
| Notes | Trial registration link: none available Trial authors contacted: no Intention‐to‐treat analysis: yes but last observation carried forward (LOCF) Funding: Lance Armstrong Foundation, American Cancer Society, Susan G. Komen. In part by the National Center of Research Resources (NIH) | |
| Risk of bias | ||
| Bias | Authors' judgement | Support for judgement |
| Random sequence generation (selection bias) | Low risk | Random number generator was used. |
| Allocation concealment (selection bias) | Low risk | “The randomization code for each participant was obtained by the principal investigator (who was not involved in recruitment or data collection) only after baseline measures for that individual had been completed and staff conducting clinic visits did not have access to the randomization program”. |
| Blinding of participants and personnel (performance bias) | High risk | Owing to the nature of the intervention, it was not possible to conceal allocation to the intervention from participants. |
| Blinding of outcome assessment (detection bias) | Low risk | Study personnel and outcome assessors were not masked or blinded to study interventions. |
| Incomplete outcome data (attrition bias) | High risk | Last observation carried forward (LOCF) approach was used; “baseline QoL values were carried forward”. |
| Selective reporting (reporting bias) | Low risk | No selective reporting of outcomes is apparent. |
| Other bias | Low risk | Trial appears to be free of other problems that could put it at high risk of bias. |
| Methods | Study design: single‐centre RCT Numbers allocated, 68; 34 to exercise intervention; 34 to usual care Study start: March 2009; stop date: June 2010 Length of intervention: 8 weeks Length of follow‐up: at 6 months after discharge Country: Spain | |
| Participants | Age, years (mean SD):
Stage, n (%):
Inclusion criteria: • Between 25 and 65 years old with a diagnosis of breast cancer (stage I‐IIIA) • Finished oncology treatment except hormone therapy in the previous 18 months • Exhibit clinically significant fatigue (> 3 in total score on the Piper Fatigue Scale) Exclusion criteria: • Receiving oncology treatment at the time of the study • Physical limitations associated with orthopaedic conditions | |
| Interventions | 34 participants assigned to exercise intervention:
Adherence:
34 participants assigned to control:
| |
| Outcomes | Primary outcomes:
Secondary outcomes:
Numbers of participants assessed:
Adverse events: Adverse effects reported during the study included discomfort or low‐intensity pain/stiffness after an exercise session in 3 participants; nevertheless, they continued the programme. | |
| Notes | Trial registration link: none available Trial authors contacted: no Intention‐to‐treat analysis: no Funding: Health Institute Carlos III and PN I+D+I 2008‐2011, Madrid, Spanish government (grant no. FIS PI10/02749); Research Office of the University of Granada, Spain | |
| Risk of bias | ||
| Bias | Authors' judgement | Support for judgement |
| Random sequence generation (selection bias) | Low risk | Computer‐generated numbers produced a sequence that was entered into opaque envelopes. |
| Allocation concealment (selection bias) | Low risk | “Computer‐generated number sequence was entered into opaque envelopes. These envelopes were opened by a blinded researcher after the first outcome measurement”. |
| Blinding of participants and personnel (performance bias) | High risk | Owing to the nature of the intervention, it was not possible to conceal allocation to the intervention from participants. |
| Blinding of outcome assessment (detection bias) | Low risk | Assessors were blinded to treatment allocation. |
| Incomplete outcome data (attrition bias) | High risk | Only those who completed postintervention and 6‐month assessments were included in analysis. |
| Selective reporting (reporting bias) | Low risk | No selective reporting of outcomes is apparent. |
| Other bias | Low risk | Trial appears to be free of other problems that could put it at high risk of bias. |
| Methods | Study design: single‐centre RCT Number randomised: 37; 17 to intervention, 20 to control Study start: June 2005; stop date: October 2006 Length of intervention: 8 weeks Length of follow‐up: at 8 weeks, at 3 months Country: USA | |
| Participants | Age, years (mean SD):
Stage, n (%):
Inclusion criteria: • At least 1 hot flash per day on 4 or more days per week • No signs of active breast cancer • No current cytotoxic chemotherapy • Diagnosis of breast cancer at stage IA‐IIB ≥ 2 years before • No hormone replacement therapy currently or within prior 3 months • Stabilised on a constant regimen of menopausal symptom medications and supplements for at least 3 weeks • Taking antidepressants, stabilised at a fixed dose for at least 3 months Exclusion criteria: • Resided > 70 miles from the research site and thus were less likely to attend intervention sessions • Unavailable to attend the intervention on the day and at the time offered (most yoga groups were scheduled so as to be accessible to women holding full‐time day jobs) • Currently engaged in intensive yoga practice (> 3 days/week) • Received treatment for serious psychiatric disorders (e.g. schizophrenia) in the previous 6 months • Not English speaking | |
| Interventions | 17 participants assigned to exercise intervention:
Adherence: On average, participants attended 6 of the 8 classes (range 0 to 8). Only 3 women attended < 4 classes. Adherence to daily yoga practice, average 30 minutes/d at post and 16 minutes at 3 months Control group: 20 assigned to control:
| |
| Outcomes | Treatment outcomes. assessed via a brief daily diary measurement strategy
Numbers of participants assessed:
Adverse events: not reported | |
| Notes | Trial registration link: none available Trial authors contacted: yes, for means and SDs for outcomes. However, trial authors did not provide these data. Intention‐to‐treat analysis: no Funding: Susan G. Komen Breast Cancer Foundation | |
| Risk of bias | ||
| Bias | Authors' judgement | Support for judgement |
| Random sequence generation (selection bias) | Low risk | Random number table was used. |
| Allocation concealment (selection bias) | High risk | "Concealed in envelopes"; sequential sequencing or opaque envelopes were not mentioned. |
| Blinding of participants and personnel (performance bias) | High risk | Owing to the nature of the intervention, it was not possible to blind participants; however, it is unclear whether the outcome was influenced by lack of masking. |
| Blinding of outcome assessment (detection bias) | Low risk | Research assistant collecting assessment data was kept blind with regard to participant condition assignments. |
| Incomplete outcome data (attrition bias) | High risk | No ITT, and no mention of how missing data were handled. 8 participants did not complete the intervention. |
| Selective reporting (reporting bias) | Low risk | No selective reporting of outcomes is apparent. |
| Other bias | Low risk | Trial appears to be free of other problems that could put it at high risk of bias. |
| Methods | Study design: single‐centre RCT Country: Italy | |
| Participants | Age, years (mean SD):
Stage, n (%):
Inclusion criteria: • Age 40 to 50 years • Conclusion of all cancer‐related treatments at least 6 months previously • Mastectomy • No external physical activity for at least the preceding 12 months • Medical eligibility for non‐competitive athletic activity | |
| Interventions | 10 participants assigned to exercise intervention:
Adherence: not reported 10 assigned to control:
| |
| Outcomes | Outcomes:
Numbers of participants assessed:
Adverse events: none reported | |
| Notes | Trial registration link: none available Trial authors contacted: no Intention‐to‐treat analysis: no dropouts reported Funding: not reported | |
| Risk of bias | ||
| Bias | Authors' judgement | Support for judgement |
| Random sequence generation (selection bias) | Unclear risk | "Patients were randomly divided into two groups". It is unclear how the allocation sequence was generated. |
| Allocation concealment (selection bias) | Unclear risk | Whether treatment assignment was concealed from study personnel and participants was not described. |
| Blinding of participants and personnel (performance bias) | High risk | Owing to the nature of the intervention, it was not possible to blind participants. |
| Blinding of outcome assessment (detection bias) | Unclear risk | Whether study personnel and outcome assessors were masked or blinded to study interventions was not reported. |
| Incomplete outcome data (attrition bias) | Low risk | No dropouts were reported. |
| Selective reporting (reporting bias) | Low risk | No selective reporting of outcomes is apparent. |
| Other bias | Low risk | Trial appears to be free of other problems that could put it at high risk of bias. |
| Methods | Study design: RCT Number randomised: 62; 22 to high‐load resistance exercise, 21 to low‐load resistance exercise, 19 to control Study start: June 2010; stop date: not stated Length of intervention: 3 months Length of follow‐up: to end of intervention Country: Australia | |
| Participants | Age, years (mean SD):
Stage, n (%):
Time since cancer diagnosis, mean (SD) years:
Inclusion criteria: • Histological diagnosis of breast cancer at least 1 year before the study • Clinical diagnosis of breast cancer‐related lymphoedema and medical clearance from general practitioner • Clinical diagnosis of lymphoedema defined as having at least a 5% inter‐limb discrepancy in volume or circumference at the point of greatest visible difference Exclusion criteria: • Unstable lymphoedema defined as receiving intensive therapy (i.e. decongestive therapy or antibiotics for infection) within the previous 3 months • Musculoskeletal, cardiovascular, and/or neurological disorder that could inhibit exercise | |
| Interventions | 43 participants assigned to 1 of 2 resistance exercise interventions
Adherence: Exercise attendance was high for both resistance training groups, with an average of 23.2 ± 1.9 out of a possible 24 sessions attended (HLRE 23.4 ± 1.1; LLRE 22.9 ± 2.4). 19 participants assigned to control:
| |
| Outcomes | Primary outcome:
Secondary outcomes:
Numbers of participants assessed:
Adverse events: No lymphoedema exacerbations or any other adverse events were reported. | |
| Notes | Trial registration link: ACTRN12610000788077 (http://www.anzctr.org.au/ACTRN12610000788077.aspx) Trial authors contacted: no Intention‐to‐treat analysis: yes, but using LOCF Funding: Edith Cowan University and University of Canberra | |
| Risk of bias | ||
| Bias | Authors' judgement | Support for judgement |
| Random sequence generation (selection bias) | Low risk | Participants were randomised in an allocation ratio of 1:1:1 by a random assignment computer programme. |
| Allocation concealment (selection bias) | Low risk | Exercise physiologists involved in assigning participants to groups were blinded to the allocation sequence. |
| Blinding of participants and personnel (performance bias) | High risk | Owing to the nature of the intervention, it was not possible to conceal allocation to the intervention from participants. |
| Blinding of outcome assessment (detection bias) | Unclear risk | Blinding of outcome assessments was not described. |
| Incomplete outcome data (attrition bias) | High risk | Missing data were addressed by imputing change across time as zero. |
| Selective reporting (reporting bias) | Low risk | No selective reporting of outcomes is apparent. |
| Other bias | Low risk | Trial appears to be free of other problems that could put it at high risk of bias. |
| Methods | Study design: single‐centre RCT Number randomised: 53; intervention, 25; control, 28 Study start: May 2001; stop date: June 2001 Length of intervention: 15 weeks Length of follow‐up: to end of intervention Country: Canada | |
| Participants | Age, years (mean SD):
Stage, n (%):
Inclusion criteria: • Histologically confirmed stage I‐IIIB breast cancer • Diagnosis between January 1999 and June 2000 • Completed surgery, radiotherapy, and/or chemotherapy (≥ 6 months before randomisation) with or without current tamoxifen or arimidex therapy • Postmenopausal (not experiencing menstrual periods for previous 12 months) • Non‐smokers (not smoking for previous 12 months) • Between 50 and 69 years of age • English‐speaking • Willing to travel to the exercise facility Exclusion criteria: • Known cardiac disease • Uncontrolled hypertension • Uncontrolled thyroid disease • Diabetes • Mental illness • Infection • Immune or endocrine abnormality • Body weight reduction ≥ 10% in the past 6 months • Positive exercise stress test | |
| Interventions | 25 participants assigned to exercise intervention:
Adherence: Exercise group completed 98.4% (44.3 of 45) of prescribed exercise sessions. 28 participants assigned to control:
| |
| Outcomes | Primary outcomes:
Other outcomes:
Numbers of participants assessed:
Adverse events:
| |
| Notes | Trial registration link: none available Trial authors contacted: no Intention‐to‐treat analysis: no Funding: NCIC, CCS, Canadian Institutes of Health Research, Izaak Walton Killiam Memorial Scholarship, Alberta Heritage Foundation for Medical Research studentship | |
| Risk of bias | ||
| Bias | Authors' judgement | Support for judgement |
| Random sequence generation (selection bias) | Low risk | Random numbers table. Block permutation procedure was used. |
| Allocation concealment (selection bias) | Low risk | “The allocation sequence and group assignments were generated by a research assistant and then enclosed in sequentially numbered and sealed envelopes”. |
| Blinding of participants and personnel (performance bias) | High risk | Owing to the nature of the intervention, it was not possible to conceal allocation to the intervention from participants. |
| Blinding of outcome assessment (detection bias) | Unclear risk | Participants were not blinded for self‐report measures. Participants were blinded to their exercise test results until after the trial. Exercise physiologists were blinded for physical outcome measures. Laboratory staff and those who assessed study endpoints were blinded to treatment assignment. |
| Incomplete outcome data (attrition bias) | Low risk | One study participant withdrew from the intervention group. Two participants withdrew from the control group and were not included in cardiopulmonary outcome analyses. Only 1 participant who had withdrawn from the exercise group was missing from QoL analyses. |
| Selective reporting (reporting bias) | Low risk | No selective reporting of outcomes is apparent. |
| Other bias | Low risk | Trial appears to be free of other problems that could put it at high risk of bias. |
| Methods | Study design: single‐centre quasi‐RCT Number randomised: 42; 22 to intervention, 20 to control Study start: September 2010; stop date: July 2012 Length of intervention: 8 weeks Length of follow‐up: to end of intervention Country: Spain | |
| Participants | Age, years (mean SD):
Stage, n (%):
Inclusion criteria: • History of primary breast cancer • Within 1 year of cancer diagnosis • Aged 25 to 65 years • Post cancer treatment in the past 6 months (eligible if receiving hormone therapy) • Cancer‐free at the time of study enrolment Exclusion criteria: • Fear of aquatic exercise that would prevent participation in deep water running programme | |
| Interventions | 22 participants assigned to 8‐week exercise intervention:
Adherence: 42 participants attended more than 80% of the 24 treatment sessions. Although 2 intervention participants reported ‘wake up tired in the morning’ after 1 session, this event did not impact programme completion and was not repeated. 22 participants assigned to control:
| |
| Outcomes | Primary outcome:
Other outcomes:
Numbers of participants assessed:
Adverse events: No further adverse events were associated with participation in the intervention. | |
| Notes | Trial registration link: none available Trial authors contacted: no Intention‐to‐treat analysis: No missing data were reported. Funding: not reported | |
| Risk of bias | ||
| Bias | Authors' judgement | Support for judgement |
| Random sequence generation (selection bias) | High risk | Participants were allocated in order of arrival to complete each group. |
| Allocation concealment (selection bias) | High risk | Allocation was not concealed from researchers. |
| Blinding of participants and personnel (performance bias) | High risk | Owing to the nature of the intervention, it was not possible to conceal allocation to the intervention from participants. |
| Blinding of outcome assessment (detection bias) | Low risk | “Assessor, who was blinded to participant group allocation” |
| Incomplete outcome data (attrition bias) | Low risk | No missing data were reported. |
| Selective reporting (reporting bias) | Low risk | No selective reporting of outcomes is apparent. |
| Other bias | Low risk | Trial appears to be free of other problems that could put it at high risk of bias. |
| Methods | Study design: single‐centre RCT Number randomised: 108; 34 to exercise therapy, 36 to exercise placebo, 38 to control Study start: January 2003; stop date: July 2005 Length of intervention: 8 weeks Length of follow‐up: at 24 weeks Country: UK | |
| Participants | Age, years (mean SD):
Stage:
Inclusion criteria: • Women who were not regularly active • Treated for localised breast cancer 12 to 36 months • Aged 18 to 65 years • Willing to attend supervised exercise sessions 3 times per week for 8 weeks • Exercise pre‐contemplator, contemplator, or preparer as defined by the TTM Exclusion criteria: • Women with metastases • Inoperable or active locoregional disease determined ineligible by clinician • Physical or psychiatric impairment that would seriously influence physical mobility • Nausea, anorexia, or other diseases affecting health • High activity level • Contraindication to exercise, assessed by Physical Activity Readiness | |
| Interventions | 34 participants assigned to 8‐week exercise intervention:
36 participants assigned to exercise placebo:
Adherence: Attended at least 70% (at least 17 of 24 sessions) of sessions; exercise therapy group, 77%; exercise placebo group, 88.9% 38 participants assigned to control:
| |
| Outcomes | Primary outcomes:
Secondary outcomes:
Numbers of participants assessed:
Adverse events: not reported | |
| Notes | Trial registration link: none available Trial authors contacted: yes, trial authors provided additional outcome data Intention‐to‐treat analysis: unclear Funding: Cancer Research UK (grant number: CE8304) | |
| Risk of bias | ||
| Bias | Authors' judgement | Support for judgement |
| Random sequence generation (selection bias) | Low risk | “performed using stratified random permuted blocks” |
| Allocation concealment (selection bias) | Low risk | Telephone randomisations service was provided by an independent trials unit. |
| Blinding of participants and personnel (performance bias) | High risk | Owing to the nature of the intervention, it was not possible to conceal allocation to the intervention from participants. |
| Blinding of outcome assessment (detection bias) | High risk | “Outcome assessors were not blinded to participants’ group allocation”. |
| Incomplete outcome data (attrition bias) | Unclear risk | “Data were analysed on an ITT basis” It is unclear how this was done. |
| Selective reporting (reporting bias) | Low risk | No selective reporting of outcomes is apparent. |
| Other bias | Low risk | Trial appears to be free of other problems that could put it at high risk of bias. |
| Methods | Study design: single‐centre RCT Country: USA | |
| Participants | Age, years (mean SD):
Stage, n (%):
Inclusion criteria: • Women aged 18 years or older • Confirmed diagnosis of breast cancer • Beginning second cycle of chemotherapy • Ability to read, write, and understand English • Mentally able to understand and able to provide written informed consent • Karnofsky Performance Scale (KPS) score > 60 Exclusion criteria: • Receiving concurrent radiotherapy for another disease • Had bone marrow transplantation • Uncontrolled hypertension or diabetes mellitus • Pain intensity rating ≥ 3 on a 0 to 10 numerical scale • Lytic bone lesion or other orthopaedic limitations • History of major depression or sleep disorders • Chemotherapy in the past year • Diagnosis of AIDS‐related malignancies or leukaemia • Absolute contradictions to exercise testing as established by American College of Sports Medicine (1995) | |
| Interventions | 66 participants assigned to exercise intervention (36 to EE, 30 to CE):
30 participants assigned to control:
Adherence: EE group reported adherence rate of 74% by end of intervention and 78% by end of follow‐up; CE group reported 86% adherence at end of intervention | |
| Outcomes | No primary outcome stated:
Outcomes measured: Adverse events: none reported | |
| Notes | Trial registration link: none available Trial authors contacted: no Intention‐to‐treat analysis: no missing data evident in this study | |
| Risk of bias | ||
| Bias | Authors' judgement | Support for judgement |
| Random sequence generation (selection bias) | Unclear risk | Generation of random sequence was not described. |
| Allocation concealment (selection bias) | Unclear risk | Whether treatment assignment was concealed from study personnel and participants was not described. |
| Blinding of participants and personnel (performance bias) | High risk | Owing to the nature of the intervention, it was not possible to conceal allocation to the intervention from participants. |
| Blinding of outcome assessment (detection bias) | Low risk | "Measurements of study variables were taken by research nurses who were blinded to the participants' group assignment". |
| Incomplete outcome data (attrition bias) | Low risk | No missing data were reported. |
| Selective reporting (reporting bias) | High risk | Data on cardiorespiratory fitness and on physical activity were not reported. |
| Other bias | High risk | Control group and intervention groups were reported as having similar activity levels as intervention groups post intervention, possible contamination. Low adherence rate of 74% by end of intervention and 78% at end of follow‐up in the intervention group |
| Methods | Study design: single‐centre RCT Number randomised: 212; 106 to early exercise group (EEG), 106 to delayed exercise group (DEG) Study start: not reported; stop date, not reported Length of intervention: 4 weeks. Length of follow‐up: at 6 to 8 weeks only in early exercise group Country: South Korea | |
| Participants | Baseline demographic and medical history variables for 32 in EEG and for 30 in DEG Age, years (mean SD):
Stage, n (%):
Inclusion criteria: • Not reported Exclusion criteria: • Evidence of recurrent disease or other musculoskeletal involvement such as low back pain, disc problems, osteoarthritis, rheumatoid arthritis, shoulder problems | |
| Interventions | 106 participants assigned to early exercise intervention:
Adherence: not reported 106 participants assigned to control:
| |
| Outcomes | Outcomes:
Numbers of participants assessed:
Adverse events: not reported | |
| Notes | Trial registration link: none available Trial authors contacted: no Intention‐to‐treat analysis: no Funding: not reported | |
| Risk of bias | ||
| Bias | Authors' judgement | Support for judgement |
| Random sequence generation (selection bias) | Low risk | "1:1 ratio using a computer‐generated allocation sequence” |
| Allocation concealment (selection bias) | Unclear risk | Whether allocation was concealed was not reported. |
| Blinding of participants and personnel (performance bias) | High risk | Owing to the nature of the intervention, it was not possible to conceal allocation to the intervention from participants. |
| Blinding of outcome assessment (detection bias) | Unclear risk | Not mentioned whether study personnel and outcome assessors were masked or blinded to study interventions |
| Incomplete outcome data (attrition bias) | High risk | Analysis performed only on “completers”; withdrawals not included in analysis. |
| Selective reporting (reporting bias) | Low risk | No selective reporting of outcomes is apparent. |
| Other bias | High risk | Dropout rate was high (71%). |
| Methods | Study design: single‐centre RCT Number randomised: 36, 12 to aerobic interval training (AIT), 12 to continuous moderate training (CMT), 12 to control Study start: February 2013; stop date: December 2014 Length of intervention: 6 weeks Length of follow‐up: at 3 months for physical activity Country: Canada | |
| Participants | Age, years (mean SD):
Stage, n (%):
Time since cancer diagnosis, mean years:
Inclusion criteria: • Completed different combinations of surgery, chemotherapy, radiation, and hormonal therapy for early‐stage breast cancer (stage I‐IIIA) • Postmenopausal status was a set condition to minimise possible confounding factors associated with oestrogen status, treatment, and exercise response. Exclusion criteria: • Received diagnosis of metastatic disease, uncontrolled hypertension, history of cardiac disease, or pulmonary disease • Did not receive approval from physician to participate • Age > 75 years • BMI> 40 kg/m² • Could not commit to 18 exercise sessions in 6 weeks • Any other contraindications to exercise | |
| Interventions | 23 participants assigned to 1 of 2 exercise interventions:
Adherence: CMT group (n = 11) completed 17.8 sessions that took an average of 40 minutes to complete and covered a total distance of 65.34 km. AIT group (n = 12) completed 17.8 high‐intensity interval sessions in average time of 36 minutes and covered a total distance of 64.86 km. At 3 months, 92% of women in the AIT group reported achieving or superseding the recommended weekly exercise dose according to guidelines. Only 42% of individuals in the CMT group reported meeting the recommended dose. 10 participants assigned to control:
| |
| Outcomes | Primary outcomes:
Secondary outcomes:
Numbers of participants assessed:
Adverse events: No adverse events occurred during supervised exercise sessions or were self‐reported by participants. | |
| Notes | Trial registration link: none available Trial authors contacted: no Intention‐to‐treat analysis: no Funding: BC Sports Medicine Research Foundation | |
| Risk of bias | ||
| Bias | Authors' judgement | Support for judgement |
| Random sequence generation (selection bias) | Unclear risk | “Randomly assigned”; method of randomisation not reported |
| Allocation concealment (selection bias) | Unclear risk | Whether allocation was concealed was not reported. |
| Blinding of participants and personnel (performance bias) | High risk | Owing to the nature of the intervention, it was not possible to conceal allocation to the intervention from participants. |
| Blinding of outcome assessment (detection bias) | Unclear risk | Not mentioned whether study personnel and outcome assessors were masked or blinded to study interventions |
| Incomplete outcome data (attrition bias) | High risk | Analysis performed only on “completers”; withdrawals not included in analysis |
| Selective reporting (reporting bias) | Low risk | No selective reporting of outcomes is apparent. |
| Other bias | Low risk | Trial appears to be free of other problems that could put it at high risk of bias. |
| Methods | Study design: multi‐centre RCT Number randomised: 422; 109 to cognitive‐behavioural therapy (CBT); 104 to physical exercise; 106 to CBT and physical exercise combined; 103 to control group Study start: January 2008; recruitment stop date: December 2009 Length of intervention: 12 weeks Length of follow‐up: at 6 months (at 3 months post intervention) Country: Netherlands | |
| Participants | Age, years (mean SD):
Stage:
Inclusion criteria: • Primary breast cancer (stages T1‐4, N0‐1, and M0) • Younger than 50 years and premenopausal at diagnosis • Had received adjuvant chemotherapy and/or hormonal therapy • Disease‐free at study entry • Reported at least a minimal level of menopausal symptoms • Chemotherapy had to be completed at least 4 months before but not more than 5 years before study entry (hormonal therapy could still be ongoing) Exclusion criteria: • Lack of basic proficiency in Dutch • Serious cognitive or psychiatric problems • Serious physical comorbidity • Obesity (body mass index > 35), because exercise may be contraindicated as a treatment for hot flashes in obese women • Participating in concurrent studies targeted at menopausal symptoms or involving similar interventions | |
| Interventions | 109, 104, and 106 participants were assigned to CBT, exercise and CBT, and exercise 12‐week intervention, respectively:
Adherence:
103 participants assigned to control:
| |
| Outcomes | Primary outcomes:
Secondary outcomes:
Numbers of participants assessed:
Adverse events: not reported | |
| Notes | Trial registration link: https://clinicaltrials.gov/ct2/show/NCT00582244 Trial authors contacted: no Intention‐to‐treat analysis: no Funding: supported by grant No. NKI 2006‐3470 from the Dutch Cancer Society; the Integral Cancer Center, Amsterdam; the Pink Ribbon Foundation; and Polar Electro Nederland | |
| Risk of bias | ||
| Bias | Authors' judgement | Support for judgement |
| Random sequence generation (selection bias) | Low risk | “Computerized block randomization” |
| Allocation concealment (selection bias) | Unclear risk | Whether treatment assignment was concealed from study personnel and participants was not described. Centralised randomisation was not mentioned. |
| Blinding of participants and personnel (performance bias) | High risk | Owing to the nature of the intervention, it was not possible to conceal allocation to the intervention from participants. |
| Blinding of outcome assessment (detection bias) | Unclear risk | No mention of whether study personnel and outcome assessors were masked or blinded to study interventions |
| Incomplete outcome data (attrition bias) | High risk | “Missing values were replaced by the average score of the completed items in the same scale for each individual, provided that at least 50% of the items in that scale had been completed”. |
| Selective reporting (reporting bias) | Low risk | No selective reporting of outcomes is apparent. |
| Other bias | Low risk | Trial appears to be free of other problems that could put it at high risk of bias. |
| Methods | Study design: single‐centre RCT Number randomised: 60; 20 to supervised exercise, 20 to home exercise, 20 to control Study start: not reported; stop date: not reported Length of intervention: 12 weeks Length of follow‐up: to end of intervention Country: Turkey | |
| Participants | Age, years (mean SD):
Stage, n (%):
Inclusion criteria: • Completion of surgical therapy, radiation therapy, and chemotherapy • Postmenopausal • Not smoking in the past year • Agreeing to participate in the study • Absence of any physical condition that would prevent exercising • Having the cognitive capacity to answer the questions Exclusion criteria: • Recurrent or progressing breast cancer, lymphoedema, serious cardiac disease or unregulated hypertension, acute or chronic respiratory disease, mental disease, any infection, any immune or endocrinological disorder that would alter immune indicators, rheumatic disease, serious musculoskeletal disease (that would hinder exercising) • Loss of more than 10% of body weight in the past 6 months • Attended a regular exercise programme in the past 6 months | |
| Interventions | 40 participants assigned to two 12‐week exercise interventions:
Adherence: No data on adherence were reported. 20 participants assigned to control:
| |
| Outcomes | Primary outcomes:
Secondary outcomes:
Numbers of participants assessed:
Adverse events: No participants experienced any side effects or developed lymphoedema (although 1 participant developed metastasis). | |
| Notes | Trial registration link: none available Trial authors contacted: no Intention‐to‐treat analysis: unclear Funding: supported by Ege University Medical Faculty BAP project (Project Number: 2010‐TIP‐069) | |
| Risk of bias | ||
| Bias | Authors' judgement | Support for judgement |
| Random sequence generation (selection bias) | Low risk | Using random numbers table |
| Allocation concealment (selection bias) | Unclear risk | Whether treatment assignment was concealed from study personnel and participants was not described. |
| Blinding of participants and personnel (performance bias) | High risk | Owing to the nature of the intervention, it was not possible to conceal allocation to the intervention from participants. |
| Blinding of outcome assessment (detection bias) | Low risk | “Molecular biologists that performed the measurements and the oncology specialist who made the assessment were blind to the exercise groups of the patients”. |
| Incomplete outcome data (attrition bias) | Unclear risk | Missing data handling methods were not reported. |
| Selective reporting (reporting bias) | Low risk | No selective reporting of outcomes is apparent. |
| Other bias | Low risk | Trial appears to be free of other problems that could put it at high risk of bias. |
| Methods | Study design: single‐centre RCT Number randomised: 94; 48 to intervention group, 46 to control group Study start: not reported; stop date: not reported Length of intervention: 4 weeks Length of follow‐up: at 3 months Country: Canada | |
| Participants | Age, years (mean SD):
Stage, n (%):
Inclusion criteria: • Diagnosis of initial non‐metastatic breast cancer • Completion of initial breast cancer treatment no longer than 2 years before enrolment • Receipt of 1 series of adjuvant treatments of radiation therapy, or had received radiation therapy in combination with other adjuvant treatments (e.g. chemotherapy, hormonal therapy) • Ability to understand and speak French • Residence near the cancer centre • Availability to take part in a series of 4 weekly sessions • Acceptance of randomisation procedure pass revised Physical Activity Readiness Medical Examination • Authorisation of supervising physician before performing fitness assessment Exclusion criteria: • Clinical levels of depression symptoms, as measured by HADS (score > 10) • Insomnia, as defined by the Diagnostic and Statistical Manual of Mental Disorders, Fourth Edition • Any symptom of cancer recurrence • Known severe health problems other than cancer | |
| Interventions | 48 participants assigned to exercise intervention:
Adherence:
Co‐intervention: psychoeducational fatigue management 46 participants assigned to control:
| |
| Outcomes | Primary outcome:
Other outcomes:
Numbers of participants assessed:
Adverse events: cancer recurrence: 2 in exercise group, 1 in control group | |
| Notes | Trial registration link: none available Trial authors contacted: no Intention‐to‐treat analysis: no Funding: Fonds de Recherche en Sante du Quebec, Investigator Award | |
| Risk of bias | ||
| Bias | Authors' judgement | Support for judgement |
| Random sequence generation (selection bias) | Low risk | Sequence of randomisation was “computer generated”. |
| Allocation concealment (selection bias) | Unclear risk | “Sealed envelopes, which were concealed to both kinesiologist and patient”; no mention of whether they were sequential or opaque |
| Blinding of participants and personnel (performance bias) | High risk | Owing to the nature of the intervention, it was not possible to conceal allocation to the intervention from participants. |
| Blinding of outcome assessment (detection bias) | High risk | Study personnel and outcome assessors were not masked or blinded to study interventions. |
| Incomplete outcome data (attrition bias) | High risk | Four participants from the exercise group were not included in the analyses (withdrew, n = 1; cancer recurrence, n = 2; metastatic breast cancer diagnosis, n = 1); 3 participants from the control group were not included in the analyses (withdrew, n = 2; cancer recurrence, n = 1). |
| Selective reporting (reporting bias) | Low risk | No selective reporting of outcomes is apparent. |
| Other bias | Low risk | Trial appears to be free of other problems that could put it at high risk of bias. |
| Methods | Study design: RCT Number randomised: 26 total; 16 to an exercise intervention, 10 to a control Study start: March 2010; stop date: January 2011 Length of intervention: 8 weeks Length of follow‐up: at 3 months post intervention Country: Ireland | |
| Participants | Age, years (mean SD):
Stage, n (%):
Inclusion criteria: • Breast cancer survivors who had consented to the PEACH trial • Completion of adjuvant chemotherapy or radiotherapy with curative intent within the preceding 2 to 6 months • Receipt of neoadjuvant chemotherapy or chemoradiotherapy followed by surgery • Continuing onto adjuvant hormone therapy and anti‐Her2 directed therapy • Ability to understand English • Willingness to be randomised • Medical clearance to exercise • Aged 21 to 69 Exclusion criteria: • Evidence of active cancer • Chronic medical and orthopaedic conditions that would preclude exercise (e.g. uncontrolled congestive heart failure or angina, recent MI, breathing difficulties requiring oxygen use, hospitalisation) • Taking beta‐blocker medication • Prior history of another cancer in previous 5 years (exceptions: non‐melanoma skin cancer, non‐invasive cancer of the cervix) • Confirmed pregnancy • Dementia or psychiatric illness that would preclude ability to participate in study • Incomplete haematological recovery after chemotherapy (WCC < 3, Hb < 10, or platelets < 100) • BMI > 35 • LVEF post chemotherapy < 50% or > 20% deterioration of baseline compared with LVEF before systemic treatment | |
| Interventions | 16 participants assigned to exercise intervention:
Adherence: 6/16 (37.5%) adhered to < 90% of the exercise class but completed follow‐up assessments. 10 participants assigned to control:
| |
| Outcomes | Outcomes:
Numbers of participants assessed:
Adverse events: not reported | |
| Notes | Trial registration link: https://clinicaltrials.gov/ct2/show/NCT01030887 Trial authors contacted: no Intention‐to‐treat analysis: yes, but LOCF used Funding: not reported | |
| Risk of bias | ||
| Bias | Authors' judgement | Support for judgement |
| Random sequence generation (selection bias) | Low risk | Computer‐generated random numbers list |
| Allocation concealment (selection bias) | Unclear risk | Whether allocation was concealed was not reported. |
| Blinding of participants and personnel (performance bias) | High risk | Owing to the nature of the intervention, it was not possible to conceal allocation to the intervention from participants. |
| Blinding of outcome assessment (detection bias) | Low risk | “Assessments were completed by the same researcher at every visit who was blinded to the participants’ group assignment”. |
| Incomplete outcome data (attrition bias) | High risk | LOCF procedure was used for missing variables. |
| Selective reporting (reporting bias) | High risk | Unlike all other outcomes, no baseline data were reported for C‐reactive protein; only change values with 95% CIs were provided. Cardiorespiratory fitness and quality of life were mentioned as outcomes in parent trial; no reasons given for omission of these data here. Only P values for body composition variables were provided. |
| Other bias | High risk | Small sample size and imbalance between numbers allocated to the intervention and control group could give rise to additional biases. |
| Methods | Study design: single‐centre RCT Number randomised: 87; 43 to intervention, 42 to control Study start: not stated; stop date: not stated Length of intervention: 12 weeks Length of follow‐up: to end of intervention Country: USA | |
| Participants | Data available only for those who completed the study Age, years (mean SD):
Stage, n (%):
Inclusion criteria: • Female breast cancer survivors • Completion of cancer treatment • 18 years of age or older • Ability to access and navigate the Internet • Ability to communicate through email • Ability to complete online questionnaires • No current physical activity reported at the outset of the intervention • Ability to engage in physical activity safely | |
| Interventions | 43 participants assigned to exercise intervention:
Adherence: For the treatment group, investigators reported 2.81 (SD 2.11) days of exercise per week at 6 weeks and 3.47 (SD 2.19) days of exercise per week at 12 weeks. 42 participants assigned to control:
| |
| Outcomes | Outcomes:
Numbers of participants assessed:
Adverse events: not reported | |
| Notes | Trial registration link: none available Trial authors contacted: no Intention‐to‐treat analysis: no Funding: not reported | |
| Risk of bias | ||
| Bias | Authors' judgement | Support for judgement |
| Random sequence generation (selection bias) | Unclear risk | “Randomly assigned”; method of randomisation not reported |
| Allocation concealment (selection bias) | Unclear risk | Whether allocation was concealed was not reported. |
| Blinding of participants and personnel (performance bias) | High risk | Owing to the nature of the intervention, it was not possible to conceal allocation to the intervention from participants. |
| Blinding of outcome assessment (detection bias) | Unclear risk | Blinding of outcome assessments was not described. |
| Incomplete outcome data (attrition bias) | High risk | “The final sample included 74 participants (control group n = 38, intervention group n = 36)”. Participants who dropped out were not included in analysis. |
| Selective reporting (reporting bias) | Low risk | No selective reporting of outcomes is apparent. |
| Other bias | Low risk | Trial appears to be free of other problems that could put it at high risk of bias. |
| Methods | Study design: single‐centre quasi‐RCT Number randomised: 63; 32 to intervention, 31 to control Study start: not reported; stop date: not reported Length of intervention: not reported Length of follow‐up: at 3 months post intervention Country: Germany | |
| Participants | Age, years; n (%):
Stage:
Inclusion criteria: • Score ≥ 4 on a linear analogue scale evaluating fatigue, ranging in value from 0 to 10 Exclusion criteria: • Psychiatric condition • < 6 weeks since surgery or chemotherapy | |
| Interventions | 32 participants assigned to exercise intervention:
Adherence:
31 participants assigned to control:
| |
| Outcomes | Outcomes:
Numbers of participants assessed:
Adverse events: not reported | |
| Notes | Trial registration link: none available Trial authors contacted: yes, contacted for means and s for outcomes. However, trial authors did not provide these data. Intention‐to‐treat analysis: no Funding: German Fatigue Society | |
| Risk of bias | ||
| Bias | Authors' judgement | Support for judgement |
| Random sequence generation (selection bias) | High risk | “According to their admission to hospital; depending on the alternating weeks they were allocated to the intervention group or the control group”. |
| Allocation concealment (selection bias) | High risk | Owing to use of alternating weeks in the randomisation process, allocation was not concealed from investigators. |
| Blinding of participants and personnel (performance bias) | High risk | Owing to the nature of the intervention, it was not possible to conceal allocation to the intervention from participants. |
| Blinding of outcome assessment (detection bias) | High risk | Study personnel and outcome assessors were not masked or blinded to study interventions. |
| Incomplete outcome data (attrition bias) | High risk | Complete data were available for 59 participants, but no information on missing participants was provided. “More patients in the control group (15) than in the training group (12) did not continue the study”. |
| Selective reporting (reporting bias) | Low risk | No selective reporting of outcomes is apparent. |
| Other bias | High risk | Study was poorly described, and adherence to resistance exercises was low (42%). |
| Methods | Study design: single‐centre RCT Number randomised: 20; 10 to intervention, 10 to control Study start: recruitment started November 2003; stop date: April 2004 Length of intervention: 8 weeks Length of follow‐up: to end of intervention Country: Spain | |
| Participants | Age, years (mean SD):
Stage, n (%):
Inclusion criteria: • Postmenopausal women surviving breast cancer • 2 to 5 years post treatment • Previous anticancer treatment consisting of surgery with axillary lymphadenectomy and both postsurgery radiation therapy and chemotherapy • Walking less than a total of 30 to 60 minutes 3 days per week • Performing no strenuous exercise such as running, cycling, swimming, or resistance training Exclusion criteria: • Cardiac disease (NYHA II or greater) • Uncontrolled hypertension (blood pressure > 160/90 mmHg) • Uncontrolled pain, or any other condition that contraindicated exercise training • Patients with cancer or cancer survivors, for example, increased risk of bone fracture • Severe anaemia (< 8 g/dL) • Platelet count lower than 50 × 109/μL, 7; lymphoedema | |
| Interventions | 10 participants assigned to exercise intervention:
Adherence:
10 participants assigned to control:
| |
| Outcomes | Primary outcomes:
Other outcomes:
Numbers of participants assessed:
Adverse events: No major adverse effects and no major health problems were noted among participants in both groups over the 8‐week period. | |
| Notes | Trial registration link: none available Trial authors contacted: no Intention‐to‐treat analysis: no Funding: Universidad Europea de Madrid | |
| Risk of bias | ||
| Bias | Authors' judgement | Support for judgement |
| Random sequence generation (selection bias) | Unclear risk | Generation of the random sequence was not described. |
| Allocation concealment (selection bias) | Low risk | “The treatment allocation system was set up so that the researcher who was in charge of enrolling participants did not know in advance which treatment the next person would get”. |
| Blinding of participants and personnel (performance bias) | High risk | Owing to the nature of the intervention, it was not possible to conceal allocation to the intervention from participants. |
| Blinding of outcome assessment (detection bias) | Low risk | “Research assistants (exercise physiologists) with no knowledge of group assignments were designated to measure the outcome variables”. |
| Incomplete outcome data (attrition bias) | High risk | 2 participants in each group withdrew, but no information was provided on reasons for withdrawal, and their data were not included in analysis. |
| Selective reporting (reporting bias) | Low risk | No selective reporting of outcomes is apparent. |
| Other bias | Low risk | Trial appears to be free of other problems that could put it at high risk of bias. |
| Methods | Study design: single‐centre RCT Number randomised: 121; 61 to intervention, 60 to control Study start: June 2009; stop date: June 2013 Length of intervention: 12 months Length of follow‐up: to end of intervention Country: USA | |
| Participants | Age, years (mean SD):
Stage, %:
Inclusion criteria: • Physically inactive (i.e. < 90 minutes per week of physical activity in the past 6 months and no strength training in the past year) • Postmenopausal women given diagnosis 0.5 to 4.0 years before enrolment with hormone receptor–positive stage I to III breast cancer • Receiving an aromatase inhibitor for at least 6 months • Experiencing arthralgia at least mild in severity for at least 2 months (i.e. score of ≥ 3 of 10 for worst pain item of Brief Pain Inventory) • Arthralgia started after initiation of aromatase inhibitor therapy or when pre‐existing joint pain was exacerbated by the use of aromatase inhibitors Exclusion criteria: • None reported | |
| Interventions | 61 participants assigned to the following intervention:
Adherence to the intervention:
60 participants assigned to control:
| |
| Outcomes | Primary outcomes:
Secondary outcomes:
Numbers of participants assessed:
Adverse events: No adverse effects occurred as a result of the exercise programme. | |
| Notes | Trial registration link: https://clinicaltrials.gov/ct2/show/NCT02056067 Trial authors contacted: no Intention‐to‐treat analysis: yes Funding: supported by National Cancer Institute Grant No. R01 CA132931 and in part by a grant from the Breast Cancer Research Foundation (M.L.I.), Yale Cancer Center Support Grant No. P30 CA016359, and Clinical and Translational Science Award Grant No. UL1 TR000142, from the National Center for Advancing Translational Science | |
| Risk of bias | ||
| Bias | Authors' judgement | Support for judgement |
| Random sequence generation (selection bias) | Low risk | "Permuted block randomisation (at 1:1 ratio) with random block size was performed, stratified by joint pain before AI therapy and current bisphosphonate use". |
| Allocation concealment (selection bias) | Unclear risk | Whether treatment assignment was concealed from study personnel and participants was not described. |
| Blinding of participants and personnel (performance bias) | High risk | Owing to the nature of the intervention, it was not possible to conceal allocation to the intervention from participants. |
| Blinding of outcome assessment (detection bias) | Unclear risk | Blinding of outcome assessments was not described. |
| Incomplete outcome data (attrition bias) | Low risk | Mixed‐model repeated measures analysis was employed. This approach is robust because it includes all available data and accounts for correlations between repeated measures. |
| Selective reporting (reporting bias) | Low risk | No selective reporting of outcomes is apparent. |
| Other bias | High risk | "Given funding cuts, the last 25 of the 121 women recruited were enrolled into a 6‐month rather than 12‐month trial". Therefore, participants received interventions of different durations. |
| Methods | Study design: single‐centre RCT Number randomised: 27; 14 to intervention, 13 to control Study start: not reported; stop date: not reported Length of intervention: 24 weeks Length of follow‐up: to end of intervention Country: Greece | |
| Participants | Age, years (mean SD):
Stage:
Inclusion criteria: • Participating only in the dancing exercising programme in which none of the participants had prior physical practice or experience in traditional Greek dances • All participants had been given a diagnosis and surgically treated for breast cancer • Completed cancer therapies, including surgery, radiotherapy, and chemotherapy and stopped all medical treatments at least 3 months before beginning of the study Exclusion criteria: • Poorly controlled hypertension • Any health condition that would deter patient from performing the exercises | |
| Interventions | 14 participants assigned to exercise intervention:
Adherence:
13 participants assigned to control:
| |
| Outcomes | Outcome measures:
Numbers of participants assessed:
Adverse events: none reported | |
| Notes | Trial registration link: none available Trial authors contacted: no Intention‐to‐treat analysis: no missing data reported Funding: not reported | |
| Risk of bias | ||
| Bias | Authors' judgement | Support for judgement |
| Random sequence generation (selection bias) | Unclear risk | Generation of the random sequence was not described. |
| Allocation concealment (selection bias) | Unclear risk | Whether treatment assignment was concealed from study personnel and participants was not described. |
| Blinding of participants and personnel (performance bias) | High risk | Owing to the nature of the intervention, it was not possible to conceal allocation to the intervention from participants. |
| Blinding of outcome assessment (detection bias) | Unclear risk | Blinding of outcome assessments was not described. |
| Incomplete outcome data (attrition bias) | Unclear risk | It is unclear whether any data were missing, as this was not reported. |
| Selective reporting (reporting bias) | Low risk | No selective reporting of outcomes is apparent. |
| Other bias | Low risk | Trial appears to be free of other problems that could put it at high risk of bias. |
| Methods | Study design: RCT Number randomised: 200; 100 to the Hatha yoga intervention, 100 to wait‐list control Study start: not stated; stop date: not stated Length of intervention: 12 weeks Length of follow‐up: at 3 months Country: USA | |
| Participants | Age, years (mean SD):
Stage, n (%):
Inclusion criteria: • Completed breast cancer treatment (except for tamoxifen/aromatase inhibitors) between 2 months and 3 years previously Exclusion criteria: • Engaged in over 5 hours of vigorous physical activity per week • Prior history of any other cancer (except basal or squamous cell skin cancer) • Major medical conditions such as anaemia, diabetes, multiple sclerosis, chronic obstructive pulmonary disease, symptomatic ischaemic heart disease, uncontrolled hypertension, or liver or kidney failure • Severe cognitive impairment (e.g. dementia, Alzheimer’s disease) or abuse of alcohol or drugs • Current yoga practice or prior yoga practice exceeding 3 months | |
| Interventions | 100 participants assigned to exercise intervention:
Adherence: In the yoga group, participants attended a mean of 18.1 (75.4%) of 24 classes with a median of 19 (79.1%) of 24 classes and reported an average of 24.69 minutes per day of total home plus class practice across 12 weeks. 100 participants assigned to control:
| |
| Outcomes | Outcomes:
.Numbers of participants assessed:
Adverse events: Two events appeared potentially attributable to the yoga intervention: Two women reported recurrence of chronic back and/or shoulder problems. | |
| Notes | Trial registration link: https://clinicaltrials.gov/ct2/show/NCT00486525 Trial authors contacted: no Intention‐to‐treat analysis: no Funding: grants No. R01 CA126857, R01 CA131029, K05 CA172296, UL1RR025755, and CA016058 from the National Institutes of Health | |
| Risk of bias | ||
| Bias | Authors' judgement | Support for judgement |
| Random sequence generation (selection bias) | Low risk | “online randomization program to obtain the block randomization sequence” |
| Allocation concealment (selection bias) | Low risk | “The data manager had no participant contact”. |
| Blinding of participants and personnel (performance bias) | High risk | Owing to the nature of the intervention, it was not possible to conceal allocation to the intervention from participants. |
| Blinding of outcome assessment (detection bias) | Low risk | “Participants were told not to mention their group assignment to study personnel during their post‐treatment assessments; questionnaires were administered via computer. The technicians who analysed blood samples were blind to all other data”. |
| Incomplete outcome data (attrition bias) | High risk | No ITT analysis. Participants were excluded from analysis if they did not complete either of the post‐treatment assessments. |
| Selective reporting (reporting bias) | Low risk | No selective reporting of outcomes is apparent. |
| Other bias | Low risk | Trial appears to be free of other problems that could put it at high risk of bias. |
| Methods | Study design: single‐centre RCT Number randomised: 43; 23 to the home‐based exercise + supplement intervention, 20 to a supplement‐only control Study start: January 2012; stop date: August 2013 Length of intervention: 6 months Length of follow‐up: to end of intervention Country: South Korea | |
| Participants | Age, years (mean SD):
Stage, n (%):
Inclusion criteria: • Women aged 20 to 70 years • Diagnosis of stage 0 to III breast cancer • Completed primary treatment at least 3 months earlier and were postmenopausal • Osteopenia diagnosed by a bone mineral density screening test Exclusion criteria: • Having other cancer(s) • Bone metastasis • Disease that could influence bone metabolism • Under treatment for osteoporosis • Condition that precluded unsupervised exercise • Participating regularly in resistance exercise (2 or more 30‐minute sessions per week) | |
| Interventions | 23 participants assigned to exercise intervention:
Adherence: Mean adherence rate was 69.5% for walking and 48.5% for resistance exercise. 20 participants assigned to control:
| |
| Outcomes | Primary outcomes:
Other outcomes:
Numbers of participants assessed:
Adverse events: “No injuries or adverse events and no symptoms of lymphedema were reported in either group”. | |
| Notes | Trial registration link: none available Trial authors contacted: no Intention‐to‐treat analysis: yes, but LOCF Funding: Basic Science Research Program through the National Research Foundation of Korea funded by the Ministry of Education, Science, and Technology | |
| Risk of bias | ||
| Bias | Authors' judgement | Support for judgement |
| Random sequence generation (selection bias) | Low risk | Computer‐generated randomisation was used. |
| Allocation concealment (selection bias) | Unclear risk | Sealed, sequentially numbered envelops were used, but trial authors did not report whether they were opaque. |
| Blinding of participants and personnel (performance bias) | High risk | Owing to the nature of the intervention, it was not possible to conceal allocation to the intervention from participants. |
| Blinding of outcome assessment (detection bias) | Unclear risk | Primary outcome (bone mineral density) was assessed by technicians blinded to group allocation, but trial authors did not report whether assessors of the remaining were also blinded to group allocation. |
| Incomplete outcome data (attrition bias) | High risk | Missing data were imputed by the LOCF method. |
| Selective reporting (reporting bias) | Low risk | No selective reporting of outcomes is apparent. |
| Other bias | Low risk | Trial appears to be free of other problems that could put it at high risk of bias. |
| Methods | Study design: single‐centre RCT Number randomised: 101; 51 to intervention, 50 to control Study start: May 2004; stop date: October 2006 Length of intervention: 16 weeks Length of follow‐up: to end of intervention Country: USA | |
| Participants | Age, years (mean SD):
Stage, n (%):
Inclusion criteria: • Histological evidence of stage I‐III invasive breast cancer • Completion of any chemotherapy and/or radiation therapy at least 3 months before enrolment • Absence of diabetes • No use of corticosteroids • BMI > 25 and/or body fat percentage > 30% • Baseline participation in less than 40 minutes of physical activity per week • Hormonal therapy allowed as long as participants continued therapy for duration of the study Exclusion criteria: • Evidence of persistent or recurrent breast cancer • Other malignancy • Uncontrolled heart disease • Other contraindications to exercise | |
| Interventions | 51 participants assigned to 16‐week exercise intervention:
Adherence:
50 participants assigned to control:
Contamination of control group: not reported | |
| Outcomes | Outcomes:
Time points of assessment: baseline, completion of the 16‐week study period Numbers of participants assessed:
Adverse events: not reported | |
| Notes | Trial registration link: none available Trial authors contacted: no Intention‐to‐treat analysis: unclear; ITT approach was not described Funding: supported by the American Society of Clinical Oncology and the Lance Armstrong Foundation | |
| Risk of bias | ||
| Bias | Authors' judgement | Support for judgement |
| Random sequence generation (selection bias) | Unclear risk | Generation of the random sequence was not described: “participants were randomly assigned 1:1 to an exercise intervention group or control group”. |
| Allocation concealment (selection bias) | Unclear risk | Whether treatment assignment was concealed from study personnel and participants was not described. |
| Blinding of participants and personnel (performance bias) | High risk | Owing to the nature of the intervention, it was not possible to conceal allocation to the intervention from participants. |
| Blinding of outcome assessment (detection bias) | Unclear risk | “although hormonal assays were performed by technicians blinded to group assignment, anthropometric measures were collected by unblinded study staff” |
| Incomplete outcome data (attrition bias) | Unclear risk | ITT approach mentioned but not described |
| Selective reporting (reporting bias) | Low risk | No selective reporting of outcomes is apparent. |
| Other bias | High risk | High dropout numbers in intervention group (11/51; 22%) and in control group (8/50; 16%) |
| Methods | Study design: single‐centre RCT Number randomised: 63; 32 to intervention, 31 to control Study start: May 2007; stop date: April 2008 Length of intervention: 6 months Length of follow‐up: to end of 6‐month intervention Country: USA | |
| Participants | Age, years (mean SD):
Stage, n (%):
Inclusion criteria: • Age between 21 and 75 years • Completion of breast cancer treatment (stage 0‐III) at least 3 months before (with the possible exception of ongoing hormonal therapies such as tamoxifen or aromatase inhibitors) • BMI ≥ 24 kg/m² (or ≥ 23 kg/m², if of Asian descent) Exclusion criteria: • Myocardial infarction or stroke in the previous 6 months • Diabetes • Current yoga practice • Pregnancy or plans to become pregnant • Other factors that might lead to poor retention and yoga practice, which included plans to leave the study area during the follow‐up period or any contraindications to practising yoga | |
| Interventions | 32 participants assigned to exercise intervention:
Adherence:
14 participants assigned to control:
| |
| Outcomes | Primary outcome measures:
Secondary outcomes:
Numbers of participants assessed:
Adverse events: not reported | |
| Notes | Trial registration link: https://clinicaltrials.gov/ct2/show/NCT00476203 Trial authors contacted: no Intention‐to‐treat analysis: no Funding: supported in part by the Office of Research and Development Cooperative Studies Program, Department of Veterans Affairs and the Transdisciplinary Research in Energetics in Cancer (NCI 1U54 CA116847) | |
| Risk of bias | ||
| Bias | Authors' judgement | Support for judgement |
| Random sequence generation (selection bias) | Unclear risk | Generation of the random sequence was not described, |
| Allocation concealment (selection bias) | Unclear risk | Whether treatment assignment was concealed from study personnel and participants was not described. |
| Blinding of participants and personnel (performance bias) | High risk | Owing to the nature of the intervention, it was not possible to conceal allocation to the intervention from participants. |
| Blinding of outcome assessment (detection bias) | High risk | "we were unable to blind assessors to group assignment" |
| Incomplete outcome data (attrition bias) | High risk | "We used an intent‐to‐treat approach". However, "those who did not provide follow‐up values were not included in analyses". |
| Selective reporting (reporting bias) | Unclear risk | Blood was collected, but no outcome measures were specified or reported. |
| Other bias | Low risk | Trial appears to be free of other problems that could put it at high risk of bias. |
| Methods | Study design: single‐centre RCT Number randomised: 197; 66 to Qigong, 65 to group line‐dancing, 66 to control Study start: not reported; stop date: not reported Length of intervention: 8 weeks Length of follow‐up: to end of intervention (at 12 months post intervention for intervention‐only groups) Country: Malaysia | |
| Participants | Baseline data available for 95 participants (32, Qigong; 31, line‐dancing; 32, usual care): Age, years (mean SD):
Stage, n (%):
Inclusion criteria: • Medical contraindication to exercise • Major medical condition such as epilepsy, uncontrolled hypertension, major orthopaedic problem or acute cardiovascular disease (patients given diagnosis in the past 6 months and still medically unstable) • Completed primary cancer treatment with no evidence of metastasis • At least 1 year post diagnosis Exclusion criteria: • Medical contraindication to exercise • Major medical condition such as epilepsy, uncontrolled hypertension, major orthopaedic problem or acute cardiovascular disease (patients given diagnosis in the past 6 months and still medically unstable) • Currently practising Qigong or line‐dancing • Engaging in more than 4 hours of vigorous physical activity | |
| Interventions | 131 participants assigned to one of two 8‐week exercise interventions:
Adherence: Adherence rates were 63% for Qigong and 65% for line‐dancing. 66 participants were assigned to control. No change was made to usual management of participants assigned to this group, but they were offered the Qigong or line‐dancing programme at the end of the 8‐week intervention period. | |
| Outcomes | Primary outcomes:
Other outcomes:
Numbers of participants assessed:
Adverse events: not reported | |
| Notes | Trial registration link: none available Trial authors contacted: yes, trial authors provided additional means and SDs for some outcomes Intention‐to‐treat analysis: no, "Outliers more than 1.5SD, were removed, and missing data were replaced with mean‐substitution" Funding: not reported | |
| Risk of bias | ||
| Bias | Authors' judgement | Support for judgement |
| Random sequence generation (selection bias) | Low risk | “Block randomisation (block size=six) was performed by one of the researchers”. |
| Allocation concealment (selection bias) | Low risk | “Masking of treatment allocation were conducted, with ‘matching’ active, placebo and control, using a free online Random Allocation Software”. |
| Blinding of participants and personnel (performance bias) | High risk | Owing to the nature of the intervention, it was not possible to conceal allocation to the intervention from participants. |
| Blinding of outcome assessment (detection bias) | Unclear risk | Blinding of outcome assessments was not described. |
| Incomplete outcome data (attrition bias) | High risk | Inappropriate handling of missing data: “Outliers more than 1.5SD, were removed, and missing data were replaced with mean‐substitution”. |
| Selective reporting (reporting bias) | Low risk | No selective reporting of outcomes is apparent. |
| Other bias | High risk | Very high attrition. Only 48% of participants randomised at baseline completed postintervention assessments; therefore, less than half of participants received only part of the intervention. |
| Methods | Study design: multi‐centre RCT Numbers allocated, 28; 15 to exercise intervention, 13 to control Study start: February 2011; stop date: May 2011 Length of intervention: 8 weeks Length of follow‐up: at 12 weeks Country: Tasmania, Australia | |
| Participants | Baseline data available for 12 in intervention and 11 in control: Age, years (mean SD):
Stage, n (%):
Inclusion criteria: • Stage I unilateral secondary lymphoedema of the arm, as defined by the International Society of Lymphology and confirmed by a professional lymphoedema therapist • Completed treatment for breast cancer (surgery, radiotherapy, and chemotherapy) at least 6 months previously • Over 18 years of age • Sufficient English literacy to provide informed consent Exclusion criteria: • Recurrent cancer • Infection • Receiving complex lymphoedema therapy • Pregnancy • Wore a pacemaker, which would affect bioimpedance spectroscopy (BIS) readings • Severe psychological illness | |
| Interventions | 15 participants assigned to exercise intervention:
Adherence: Attendance at group yoga sessions was high (97%), as was self‐reported compliance with the home practice DVD (86%). 13 participants assigned to control:
| |
| Outcomes | Primary outcome:
Secondary outcomes:
Numbers of participants assessed:
Adverse events: No adverse events were attributable to the yoga or to the control intervention. | |
| Notes | Trial registration link: none available Trial authors contacted: no Intention‐to‐treat analysis: no https://www.anzctr.org.au/Trial/Registration/TrialReview.aspx?ACTRN=12611000202965 Funding: Swan Research Institute (SRI) and Faculty of Health Sciences Seed Funding, UTAS. Equipment was provided by Flinders University and University of Tasmania. | |
| Risk of bias | ||
| Bias | Authors' judgement | Support for judgement |
| Random sequence generation (selection bias) | Low risk | “randomisation based on a computer‐generated random number system” |
| Allocation concealment (selection bias) | Low risk | “An individual not associated with the trial will perform the randomisation”. “Group notification will be in a sealed envelope given to women after completion of the baseline measurement”. |
| Blinding of participants and personnel (performance bias) | High risk | Owing to the nature of the intervention, it was not possible to conceal allocation to the intervention from participants. |
| Blinding of outcome assessment (detection bias) | Low risk | “Measurements, based on validated instruments and protocols, were taken by trained researchers blinded to the group allocation and previous results”. |
| Incomplete outcome data (attrition bias) | High risk | Only those who completed post‐intervention and 1‐month‐after‐cessation assessments were included in analysis. |
| Selective reporting (reporting bias) | Low risk | No selective reporting of outcomes is apparent. |
| Other bias | Low risk | Trial appears to be free of other problems that could put it at high risk of bias. |
| Methods | Study design: single‐centre RCT Number randomised: 38; 23 to a Nordic walking intervention, 15 to control Study start: not reported; stop date: not reported Length of intervention: 8 weeks Length of follow‐up: to end of intervention Country: Poland | |
| Participants | Age, years, mean:
Stage, n (%):
Inclusion criteria: • Women after treatment for breast cancer Exclusion criteria: • None reported | |
| Interventions | 23 participants assigned to exercise intervention:
Adherence: Not reported 15 participants assigned to control:
| |
| Outcomes | Outcomes:
Time points of assessment: baseline, at 8 weeks Numbers of participants assessed:
Adverse events: not reported | |
| Notes | Trial registration link: none available Trial authors contacted: no Intention‐to‐treat analysis: yes, no missing data were reported Funding: none reported | |
| Risk of bias | ||
| Bias | Authors' judgement | Support for judgement |
| Random sequence generation (selection bias) | Unclear risk | "The participants were randomly assigned to one of two groups". No method stated |
| Allocation concealment (selection bias) | Unclear risk | Whether treatment assignment was concealed from study personnel and participants was not described. |
| Blinding of participants and personnel (performance bias) | High risk | Owing to the nature of the intervention, it was not possible to conceal allocation to the intervention from participants. |
| Blinding of outcome assessment (detection bias) | Unclear risk | Blinding of outcome assessments was not described. |
| Incomplete outcome data (attrition bias) | Low risk | No missing data (no dropouts) are apparent. |
| Selective reporting (reporting bias) | Low risk | No selective reporting of outcomes is apparent. |
| Other bias | Low risk | Trial appears to be free of other problems that could put it at high risk of bias. |
| Methods | Study design: single‐centre RCT Number randomised: 26; 8 to MVe Fitness Chair, 8 to traditional resistance training, 10 to control (no exercise) Study start: not reported but participants enrolled from January to December 2009; stop date: not reported Length of intervention: 8 weeks Length of follow‐up: to end of intervention Country: Australia | |
| Participants | Age, years (mean SD):
Stage, n (%):
Inclusion criteria: • Female • Age 29 to 69 years • Diagnosis of stage I, II, or III breast cancer and completion of all treatments within 6 months • Consent from oncologist to participate • Underwent strict health screening Exclusion criteria: • Cardiorespiratory disease; bone, joint, or muscle pain or abnormalities that would compromise the participant’s ability to complete the exercise training protocol • Already enrolled in a formal exercise programme | |
| Interventions | 16 participants assigned to 1 of 2 exercise interventions:
Adherence: MVe Fitness Chair group had a mean adherence rate of 83.3%. Resistance training group had an average adherence rate of 81.2%. 10 participants assigned to control:
| |
| Outcomes | Outcomes:
Other outcomes:
Numbers of participants assessed:
Adverse events: not reported | |
| Notes | Trial registration link: none available Trial authors contacted: no Intention‐to‐treat analysis: yes, no missing data were reported Funding: Peak Pilates donated the MVe Fitness Chairs used in this study to the Get REAL & HEEL Breast Cancer Rehabilitation Program. No other financial support was received for this project. | |
| Risk of bias | ||
| Bias | Authors' judgement | Support for judgement |
| Random sequence generation (selection bias) | Low risk | “Simple randomization with replacement” |
| Allocation concealment (selection bias) | Unclear risk | Not described |
| Blinding of participants and personnel (performance bias) | High risk | Owing to the nature of the intervention, it was not possible to conceal allocation to the intervention from participants. |
| Blinding of outcome assessment (detection bias) | Unclear risk | Blinding of outcome assessments was not described. |
| Incomplete outcome data (attrition bias) | Low risk | No data were missing. |
| Selective reporting (reporting bias) | High risk | Oxygen saturation was not reported. Composite score for all tests was reported. Data for individual tests were not provided. |
| Other bias | Low risk | Trial appears to be free of other problems that could put it at high risk of bias. |
| Methods | Study design: single‐centre RCT Number randomised: 36; 23 to intervention, 13 to wait‐list control Study start: not reported; stop date: not reported Length of intervention: 12 weeks Length of follow‐up: to end of intervention Country: USA | |
| Participants | Age, years (mean SD):
Stage, n (%):
Inclusion criteria: • Diagnosis of stage I–III cancer • Completed adjuvant treatment in the past 12 months • Postmenopausal • Free of cardiovascular disease and major orthopaedic limitations • Not currently exercising on a regular basis (≥ 5 days/week) Exclusion criteria: • None reported | |
| Interventions | 22 participants assigned to exercise intervention:
Adherence:
14 participants assigned to control:
| |
| Outcomes | Outcomes:
Time points of assessment: baseline, 6 weeks, and 12 weeks. For body composition‐dependent variables: baseline and 12 weeks Numbers of participants assessed:
Adverse events: not reported | |
| Notes | Trial registration link: none available Trial authors contacted: no Intention‐to‐treat analysis: yes, but LOCF used Funding: Vanderbilt‐Ingram Cancer Center, South Carolina Cancer Center, and Vanderbilt General Clinical Research Center | |
| Risk of bias | ||
| Bias | Authors' judgement | Support for judgement |
| Random sequence generation (selection bias) | Unclear risk | Generation of the random sequence was not described; “participants were randomly assigned 2:1 to an exercise intervention group or control group”. |
| Allocation concealment (selection bias) | Unclear risk | Whether treatment assignment was concealed from study personnel and participants was not described. |
| Blinding of participants and personnel (performance bias) | High risk | Owing to the nature of the intervention, it was not possible to conceal allocation to the intervention from participants. |
| Blinding of outcome assessment (detection bias) | Unclear risk | Blinding of outcome assessments was not described. |
| Incomplete outcome data (attrition bias) | High risk | ITT analyses based on the last observation carried forward method; missing data not reported |
| Selective reporting (reporting bias) | Low risk | No selective reporting of outcomes is apparent. |
| Other bias | Unclear risk | Some participants were contacted via a list of participants from a breast cancer case‐control study. Therefore, these women may have been particularly motivated to adopt the walking programme. |
| Methods | Study design: single‐centre RCT Number randomised: 14; 7 to exercise intervention, 7 to control Study start: not reported; stop date: not reported Length of intervention: 8 weeks Length of follow‐up: to end of intervention Country: Canada | |
| Participants | Age, years (mean SD):
Stage, n (%):
Inclusion criteria: • Underwent breast cancer treatment for stage I or II breast cancer that had been completed more than 6 months before enrolling in the study • Subsequently developed unilateral lymphoedema > 2 cm and < 8 cm for at least 1 measurement point Exclusion criteria: • Stage III lymphoedema, bilateral disease • Required medication that might affect upper extremity swelling | |
| Interventions | 7 participants assigned to exercise intervention:
Adherence: Not reported 7 participants assigned to control:
| |
| Outcomes | Outcomes:
Numbers of participants assessed:
Adverse events: not reported | |
| Notes | Trial registration link: none available Trial authors contacted: Trial authors were contacted for means and SDs for outcomes. However, they did not provide these data. Intention‐to‐treat analysis: yes, no missing data were reported Funding: not reported | |
| Risk of bias | ||
| Bias | Authors' judgement | Support for judgement |
| Random sequence generation (selection bias) | Unclear risk | “randomly assigned”, but method not mentioned |
| Allocation concealment (selection bias) | Unclear risk | Whether treatment assignment was concealed from study personnel and participants was not described. |
| Blinding of participants and personnel (performance bias) | High risk | Owing to the nature of the intervention, it was not possible to conceal allocation to the intervention from participants. |
| Blinding of outcome assessment (detection bias) | Unclear risk | No mention of whether study personnel and outcome assessors were masked or blinded to study interventions |
| Incomplete outcome data (attrition bias) | Low risk | No missing data |
| Selective reporting (reporting bias) | Low risk | No selective reporting of outcomes is apparent. |
| Other bias | Low risk | Trial appears to be free of other problems that could put it at high risk of bias. |
| Methods | Study design: single‐centre RCT Number randomised: 63; 35 to intervention, 28 to control Study start: not reported; stop date: not reported Length of intervention: 10 weeks Length of follow‐up: to end of intervention Country: Germany | |
| Participants | Age, years (mean SD):
Stage, n (%):
Inclusion criteria: • 18 to 65 years old • Primary non‐metastatic breast cancer • Minimum 4 weeks after completion of chemotherapy, radiation therapy, or both • Any disorder that could interfere with ability to perform the physical exercise programme Exclusion criteria: • Severe acute or chronic illness other than cancer (e.g. disorders of the musculoskeletal system) | |
| Interventions | 35 participants assigned to exercise intervention:
Adherence: Not reported 28 participants assigned to control:
| |
| Outcomes | Outcomes:
Numbers of participants assessed, anxiety and depression:
Numbers of individuals with data for cancer‐specific HRQoL, generic HRQoL, and psychological symptoms were not reported. Adverse events: not reported | |
| Notes | Trial registration link: none available Trial authors contacted: no Intention‐to‐treat analysis: unclear how missing data were handled Funding: Friedrich and Louise Homann Foundation, Hamburg, Germany | |
| Risk of bias | ||
| Bias | Authors' judgement | Support for judgement |
| Random sequence generation (selection bias) | Unclear risk | It is unclear how the allocation sequence was generated. |
| Allocation concealment (selection bias) | Low risk | Randomisation was adequately concealed through external randomisation. |
| Blinding of participants and personnel (performance bias) | High risk | Owing to the nature of the intervention, it was not possible to conceal allocation to the intervention from participants. |
| Blinding of outcome assessment (detection bias) | High risk | Study personnel and outcome assessors were not masked or blinded to study interventions. |
| Incomplete outcome data (attrition bias) | Unclear risk | It is unclear how missing data were handled. Five randomised participants were reported to have “cancelled” participation in the exercise group. |
| Selective reporting (reporting bias) | Low risk | No selective reporting of outcomes is apparent. |
| Other bias | High risk | Participation in physical exercise by women (91%) in study groups before the intervention was commenced could have contributed to bias. |
| Methods | Study design: single‐centre RCT (12‐week study included here) Number randomised: 58; 29 to immediate exercise intervention, 29 to delayed exercise intervention Study start: January 2005; stop date: recruitment ended March 2005 Length of intervention: 12 weeks Length of follow‐up: to end of intervention Country: Australia | |
| Participants | Age, years (mean SD):
Stage, n (%):
Inclusion criteria: • Women with stage I–II breast cancer • ≥ 18 years old • English speaking • Within 24 months of cancer diagnosis • Completed all treatments except hormone therapy Exclusion criteria: • Evidence of recurrent disease • Previously engaged in any formal exercise programme for 6 months before participation in this study • Failed the revised Physical Activity Readiness Questionnaire • Evidence of recurrent disease | |
| Interventions | 29 participants assigned to exercise intervention:
Adherence:
29 participants assigned to control:
| |
| Outcomes | Primary outcome:
Other outcomes:
Numbers of participants assessed:
Adverse events: none reported | |
| Notes | Trial registration link: none available Trial authors contacted: no Intention‐to‐treat analysis: yes, but LOCF was used Funding: CCS and NCIC/CCS Sociobehavioral Cancer Research Network | |
| Risk of bias | ||
| Bias | Authors' judgement | Support for judgement |
| Random sequence generation (selection bias) | Low risk | Randomisation by computer‐generated programme |
| Allocation concealment (selection bias) | Low risk | “Group assignments were concealed from the project director who recruited participants to the trial”. |
| Blinding of participants and personnel (performance bias) | High risk | Owing to the nature of the intervention, it was not possible to conceal allocation to the intervention from participants. |
| Blinding of outcome assessment (detection bias) | High risk | Study personnel and outcome assessors were not masked or blinded to study interventions. |
| Incomplete outcome data (attrition bias) | Low risk | Minimal loss to follow‐up |
| Selective reporting (reporting bias) | Low risk | No selective reporting of outcomes is apparent. |
| Other bias | High risk | Intervention adherence rate was low (61.3%). |
| Methods | Study design: single‐centre RCT Number randomised: 73; 37 to intervention, 36 to control Study start: not reported; stop date: not reported Length of intervention: 10 weeks Length of follow‐up: to end of intervention Country: Kosovo | |
| Participants | Characteristics data based on 62 participants (30 in exercise group, 32 in control group) Age, years (mean SD):
Stage, n (%):
Inclusion criteria: • Histologically confirmed early‐stage breast cancer with no evidence of recurrent or progressive disease • Completed surgery, radiotherapy, and/or chemotherapy with or without current hormone therapy Exclusion criteria: • Known cardiac disease • Uncontrolled hypertension • Thyroid disease, respiratory disease, diabetes, mental illness, infection, immune or endocrine abnormality | |
| Interventions | 37 participants assigned to exercise intervention:
Adherence: Exercise adherence was 84.9%. 36 participants assigned to control:
| |
| Outcomes | Primary outcome:
Other outcomes:
Numbers of participants assessed:
Adverse events: Three participants developed lymphoedema. | |
| Notes | Trial registration link: none available Trial authors contacted: no Intention‐to‐treat analysis: no Funding: none | |
| Risk of bias | ||
| Bias | Authors' judgement | Support for judgement |
| Random sequence generation (selection bias) | Low risk | "computer‐generated random allocation sequences" |
| Allocation concealment (selection bias) | Low risk | "sequences that were prepared centrally by the trial statistician" |
| Blinding of participants and personnel (performance bias) | High risk | Owing to the nature of the intervention, it was not possible to conceal allocation to the intervention from participants. |
| Blinding of outcome assessment (detection bias) | Low risk | The assessor was blinded with regard to allocation of participants to treatment groups. |
| Incomplete outcome data (attrition bias) | High risk | "The data analyses included only those participants who had completed the 10 week interventional period". |
| Selective reporting (reporting bias) | Low risk | No selective reporting of outcomes is apparent. |
| Other bias | High risk | Inappropriate statistical analysis was performed (independent t‐tests done on change values). |
| Methods | Study design: single‐centre RCT Number randomised: 55; 12 to aerobic exercise intervention, 17 to resistance exercise intervention, 13 to combined aerobic and resistance exercise intervention, 13 to flexibility control Study start: October 2004; stop date: March 2006 Length of intervention: 12 weeks Length of follow‐up: to end of intervention Country: USA | |
| Participants | Age, years (mean SD):
Stage, n (%):
Inclusion criteria: • English‐speaking women • Stage I–IIIB breast cancer after completion of adjuvant chemotherapy at least 3 months or radiation therapy at least 6 weeks before entry • No more than 24 months beyond their last treatment • Hormonal therapy could be ongoing. Exclusion criteria: • Medical history or physical examination revealed evidence of anaemia (haemoglobin <10 mg/dL), uncontrolled hypertension, congestive heart failure, pulmonary disease, diabetes, and thyroid or musculoskeletal disease • Current enrolment in a weight loss or exercise programme • Positive response to any question on the Physical Activity Readiness Questionnaire, thus indicating the need for medical clearance before starting an exercise programme | |
| Interventions | 42 participants assigned to aerobic, resistance, or aerobic plus resistance exercise interventions:
Adherence:
13 participants assigned to flexibility control:
| |
| Outcomes | Outcomes:
Numbers of participants assessed:
Five women returned the survey data form but refused final fitness testing because of time constraints related to work and family obligations; therefore, fitness test participant number was 37. Adverse events: tendinitis (n = 2): 1 in the shoulder, the other in the foot | |
| Notes | Trial registration link: none available Trial authors contacted: no Intention‐to‐treat analysis: yes Funding: award from the Greater NYC Affiliate of the Susan G. Komen Breast Cancer Foundation, Inc., New York, NY | |
| Risk of bias | ||
| Bias | Authors' judgement | Support for judgement |
| Random sequence generation (selection bias) | Low risk | “computer‐generated randomization table generated” |
| Allocation concealment (selection bias) | Low risk | “Allocation to study group was made….by the statistical department of the cancer centre and maintained by office staff in the clinical research office". |
| Blinding of participants and personnel (performance bias) | High risk | Owing to the nature of the intervention, it was not possible to conceal allocation to the intervention from participants. |
| Blinding of outcome assessment (detection bias) | Low risk | Physical fitness tests: “The same research assistant, blinded to participant group allocation, preformed these measurements at the pre‐intervention and post‐intervention measurement time points”. |
| Incomplete outcome data (attrition bias) | Low risk | “Missing data were random and were handled using multiple imputations”. Reasons for withdrawal were given. |
| Selective reporting (reporting bias) | High risk | Not all physical fitness test outcomes were reported. |
| Other bias | High risk | Small sample size was further impacted by high rate of withdrawal (24%). |
| Methods | Study design: single‐centre RCT Number randomised: 31; 17 to Tai Chi Chuan intervention, 14 to control Study start: not reported; stop date: not reported Length of intervention: 12 weeks Length of follow‐up: to end of intervention Country: USA | |
| Participants | Age, years (mean SD):
Stage:
Inclusion criteria: • Female • Histological diagnosis of primary breast cancer stage 0–IIIB • Between 1 week and 30 months after treatment • No drainage tubes or catheters • Not engaging in moderate‐to‐vigorous physical activity more than once a week • Physician’s clearance for fitness testing and exercise • No physical limitations prohibiting exercise • No clinical diagnosis of mental disorder, as defined by use of psychotropic drugs and self‐report Exclusion criteria: • None reported | |
| Interventions | 17 participants assigned to exercise intervention, including Tai Chi Chuan (TCC):
Adherence:
14 participants assigned to psychosocial support:
| |
| Outcomes | Primary outcomes:
Secondary outcomes:
Numbers of participants assessed:
16 participants had evaluable blood samples before and after the intervention for bone‐biomarker tests. 19 participants gave evaluable blood samples for IGF‐1, IGFBP‐1, IGFBP‐3, and IL‐6; 18 and 16 blood samples were evaluable for IL‐2 and 16 for IFN‐γ, respectively. Adverse events: no cancer recurrence reported; cognitive deficits reported as reason for treatment termination | |
| Notes | Trial registration link: none available Trial authors contacted: no Intention‐to‐treat analysis: no Funding: Susan Stout Exercise Science Research Fund, Sally Schindel Cone Women’s and Gender Studies Research Fund | |
| Risk of bias | ||
| Bias | Authors' judgement | Support for judgement |
| Random sequence generation (selection bias) | Low risk | “Randomization was achieved by flipping a coin”. |
| Allocation concealment (selection bias) | High risk | Allocation was not concealed from study personnel. |
| Blinding of participants and personnel (performance bias) | High risk | Owing to the nature of the intervention, it was not possible to conceal allocation to the intervention from participants. |
| Blinding of outcome assessment (detection bias) | High risk | Study personnel and outcome assessors were not masked or blinded to study interventions. |
| Incomplete outcome data (attrition bias) | High risk | Withdrawals were not included in analyses (intervention, n = 6; control, n = 4). |
| Selective reporting (reporting bias) | Low risk | No selective reporting of outcomes is apparent. |
| Other bias | Low risk | Trial appears to be free of other problems that could put it at high risk of bias. |
| Methods | Study design: quasi‐RCT Number randomised: 46; 11 to psychological counselling only, 12 to exercise only, 12 to combined exercise and psychological counselling, 11 to usual care Study start: not stated; stop date: not stated Length of intervention: 8 weeks Length of follow‐up: to end of intervention Country: Australia | |
| Participants | Age, years (mean SD):
Stage, n (%):
Inclusion criteria: • Female with confirmed stage I–III invasive breast cancer within 12 months of treatment completion (except hormone therapy) • Aged 35 to 70 years • Sufficiently fluent in English • Either not participating in structured regular exercise or nutrition programmes in the past 6 months or currently not meeting American College of Sports Medicine guidelines for adequate physical activity (> 150 minutes/week) Exclusion criteria: • Acute or chronic bone, joint, or muscular abnormalities that would compromise ability to participate in exercise • Immune deficiency that would compromise ability to participate in exercise • Failure of Physical Activity Readiness Questionnaire • Presence of metastatic disease | |
| Interventions | 24 participants assigned to 1 of 2 exercise interventions:
Adherence: Participants completed an average of 84% of all scheduled exercise sessions and 87% of all scheduled counselling sessions, with no significant differences among groups. 11 participants assigned to control:
| |
| Outcomes | Outcomes:
Numbers of participants assessed:
Adverse events: No adverse reactions to participation in exercise or counselling intervention were reported. | |
| Notes | Trial registration link: none available Trial authors contacted: no Intention‐to‐treat analysis: yes Funding: Foggarty grant and Health Benefits Funds, through the University of Notre Dame Australia | |
| Risk of bias | ||
| Bias | Authors' judgement | Support for judgement |
| Random sequence generation (selection bias) | High risk | “randomized to each group on a rolling enrolment basis” |
| Allocation concealment (selection bias) | High risk | Rolling enrolment was used; therefore, allocation was not concealed. |
| Blinding of participants and personnel (performance bias) | High risk | Owing to the nature of the intervention, it was not possible to conceal allocation to the intervention from participants. |
| Blinding of outcome assessment (detection bias) | Unclear risk | Blinding of outcome assessments was not described. |
| Incomplete outcome data (attrition bias) | Low risk | Baseline data for the 3 women who dropped out after randomisation were included in the intention‐to‐treat analysis. |
| Selective reporting (reporting bias) | Low risk | No selective reporting of outcomes is apparent. |
| Other bias | Low risk | Trial appears to be free of other problems that could put it at high risk of bias. |
| Methods | Study design: single‐centre RCT Number randomised: 16; 8 to exercise intervention, 8 to control Study start: not reported; stop date: not reported Length of intervention: 8 weeks Length of follow‐up: to end of intervention Country: USA | |
| Participants | Age, years (mean SE):
Stage:
Inclusion criteria: • All patients had been diagnosed with breast cancer • Had undergone surgery, adjuvant chemotherapy, and/or radiotherapy • Not currently receiving chemotherapy or radiation treatment Exclusion criteria: • None reported | |
| Interventions | 8 participants assigned to exercise intervention:
Adherence:
8 participants assigned to control:
| |
| Outcomes | Outcomes:
Numbers of participants assessed:
Adverse events: 2 recurrences of disease | |
| Notes | Trial registration link: none available Trial authors contacted: no Intention‐to‐treat analysis: no Funding: supported in part by a grant from the National Institute of Aging | |
| Risk of bias | ||
| Bias | Authors' judgement | Support for judgement |
| Random sequence generation (selection bias) | Unclear risk | Generation of the random sequence was not described. |
| Allocation concealment (selection bias) | Unclear risk | Whether treatment assignment was concealed from study personnel and participants was not described. |
| Blinding of participants and personnel (performance bias) | High risk | Owing to the nature of the intervention, it was not possible to conceal allocation to the intervention from participants. |
| Blinding of outcome assessment (detection bias) | Unclear risk | Blinding of outcome assessments was not described. |
| Incomplete outcome data (attrition bias) | High risk | Analysis was performed only on participants who completed the intervention. |
| Selective reporting (reporting bias) | Low risk | No selective reporting of outcomes is apparent. |
| Other bias | High risk | Potential imbalances at baseline; "larger than expected baseline differences in these variables and others including NKCA" |
| Methods | Study design: RCT Number randomised: 29; 15 to intervention, 14 to control Study start: not reported; stop date: not reported Length of intervention: 12 weeks Length of follow‐up: to end of 12‐week intervention Country: Finland | |
| Participants | Age, years (mean SD):
Stage:
Inclusion criteria: • Histologically proven invasive breast cancer • Adjuvant chemotherapy within 6 months • Duration of endocrine therapy no longer than 6 months • Aged from 35 to 65 Exclusion criteria: • Haematogenous metastases • No systemic adjuvant therapy • Pregnancy or lactation • Severe cardiac disease (NYHA class III or higher) • Myocardial infarction within 12 months • Uncontrolled hypertension • Verified osteoporosis • Other serious illness or medical condition that could be a contraindication for exercise • Not capable of training (severe knee arthrosis, ligament or cartilage injury at lower extremity) • Residence more than 1 hour from the exercise centre • Competitive athlete | |
| Interventions | 15 participants assigned to exercise intervention:
Adherence:
14 participants assigned to control:
| |
| Outcomes | Outcomes:
Numbers of participants assessed:
“One participant withdrew from the study before randomization due to family reasons”. Adverse events: not reported | |
| Notes | Trial registration link: none available Trial authors contacted: no Intention‐to‐treat analysis: no, but minimal loss to follow‐up Funding: Support from The Finnish Cancer Foundation, Pirkanmaa Cancer Society Finland, and AstraZeneca Finland is greatly appreciated. | |
| Risk of bias | ||
| Bias | Authors' judgement | Support for judgement |
| Random sequence generation (selection bias) | Unclear risk | Generation of the random sequence was not described. |
| Allocation concealment (selection bias) | Unclear risk | Whether treatment assignment was concealed from study personnel and participants was not described. |
| Blinding of participants and personnel (performance bias) | High risk | Owing to the nature of the intervention, it was not possible to conceal allocation to the intervention from participants. |
| Blinding of outcome assessment (detection bias) | Unclear risk | Blinding of outcome assessments was not described. |
| Incomplete outcome data (attrition bias) | Low risk | Loss to follow‐up was minimal. An ITT approach was stated but not described. One participant withdrew from each group after baseline assessments were taken, but these participants were not included in ITT analysis. |
| Selective reporting (reporting bias) | Low risk | No selective reporting of outcomes is apparent. |
| Other bias | Low risk | Trial appears to be free of other problems that could put it at high risk of bias. |
| Methods | Study design: single‐centre RCT Number randomised: 20; 10 to intervention, 10 to control Study start and stop dates: 9‐month period but dates not reported Length of intervention: 14 weeks Length of follow‐up: to end of intervention Country: USA | |
| Participants | Age, years (mean SD):
Stage:
Inclusion criteria: • Postmenopausal women with diagnosis of breast cancer who were receiving hormonal therapy with tamoxifen, anastrozole, or letrozole (the 3 most frequently prescribed hormonal medications during the period of recruitment and study enrolment) • Aged 55 years and older and with complaints of fatigue • Karnofsky Performance Scale score ≥ 80 • English speaking • No documented history of neurological deficits or mental illness such as psychotic depression in the past year • No neuromuscular deficits that would contraindicate a walking exercise intervention Exclusion criteria: • None reported | |
| Interventions | 10 participants assigned to exercise intervention:
Adherence:
10 participants assigned to control:
| |
| Outcomes | Outcomes:
Numbers of participants assessed:
Adverse events: not reported | |
| Notes | Trial registration link: none available Trial authors contacted: Trial authors were contacted for means and SDs for outcomes. Trial authors did provide some additional data, but not for all requested outcomes. Intention‐to‐treat analysis: unclear, no description of how missing data were handled Funding: NIH/National Institute of Nursing Research | |
| Risk of bias | ||
| Bias | Authors' judgement | Support for judgement |
| Random sequence generation (selection bias) | Unclear risk | Generation of allocation sequence was not described. |
| Allocation concealment (selection bias) | Unclear risk | Whether treatment assignment was concealed from study personnel and participants was not described. |
| Blinding of participants and personnel (performance bias) | High risk | Owing to the nature of the intervention, it was not possible to conceal allocation to the intervention from participants. |
| Blinding of outcome assessment (detection bias) | High risk | Study personnel and outcome assessors were not masked or blinded to study interventions. |
| Incomplete outcome data (attrition bias) | Unclear risk | Trial authors did not describe how missing data were handled. Participants in each group withdrew from the study. |
| Selective reporting (reporting bias) | Low risk | No selective reporting of outcomes is apparent. |
| Other bias | Unclear risk | Characteristics of participants in each group were not well described; therefore, it was difficult to assess whether groups were similar at baseline. |
| Methods | Study design: multi‐centre RCT Number randomised: 167; 75 to Yoga intervention, 92 to control Study start: 2007; stop date: 2012 Length of intervention: 4 weeks Length of follow‐up: to end of intervention Country: USA | |
| Participants | Age, years (mean SE):
Stage, n (%):
Inclusion criteria: • Enrolled between 2 and 24 months post surgery, chemotherapy, and/or radiation therapy. For the original study, eligible survivors were required to: • Have a confirmed diagnosis of cancer • Have undergone and completed standard treatment for cancer • Have sleep disturbance (indicated by a response ≥ 3 on a clinical symptom inventory using an 11‐point scale anchored by ‘‘0’’ = no sleep disturbance and ‘‘10’’ = worst possible sleep disturbance) • Be able to read English • Be 21 years of age or older • Be able to give written informed consent • Not have maintained a regular personal practice of yoga within the 3 months before enrolling in the study, or be planning to start yoga on their own during the time they are enrolled in the study • Not have a confirmed diagnosis of sleep apnoea • Not be receiving any form of treatment for cancer, with the exception of hormonal or monoclonal antibody therapy • Not have metastatic cancer Exclusion criteria: • Not reported | |
| Interventions | 75 participants assigned to exercise intervention:
Adherence: Not reported 92 participants assigned to control:
| |
| Outcomes | Outcomes: Musculoskeletal symptoms assessed via selected extracted questions from the following validated questionnaires:
Numbers of participants assessed:
Adverse events: not reported | |
| Notes | Trial registration link: https://clinicaltrials.gov/ct2/show/NCT00397930 Trial authors contacted: Trial authors were contacted for means and SDs for outcomes. However, they did not provide these data. Intention‐to‐treat analysis: yes, no missing data were reported Funding: NCI and the Office of Cancer Complementary and Alternative Medicine | |
| Risk of bias | ||
| Bias | Authors' judgement | Support for judgement |
| Random sequence generation (selection bias) | Low risk | "Group assignment was determined by a computer‐generated random numbers table in blocks of two and an allocation ratio of 1:1". |
| Allocation concealment (selection bias) | Unclear risk | Whether allocation was concealed was not reported. |
| Blinding of participants and personnel (performance bias) | High risk | Owing to the nature of the intervention, it was not possible to conceal allocation to the intervention from participants. |
| Blinding of outcome assessment (detection bias) | Unclear risk | It was not mentioned whether study personnel and outcome assessors were masked or blinded to study interventions. |
| Incomplete outcome data (attrition bias) | Low risk | No missing data were reported; "all data were analysed using the intent‐to‐treat principle". |
| Selective reporting (reporting bias) | Low risk | No selective reporting of outcomes is apparent. |
| Other bias | High risk | This study consisted of a secondary analysis from the original study; "the original RCT was designed to test the effect of yoga on sleep quality in all cancer survivors. There was no a priori aim in the study to examine the effect of yoga on musculoskeletal symptoms in breast cancer survivors on endocrine therapy". |
| Methods | Study design: single‐centre RCT Number randomised: 24; 12 to intervention, 12 to control Study start: not reported; stop date: not reported Length of intervention: 12 weeks Length of follow‐up: to end of intervention Country: USA | |
| Participants | Age, years (mean SD):
Stage, n (%):
Inclusion criteria: • Sedentary women (exercised < 3 times per week for 20 minutes per session) • Received diagnosis of breast cancer (stage 0, I, or II) over the past 3 years • Postsurgery patients who had completed chemotherapy or radiation treatment Exclusion criteria: • Medical or current psychiatric illness that would make compliance with the study protocol difficult or dangerous (e.g. coronary artery disease, hypertension, diabetes) • Orthopaedic problems or neuropathies that would limit exercise training • Medications that would alter training responses (e.g. beta‐blockers) or affect distress outcomes (e.g. antidepressants) | |
| Interventions | 12 participants assigned to exercise intervention:
Adherence:
12 participants assigned to control:
| |
| Outcomes | Outcomes:
Numbers of participants assessed:
Nine participants in the intervention group completed exercise stress tests post intervention; 3 participants in this group withdrew but provided postintervention questionnaire data. Adverse events: not reported | |
| Notes | Trial registration link: none available Trial authors contacted: no Intention‐to‐treat analysis: no Funding: National Institute of Mental Health | |
| Risk of bias | ||
| Bias | Authors' judgement | Support for judgement |
| Random sequence generation (selection bias) | Unclear risk | Generation of the random sequence was not described. |
| Allocation concealment (selection bias) | Unclear risk | Whether treatment assignment was concealed from study personnel and participants was not described. |
| Blinding of participants and personnel (performance bias) | High risk | Owing to the nature of the intervention, it was not possible to conceal allocation to the intervention from participants. |
| Blinding of outcome assessment (detection bias) | High risk | Study personnel and outcome assessors were not masked or blinded to study interventions. |
| Incomplete outcome data (attrition bias) | High risk | Postintervention exercise stress test and weight data were unavailable for the control group, and postintervention mood and self‐esteem data were available for only half of the control group. Six (50%) control participants were not included in the analyses. |
| Selective reporting (reporting bias) | Low risk | No selective reporting of outcomes is apparent. |
| Other bias | High risk | Small sample size was further hampered by a high dropout rate, particularly in the control group (50%). |
| Methods | Study design: RCT Number randomised: 86; 43 to intervention, 43 to control Study start: not reported; stop date: not reported Length of intervention: 12 weeks Length of follow‐up: at 12 weeks, and at 6 months and 9 months post baseline Country: USA | |
| Participants | Age, years (mean SD):
Stage, n (%):
Inclusion criteria: • Age ≥ 18 years • Currently sedentary (exercised < 1 time per week for 20 minutes at vigorous intensity or < 2 times per week for 30 minutes at moderate intensity for the past 6 months) • Received diagnosis of stage 0 to II breast cancer over the last 5 years and completed surgery, chemotherapy, and/or radiation • Ambulatory (able to walk a mile without assistive devices) • Willing to be randomised Exclusion criteria: • Prior history of cancer (exception: non‐melanoma skin cancer) • Medical or current psychiatric illness that could make compliance with the study protocol difficult or dangerous (e.g. cardiovascular disease, diabetes, orthopaedic problems that limit exercise training) | |
| Interventions | 43 participants assigned to exercise intervention:
Adherence:
43 participants assigned to control:
| |
| Outcomes | Outcomes:
Numbers of participants assessed:
Adverse events: not reported | |
| Notes | Trial registration link: none available Trial authors contacted: no Intention‐to‐treat analysis: yes, but used LOCF Funding: National Cancer Institute grant | |
| Risk of bias | ||
| Bias | Authors' judgement | Support for judgement |
| Random sequence generation (selection bias) | Unclear risk | Generation of the random sequence was not described. |
| Allocation concealment (selection bias) | Unclear risk | Whether treatment assignment was concealed from study personnel and participants was not described. |
| Blinding of participants and personnel (performance bias) | High risk | Owing to the nature of the intervention, it was not possible to conceal allocation to the intervention from participants. |
| Blinding of outcome assessment (detection bias) | High risk | Study personnel and outcome assessors were not masked or blinded to study interventions. |
| Incomplete outcome data (attrition bias) | High risk | LOCF approach was used. Four participants withdrew from the exercise group before the end of the 12‐week intervention. Two participants withdrew from the control group before the 6‐month assessment, and another 2 participants withdrew from the control group before the 9‐month assessment. Reasons for control group withdrawals were not given. |
| Selective reporting (reporting bias) | Low risk | No selective reporting of outcomes is apparent. |
| Other bias | High risk | Adherence to physical activity was low (40.7%). |
| Methods | Study design: multi‐centre RCT Number randomised: 76; 39 to intervention, 37 to control Study start: January 2010; stop date: April 2012 Length of intervention: 12 weeks Length of follow‐up: at 24 weeks Country: USA | |
| Participants | Age, years (mean SD):
Stage, n (%):
Inclusion criteria: • Aged ≥ 21 years with diagnosis of stage 0–III breast cancer in the past 5 years • Completed surgery (patients receiving ongoing chemotherapy (most had completed), radiation, or hormone treatment were eligible) • Ability to read and speak English • Ability to walk a half‐mile without stopping • Sedentary: < 30 minutes/week of vigorous physical activity or < 90 minutes/week of moderate‐intensity physical activity for the past 6 months • Access to a telephone and willingness to receive calls Exclusion criteria: • Medical or psychiatric problems (e.g. myocardial infarction, orthopaedic problems) that might interfere with protocol adherence | |
| Interventions | 39 participants assigned to physical activity intervention:
Adherence: At 12 weeks, weekly moderate‐vigorous physical activity participation in the intervention group averaged 130 minutes, and at week 24, 98 minutes. 37 participants assigned to control:
| |
| Outcomes | Primary outcome:
Other outcomes:
Numbers of participants assessed:
Adverse events: not reported | |
| Notes | Trial registration link: https://clinicaltrials.gov/ct2/show/NCT00948701 Trial authors contacted: no Intention‐to‐treat analysis: yes Funding: grant from the National Cancer Institute (R01CA132854) to the first trial author | |
| Risk of bias | ||
| Bias | Authors' judgement | Support for judgement |
| Random sequence generation (selection bias) | Unclear risk | "Seventy six breast cancer survivors were randomized to PA Plus RTR or RTR Control". |
| Allocation concealment (selection bias) | Unclear risk | Whether treatment assignment was concealed from study personnel and participants was not described. |
| Blinding of participants and personnel (performance bias) | High risk | Owing to the nature of the intervention, it was not possible to conceal allocation to the intervention from participants. |
| Blinding of outcome assessment (detection bias) | Low risk | “A research assistant (blind to the participant’s group assignment) was responsible for collecting all data by mail or by telephone”. |
| Incomplete outcome data (attrition bias) | Low risk | “Generalized linear models take a likelihood‐based approach to estimation and thus make use of all available data without directly imputing missing values”. |
| Selective reporting (reporting bias) | Low risk | No selective reporting of outcomes is apparent. |
| Other bias | Low risk | Trial appears to be free of other problems that could put it at high risk of bias. |
| Methods | Study design: single‐centre RCT Number randomised: 44; 16 to gym‐exercise, 19 to home‐exercise, 9 to no‐exercise control Study start: recruitment began 2004; stop date: recruitment ended 2007 Length of intervention: 26 weeks Length of follow‐up: to end of intervention Country: Puerto Rico | |
| Participants | Data available on the 34 participants who completed postintervention testing: Age, years (mean SD):
Stage, n (%):
Inclusion criteria: • Women with new diagnosis of unilateral breast cancer who had received surgical treatment for breast cancer in the past 5 years, with or without adjuvant therapy Exclusion criteria: • Unstable cardiac disease • Coagulopathies • Active psychiatric conditions • Metastasis • Haemoglobin level < 8.0 g/dL • Absolute neutrophil count < 0.5 × 1000/mL • Platelet count < 50 × 1000/mL • Ataxia, dizziness, or peripheral sensory neuropathy • Loss of more than 35% of premorbid weight • Dyspnoea • Bone pain • Severe nausea, extreme fatigue, and extreme muscle weakness. Exclusion criteria are considered contraindications to moderate‐intensity exercise programme following cancer diagnosis. | |
| Interventions | 35 participants assigned to 1 of 2 exercise interventions:
Adherence:
9 participants assigned to control:
| |
| Outcomes | Outcome:
Numbers of participants assessed:
Adverse events:
| |
| Notes | Trial registration link: none available Trial authors contacted: no Intention‐to‐treat analysis: no Funding: grant number 5P20RR011126 from the National Center for Research Resources, a component of the National Institutes of Health | |
| Risk of bias | ||
| Bias | Authors' judgement | Support for judgement |
| Random sequence generation (selection bias) | Low risk | Randomisation of participants was performed by a computer‐generated scheme developed with the Statistical Analysis System. |
| Allocation concealment (selection bias) | Unclear risk | Whether allocation was concealed is unclear. |
| Blinding of participants and personnel (performance bias) | High risk | Owing to the nature of the intervention, it was not possible to conceal allocation to the intervention from participants. |
| Blinding of outcome assessment (detection bias) | Low risk | “One physical therapist, blinded to group assignment, evaluated the participants in this study. Participants were instructed not to discuss their exercise programs or group assignment with the evaluator”. |
| Incomplete outcome data (attrition bias) | High risk | Pre‐post‐test analysis was performed only on those who completed all assessments. No information regarding handling of missing data was provided. |
| Selective reporting (reporting bias) | Low risk | No selective reporting of outcomes is apparent. |
| Other bias | Low risk | Trial appears to be free of other problems that could put it at high risk of bias. |
| Methods | Study design: single‐centre RCT Number randomised: 32; intervention, not specified; control, not specified Study start: not reported; stop date: not reported Length of intervention: 15 weeks Length of follow‐up: to end of intervention Country: Iran | |
| Participants | Age, years:
Stage: stage I‐IIIB Inclusion criteria: • 50 to 65 years old • Women who received surgery, chemotherapy, and radiotherapy and currently were taking hormone therapy • Stage I‐IIIB • No specific illness in the past 6 months • No experience of a menstrual cycle • No participation in exercise training or physical activity in the past 6 months • No change in body weight during this period (last 6 months) as great as 10% of their whole body weight Exclusion criteria: • None reported | |
| Interventions | The number of participants assigned to the exercise intervention was not specified:
Adherence: not reported Number of participants assigned to control not specified:
| |
| Outcomes | Outcomes:
Numbers of participants assessed:
Adverse events: not reported | |
| Notes | Trial registration link: none available Trial authors contacted: no Intention‐to‐treat analysis: no Funding: none specified | |
| Risk of bias | ||
| Bias | Authors' judgement | Support for judgement |
| Random sequence generation (selection bias) | Unclear risk | Generation of the random sequence was not described. |
| Allocation concealment (selection bias) | Unclear risk | Whether treatment assignment was concealed from study personnel and participants was not described. |
| Blinding of participants and personnel (performance bias) | High risk | Owing to the nature of the intervention, it was not possible to conceal allocation to the intervention from participants. |
| Blinding of outcome assessment (detection bias) | Low risk | “All the measurements were obtained twice and recorded by one staff that was blinded to subjects in pre‐ and post‐tests”. |
| Incomplete outcome data (attrition bias) | High risk | Three participants withdrew during the study period; reasons for withdrawals were not reported. No intention‐to‐treat analysis was performed. |
| Selective reporting (reporting bias) | Low risk | No selective reporting of outcomes is apparent. |
| Other bias | Low risk | Trial appears to be free of other problems that could put it at high risk of bias. |
| Methods | Study design: single‐centre RCT Number randomised: 41; 21 to intervention, 20 to control Study start: April 2006; stop date: July 2007 Length of intervention: 12 weeks Length of follow‐up: immediately post intervention and at 3 months post intervention Country: USA | |
| Participants | Age, years (mean SD):
Stage, n (%):
Inclusion criteria: • English‐speaking female breast cancer survivors between the ages of 18 and 70 years with a diagnosis of stage I, II, or IIIA disease • Currently taking aromatase inhibitors or selective estrogenic receptor modulators and expected to remain on hormonal therapy for the duration of the study (i.e. ≥ 8 months) Exclusion criteria: • Diagnosis of dementia or organic brain syndrome • Medical, psychological, or social characteristic that would interfere with ability to fully participate in programme activities and assessments (e.g. psychosis, schizophrenia) • Contraindication to participation in a regular physical activity programme (e.g. unstable angina, debilitating arthritis pain) • Breast cancer recurrence or metastatic disease; inability to ambulate; planning to relocate out of the study area during the 8‐month study period • Engaged in > 60 minutes of vigorous physical activity or > 150 minutes of moderate plus vigorous activity per week during the past month (based on self‐report) | |
| Interventions | 21 participants assigned to exercise intervention:
Adherence:
20 participants assigned to control:
| |
| Outcomes | Outcomes:
Numbers of participants assessed:
Adverse events: No adverse events related to the intervention nor to other study procedures occurred. The following non‐serious, non‐related events were recorded: wheezing requiring physician valuation for asthma, cholinergic urticaria, herpes zoster, sinusitis, back pain related to falling, and elective cosmetic reconstructive surgery. | |
| Notes | Trial registration link: none available Trial authors contacted: no Intention‐to‐treat analysis: no, but minimal loss to follow‐up (n = 2) Funding: Southern Illinois University School of Medicine Excellence in Academic Medicine Award, Brooks Medical Research Fund, and Memorial Medical Center Foundation Regional Cancer Center | |
| Risk of bias | ||
| Bias | Authors' judgement | Support for judgement |
| Random sequence generation (selection bias) | Low risk | Randomisation was computer generated. |
| Allocation concealment (selection bias) | Low risk | “Randomization was kept in sealed envelopes until randomization to prevent bias in group allocation by study personnel”. |
| Blinding of participants and personnel (performance bias) | High risk | Owing to the nature of the intervention, it was not possible to conceal allocation to the intervention from participants. |
| Blinding of outcome assessment (detection bias) | Unclear risk | It was not mentioned whether study personnel and outcome assessors were masked or blinded to study interventions. |
| Incomplete outcome data (attrition bias) | Low risk | Loss to follow‐up was minimal. Reasons for exclusions were presented. |
| Selective reporting (reporting bias) | Low risk | No selective reporting of outcomes is apparent. |
| Other bias | Low risk | Trial appears to be free of other problems that could put it at high risk of bias. |
| Methods | Study design: single‐centre RCT Number randomised, 28; 15 to intervention, 13 to control Study recruitment start: June 2008; recruitment stop date: April 2009 Length of intervention: 3 months Length of follow‐up: to end of intervention Country: USA | |
| Participants | Age, years (mean SD):
Stage, n (%):
Inclusion criteria: • Female • Stage I, II, IIIA breast cancer survivors between the ages of 18 and 70 years • Not currently receiving (and not planning to receive during the study duration) chemotherapy or radiation therapy • ≥ 8 weeks post surgery • English speaking • Medical clearance for participation provided by physician Exclusion criteria: • Dementia or organic brain syndrome • Medical, psychological, or social characteristics that would interfere with ability to fully participate in study activities (e.g. psychosis) • Contraindication to participate in a regular physical activity programme • Metastatic or recurrent disease • Inability to ambulate • Engaging in ≥ 60 weekly minutes of vigorous physical activity or ≥ 150 weekly minutes of moderate plus vigorous activity during the past month (based on self‐report) • Anticipated elective surgery during the intervention that would interfere with participation (e.g. breast reconstructive surgery) • Did not live or work within 50 miles of study site | |
| Interventions | 15 participants assigned to exercise intervention:
Adherence:
13 participants assigned to control:
| |
| Outcomes | Outcomes:
Numbers of participants assessed:
Adverse events: Three adverse events were identified ‐ 2 related and non‐serious in the intervention group, and 1 non‐related and serious in the control group. | |
| Notes | Trial registration link: https://clinicaltrials.gov/ct2/show/NCT00640666 Trial authors contacted: no Intention‐to‐treat analysis: no Funding: Simmons Cancer Institute at Southern Illinois University School of Medicine Translational Research Award. Drs. Rogers, Hopkins‐Price, Vicari, Rao, and Verhulst receive salary support from National Cancer Institute Grant 1R21CA135017. Drs. Rogers, Hopkins‐Price, Vicari, and Verhulst also receive salary support from National Cancer Institute Grant 5R01CA136859. Dr. Courneya is supported by the Canada Research Chairs Program and National Cancer Institute Grant 5R01CA136859. | |
| Risk of bias | ||
| Bias | Authors' judgement | Support for judgement |
| Random sequence generation (selection bias) | Low risk | "Randomization was based on computer generated numbers, performed in blocks of 4, and revealed in the order in which participants completed baseline testing". |
| Allocation concealment (selection bias) | Unclear risk | Whether treatment assignment was concealed from study personnel and participants was not described. |
| Blinding of participants and personnel (performance bias) | High risk | Owing to the nature of the intervention, it was not possible to conceal allocation to the intervention from participants. |
| Blinding of outcome assessment (detection bias) | Unclear risk | "All assays were performed by an investigator blinded to the experimental treatment". Other outcome assessment blinding was not described. |
| Incomplete outcome data (attrition bias) | High risk | Data analysis was based only on study participants completing both baseline and 3‐month follow‐up. 8 participants were excluded. |
| Selective reporting (reporting bias) | Low risk | No selective reporting of outcomes is apparent. |
| Other bias | Low risk | Trial appears to be free of other problems that could put it at high risk of bias. |
| Methods | Study design: single‐centre RCT Number randomised: 46; 22 to intervention, 24 to control group Study start: not reported; stop date: not reported Length of intervention: 3 months Length of follow‐up: to end of intervention Country: USA | |
| Participants | Baseline data available for 20 intervention and 24 control participants: Age, years (mean SD):
Stage, n (%):
Inclusion criteria: • Female • 30 to 70 years of age, ductal carcinoma in situ (DCIS), stage I or II breast cancer • At least 4 weeks status post final primary treatment administration (longer‐term therapies such as aromatase inhibitors, oestrogen receptor modulators allowed) • ≥ 8 weeks post surgical procedure • English speaking • Medical clearance for participation provided by physician • Postmenopausal • Average fatigue over the past week rated as ≥ 3 on a 1 to 10 Likert scale, or sleep dysfunction ≥ 1 on a 0 to 3 Likert scale • Willingness to abstain from “as needed” medications for 7 days before each blood draw Exclusion criteria: • Metastatic or recurrent breast cancer • Inability to ambulate without assistance • Unstable angina • New York Heart Association Class II, III, or IV congestive heart failure • Uncontrolled asthma • Interstitial lung disease • Current use of steroids • Having been told by a physician to do only exercise prescribed by a physician • Dementia or organic brain syndrome • Schizophrenia or active psychosis • Connective tissue or rheumatological disease (i.e. systemic lupus erythematosus, rheumatoid arthritis, amyloidosis, Reiter's syndrome, psoriatic arthritis, mixed connective tissue disease, Sjögren's syndrome, progressive systemic sclerosis, CREST syndrome, polymyositis, dermatomyositis, vasculitis, polymyalgia rheumatic, temporal arteritis) • Participating, on average, in more than 20 minutes of physical activity on 2 or more days per week during the past 6 months • Elective surgery planned to occur during the time of the intervention that would interfere with intervention participation (e.g. breast reconstructive surgery) • Living or working > 50 miles from study site • Lack of transportation to study site • Changes in usual medications expected during the study time period • Planning to move residence out of the local area during the 5 months of study participation • Planning to travel out of the local area for vacation during the first 4 weeks of the intervention, or planning to travel out of the local area for longer than a week during the last 8 weeks of the intervention • Contraindication to participation in exercise (i.e. moderate‐intensity walking and strength training with resistance bands) | |
| Interventions | 22 participants allocated to exercise intervention:
Adherence (based on session record sheets):
24 participants assigned to control:
| |
| Outcomes | Primary outcome:
Other outcomes:
Numbers of participants assessed:
Adverse events:
| |
| Notes | Trial registration link: https://clinicaltrials.gov/ct2/show/NCT01147367 Trial authors contacted: no Intention‐to‐treat analysis: no Funding: supported by National Cancer Institute R21CA135017 | |
| Risk of bias | ||
| Bias | Authors' judgement | Support for judgement |
| Random sequence generation (selection bias) | Low risk | "randomization in blocks of four based on computer generated numbers" |
| Allocation concealment (selection bias) | Low risk | "Participants were randomized in the order in which they completed baseline testing. Randomization numbers were kept in sealed, opaque envelopes so that study staff and participants were unaware of group allocation until all baseline testing was complete". |
| Blinding of participants and personnel (performance bias) | High risk | Owing to the nature of the intervention, it was not possible to conceal allocation to the intervention from participants. |
| Blinding of outcome assessment (detection bias) | Low risk | Physical measures were obtained by individuals who were blinded to participants' study group allocation. |
| Incomplete outcome data (attrition bias) | High risk | "Intent‐to‐treat analysis was performed (i.e. differences between the study groups were assessed with all data regardless of the participant's adherence to the exercise in the intervention group or self‐initiation of exercise in the control group)". However, only participants with follow‐up data were included in analysis (4 participants were excluded). |
| Selective reporting (reporting bias) | Low risk | No selective reporting of outcomes is apparent. |
| Other bias | Low risk | Trial appears to be free of other problems that could put it at high risk of bias. |
| Methods | Study design: multi‐centre RCT Number randomised: 222; 110 to intervention, 112 to control Study start: January 2010; stop date: September 2013 Length of intervention: 3 months Length of follow‐up: at 3 months Country: USA | |
| Participants | Age, years (mean SD):
Stage, n (%):
Inclusion criteria: • Women aged 18 to 70 years with history of ductal carcinoma in situ (DCIS) or stage I‐IIIA breast cancer who were not currently receiving or planning to receive chemotherapy or radiation therapy • C8 weeks post surgical procedure • English speaking • Medical clearance for participation provided by physician • Participating, on average, in 30 minutes of vigorous physical activity or 60 minutes of moderate activity per week during the past 6 months Exclusion criteria: • Dementia or organic brain syndrome • Disorders that would interfere with ability to fully participate in assessments and BEAT Cancer activities (e.g. psychosis, schizophrenia) • Contraindication to participation in regular physical activity • Metastatic or recurrent breast cancer • Inability to ambulate • Elective surgery anticipated during the intervention that would interfere with participation (e.g. breast reconstructive surgery) • Travel plans interfering with scheduled study sessions • Participating in another exercise study | |
| Interventions | 110 participants assigned to exercise intervention:
Adherence: Adherence to planned BEAT Cancer components was 98% for supervised exercise sessions, 96% for update sessions, and 91% for discussion group sessions. Only 5 BEAT Cancer participants did not receive the allocated intervention (i.e. did not complete 75% of all intervention components combined). 112 participants assigned to control:
| |
| Outcomes | Primary outcome:
Other outcomes:
Numbers of participants assessed:
Adverse events: Only 1 related serious adverse event occurred (intervention group; pelvic stress fracture). Related expected adverse events in the BEAT Cancer group included back or lower extremity musculoskeletal pain or injury (n = 14), heart rate monitor rash (n = 1), fall while walking (n = 1), breast reconstruction (n = 3), and chest pain during treadmill fitness testing (n = 1). Related adverse events in the UC group included arm tingling (n = 1) during the treadmill test and knee tendonitis (n = 1). | |
| Notes | Trial registration link: none available Trial authors contacted: no Intention‐to‐treat analysis: yes Funding: supported by National Cancer Institute R01CA136859 | |
| Risk of bias | ||
| Bias | Authors' judgement | Support for judgement |
| Random sequence generation (selection bias) | Low risk | Randomisation, based on computer‐generated numbers, is performed in blocks of 4 within each site to facilitate equal distribution between the 2 study groups at each site. |
| Allocation concealment (selection bias) | Low risk | Computer generated numbers for each site; numbers were placed in sealed, opaque envelopes and were delivered to the collaborating site with a written protocol for use. |
| Blinding of participants and personnel (performance bias) | High risk | Owing to the nature of the intervention, it was not possible to conceal allocation to the intervention from participants. |
| Blinding of outcome assessment (detection bias) | Low risk | “Assessment tools are administered … by an exercise specialist (blinded to the participant's study group allocation) in the exercise laboratory”. |
| Incomplete outcome data (attrition bias) | Low risk | “All analyses were intention‐to‐treat with all data available being used”. |
| Selective reporting (reporting bias) | Low risk | No selective reporting of outcomes is apparent. |
| Other bias | Low risk | Trial appears to be free of other problems that could put it at high risk of bias. |
| Methods | Study design: single‐centre RCT Country: Finland | |
| Participants | Age, years, at baseline, mean (range):
Stage:
Inclusion criteria: • Histologically confirmed newly diagnosed invasive breast cancer (T1‐4 N0‐3 M0) • Pre‐ and postmenopausal women treated with adjuvant chemotherapy or radiation therapy within last 4 months • Started endocrine therapy (anti‐oestrogens, aromatase inhibitors, luteinising hormone‐releasing hormone agonists, or a combination) no more than 4 months earlier • 35 to 68 years old • Signed informed consent before the start of protocol‐specific procedures Exclusion criteria: • Male gender • Prior malignancy except basal cell carcinoma or in situ carcinoma • Hematogenous metastases (M1) • Systemic adjuvant therapy • Postmenopausal women with anti‐oestrogens as the only adjuvant treatment (with or without radiation therapy) • Pregnancy or recent lactation (< 1 year) • Severe cardiac disease (NYHA Class III or greater) • Myocardial infarction within 12 months • Uncontrolled hypertension • Verified osteoporosis (proximal femur or lumbar spine T‐score < ‐2.5 or fracture without trauma) • Concomitant medications affecting calcium and bone metabolism such as bisphosphonates, calcitonin, parathyroid hormone, selective oestrogen receptor modulators, oral corticosteroids (over 6 months), anticonvulsants (phenytoin, carbamatsebin), and prolonged heparin therapy • Other diseases affecting calcium and bone metabolism such as hyperthyroidism, newly diagnosed hypothyroidism, primary hyperparathyroidism, renal failure, chronic hepatic diseases, organ transplant • Residency more than 1 hour from the exercise centre • Competitive athlete • Treated only with radiation therapy • Incapable of training (e.g. severe cardiac disease, osteoporosis, severe knee arthrosis, ligament or cartilage injuries at lower extremities) • Other serious illness or medical condition, which could be a contraindication to exercise | |
| Interventions | 302 participants assigned to a 2‐component supervised 12‐month exercise training intervention, with each component performed in alternate weeks. Components included:
Adherence: Premenopausal trainees attended a median of 30/52 (58%) supervised training sessions:
Postmenopausal trainees attended a median of 33/52 (63%) training sessions:
271 participants assigned to control:
| |
| Outcomes | No primary outcome was identified. Physical outcomes:
In subsample study of 86 participants (37 intervention and 40 control):
QoL outcomes:
Numbers of participants assessed:
Numbers of participants assessed in subsample study:
Adverse events: none reported | |
| Notes | Trial registration link: https://clinicaltrials.gov/ct2/show/NCT00639210 Trial authors contacted: no Intention‐to‐treat analysis: no | |
| Risk of bias | ||
| Bias | Authors' judgement | Support for judgement |
| Random sequence generation (selection bias) | Low risk | "A computer‐generated randomisation schedule was used to allocate patients". |
| Allocation concealment (selection bias) | Low risk | "Study nurse performed randomisation after baseline visit". "randomisation was centralised" |
| Blinding of participants and personnel (performance bias) | High risk | Owing to the nature of the intervention, it was not possible to conceal allocation to the intervention from participants. |
| Blinding of outcome assessment (detection bias) | Low risk | "examiner blinded" |
| Incomplete outcome data (attrition bias) | High risk | Incorrect ITT; "Analyses were performed on an intention‐to‐treat basis for all participants who completed the baseline and at least one follow‐up measurement" |
| Selective reporting (reporting bias) | Low risk | No selective reporting of outcomes is apparent. |
| Other bias | Low risk | Trial appears to be free of other problems that could put it at high risk of bias. |
| Methods | Study design: single‐centre RCT Number randomised: 86; 43 to intervention, 43 to delayed exercise control Study start: October 2001; stop date: June 2002 Length of intervention: 6 months Length of follow‐up: to end of intervention Country: USA | |
| Participants | Age, years (mean SD):
Stage, n (%):
Inclusion criteria: • Completed all treatment except hormonal therapy for breast cancer • Body weight stable within 10% over the past year • Non‐smoker for at least the past 2 years • Sedentary to moderately physically active (no more than 3 sessions per week of no more than moderate‐intensity activity; no weight training history) Exclusion criteria: • Medical condition prohibiting participation in a weight training programme • Morbidly obese (BMI > 40 kg/m²) • Hypertensive (systolic blood pressure > 160 mmHg, diastolic blood pressure > 99 mmHg, or both) • Currently on a weight loss plan or planning to start a weight loss plan during the period of the study • Planning to move away from the area or to be away from the area for > 3 weeks during study • Not pregnant or lactating, and not planning to become pregnant during the study period | |
| Interventions | 43 participants assigned to exercise intervention:
Adherence:
43 participants assigned to control:
| |
| Outcomes | Primary outcomes:
Numbers of participants assessed:
Adverse events: cancer recurrence: 4 in total ‐ 2 each in intervention and control groups; some limited musculoskeletal issues that were self‐resolving | |
| Notes | Trial registration link: none available Trial authors contacted: no Intention‐to‐treat analysis: no Funding: Susan G. Komen Foundation, grants to the UMN GCRC from the NIH | |
| Risk of bias | ||
| Bias | Authors' judgement | Support for judgement |
| Random sequence generation (selection bias) | Low risk | “Random number table” |
| Allocation concealment (selection bias) | Low risk | “The randomization procedure used prevented investigators from influencing treatment allocation”. |
| Blinding of participants and personnel (performance bias) | High risk | Owing to the nature of the intervention, it was not possible to conceal allocation to the intervention from participants. |
| Blinding of outcome assessment (detection bias) | Low risk | Physiological measures were taken by trained staff blinded to participant status, with the exception of strength measures. |
| Incomplete outcome data (attrition bias) | High risk | 4 participants were lost to follow‐up in the intervention group ‐ 2 for recurrences and 2 as the result of withdrawals; 3 participants were lost to follow‐up in the control group ‐ 2 for recurrences and 1 as the result of withdrawal; none of these were included in analyses. |
| Selective reporting (reporting bias) | Low risk | No selective reporting of outcomes is apparent. |
| Other bias | Low risk | Trial appears to be free of other problems that could put it at high risk of bias. |
| Methods | Study design: single‐centre RCT Number randomised: 295; 148 (71 with lymphoedema and 77 without lymphoedema) to the intervention, 147 (70 with lymphoedema and 77 without lymphoedema) to control Study start: October 2005; stop date: August 2008 Length of intervention: 12 months Length of follow‐up: to end of intervention Country: USA | |
| Participants | Age, for women with lymphoedema, years (mean SD):
Age, for women without lymphoedema, years (mean SD):
Stage, for women with lymphoedema, n (%):
Stage, for women without lymphoedema, n (%):
Inclusion criteria: • Female • History of unilateral non‐metastatic breast cancer • Body mass index (calculated as weight in kilograms divided by height in meters squared) ≤ 50 • Currently cancer free • No medical condition that would limit participation in exercise • No weight lifting during the year before study entry • No plans for surgery or to be away for at least 1 month during the study • Currently weight stable and not actively trying to lose weight Additional inclusion criteria, for women with lymphoedema: • 1 to 15 years post diagnosis • At least 1 lymph node removed • Presence of lymphoedema Additional inclusion criteria, for women without lymphoedema: • 1 to 5 years post diagnosis • At least 2 lymph nodes removed • No prior lymphoedema diagnosis • No evidence of current lymphoedema Exclusion criteria for women with lymphoedema: • Intensive therapy in the past 3 months • Recorded 10% change in volume or circumference of affected arm in the past 3 months for ≥ 7 days • More than 1 lymphoedema‐related infection requiring antibiotics (cellulitis) in the past 3 months | |
| Interventions | 148 participants (71 with lymphoedema and 77 without lymphoedema) assigned to the exercise intervention, consisting of progressive strength (weight) training:
Adherence:
147 participants (70 with lymphoedema and 77 without lymphoedema) assigned to control:
| |
| Outcomes | Outcomes:
For women with lymphoedema, outcomes were measured as follows:
For women without lymphoedema, outcomes were measured as follows:
Adverse events among participants with lymphoedema:
Adverse events among participants without lymphoedema:
| |
| Notes | Trial registration link: https://clinicaltrials.gov/ct2/show/NCT00194363 Trial authors contacted: no Intention‐to‐treat analysis: no Funding: NIH/National Cancer Institute and the Public Health Services Research Grant | |
| Risk of bias | ||
| Bias | Authors' judgement | Support for judgement |
| Random sequence generation (selection bias) | Low risk | Allocation sequence was a computer‐generated minimisation scheme. |
| Allocation concealment (selection bias) | Low risk | “...de‐identified data for ... variables were entered after completion of all baseline measures, the study coordinator then called participants to reveal the outcome of randomization and to schedule groups for the supervised groups" |
| Blinding of participants and personnel (performance bias) | High risk | Owing to the nature of the intervention, it was not possible to conceal allocation to the intervention from participants. |
| Blinding of outcome assessment (detection bias) | Low risk | Measurements obtained by “trained staff who were unaware of the study‐group assignments” “Measurement staff (including CLTs) were blinded to treatment allocation”. |
| Incomplete outcome data (attrition bias) | High risk | No evidence suggests that missing data were adequately and appropriate addressed. Large numbers of study participants withdrew; 11 women without lymphoedema withdrew from the intervention group and 9 women without lymphoedema withdrew from the control group. |
| Selective reporting (reporting bias) | Low risk | No selective reporting of outcomes is apparent. |
| Other bias | Low risk | Trial appears to be free of other problems that could put it at high risk of bias. |
| Methods | Study design: single‐centre quasi‐randomised partial cross‐over controlled trial. Only first treatment period included here Number randomised: 30; 10 to exercise intervention, 10 to exercise and behavioural intervention, 10 to control Study start: not reported; stop date: not reported Length of intervention: 10 weeks Length of follow‐up: at 12 weeks Country: USA | |
| Participants | Age, years (mean SD):
Stage, n (%):
Inclusion criteria: • Any type of breast cancer surgery • 30 to 65 years old • Not currently participating in exercise • No contraindications to exercise • Written release from the physician Exclusion criteria: • Cardiovascular or pulmonary disease • Known physical disabilities | |
| Interventions | 10 participants assigned to exercise intervention:
10 participants assigned to exercise and behavioural modification intervention:
Adherence:
10 participants assigned to control:
| |
| Outcomes | Primary outcomes:
Time points of assessments: baseline, at 10 weeks Numbers of participants assessed:
Reasons for missing data:
Adverse events: none reported Subgroup analysis: none reported | |
| Notes | Trial registration link: none available Trial authors contacted: no Intention‐to‐treat analysis: no Funding: Michigan Initiative for Women’s Health Grant | |
| Risk of bias | ||
| Bias | Authors' judgement | Support for judgement |
| Random sequence generation (selection bias) | High risk | “Subjects were rotated sequentially into two treatment conditions and one control group”. |
| Allocation concealment (selection bias) | Unclear risk | Whether treatment assignment was concealed from study personnel and participants was not described. |
| Blinding of participants and personnel (performance bias) | High risk | Owing to the nature of the intervention, it was not possible to conceal allocation to the intervention from participants. |
| Blinding of outcome assessment (detection bias) | High risk | Study personnel and outcome assessors were not masked or blinded to study interventions. |
| Incomplete outcome data (attrition bias) | High risk | 4 participants were excluded from the exercise group and 2 from the control group. Exclusion from analyses occurred because of attrition or non‐compliance with the study protocol. |
| Selective reporting (reporting bias) | Low risk | No selective reporting of outcomes is apparent. |
| Other bias | Low risk | Trial appears to be free of other problems that could put it at high risk of bias. |
| Methods | Study design: single‐centre RCT Number randomised: 330; 109 to intervention tailored‐print, 110 to intervention targeted‐print, 111 to control Study start: October 2010; stop date: October 2013 Length of intervention: 3 months Length of follow‐up: at 4 and 10 months post intervention Country: Australia | |
| Participants | Age, years, mean (range):
Stage, n (%):
Inclusion criteria: • Female breast cancer survivors over the age of 18 • Finished “active” cancer treatment (defined as surgery, chemotherapy, and/or radiotherapy) • Could read and write in English Exclusion criteria: • Not reported | |
| Interventions | 330 participants assigned to 2 different physical activity behavioural change interventions:
Adherence:
111 participants assigned to control:
| |
| Outcomes | Primary outcome:
Other outcomes:
Numbers of participants assessed:
Adverse events: not reported | |
| Notes | Trial registration link: https://www.anzctr.org.au/Trial/Registration/TrialReview.aspx?ACTRN=12611001061921 Trial authors contacted: no Intention‐to‐treat analysis: yes, but LOCF Funding: funded by the Cancer Institute New South Wales Research Scholar Award (10/RSA/1‐27 ‐ Trial ID in Australian New Zealand) | |
| Risk of bias | ||
| Bias | Authors' judgement | Support for judgement |
| Random sequence generation (selection bias) | Low risk | "computer‐generated block randomisation sequence" |
| Allocation concealment (selection bias) | Low risk | Sequence "implemented in a blinded fashion by an administrative assistant not involved in the project" |
| Blinding of participants and personnel (performance bias) | High risk | Owing to the nature of the intervention, it was not possible to conceal allocation to the intervention from participants. |
| Blinding of outcome assessment (detection bias) | Low risk | "All project team members were blinded to this process until allocation was complete". |
| Incomplete outcome data (attrition bias) | High risk | Inappropriate handling of missing data in the analyses; "primary analysis was conducted using all observed data, and sensitivity analyses using the baseline observations carried forward approach were conducted to explore the impact of missing data" |
| Selective reporting (reporting bias) | Low risk | No selective reporting of outcomes is apparent. |
| Other bias | Low risk | Trial appears to be free of other problems that could put it at high risk of bias. |
| Methods | Study design: single‐centre RCT Number randomised: 80; 40 to intervention, 40 to control Study start: September 2009; stop date: February 2010 Length of intervention: 8 weeks Length of follow‐up: to end of intervention Country: Iran | |
| Participants | Age, years:
Stage, n (%):
Inclusion criteria: • Women with breast cancer stages I‐III • Aged 15 to 55 years • Two years since completion of breast cancer‐related treatment (except for hormone therapy) • Performance status 0 to 4 (as determined by ECOG scale of WHO) Exclusion criteria: • Evidence of disease recurrence • Treatment with anticoagulants, signs of cardiac disease • Underwent arrhythmia or MI • Dementia or other psychotic condition • Regular exercise 2 to 3 sessions per week in the past 6 months | |
| Interventions | 40 participants assigned to exercise intervention:
Adherence: Not reported 40 participants assigned to control:
| |
| Outcomes | Primary outcome:
Numbers of participants assessed:
Adverse events: not reported | |
| Notes | Trial registration link: none available Trial authors contacted: no Intention‐to‐treat analysis: unclear Funding: Isfahan University of Medical Sciences | |
| Risk of bias | ||
| Bias | Authors' judgement | Support for judgement |
| Random sequence generation (selection bias) | Unclear risk | "randomly divided into two groups of study and control"; method not stated |
| Allocation concealment (selection bias) | Unclear risk | Whether treatment assignment was concealed from study personnel and participants was not described. |
| Blinding of participants and personnel (performance bias) | High risk | Owing to the nature of the intervention, it was not possible to conceal allocation to the intervention from participants. |
| Blinding of outcome assessment (detection bias) | Unclear risk | Blinding of outcome assessments was not described. |
| Incomplete outcome data (attrition bias) | Unclear risk | Numbers of participants included in postintervention analyses were not provided. |
| Selective reporting (reporting bias) | Low risk | No selective reporting of outcomes is apparent. |
| Other bias | Unclear risk | Trial appears to be free of other problems that could put it at high risk of bias. |
| Methods | Study design: single‐centre RCT Number randomised: 337; 94 to print material intervention (PM), 94 to pedometer intervention (PED), 93 to combination of print material and pedometers intervention (COM), 96 to control Study start: July 2005; stop date: April 2006 Length of intervention: 12 weeks Length of follow‐up: to end of intervention, at 6 months post intervention Country: Canada | |
| Participants | Age, years, mean (range):
Stage, n (%):
Inclusion criteria: • Histologically confirmed stage I‐IIIA breast cancer • Physician approval • Freedom from chronic medical and orthopaedic conditions that would preclude physical activity (e.g. congestive heart failure, recent knee or hip replacement) • English as spoken language • Completion of adjuvant therapy except hormone therapy • Current absence of breast cancer Exclusion criteria: • None reported | |
| Interventions | 281 (PM, 94; PED, 94; COM, 94) participants assigned to three 12‐week interventions:
Adherence to intervention materials immediately post intervention:
Adherence to intervention materials at 6‐month follow‐up:
96 participants assigned to control:
| |
| Outcomes | Primary outcome:
Other outcomes:
Numbers of participants assessed: PM: baseline, 94; post intervention, 81; 6 months post intervention, 62 PED: baseline, 94; post intervention, 88; 6 months post intervention, 69 COM: baseline, 93; post intervention, 84; 6 months post intervention, 67 Control: baseline, 96; post intervention, 85; 6 months post intervention, 68 Adverse events: none reported | |
| Notes | Trial registration link: https://clinicaltrials.gov/ct2/show/NCT00221221 Trial authors contacted: yes, additional data were received from trial authors Intention‐to‐treat analysis: no Funding: National Cancer Institute of Canada (NCIC) with funds from the Canadian Cancer Society (CCS) and the CCS/NCIC Sociobehavioral Cancer Research Network | |
| Risk of bias | ||
| Bias | Authors' judgement | Support for judgement |
| Random sequence generation (selection bias) | Low risk | Computer‐generated random numbers list |
| Allocation concealment (selection bias) | Low risk | “A research assistant generated the group assignments in sequentially numbered and sealed opaque envelopes”. |
| Blinding of participants and personnel (performance bias) | High risk | Owing to the nature of the intervention, it was not possible to conceal allocation to the intervention from participants. |
| Blinding of outcome assessment (detection bias) | Unclear risk | It was not mentioned whether study personnel and outcome assessors were masked or blinded to study interventions. |
| Incomplete outcome data (attrition bias) | High risk | For all analyses, an intention‐to‐treat approach was employed with LOCF. |
| Selective reporting (reporting bias) | Low risk | No selective reporting of outcomes is apparent. |
| Other bias | Low risk | Trial appears to be free of other problems that could put it at high risk of bias. |
| Methods | Study design: multi‐centre RCT Number randomised: 249; 124 to intervention, 125 to control Study start: not reported; stop date: not reported Length of intervention: 24 months. Length of follow‐up: at 36 months Country: USA | |
| Participants | Only baseline characteristics of sample completing the 24‐month study period were reported: Age, years (mean SD):
Stage, n (%):
Inclusion criteria: • 35 to 75 years of age • History of stage 0 (in situ), I, or II breast cancer • BMD T‐score of ‐1.0 or less at any of 3 sites (hip, spine, forearm) • At least 6 months post breast cancer treatment and 12 months postmenopausal • Residing within 100 miles of 1 of 4 research sites (Omaha, Lincoln, Kearney, and Scottsbluff, NE) • Physician's permission to participate Exclusion criteria: • Recurrence of breast cancer • Currently taking hormone therapy, bisphosphonates, glucocorticosteroids, or other drugs affecting bone • Currently engaging in strength training exercises • Body mass index ≥ 35 • Serum calcium, creatinine, or thyroid‐stimulating hormone (if on thyroid therapy) outside normal limits • Active gastrointestinal problems or other conditions that prohibited strength training exercises; risedronate, calcium, or vitamin D intake | |
| Interventions | 124 participants allocated to strength and weight training exercise interventions:
Adherence % (self‐reported but also validated by research nurses during monthly interviews):
125 participants assigned to control:
| |
| Outcomes | Outcomes:
Numbers of participants assessed:
Adverse events: No long‐term adverse effects from exercises were noted for any of the 110 women exercising, including women with a history of lymphoedema. | |
| Notes | Trial registration link: https://clinicaltrials.gov/ct2/show/NCT00567606 Trial authors contacted: no Intention‐to‐treat analysis: yes Funding: National Institute of Nursing Research (1 R01NR07743–01A1) | |
| Risk of bias | ||
| Bias | Authors' judgement | Support for judgement |
| Random sequence generation (selection bias) | Unclear risk | Participants "were randomised to exercise plus medication (n = 110) or medication only (n = 113) treatment groups, and randomisation was stratified by years of post menopause". Randomisation method was not stated. |
| Allocation concealment (selection bias) | Unclear risk | Whether treatment assignment was concealed from study personnel and participants was not described. |
| Blinding of participants and personnel (performance bias) | High risk | Owing to the nature of the intervention, it was not possible to conceal allocation to the intervention from participants. |
| Blinding of outcome assessment (detection bias) | Unclear risk | Blinding of outcome assessments was not described. |
| Incomplete outcome data (attrition bias) | Low risk | "intent to treat paradigm was used where data from all participants were analysed according to randomised assignment regardless of protocol adherence" "The generalized estimating equation (GEE) method with an exchangeable structure for repeated measures data was used to fit a generalized linear model to examine factors associated with muscle strength, balance, BMD, and bone turnover including time of testing (baseline, 12 and 24 months) and group assignment (exercise or medication only)". |
| Selective reporting (reporting bias) | Low risk | No selective reporting of outcomes is apparent.. |
| Other bias | Low risk | Trial appears to be free of other problems that could put it at high risk of bias. |
| Methods | Study design: single‐centre RCT Number randomised: 106; 52 to intervention, 54 to control Study start: October 2006; stop date: January 2009 Length of intervention: 12 months Length of follow‐up: to end of intervention Country: USA | |
| Participants | Age, years (mean SD):
Stage, n (%):
Inclusion criteria: • Diagnosis of stage 0–IIIA breast cancer at or after age 50 • Postmenopausal • ≥ 1 year post chemotherapy or radiotherapy • Non‐osteoporotic • No bone‐altering medication other than adjuvant hormone therapy • Physician clearance to exercise • No regular participation in resistance and/or impact exercise (fewer than two 30‐minute sessions per week) in the past month • Physical and cognitive ability to complete study testing Exclusion criteria: • None reported | |
| Interventions | 52 participants assigned to 1‐year exercise intervention:
Adherence:
54 participants assigned to control:
| |
| Outcomes | Primary outcomes:
Other outcomes:
Numbers of participants assessed:
Adverse events: No adverse effects were associated with participation in either group. | |
| Notes | Trial registration link: https://clinicaltrials.gov/ct2/show/NCT00591747 Trial authors contacted: no Intention‐to‐treat analysis: yes, but data were available only for per‐protocol analyses Funding: Susan G. Komen Race for the Cure and the National Cancer Institute; partial support from the Oregon Clinical and Translational Research Institute (OCTRI), National Center for Research Resources (NCRR) ‐ a component of the National Institutes of Health (NIH) ‐ and NIH Roadmap for Medical Research | |
| Risk of bias | ||
| Bias | Authors' judgement | Support for judgement |
| Random sequence generation (selection bias) | Unclear risk | Generation of the random sequence was not described |
| Allocation concealment (selection bias) | High risk | “Group assignments were placed in sealed, sequentially numbered envelopes and opened by the participant following the completion of baseline testing”. Envelopes were not opaque. |
| Blinding of participants and personnel (performance bias) | High risk | Owing to the nature of the intervention, it was not possible to conceal allocation to the intervention from participants. |
| Blinding of outcome assessment (detection bias) | Low risk | “Trained technicians blinded to group assignment” carried out testing. |
| Incomplete outcome data (attrition bias) | High risk | The intent‐to‐treat (ITT) analysis was performed via hierarchical linear modelling. However, although inferences were based on ITT analyses, data were available only for per‐protocol analyses (in table format). High attrition rate was reported in the intervention group. |
| Selective reporting (reporting bias) | Low risk | No selective reporting of outcomes is apparent. |
| Other bias | Low risk | Trial appears to be free of other problems that could put it at high risk of bias. |
1RM: 1‐repetition maximum.
7‐DPAR: 7‐day physical activity recall questionnaire.
ACSM: American College of Sports Medicine.
AIDS: acquired immunodeficiency syndrome.
AIT: aerobic interval training.
API: Aerobic Power Index.
BCE: Bone Collagen Equivalents.
BCPT: Breast Cancer Prevention Trial.
BDI: Beck Depression Inventory.
BES: Body Esteem Scale.
BFLUTS: Bristol Female Lower Urinary Tract Symptoms Questionnaire.
BIQ: Body Image Questionnaire.
BIS: bioimpedance spectroscopy.
BMI: body mass index.
BPI: Brief Pain Inventory.
BPNS: Basic Psychological Needs Satisfaction Scale.
BREQ‐2: Behavioral Regulation for Exercise Questionnaire‐2.
BRI: bone remodelling index.
BSAP: bone‐specific alkaline phosphatase.
CARES‐SF: Cancer Rehabilitation Evaluation System Short Form.
CBT: cognitive‐behavioural therapy.
CCS: Canadian Cancer Society.
CE: exercise begun after treatment.
CES‐D: Centers for Epidemiological Studies—Depression Scale.
CHAMPS: Community Health Activities Model Program for Seniors.
CI: confidence interval.
CMT: continuous moderate training.
COM: combination of print material and pedometers intervention.
CP: chemotactic protein.
CRP: C‐reactive protein.
CTACK: cutaneous T cell‐attracting chemokine.
DASH: Disability of the Arm, Shoulder, and Hand questionnaire.
DASS‐21: Depression and Anxiety Stress Scale‐21.
DCIS: ductal carcinoma in situ.
DEG: delayed exercise group.
DEXA: dual‐energy X‐ray absorptiometry.
DWR: deep water running.
ECOG: Eastern Cooperative Oncology Group.
EE: exercise begun during treatment.
EEG: early exercise group.
ELISA: enzyme‐linked immunosorbent assay.
EORTC QLQ‐BR23: European Organization for Research and Treatment of Cancer core quality of life questionnaire.
EORTC QLQ‐C30: European Organization for Research and Treatment of Cancer core quality of life questionnaire: breast cancer‐specific module.
EuroQoL‐5D: European Quality of Life 5 dimensions.
EuroQoL‐VAS: European Quality of Life visual analogue scale.
FACIT‐F: Functional Assessment of Chronic Illness Therapy ‐ Fatigue.
FACT: Functional Assessment of Cancer Therapy.
FACT‐B: Functional Assessment of Cancer Therapy ‐ Breast.
FACT‐Cog: Functional Assessment of Cancer Therapy ‐ Cognitive.
FACT‐ES: Functional Assessment of Cancer Therapy ‐ Endocrine Subscale.
FACT‐F: Functional Assessment of Cancer Therapy ‐ Fatigue.
FACT‐G: Functional Assessment of Cancer Therapy ‐ General.
FFQ: Food Frequency Questionnaire.
FGF: fibroblast growth factor.
FSI: Fatigue Symptom Inventory.
FSS: Fatigue Severity Scale.
G‐CSF: granulocyte colony‐stimulating factor.
gmCSF: granulocyte‐macrophage colony‐stimulating factor.
GRO: growth‐related oncogene.
HADS: Hospital Anxiety and Depression Scale.
HbA1c: glycosylated haemoglobin.
HDL‐C: high‐density lipoprotein cholesterol.
HF/NS: hot flashes and night sweats.
HGF: hepatocyte growth factor.
HLRE: high‐load resistance exercise.
HMWA: high‐molecular‐weight adiponectin.
HOMA: homeostatic model assessment.
HR: heart rate.
HRmax: maximum heart rate.
HRR: heart rate reserve.
IBCSG: International Breast Cancer Study Group.
ICAM: intercellular adhesion molecule.
IFN: interferon.
IGF: insulin‐like growth factor.
IGFBP: insulin‐like growth factor binding protein.
IL: interleukin.
IP: inducible protein.
IPAQ: International Physical Activity Questionnaire.
ITT: intention‐to‐treat.
KPS: Karnofsky Performance Status.
LDL‐C: low‐density lipoprotein cholesterol.
LIF: leukaemia inhibitory factor.
LLRE: low‐load resistance exercise.
LOCF: last observation carried forward.
LPS: lipopolysaccharide.
LSI: Leisure Score Index; Life Satisfaction Inventory.
LVEF: left ventricular ejection fraction.
MCS‐F: macrophage colony‐stimulating factor.
MET‐h: metabolic equivalent hours.
METs: metabolic equivalents.
MFI: Multi‐dimensional Fatigue Inventory.
MFSI: Multi‐dimensional Fatigue Symptom Inventory.
MFSI‐SF: Multi‐dimensional Fatigue Symptom Inventory Short Form.
MI: myocardial infarction.
MIG: monokine induced by IFNγ.
MIP: macrophage inflammatory protein.
MOS SF‐36: Medical Outcomes Study Short Form‐36.
MVPA: moderate‐vigorous physical activity.
NCI: National Cancer Institute.
NCIC: National Cancer Institute of Canada.
NGF: nerve growth factor.
NK: natural killer.
NKCA: natural killer cell activity.
NTx: N‐terminal telopeptide.
NYHA: New York Heart Association.
PA: physical activity.
PAL: physical activity log.
PANAS: Positive and Negative Affect Scale.
PDGF: platelet‐derived growth factor.
PE: physical education.
PED: pedometer intervention.
PFS: Piper Fatigue Scale.
PFS‐R: Revised Piper Fatigue Scale.
PHA: phytohemagglutinin.
PM: print material.
POMS: Profile of Mood States.
PPO: peak power output.
pQCT: peripheral quantitative computed tomography.
PROMIS: Patient Reported Outcomes Measurement Information System.
PSQI: Pittsburgh Sleep Quality Index.
QLQ‐BR23: quality of life questionnaire: breast cancer‐specific module.
QoL: quality of life.
RCT: randomised controlled trial.
RER: respiratory exchange ratio.
RM: repetition maximum.
RPE: rate of perceived exertion.
RSE: Rosenberg Self‐Esteem Scale.
RTR: reach‐to‐recovery.
SAQ: Sexual Activity Questionnaire.
SCF: stem cell factor.
SCGF: stem cell growth factor.
SCL‐90R: Symptom Checklist‐90 Revised.
SCT: social cognitive theory.
SD: standard deviation.
SDF: stromal cell‐derived factor.
SOC: stage of change.
SPAS‐7: Social Physique Anxiety Scale‐7.
STAI: State‐Trait Anxiety Index.
TC: total cholesterol.
TCC: Tai Chi Chuan.
TG: triglyceride.
TNF: tumour necrosis factor.
TOI: Trial Outcome Index.
TRAIL: tumour necrosis factor‐related apoptosis‐inducing ligand.
TTM: Transtheoretical model.
URCC SI: University of Rochester Cancer Center Symptom Inventory.
VCAM: vascular cell adhesion molecule.
VE/VCO₂: minute ventilation carbon dioxide production relationship.
VE/VO₂: minute ventilation oxygen production relationship.
VEGF: vascular endothelial growth factor.
VEpeak: peak ventilation.
VO₂max: maximal oxygen uptake.
VO₂peak: peak oxygen uptake.
WCC: white cell count.
WHO: World Health Organization.
WOMAC: Western Ontario and McMaster Universities Osteoarthritis Index.
YMCA: Young Men's Christian Association.
YOCAS: yoga intervention based on gentle Hatha and restorative yoga.
Characteristics of excluded studies [ordered by study ID]
| Study | Reason for exclusion |
| This study was excluded because it included patients undergoing adjuvant cancer therapy. | |
| This study was excluded as it did not compare physical activity vs no physical activity or usual care. | |
| This study was excluded because the effects of physical activity could not be isolated. | |
| This study was excluded because the breast cancer population was not analysed separately. | |
| This study was excluded because the breast cancer population was not analysed separately. | |
| This study was excluded as it did not compare physical activity vs no physical activity, another intervention, or usual care. | |
| This study was excluded because the effects of physical activity could not be isolated (physical activity + manual therapy). | |
| This study was excluded because the effects of physical activity could not be isolated (physical activity + manual therapy). | |
| This study was excluded because the effects of physical activity could not be isolated (physical activity + manual therapy). | |
| This study was excluded as it did not compare physical activity vs no physical activity or usual care. | |
| This study was excluded because the effects of physical activity could not be isolated (physical activity + diet modification). | |
| This study was excluded as it did not compare physical activity vs no physical activity or usual care. | |
| This study was excluded because the effects of physical activity could not be isolated (physical activity + education intervention). | |
| This study was excluded because all patients were at pretreatment stage. | |
| This study was excluded because the breast cancer population was not analysed separately. | |
| This study was excluded because groups included all participants with metastatic disease. | |
| This study was excluded because it lacked a non‐physical activity comparison group. | |
| This study was excluded as it did not compare physical activity vs no physical activity or usual care. | |
| This study was excluded because some participants were receiving treatment during the study. | |
| This study was excluded as it did not compare physical activity vs no physical activity or usual care. | |
| This study was excluded because it did not include a separate analysis of participants with breast cancer. | |
| This study was excluded as it did not compare physical activity vs no physical activity or usual care. | |
| This study was excluded because the effects of physical activity could not be isolated (physical activity + diet modification). | |
| This study was excluded because it lacked a non‐physical activity comparison group. | |
| This study was excluded because the effects of physical activity could not be isolated (physical activity + manual therapy). | |
| This study was excluded because it was a non‐randomised controlled trial. | |
| This study was excluded because it was a non‐randomised controlled trial. | |
| This study was excluded because it did not include a comparison group. | |
| This study was excluded because it included exercises restricted to stretching and local muscular endurance (i.e. training of shoulders). | |
| This study was excluded as it did not compare physical activity vs no physical activity or usual care. | |
| This study was excluded because it included participants undergoing adjuvant cancer therapy. | |
| This study was excluded because all included participants had metastatic disease initiating chemotherapy. | |
| This study was excluded because it did not include a comparison group. | |
| This study was excluded because it included participants undergoing chemotherapy. | |
| This study was excluded because it included participants undergoing chemotherapy and radiotherapy. | |
| This study was excluded because it did not include a comparison group. | |
| This study was excluded because it included participants undergoing chemotherapy. | |
| This study was excluded because it was a non‐randomised controlled trial. | |
| This study was excluded because the breast cancer population was not analysed separately. | |
| This study was excluded because it included participants undergoing chemotherapy and radiotherapy. | |
| This study was excluded because it included exercises restricted to stretching and local muscular endurance (i.e. training of shoulders). | |
| This study was excluded as it did not compare physical activity vs no physical activity, another intervention, or usual care. | |
| This study was excluded because it did not include a comparison group. | |
| This study was excluded because it included exercises restricted to stretching and local muscular endurance (i.e. training of shoulders). | |
| This study was excluded because it included participants undergoing chemotherapy and radiotherapy. | |
| This study was excluded because it included exercises restricted to stretching and local muscular endurance (i.e. training of shoulders). | |
| This study was excluded because the effects of physical activity could not be isolated (physical activity + diet modification). | |
| This study did not include a physical activity intervention but used a relaxation intervention instead. | |
| This study was excluded because the breast cancer population was not analysed separately. | |
| This study was excluded because it compared exercise vs historical control (non‐randomised controlled trial). | |
| This study was excluded because the breast cancer population was not analysed separately. | |
| This study was excluded because the breast cancer population was not analysed separately. | |
| This study was excluded because it included exercises restricted to stretching and local muscular endurance (i.e. training of shoulders). | |
| This study was excluded because the effects of physical activity could not be isolated (physical activity + diet modification). | |
| This study was excluded because it included participants undergoing chemotherapy and radiotherapy, as well as participants with metastatic disease. | |
| This study was excluded because it included participants undergoing chemotherapy. | |
| This study was excluded because it was a non‐randomised controlled trial. | |
| This study was excluded as it did not compare physical activity vs no physical activity or usual care. | |
| This study was excluded because the breast cancer population was not analysed separately. | |
| This study was excluded as it did not compare physical activity vs no physical activity or usual care. | |
| This study was excluded as it did not compare physical activity vs no physical activity or usual care. | |
| This study was excluded as it did not compare physical activity vs no physical activity or usual care (healthcare professional gave PA advice to both intervention groups). | |
| This study was excluded because it lacked a non‐physical activity comparison group. | |
| This study was excluded as it did not compare physical activity vs no physical activity or usual care. | |
| This study was excluded because it included participants undergoing adjuvant cancer therapy. | |
| This study was excluded because it lacked a non‐physical activity comparison group. | |
| This study was excluded as it did not compare physical activity vs no physical activity or usual care. | |
| This study was excluded as it did not compare physical activity vs no physical activity or usual care. | |
| This study was excluded because it included participants undergoing adjuvant cancer therapy. | |
| This study was excluded because it was a controlled clinical trial (participants allocated according to patient preference and intervention availability). | |
| This study was excluded because it did not include a comparison group. | |
| This study was excluded because it lacked a non‐physical activity comparison group. | |
| This study was excluded because it was a non‐randomised controlled trial. | |
| This study was excluded as it did not compare physical activity vs no physical activity or usual care. | |
| This study was excluded as it did not compare physical activity vs no physical activity or usual care. | |
| This study was excluded because the breast cancer population was not analysed separately. | |
| This study was excluded as it did not compare physical activity vs no physical activity or usual care. | |
| This study was excluded because the breast cancer population was not analysed separately. | |
| This study was excluded because it included participants undergoing adjuvant cancer therapy. | |
| This study was excluded because the breast cancer population was not analysed separately. | |
| This study was excluded because it involved therapeutic exercise regimens addressing only specific impairments related to shoulder, arm, or both. | |
| This study was excluded as it did not compare physical activity vs no physical activity or usual care. | |
| This study was excluded because it did not include a comparison group. | |
| This study was excluded because it lacked a non‐physical activity comparison group. | |
| This study was excluded because the breast cancer population was not analysed separately. | |
| This study was excluded as it did not compare physical activity vs no physical activity or usual care. | |
| This study was excluded as it did not compare physical activity vs no physical activity or usual care. | |
| This study was excluded because it included participants undergoing adjuvant cancer therapy. |
Characteristics of studies awaiting assessment [ordered by study ID]
| Methods | Study design: RCT Number expected to be randomised: 80; 40 to exercise intervention, 40 to control Study start: January 2010; stop date: March 2013 Length of intervention: 6 months |
| Participants | Age, years (mean SD):
Stage: stage I–III Inclusion criteria: • Females aged 18 to 72 years • Diagnosis of invasive breast cancer (stage I‐III) within 2 years of enrolment • Post surgery and no surgery planned for at least the next 6 months • Fully completed adjuvant therapy (radiotherapy and/or chemotherapy) not including hormonal therapy • No previous malignancy • Willing to be randomised • Willing to maintain contact with investigators over 6 months Exclusion criteria: • Inability to participate in PA because of severe disability (e.g. severe arthritic conditions) • Psychiatric illness • Vulnerable individuals, such as pregnant women or any other patients for whom PA was not approved by their oncologist owing to the presence of 1 or more contraindications to exercise for patients with cancer |
| Interventions |
|
| Outcomes | Primary outcome:
Secondary outcomes:
|
| Notes | Country of trial: UK https://clinicaltrials.gov/ct2/show/NCT02408107 Dr. Ian Lahart; [email protected] |
| Methods | Study design: RCT Number randomised: 22; 11 to exercise intervention, 11 to control Study start: not reported; study completion: not reported Length of intervention: 48 weeks |
| Participants | Eligible women with postmenopausal early breast cancer had arthralgias/myalgias (A/M) related to adjuvant anastrozole. Among 20 evaluated participants: • Baseline median age was 62. • BMI was 26 kg/m² in Exercise and Control arms. • Median number of arthralgia/myalgia sites was 5, with a median worst score of 2 (CTC version 2 criteria). |
| Interventions | Exercise participants exercised 3 times weekly for 48 weeks: for the first 12 weeks in a supervised setting; for the second 12 weeks, supervised once weekly and independently twice weekly; for the last 24 weeks, independently via aerobic and resistance programmes tailored to their fitness. |
| Outcomes | Primary outcome:
Secondary outcomes:
|
| Notes | Study closed owing to poor accrual after 3 years, with 22 (11 exercise and 11 exercise) of the planned 72 participants enrolled at 2 sites among 98 screened. Only conference abstract is available. |
| Methods | Study design: RCT Number randomised: 38; 24 to a yoga intervention, 14 to control Study start: not reported; study completion: not reported Length of intervention: 12 weeks |
| Participants | "Urban underserved breast cancer survivors" |
| Interventions | Participants were randomised to the treatment group (1‐hour Hatha yoga classes) or the wait‐list control group. Frequency of yoga classes per week is unclear. |
| Outcomes | Outcomes:
|
| Notes | Only conference abstract is available. |
A/M: arthralgia/myalgia.
BMD: bone mineral density.
BMI: body mass index.
CTC: common toxicity criteria.
FACT‐B: Functional Assessment of Cancer Therapy ‐ Breast.
HDL‐C: high‐density lipoprotein cholesterol.
HOMA: homeostatic model assessment.
HRQoL: health‐related quality of life.
IPAQ: International Physical Activity Questionnaire.
LDL‐C: low‐density lipoprotein cholesterol.
PA: physical activity.
RCT: randomised controlled trial.
SD: standard deviation.
SF‐36: Short Form‐36.
Characteristics of ongoing studies [ordered by study ID]
| Trial name or title | Exercise Program for Early Breast Cancer Survivors |
| Methods | Accrual: not reported Multi‐centre/single‐centre: single centre, but participants will be encouraged in a home‐based exercise session over 30 to 45 minutes once weekly Phase of trial: not reported Stated study design: RCT, efficacy study |
| Participants | Inclusion criteria: • Newly diagnosed (I‐III) first primary invasive breast cancer • Underwent lumpectomy or mastectomy • Completed neoadjuvant/adjuvant chemotherapy and able to initiate Exercise programme (if randomised to that arm) within 12 weeks of therapy completion • Body mass index (BMI) > 25 kg/m² or body fat > 30% (as determined by Dr. Dieli‐Conwright at baseline visit) • Currently participate in less than 60 minutes of physical activity per week • May use adjuvant endocrine therapy if use will be continued for duration of study period • Non‐smoker (i.e. not smoking during previous 12 months) • Willing to travel to the exercise facility and USC • Able to provide physician clearance to participate in exercise programme • Women of all racial and ethnic backgrounds to be included in the study enrolment process Exclusion criteria: • History of chronic disease including diabetes, uncontrolled hypertension, or thyroid disease • Weight reduction ≥ 10% in the past 6 months • Diagnosis of human epidermal growth factor receptor 2 (HER2)‐positive tumour (exclusion due to patient use of Herceptin medication for 1 year following chemotherapy) • Metastatic disease • Planned reconstructive surgery with flap repair during trial and follow‐up period • Cardiovascular, respiratory, or musculoskeletal disease or joint problems that preclude moderate physical activity |
| Interventions | ARM 1:
ARM 2:
|
| Outcomes | Primary outcome:
Secondary outcomes:
|
| Starting date | Start date: May 2012 Estimated completion date: May 2017 |
| Contact information | Christina Dieli‐Conwright, PhD; 323‐442‐2905 Email: [email protected] |
| Notes | Trial registration link: https://clinicaltrials.gov/show/NCT01140282 This study is still recruiting participants. |
| Trial name or title | Telehealth System to Improve Quality of Life in Breast Cancer Survivors |
| Methods | Accrual: 72 Multi‐centre/single‐centre: not reported but most likely home‐based (paper or registry does not explicitly say this) Phase of trial: not reported Country where trial is being conducted: Spain Stated study design: RCT, efficacy study |
| Participants | Inclusion criteria: • 18 to 65 years of age • Female • Diagnosis of stage I, II, or IIIA breast cancer • Medical clearance for participation • Without chronic disease or orthopaedic disease that would interfere with ability to participate in a physical activity programme • Access to Internet • Basic ability to use the computer or living with a relative who has this ability • Completion of adjuvant therapy except for hormone therapy • No history of cancer recurrence • Interest in improving lifestyle: fitness/stress level • Signed informed consent Exclusion criteria: • Not reported |
| Interventions | ARM 1:
ARM 2:
|
| Outcomes | Primary outcome:
Secondary outcomes:
|
| Starting date | Start date: March 2012 Estimated completion date: July 2014 |
| Contact information | Manuel Arroyo‐Morales Email: [email protected] |
| Notes | Trial registration link: https://clinicaltrials.gov/ct2/show/NCT01801527 Sponsor of the trial: Universidad de Granada and Carlos III Health Institute |
| Trial name or title | Comparing Self‐Efficacy, Outcome Expectations for Promoting the Physical Activity of Women With Breast Cancer in Two Groups With and Without Educational Program |
| Methods | Study design: RCT Number expected to be randomised: 70 Study start: September 2014; estimated stop date: November 2015 Length of intervention: 8 weeks |
| Participants | 50 malignant neoplasms of breast cancer Inclusion criteria: • Final diagnosis of breast cancer by a physician • Individual consent and spousal consent if married • Physician’s written consent to participation in the educational programme • Ability to read and write Exclusion criteria: • Therapist’s prescription for a ban on attending sessions • Lack of desire to participate in the study • Absence for more than 1 session during educational sessions • Cognitive disorder diagnosed during the educational intervention Age: not reported |
| Interventions | Intervention 1: • The first session is devoted to identifying need for patient education in the experimental group. Participants then receive education during at least 4 90‐minute sessions with respect to the barriers to self‐efficacy in physical activity, energy management, stress management, lymphoedema prevention, and other topics mentioned in the group. Training sessions are presented in PowerPoint by relevant experts on each topic. • Educational activities are intended for promotion of self‐efficacy, brainstorming strategies, verbal persuasion, successor experience, and framing questions in the group. Usual care: • No special arrangement is made for the control group, except for normal medical care. |
| Outcomes | Primary outcomes:
Seconday outcome:
|
| Starting date | 20 March 2014 |
| Contact information | Rahele Solymani |
| Notes | Country of trial: Iran, Islamic Republic of http://apps.who.int/trialsearch/Trial2.aspx?TrialID=IRCT2014042117379N1 |
| Trial name or title | Exercise to Prevent Osteoporosis as a Consequence of Hormone Treatment in Post Menopausal Women Treated for Breast Cancer |
| Methods | Accrual: not reported Multi‐centre/single‐centre: multi‐centre Phase of trial: not reported Stated study design: RCT, blinded |
| Participants | Inclusion criteria • Postmenopausal • Above 18 years of age • Mmenses history and/or surgery • Stage I‐III breast cancer • Oestrogen receptor and/or progesterone receptor positive breast cancer • Commenced taking aromatase inhibitor within 10 weeks • Eastern Collaborative Oncology Group performance status ≤ 2 (Oken et al, 1982) • Sedentary. Exclusion criteria • Any clinical or radiological evidence of distant spread of disease • Any HRT in the past 12 months • Taken bisphosphonates in the past 6 months • Prior treatment with continuous systemic glucocorticoids in the past 6 months • Current treatment with any drugs known to affect the skeleton (e.g. calcitonin, calcitriol, mithramycin, gallium nitrate) • History of diseases that influence bone metabolism, such as Paget's disease or ongoing thyroid toxicosis • Previous or concomitant malignancy (apart from breast cancer) in the past 5 years except adequately treated basal or squamous cell carcinoma of the skin or in situ carcinoma of the cervix |
| Interventions | ARM 1:
ARM 2:
|
| Outcomes | Primary outcome:
Secondary outcomes:
|
| Starting date | Start date: May 2008 Estimated completion date: not reported |
| Contact information | Prof Sharon Kilbreath Email: [email protected] |
| Notes | Trial registration link: https://www.anzctr.org.au/Trial/Registration/TrialReview.aspx?id=82762 Sponsor of the trial: Cancer Australia Trial authors were contacted and we were informed by the authors that the study had been completed and they were preparing for publication. |
| Trial name or title | The Effect of an Exercise Program in Breast Cancer Patients With Joint Pain While Taking Aromatase Inhibitors |
| Methods | Study design: RCT Number expected to be randomised: 30 Study start: January 2014; estimated stop date: January 2015 Length of intervention: 8 weeks |
| Participants | Stage: I‐III Time since cancer diagnosis: not specified Inclusion criteria: • Women over age 40 with histological evidence of hormone receptor positive breast cancer • Postmenopausal • Adjuvant AI therapy • Significant joint discomfort/stiffness when attempting activities of daily living, which began or significantly increased after initiation of AI therapy • Currently not in an active directed exercise programme (> 60 minutes 2×/week) • Age: 40 years or older Ethnicity: not reported |
| Interventions | 8‐Week directed exercise programme |
| Outcomes | Primary objective:
|
| Starting date | January 2014 |
| Contact information | Christiana Care/Helen F. Graham Cancer Center, Newark, DE, USA 19713 |
| Notes | Country of trial: USA https://ClinicalTrials.gov/show/NCT02057536 |
| Trial name or title | Exercise Intervention in Preventing Breast Cancer Recurrence in Postmenopausal Breast Cancer Survivors |
| Methods | Study design: RCT Number expected to be randomised: 50 Study start: May 2015; estimated stop date: November 2016 Length of intervention: 16 weeks |
| Participants | Stage: I‐IIIA Time since cancer diagnosis: within first 3 years post treatment Inclusion criteria: • Women with diagnosis of first primary invasive oestrogen receptor (ER) positive (+) breast cancer (stage I‐IIIA) within first 3 years post treatment • Postmenopausal women • Any body mass index (BMI) • Sedentary (has not participated in a regular exercise programme in the past 12 months) • Non‐smoker (not smoking during previous 12 months) • Willing and able to travel to the exercise facility • Diagnosis of first primary invasive ER+ breast cancer (stage I‐IIIA) • Has undergone a lumpectomy or mastectomy • Completed adjuvant chemotherapy and/or radiation within 3 years before study enrolment (when cytokine levels are predicted to be high) and able to initiate an exercise programme • May use adjuvant endocrine therapy if use will be continued for duration of study period • Must have the ability to understand and the willingness to sign a written informed consent Age: 56 years and older Ethnicity: not reported |
| Interventions | Patients participate in a supervised Curves exercise programme 3 days a week for 16 weeks. The circuit‐style workout consists of 14 exercises constructed with pneumatic or hydraulic resistance that target opposing muscle groups in a concentric‐only fashion. Each session at a Curves facility will include 2 complete circuits, which corresponds to exercising for approximately 30 minutes, followed by a standardised stretching routine. |
| Outcomes | Primary objectives:
Secondary objectives:
|
| Starting date | May 2015 |
| Contact information | Principal Investigator: Jessica Clague DeHart Contact: Jessica Clague DeHart; 800‐826‐4673; [email protected] |
| Notes | Country of trial: USA https://ClinicalTrials.gov/show/NCT02235051 |
| Trial name or title | Physical Activity and Neuropsychological Outcomes in a Cancer Population |
| Methods | Study design: RCT Number expected to be randomised: 87 Study start: August 2014; estimated stop date: August 2017 Length of intervention: 12 weeks |
| Participants | Stage: I‐III Time since cancer diagnosis: less than 5 years Inclusion criteria: • Breast cancer survivors; diagnosis at stage I, II, or III less than 5 years ago • Not scheduled for or currently undergoing chemotherapy; sedentary, defined as engaging in less than 60 minutes of moderate‐to‐vigorous physical activity each week • Accessible geographically and by telephone • Access to the Internet • Endorse experience difficulties with thinking abilities • Participants on adjuvant therapy (e.g. tamoxifen, aromatase inhibitors) must be able and willing to remain on that treatment for the 3‐month intervention period to prevent confounding of biomarker concentrations by treatment. Age: 21 to 85 years Ethnicity: not reported |
| Interventions | 12‐Week individually tailored phone and email‐based exercise programme |
| Outcomes | Primary objective:
|
| Starting date | August 2014 |
| Contact information | Sheri Hartman, Assistant Professor, University of California, San Diego |
| Notes | Country of trial: USA https://ClinicalTrials.gov/show/NCT02332876 |
| Trial name or title | Qigong for Breast Cancer Survivors |
| Methods | Study design: RCT Number expected to be randomised: 60 Study start: March 2015; estimated stop date: May 2017 Length of intervention: 3 months |
| Participants | Stage: not reported Time since cancer diagnosis: not reported Inclusion criteria: • History of a breast malignancy at any stage • History of mastectomy or lumpectomy with or without adjuvant chemotherapy or radiotherapy • Completed conventional cancer treatment and medically stable • No known neurological deficits resulting from breast cancer treatment or other neurological disorders • Persistent lymphoedema defined as a circumference difference > 2 cm at any point between the surgical upper limb and the contralateral upper limb • Female aged 18 or above Age: 18 years or above Ethnicity: Chinese |
| Interventions | Participants assigned to the Qigong group will receive Qigong training. The Qigong training programme will be run for 3 months with 2 supervised 1‐hour sessions per week. Participants will learn the 18 Forms of Tai Chi Internal Qigong. Training sessions will be conducted by a qualified Qigong instructor from the Natural Health Qigong Association. |
| Outcomes | Primary objectives:
Secondary objective:
|
| Starting date | March 2015 |
| Contact information | Shirley SM Fong, PT, PhD; 852‐970‐90337; [email protected] |
| Notes | Country of trial: Hong Kong https://ClinicalTrials.gov/show/NCT02420249 |
| Trial name or title | Physical Activity Intervention on Myocardial Function in Patients With HER2 + Breast Cancer (CARDAPAC) |
| Methods | Study design: RCT Number expected to be randomised: 117 Study start: April 2015; estimated stop date: April 2017 Length of intervention: 12 weeks |
| Participants | Stage: not specified Time since cancer diagnosis: receiving adjuvant trastuzumab after undergoing surgery for breast cancer Inclusion criteria:
Ethnicity: not reported |
| Interventions | Participants will participate in a physical activity intervention 3 times per week for 3 months and an interval training programme on a cycle‐ergometer. |
| Outcomes | Primary objective:
Secondary objectives: To measure any changes in the following from baseline to 3 months and 6 months:
|
| Starting date | April 2015 |
| Contact information | Contact: Fabienne Mougin‐Guillaume, PhD; fabienne.mougin‐guillaume@univ‐fcomte.fr Principal Investigator: Nathalie Meneveau |
| Notes | Country of trial: France https://clinicaltrials.gov/show/NCT02433067 |
| Trial name or title | The Effect of Resistive Exercise on Forearm Blood Flow and Tissue Oxygenation Among Breast Cancer Survivors With or at Risk for Breast Cancer‐Related Lymphoedema (BCRL) |
| Methods | Study design: RCT Number expected to be randomised: 150 Study start: July 2015; estimated stop date: December 2016 Length of intervention: 8 weeks |
| Participants | Stage: not reported Time since cancer diagnosis: not reported Inclusion criteria: • Female breast cancer survivors • Remained disease free, as defined by unremarkable clinical examination within recent 6 months, with a clinical diagnosis of stable lymphoedema and without lymphoedema Age: 18 to 70 years Ethnicity: Chinese |
| Interventions | Participants assigned to the exercise group will receive a supervised resistive exercise programme, which includes 1‐hour physiotherapist‐supervised small group‐based exercise sessions twice a week for 8 weeks. Before resistive exercises, participants will perform warm‐up with movements of large joints and shoulder girdle for 15 minutes. Resistive exercises will focus on the major muscle groups in the upper body. Loading of resistive exercises will be prescribed and progressed according to individual capacity and will reach a level of moderate‐to‐high loading (6 to 12 repetition maximum); these will be followed by stretching exercises specific to the muscle groups trained after the session. Control group: no intervention; all 30 participants recruited |
| Outcomes | Primary objectives:
Secondary objectives: To measure changes at 20 weeks in:
|
| Starting date | July 2015 |
| Contact information | Rufina Lau; (852)27666718; [email protected] |
| Notes | Country of trial: Hong Kong https://clinicaltrials.gov/ct2/show/NCT02527889 |
ALT: alanine aminotransferase.
AST: aspartate aminotransferase.
BMI: body mass index.
CES‐D: Centers for Epidemiological Studies—Depression Scale.
DASH: Disability of the Arm, Shoulder, and Hand questionnaire.
DEXA: dual‐energy X‐ray absorptiometry.
ELISA: enzyme‐linked immunosorbent assay.
FACT‐B: Functional Assessment of Cancer Therapy ‐ Breast.
HADS: Hospital Anxiety and Depression Scale.
HER2: human epidermal growth factor receptor 2.
LVEF: left ventricular ejection fraction.
PFS: Piper Fatigue Scale.
PSS: Penn Shoulder Scale.
RCT: randomised controlled trial.
RM: repetition maximum.
USC: University of Southern California.
WHO: World Health Organization.
Data and analyses
| Outcome or subgroup title | No. of studies | No. of participants | Statistical method | Effect size |
| 1 Overall HRQoL (follow‐up values) Show forest plot | 22 | Std. Mean Difference (IV, Random, 95% CI) | Subtotals only | |
| Analysis 1.1 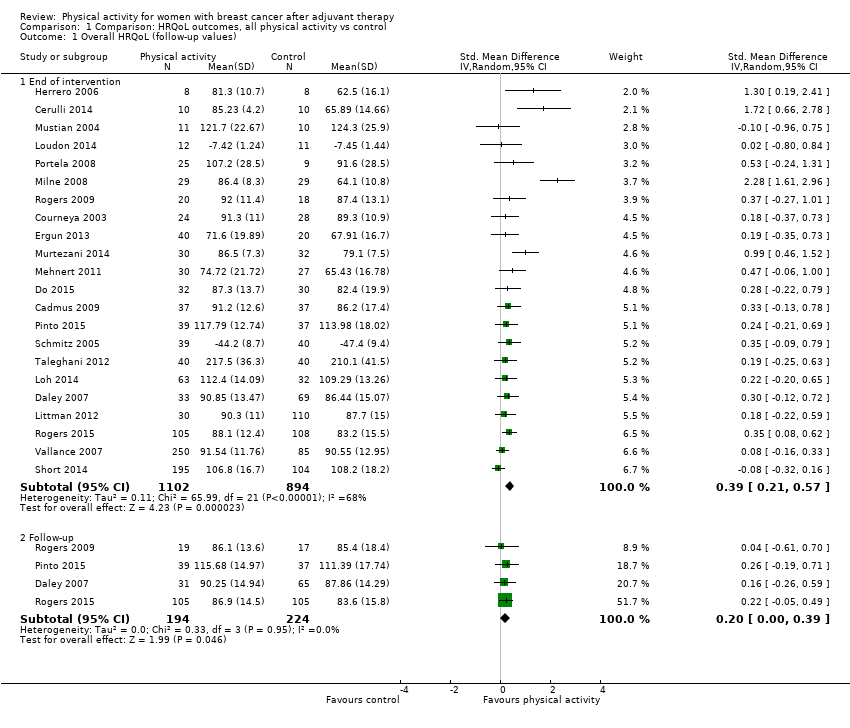 Comparison 1 Comparison: HRQoL outcomes, all physical activity vs control, Outcome 1 Overall HRQoL (follow‐up values). | ||||
| 1.1 End of intervention | 22 | 1996 | Std. Mean Difference (IV, Random, 95% CI) | 0.39 [0.21, 0.57] |
| 1.2 Follow‐up | 4 | 418 | Std. Mean Difference (IV, Random, 95% CI) | 0.20 [0.00, 0.39] |
| 2 Overall HRQoL (change values) Show forest plot | 14 | Std. Mean Difference (IV, Random, 95% CI) | Subtotals only | |
| Analysis 1.2  Comparison 1 Comparison: HRQoL outcomes, all physical activity vs control, Outcome 2 Overall HRQoL (change values). | ||||
| 2.1 End of intervention | 14 | 1459 | Std. Mean Difference (IV, Random, 95% CI) | 0.78 [0.39, 1.17] |
| 2.2 Follow‐up | 2 | 132 | Std. Mean Difference (IV, Random, 95% CI) | 0.52 [0.15, 0.88] |
| 3 FACT‐G (follow‐up values) Show forest plot | 10 | Mean Difference (IV, Random, 95% CI) | Subtotals only | |
| Analysis 1.3 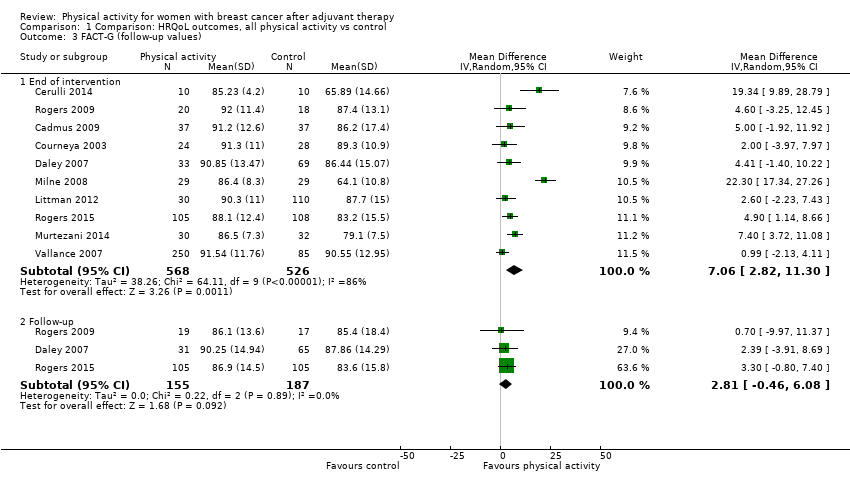 Comparison 1 Comparison: HRQoL outcomes, all physical activity vs control, Outcome 3 FACT‐G (follow‐up values). | ||||
| 3.1 End of intervention | 10 | 1094 | Mean Difference (IV, Random, 95% CI) | 7.06 [2.82, 11.30] |
| 3.2 Follow‐up | 3 | 342 | Mean Difference (IV, Random, 95% CI) | 2.81 [‐0.46, 6.08] |
| 4 FACT‐G (change values) Show forest plot | 6 | Mean Difference (IV, Random, 95% CI) | Subtotals only | |
| Analysis 1.4  Comparison 1 Comparison: HRQoL outcomes, all physical activity vs control, Outcome 4 FACT‐G (change values). | ||||
| 4.1 End of intervention | 6 | 663 | Mean Difference (IV, Random, 95% CI) | 5.04 [1.32, 8.75] |
| 4.2 Follow‐up | 2 | 132 | Mean Difference (IV, Random, 95% CI) | 6.16 [1.63, 10.69] |
| 5 FACT‐B (follow‐up values) Show forest plot | 11 | Mean Difference (IV, Random, 95% CI) | Subtotals only | |
| Analysis 1.5 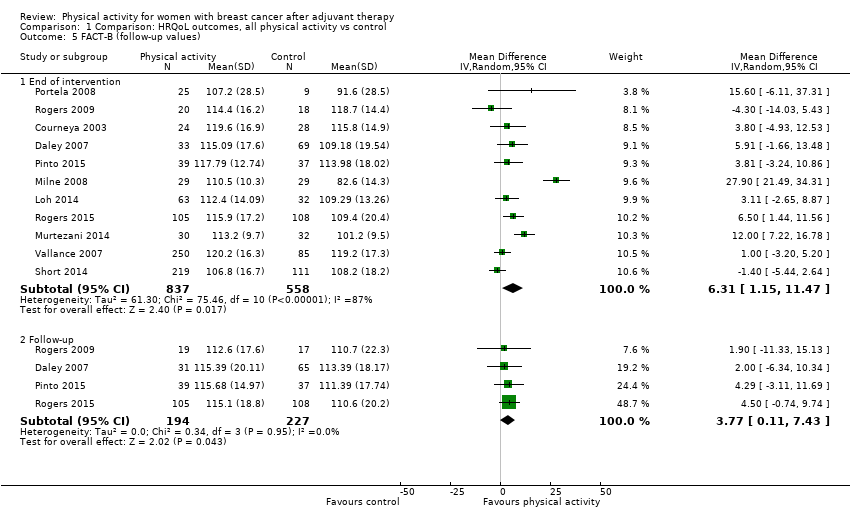 Comparison 1 Comparison: HRQoL outcomes, all physical activity vs control, Outcome 5 FACT‐B (follow‐up values). | ||||
| 5.1 End of intervention | 11 | 1395 | Mean Difference (IV, Random, 95% CI) | 6.31 [1.15, 11.47] |
| 5.2 Follow‐up | 4 | 421 | Mean Difference (IV, Random, 95% CI) | 3.77 [0.11, 7.43] |
| 6 FACT‐B (change values) Show forest plot | 6 | Mean Difference (IV, Random, 95% CI) | Subtotals only | |
| Analysis 1.6  Comparison 1 Comparison: HRQoL outcomes, all physical activity vs control, Outcome 6 FACT‐B (change values). | ||||
| 6.1 End of intervention | 6 | 605 | Mean Difference (IV, Random, 95% CI) | 8.16 [2.56, 13.76] |
| 6.2 Follow‐up | 2 | 132 | Mean Difference (IV, Random, 95% CI) | 6.95 [1.34, 12.56] |
| 7 FACT Breast Cancer Subscale (follow‐up values) Show forest plot | 11 | Mean Difference (IV, Random, 95% CI) | Subtotals only | |
| Analysis 1.7  Comparison 1 Comparison: HRQoL outcomes, all physical activity vs control, Outcome 7 FACT Breast Cancer Subscale (follow‐up values). | ||||
| 7.1 End of intervention | 11 | 1043 | Mean Difference (IV, Random, 95% CI) | 1.98 [0.92, 3.04] |
| 7.2 Follow‐up | 4 | 386 | Mean Difference (IV, Random, 95% CI) | 3.20 [‐0.65, 7.05] |
| 8 FACT Breast Cancer Subscale (change values) Show forest plot | 7 | Mean Difference (IV, Random, 95% CI) | Subtotals only | |
| Analysis 1.8  Comparison 1 Comparison: HRQoL outcomes, all physical activity vs control, Outcome 8 FACT Breast Cancer Subscale (change values). | ||||
| 8.1 End of intervention | 7 | 646 | Mean Difference (IV, Random, 95% CI) | 1.78 [‐0.14, 3.70] |
| 8.2 Follow‐up | 1 | 36 | Mean Difference (IV, Random, 95% CI) | 1.30 [‐1.56, 4.16] |
| 9 FACT Trial Outcome Index (follow‐up values) Show forest plot | 4 | Mean Difference (IV, Random, 95% CI) | Subtotals only | |
| Analysis 1.9  Comparison 1 Comparison: HRQoL outcomes, all physical activity vs control, Outcome 9 FACT Trial Outcome Index (follow‐up values). | ||||
| 9.1 End of intervention | 4 | 658 | Mean Difference (IV, Random, 95% CI) | 7.90 [‐1.24, 17.04] |
| 9.2 Follow‐up | 1 | 213 | Mean Difference (IV, Random, 95% CI) | 3.60 [0.01, 7.19] |
| 10 EORTC QLQ‐C30 Global Health (follow‐up values) Show forest plot | 4 | Mean Difference (IV, Random, 95% CI) | Subtotals only | |
| Analysis 1.10 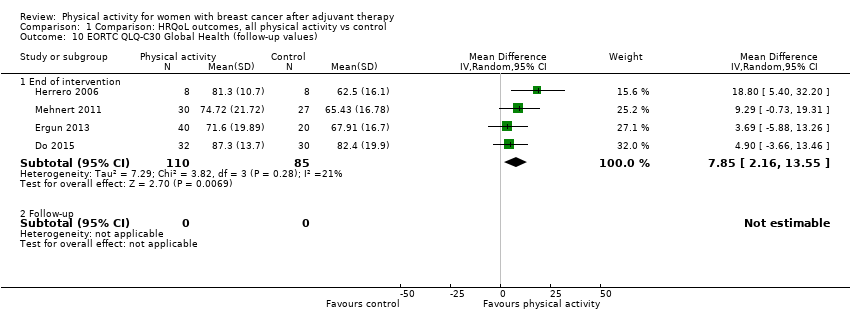 Comparison 1 Comparison: HRQoL outcomes, all physical activity vs control, Outcome 10 EORTC QLQ‐C30 Global Health (follow‐up values). | ||||
| 10.1 End of intervention | 4 | 195 | Mean Difference (IV, Random, 95% CI) | 7.85 [2.16, 13.55] |
| 10.2 Follow‐up | 0 | 0 | Mean Difference (IV, Random, 95% CI) | 0.0 [0.0, 0.0] |
| 11 EORTC QLQ‐C30 Global Health (change values) Show forest plot | 4 | Mean Difference (IV, Random, 95% CI) | Subtotals only | |
| Analysis 1.11 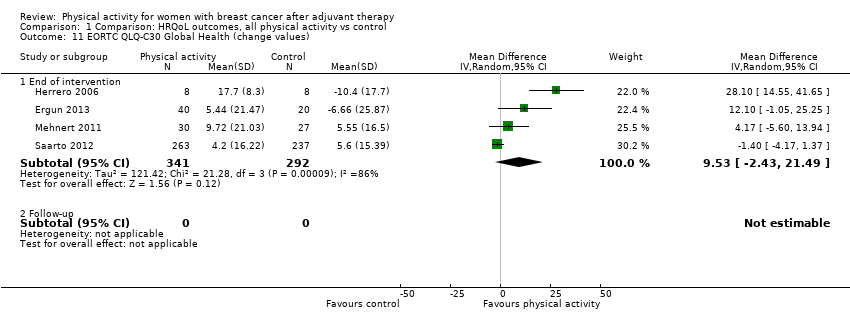 Comparison 1 Comparison: HRQoL outcomes, all physical activity vs control, Outcome 11 EORTC QLQ‐C30 Global Health (change values). | ||||
| 11.1 End of intervention | 4 | 633 | Mean Difference (IV, Random, 95% CI) | 9.53 [‐2.43, 21.49] |
| 11.2 Follow‐up | 0 | 0 | Mean Difference (IV, Random, 95% CI) | 0.0 [0.0, 0.0] |
| 12 Overall emotional function/mental health (follow‐up values) Show forest plot | 26 | Std. Mean Difference (IV, Random, 95% CI) | Subtotals only | |
| Analysis 1.12  Comparison 1 Comparison: HRQoL outcomes, all physical activity vs control, Outcome 12 Overall emotional function/mental health (follow‐up values). | ||||
| 12.1 End of intervention | 26 | 2102 | Std. Mean Difference (IV, Random, 95% CI) | 0.21 [0.10, 0.32] |
| 12.2 Follow‐up | 7 | 655 | Std. Mean Difference (IV, Random, 95% CI) | 0.20 [0.03, 0.36] |
| 13 Overall emotional function/mental health (change values) Show forest plot | 15 | Std. Mean Difference (IV, Random, 95% CI) | Subtotals only | |
| Analysis 1.13 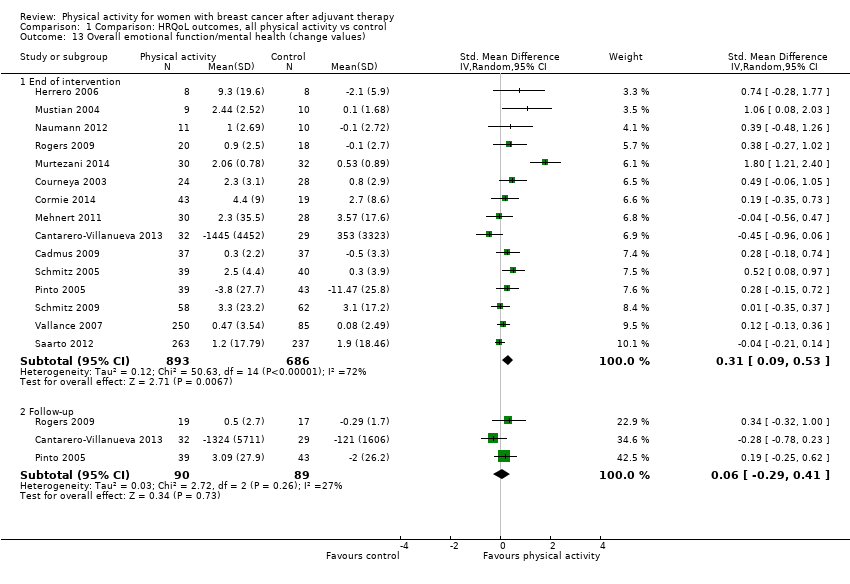 Comparison 1 Comparison: HRQoL outcomes, all physical activity vs control, Outcome 13 Overall emotional function/mental health (change values). | ||||
| 13.1 End of intervention | 15 | 1579 | Std. Mean Difference (IV, Random, 95% CI) | 0.31 [0.09, 0.53] |
| 13.2 Follow‐up | 3 | 179 | Std. Mean Difference (IV, Random, 95% CI) | 0.06 [‐0.29, 0.41] |
| 14 FACT Emotional well‐being (follow‐up values) Show forest plot | 11 | Mean Difference (IV, Random, 95% CI) | Subtotals only | |
| Analysis 1.14  Comparison 1 Comparison: HRQoL outcomes, all physical activity vs control, Outcome 14 FACT Emotional well‐being (follow‐up values). | ||||
| 14.1 End of intervention | 11 | 1064 | Mean Difference (IV, Random, 95% CI) | 0.47 [0.01, 0.94] |
| 14.2 Follow‐up | 3 | 311 | Mean Difference (IV, Random, 95% CI) | 0.14 [‐0.85, 1.14] |
| 15 FACT Emotional well‐being (change values) Show forest plot | 6 | Mean Difference (IV, Random, 95% CI) | Subtotals only | |
| Analysis 1.15  Comparison 1 Comparison: HRQoL outcomes, all physical activity vs control, Outcome 15 FACT Emotional well‐being (change values). | ||||
| 15.1 End of intervention | 6 | 582 | Mean Difference (IV, Random, 95% CI) | 0.96 [0.34, 1.57] |
| 15.2 Follow‐up | 1 | 36 | Mean Difference (IV, Random, 95% CI) | 0.79 [‐0.67, 2.25] |
| 16 MOS SF Mental composite (follow‐up values) Show forest plot | 5 | Mean Difference (IV, Random, 95% CI) | Subtotals only | |
| Analysis 1.16  Comparison 1 Comparison: HRQoL outcomes, all physical activity vs control, Outcome 16 MOS SF Mental composite (follow‐up values). | ||||
| 16.1 End of intervention | 5 | 563 | Mean Difference (IV, Random, 95% CI) | 0.49 [‐1.09, 2.06] |
| 16.2 Follow‐up | 3 | 281 | Mean Difference (IV, Random, 95% CI) | 2.27 [0.05, 4.50] |
| 17 MOS SF Mental composite (change values) Show forest plot | 2 | Mean Difference (IV, Fixed, 95% CI) | Subtotals only | |
| Analysis 1.17 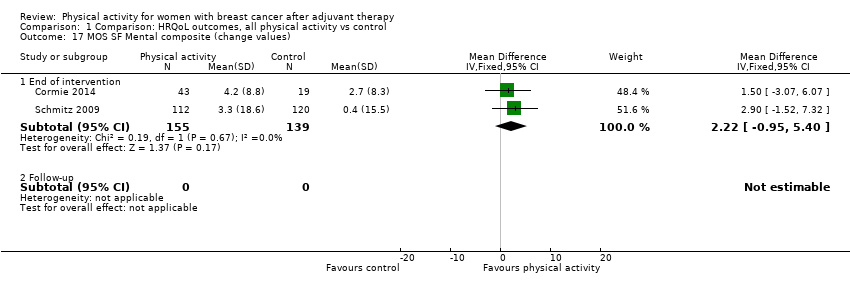 Comparison 1 Comparison: HRQoL outcomes, all physical activity vs control, Outcome 17 MOS SF Mental composite (change values). | ||||
| 17.1 End of intervention | 2 | 294 | Mean Difference (IV, Fixed, 95% CI) | 2.22 [‐0.95, 5.40] |
| 17.2 Follow‐up | 0 | 0 | Mean Difference (IV, Fixed, 95% CI) | 0.0 [0.0, 0.0] |
| 18 MOS SF Mental health (follow‐up values) Show forest plot | 7 | Mean Difference (IV, Random, 95% CI) | Subtotals only | |
| Analysis 1.18  Comparison 1 Comparison: HRQoL outcomes, all physical activity vs control, Outcome 18 MOS SF Mental health (follow‐up values). | ||||
| 18.1 End of intervention | 7 | 524 | Mean Difference (IV, Random, 95% CI) | 1.67 [‐0.65, 3.99] |
| 18.2 Follow‐up | 2 | 196 | Mean Difference (IV, Random, 95% CI) | 3.49 [‐0.97, 7.95] |
| 19 MOS SF Mental health (change values) Show forest plot | 5 | Mean Difference (IV, Fixed, 95% CI) | Subtotals only | |
| Analysis 1.19  Comparison 1 Comparison: HRQoL outcomes, all physical activity vs control, Outcome 19 MOS SF Mental health (change values). | ||||
| 19.1 End of intervention | 5 | 333 | Mean Difference (IV, Fixed, 95% CI) | 2.22 [0.70, 3.74] |
| 19.2 Follow‐up | 0 | 0 | Mean Difference (IV, Fixed, 95% CI) | 0.0 [0.0, 0.0] |
| 20 MOS SF Emotional role (follow‐up values) Show forest plot | 5 | Mean Difference (IV, Fixed, 95% CI) | Subtotals only | |
| Analysis 1.20 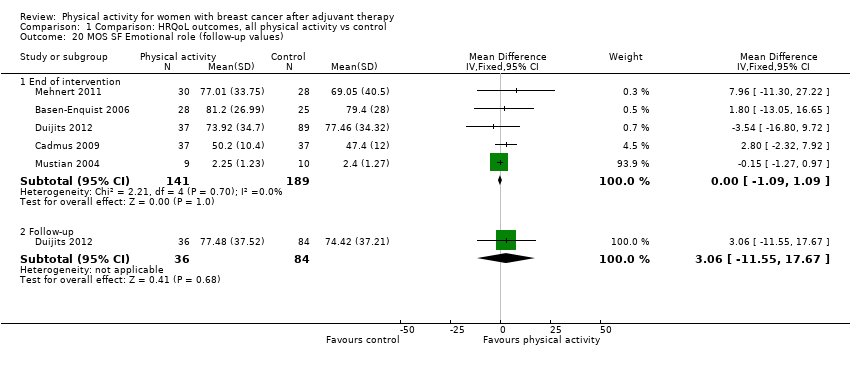 Comparison 1 Comparison: HRQoL outcomes, all physical activity vs control, Outcome 20 MOS SF Emotional role (follow‐up values). | ||||
| 20.1 End of intervention | 5 | 330 | Mean Difference (IV, Fixed, 95% CI) | ‐0.00 [‐1.09, 1.09] |
| 20.2 Follow‐up | 1 | 120 | Mean Difference (IV, Fixed, 95% CI) | 3.06 [‐11.55, 17.67] |
| 21 MOS SF Emotional role (change values) Show forest plot | 4 | Mean Difference (IV, Fixed, 95% CI) | Subtotals only | |
| Analysis 1.21 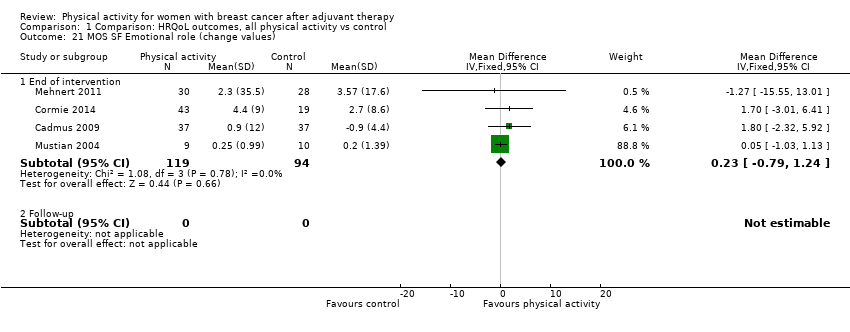 Comparison 1 Comparison: HRQoL outcomes, all physical activity vs control, Outcome 21 MOS SF Emotional role (change values). | ||||
| 21.1 End of intervention | 4 | 213 | Mean Difference (IV, Fixed, 95% CI) | 0.23 [‐0.79, 1.24] |
| 21.2 Follow‐up | 0 | 0 | Mean Difference (IV, Fixed, 95% CI) | 0.0 [0.0, 0.0] |
| 22 EORTC QLQ‐C30 Emotional function (follow‐up values) Show forest plot | 3 | Mean Difference (IV, Random, 95% CI) | Subtotals only | |
| Analysis 1.22  Comparison 1 Comparison: HRQoL outcomes, all physical activity vs control, Outcome 22 EORTC QLQ‐C30 Emotional function (follow‐up values). | ||||
| 22.1 End of intervention | 3 | 135 | Mean Difference (IV, Random, 95% CI) | 11.53 [3.96, 19.11] |
| 22.2 Follow‐up | 0 | 0 | Mean Difference (IV, Random, 95% CI) | 0.0 [0.0, 0.0] |
| 23 EORTC QLQ‐C30 Emotional function (change values) Show forest plot | 3 | Mean Difference (IV, Random, 95% CI) | Subtotals only | |
| Analysis 1.23  Comparison 1 Comparison: HRQoL outcomes, all physical activity vs control, Outcome 23 EORTC QLQ‐C30 Emotional function (change values). | ||||
| 23.1 End of intervention | 3 | 573 | Mean Difference (IV, Random, 95% CI) | 0.90 [‐5.12, 6.92] |
| 23.2 Follow‐up | 0 | 0 | Mean Difference (IV, Random, 95% CI) | 0.0 [0.0, 0.0] |
| 24 POMS total mood disturbance (follow‐up values) Show forest plot | 3 | Std. Mean Difference (IV, Random, 95% CI) | Subtotals only | |
| Analysis 1.24  Comparison 1 Comparison: HRQoL outcomes, all physical activity vs control, Outcome 24 POMS total mood disturbance (follow‐up values). | ||||
| 24.1 End of intervention | 3 | 161 | Std. Mean Difference (IV, Random, 95% CI) | ‐0.93 [‐1.55, ‐0.32] |
| 24.2 Follow‐up | 1 | 61 | Std. Mean Difference (IV, Random, 95% CI) | ‐0.54 [‐1.06, ‐0.03] |
| 25 POMS total mood disturbance (change values) Show forest plot | 2 | Std. Mean Difference (IV, Random, 95% CI) | Subtotals only | |
| Analysis 1.25  Comparison 1 Comparison: HRQoL outcomes, all physical activity vs control, Outcome 25 POMS total mood disturbance (change values). | ||||
| 25.1 End of intervention | 2 | 143 | Std. Mean Difference (IV, Random, 95% CI) | 0.07 [‐0.65, 0.79] |
| 25.2 Follow‐up | 2 | 143 | Std. Mean Difference (IV, Random, 95% CI) | 0.09 [‐0.23, 0.42] |
| 26 POMS anger subscale (follow‐up values) Show forest plot | 2 | Std. Mean Difference (IV, Random, 95% CI) | Subtotals only | |
| Analysis 1.26  Comparison 1 Comparison: HRQoL outcomes, all physical activity vs control, Outcome 26 POMS anger subscale (follow‐up values). | ||||
| 26.1 End of intervention | 2 | 79 | Std. Mean Difference (IV, Random, 95% CI) | ‐0.78 [‐1.25, ‐0.31] |
| 26.2 Follow‐up | 1 | 61 | Std. Mean Difference (IV, Random, 95% CI) | ‐0.44 [‐0.94, 0.07] |
| 27 Happiness/satisfaction with life (follow‐up values) Show forest plot | 4 | Std. Mean Difference (IV, Random, 95% CI) | Subtotals only | |
| Analysis 1.27  Comparison 1 Comparison: HRQoL outcomes, all physical activity vs control, Outcome 27 Happiness/satisfaction with life (follow‐up values). | ||||
| 27.1 End of intervention | 4 | 209 | Std. Mean Difference (IV, Random, 95% CI) | 0.61 [‐0.16, 1.37] |
| 27.2 Follow‐up | 0 | 0 | Std. Mean Difference (IV, Random, 95% CI) | 0.0 [0.0, 0.0] |
| 28 Happiness/satisfaction with life (change values) Show forest plot | 3 | Std. Mean Difference (IV, Random, 95% CI) | Subtotals only | |
| Analysis 1.28  Comparison 1 Comparison: HRQoL outcomes, all physical activity vs control, Outcome 28 Happiness/satisfaction with life (change values). | ||||
| 28.1 End of intervention | 3 | 182 | Std. Mean Difference (IV, Random, 95% CI) | 0.28 [‐0.05, 0.62] |
| 28.2 Follow‐up | 0 | 0 | Std. Mean Difference (IV, Random, 95% CI) | 0.0 [0.0, 0.0] |
| 29 Overall physical function (follow‐up values) Show forest plot | 25 | Std. Mean Difference (IV, Random, 95% CI) | Subtotals only | |
| Analysis 1.29  Comparison 1 Comparison: HRQoL outcomes, all physical activity vs control, Outcome 29 Overall physical function (follow‐up values). | ||||
| 29.1 End of intervention | 25 | 2129 | Std. Mean Difference (IV, Random, 95% CI) | 0.33 [0.18, 0.49] |
| 29.2 Follow‐up | 6 | 637 | Std. Mean Difference (IV, Random, 95% CI) | 0.21 [0.06, 0.37] |
| 30 Overall physical function (change values) Show forest plot | 13 | Std. Mean Difference (IV, Random, 95% CI) | Subtotals only | |
| Analysis 1.30  Comparison 1 Comparison: HRQoL outcomes, all physical activity vs control, Outcome 30 Overall physical function (change values). | ||||
| 30.1 End of intervention | 13 | 1433 | Std. Mean Difference (IV, Random, 95% CI) | 0.60 [0.23, 0.97] |
| 30.2 Follow‐up | 1 | 36 | Std. Mean Difference (IV, Random, 95% CI) | 0.17 [‐0.48, 0.83] |
| 31 FACT Physical well‐being (follow‐up values) Show forest plot | 11 | Mean Difference (IV, Random, 95% CI) | Subtotals only | |
| Analysis 1.31 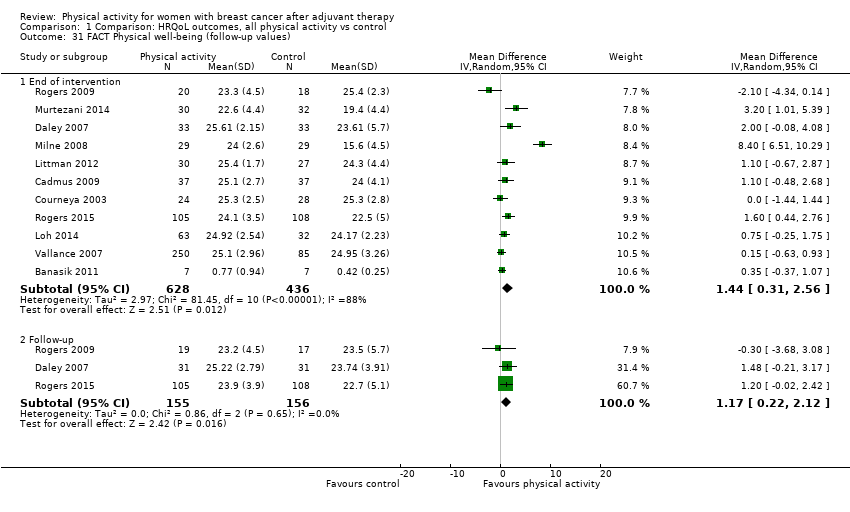 Comparison 1 Comparison: HRQoL outcomes, all physical activity vs control, Outcome 31 FACT Physical well‐being (follow‐up values). | ||||
| 31.1 End of intervention | 11 | 1064 | Mean Difference (IV, Random, 95% CI) | 1.44 [0.31, 2.56] |
| 31.2 Follow‐up | 3 | 311 | Mean Difference (IV, Random, 95% CI) | 1.17 [0.22, 2.12] |
| 32 FACT Physical well‐being (change values) Show forest plot | 6 | Mean Difference (IV, Random, 95% CI) | Subtotals only | |
| Analysis 1.32  Comparison 1 Comparison: HRQoL outcomes, all physical activity vs control, Outcome 32 FACT Physical well‐being (change values). | ||||
| 32.1 End of intervention | 6 | 579 | Mean Difference (IV, Random, 95% CI) | 1.60 [‐0.85, 4.05] |
| 32.2 Follow‐up | 1 | 36 | Mean Difference (IV, Random, 95% CI) | 0.9 [‐2.37, 4.17] |
| 33 MOS SF Physical composite (follow‐up values) Show forest plot | 4 | Mean Difference (IV, Fixed, 95% CI) | Subtotals only | |
| Analysis 1.33  Comparison 1 Comparison: HRQoL outcomes, all physical activity vs control, Outcome 33 MOS SF Physical composite (follow‐up values). | ||||
| 33.1 End of intervention | 4 | 437 | Mean Difference (IV, Fixed, 95% CI) | 1.78 [0.12, 3.43] |
| 33.2 Follow‐up | 2 | 163 | Mean Difference (IV, Fixed, 95% CI) | 1.30 [‐1.23, 3.82] |
| 34 MOS SF Physical composite (change values) Show forest plot | 2 | Mean Difference (IV, Fixed, 95% CI) | Subtotals only | |
| Analysis 1.34 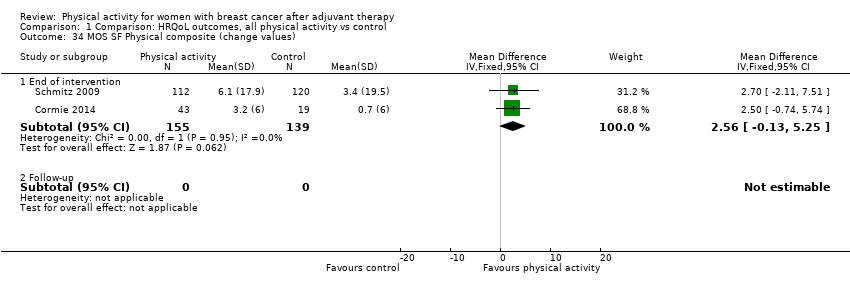 Comparison 1 Comparison: HRQoL outcomes, all physical activity vs control, Outcome 34 MOS SF Physical composite (change values). | ||||
| 34.1 End of intervention | 2 | 294 | Mean Difference (IV, Fixed, 95% CI) | 2.56 [‐0.13, 5.25] |
| 34.2 Follow‐up | 0 | 0 | Mean Difference (IV, Fixed, 95% CI) | 0.0 [0.0, 0.0] |
| 35 MOS SF Physical function (follow‐up values) Show forest plot | 7 | Mean Difference (IV, Random, 95% CI) | Subtotals only | |
| Analysis 1.35  Comparison 1 Comparison: HRQoL outcomes, all physical activity vs control, Outcome 35 MOS SF Physical function (follow‐up values). | ||||
| 35.1 End of intervention | 7 | 515 | Mean Difference (IV, Random, 95% CI) | 2.09 [0.03, 4.15] |
| 35.2 Follow‐up | 2 | 239 | Mean Difference (IV, Random, 95% CI) | 2.71 [‐1.58, 6.99] |
| 36 MOS SF Physical function (change values) Show forest plot | 5 | Mean Difference (IV, Random, 95% CI) | Subtotals only | |
| Analysis 1.36  Comparison 1 Comparison: HRQoL outcomes, all physical activity vs control, Outcome 36 MOS SF Physical function (change values). | ||||
| 36.1 End of intervention | 5 | 333 | Mean Difference (IV, Random, 95% CI) | 2.08 [0.21, 3.94] |
| 36.2 Follow‐up | 0 | 0 | Mean Difference (IV, Random, 95% CI) | 0.0 [0.0, 0.0] |
| 37 EORTC QLQ‐C30 Physical function (follow‐up values) Show forest plot | 3 | Mean Difference (IV, Random, 95% CI) | Subtotals only | |
| Analysis 1.37  Comparison 1 Comparison: HRQoL outcomes, all physical activity vs control, Outcome 37 EORTC QLQ‐C30 Physical function (follow‐up values). | ||||
| 37.1 End of intervention | 3 | 135 | Mean Difference (IV, Random, 95% CI) | 2.99 [‐1.64, 7.63] |
| 37.2 Follow‐up | 0 | 0 | Mean Difference (IV, Random, 95% CI) | 0.0 [0.0, 0.0] |
| 38 EORTC QLQ‐C30 Physical function (change values) Show forest plot | 3 | Mean Difference (IV, Random, 95% CI) | Subtotals only | |
| Analysis 1.38  Comparison 1 Comparison: HRQoL outcomes, all physical activity vs control, Outcome 38 EORTC QLQ‐C30 Physical function (change values). | ||||
| 38.1 End of intrevention | 3 | 573 | Mean Difference (IV, Random, 95% CI) | 3.12 [‐3.24, 9.49] |
| 38.2 Follow‐up | 0 | 0 | Mean Difference (IV, Random, 95% CI) | 0.0 [0.0, 0.0] |
| 39 Body Esteem Scale ‐ Physical condition (follow‐up values) Show forest plot | 2 | Mean Difference (IV, Random, 95% CI) | Subtotals only | |
| Analysis 1.39  Comparison 1 Comparison: HRQoL outcomes, all physical activity vs control, Outcome 39 Body Esteem Scale ‐ Physical condition (follow‐up values). | ||||
| 39.1 End of intervention | 2 | 106 | Mean Difference (IV, Random, 95% CI) | 4.41 [0.57, 8.25] |
| 39.2 Follow‐up | 0 | 0 | Mean Difference (IV, Random, 95% CI) | 0.0 [0.0, 0.0] |
| 40 Overall role function (follow‐up values) Show forest plot | 18 | Std. Mean Difference (IV, Random, 95% CI) | Subtotals only | |
| Analysis 1.40  Comparison 1 Comparison: HRQoL outcomes, all physical activity vs control, Outcome 40 Overall role function (follow‐up values). | ||||
| 40.1 End of intervention | 18 | 1370 | Std. Mean Difference (IV, Random, 95% CI) | 0.29 [0.07, 0.51] |
| 40.2 Follow‐up | 2 | 249 | Std. Mean Difference (IV, Random, 95% CI) | 0.13 [‐0.12, 0.38] |
| 41 Overall role function (change values) Show forest plot | 12 | Std. Mean Difference (IV, Random, 95% CI) | Subtotals only | |
| Analysis 1.41 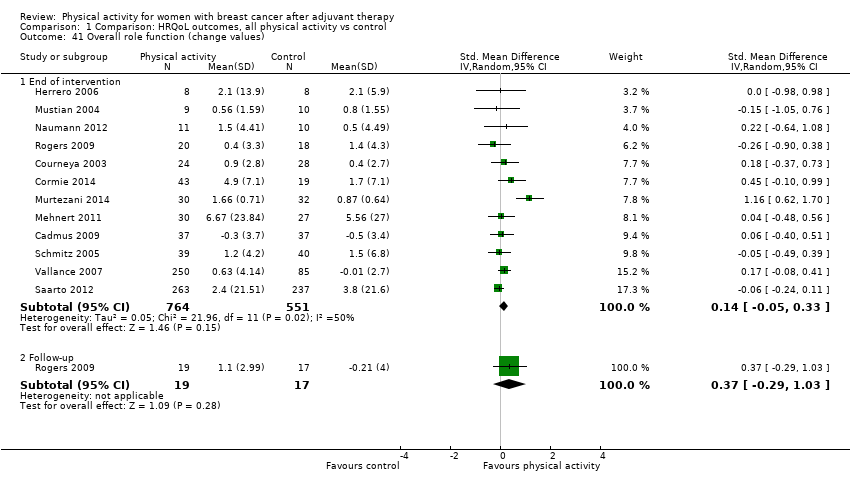 Comparison 1 Comparison: HRQoL outcomes, all physical activity vs control, Outcome 41 Overall role function (change values). | ||||
| 41.1 End of intervention | 12 | 1315 | Std. Mean Difference (IV, Random, 95% CI) | 0.14 [‐0.05, 0.33] |
| 41.2 Follow‐up | 1 | 36 | Std. Mean Difference (IV, Random, 95% CI) | 0.37 [‐0.29, 1.03] |
| 42 FACT Functional well‐being (follow‐up values) Show forest plot | 11 | Mean Difference (IV, Random, 95% CI) | Subtotals only | |
| Analysis 1.42  Comparison 1 Comparison: HRQoL outcomes, all physical activity vs control, Outcome 42 FACT Functional well‐being (follow‐up values). | ||||
| 42.1 End of intervention | 11 | 1064 | Mean Difference (IV, Random, 95% CI) | 1.67 [0.29, 3.06] |
| 42.2 Follow‐up | 2 | 249 | Mean Difference (IV, Random, 95% CI) | 0.68 [‐0.65, 2.01] |
| 43 FACT Functional well‐being (change values) Show forest plot | 6 | Mean Difference (IV, Fixed, 95% CI) | Subtotals only | |
| Analysis 1.43  Comparison 1 Comparison: HRQoL outcomes, all physical activity vs control, Outcome 43 FACT Functional well‐being (change values). | ||||
| 43.1 End of intervention | 6 | 582 | Mean Difference (IV, Fixed, 95% CI) | 0.72 [0.42, 1.01] |
| 43.2 Follow‐up | 1 | 36 | Mean Difference (IV, Fixed, 95% CI) | 1.31 [‐1.02, 3.64] |
| 44 MOS SF Physical role (follow‐up values) Show forest plot | 3 | Mean Difference (IV, Fixed, 95% CI) | Subtotals only | |
| Analysis 1.44  Comparison 1 Comparison: HRQoL outcomes, all physical activity vs control, Outcome 44 MOS SF Physical role (follow‐up values). | ||||
| 44.1 End of intervention | 3 | 143 | Mean Difference (IV, Fixed, 95% CI) | ‐0.16 [‐1.47, 1.15] |
| 44.2 Follow‐up | 0 | 0 | Mean Difference (IV, Fixed, 95% CI) | 0.0 [0.0, 0.0] |
| 45 MOS SF Physical role (change values) Show forest plot | 3 | Mean Difference (IV, Random, 95% CI) | Subtotals only | |
| Analysis 1.45  Comparison 1 Comparison: HRQoL outcomes, all physical activity vs control, Outcome 45 MOS SF Physical role (change values). | ||||
| 45.1 End of intervention | 3 | 155 | Mean Difference (IV, Random, 95% CI) | 0.46 [‐1.52, 2.43] |
| 45.2 Follow‐up | 0 | 0 | Mean Difference (IV, Random, 95% CI) | 0.0 [0.0, 0.0] |
| 46 EORTC QLQ‐C30 Role function (follow‐up values) Show forest plot | 3 | Mean Difference (IV, Random, 95% CI) | Subtotals only | |
| Analysis 1.46  Comparison 1 Comparison: HRQoL outcomes, all physical activity vs control, Outcome 46 EORTC QLQ‐C30 Role function (follow‐up values). | ||||
| 46.1 End of intervention | 3 | 135 | Mean Difference (IV, Random, 95% CI) | 0.44 [‐5.78, 6.66] |
| 46.2 Follow‐up | 0 | 0 | Mean Difference (IV, Random, 95% CI) | 0.0 [0.0, 0.0] |
| 47 EORTC QLQ‐C30 Role function (change values) Show forest plot | 3 | Mean Difference (IV, Fixed, 95% CI) | Subtotals only | |
| Analysis 1.47  Comparison 1 Comparison: HRQoL outcomes, all physical activity vs control, Outcome 47 EORTC QLQ‐C30 Role function (change values). | ||||
| 47.1 End of intervention | 3 | 573 | Mean Difference (IV, Fixed, 95% CI) | ‐1.08 [‐4.52, 2.36] |
| 47.2 Follow‐up | 0 | 0 | Mean Difference (IV, Fixed, 95% CI) | 0.0 [0.0, 0.0] |
| 48 Overall social well‐being/function (follow‐up values) Show forest plot | 18 | Std. Mean Difference (IV, Random, 95% CI) | Subtotals only | |
| Analysis 1.48 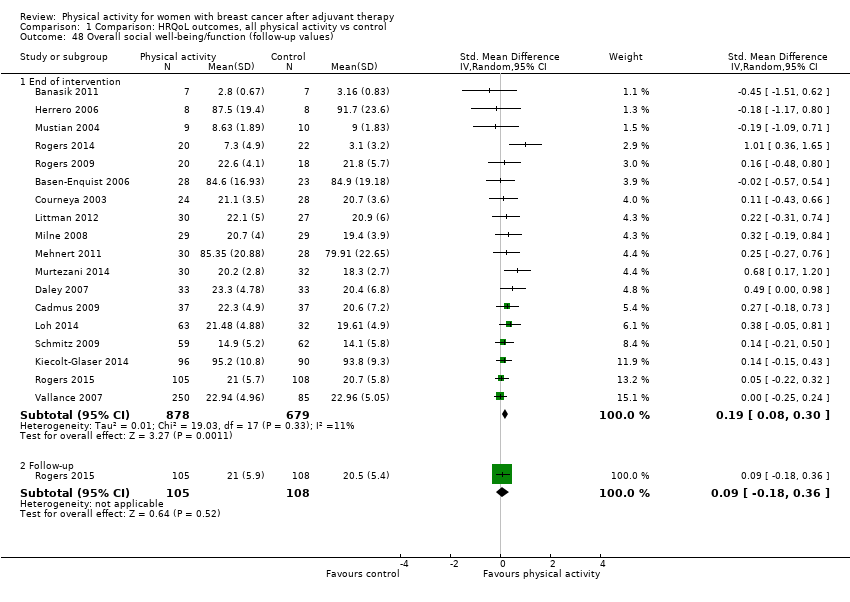 Comparison 1 Comparison: HRQoL outcomes, all physical activity vs control, Outcome 48 Overall social well‐being/function (follow‐up values). | ||||
| 48.1 End of intervention | 18 | 1557 | Std. Mean Difference (IV, Random, 95% CI) | 0.19 [0.08, 0.30] |
| 48.2 Follow‐up | 1 | 213 | Std. Mean Difference (IV, Random, 95% CI) | 0.09 [‐0.18, 0.36] |
| 49 Overall social well‐being/function (change values) Show forest plot | 12 | Std. Mean Difference (IV, Random, 95% CI) | Subtotals only | |
| Analysis 1.49 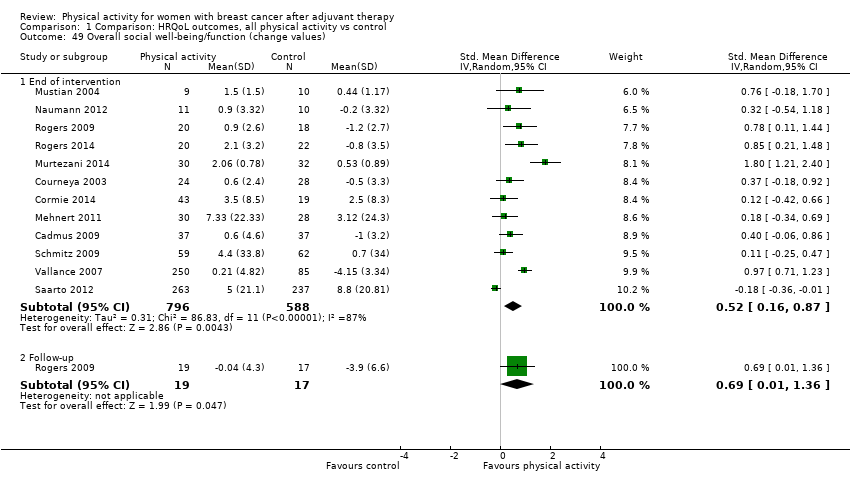 Comparison 1 Comparison: HRQoL outcomes, all physical activity vs control, Outcome 49 Overall social well‐being/function (change values). | ||||
| 49.1 End of intervention | 12 | 1384 | Std. Mean Difference (IV, Random, 95% CI) | 0.52 [0.16, 0.87] |
| 49.2 Follow‐up | 1 | 36 | Std. Mean Difference (IV, Random, 95% CI) | 0.69 [0.01, 1.36] |
| 50 FACT Social well‐being (follow‐up values) Show forest plot | 11 | Mean Difference (IV, Random, 95% CI) | Subtotals only | |
| Analysis 1.50  Comparison 1 Comparison: HRQoL outcomes, all physical activity vs control, Outcome 50 FACT Social well‐being (follow‐up values). | ||||
| 50.1 End of intervention | 11 | 1064 | Mean Difference (IV, Random, 95% CI) | 0.77 [0.11, 1.43] |
| 50.2 Follow‐up | 1 | 213 | Mean Difference (IV, Random, 95% CI) | 0.5 [‐1.02, 2.02] |
| 51 FACT Social well‐being (change values) Show forest plot | 6 | Mean Difference (IV, Fixed, 95% CI) | Subtotals only | |
| Analysis 1.51  Comparison 1 Comparison: HRQoL outcomes, all physical activity vs control, Outcome 51 FACT Social well‐being (change values). | ||||
| 51.1 End of intervention | 6 | 582 | Mean Difference (IV, Fixed, 95% CI) | 1.93 [1.58, 2.28] |
| 51.2 Follow‐up | 1 | 36 | Mean Difference (IV, Fixed, 95% CI) | 3.86 [0.17, 7.55] |
| 52 MOS SF Social functioning (follow‐up values) Show forest plot | 5 | Mean Difference (IV, Fixed, 95% CI) | Subtotals only | |
| Analysis 1.52 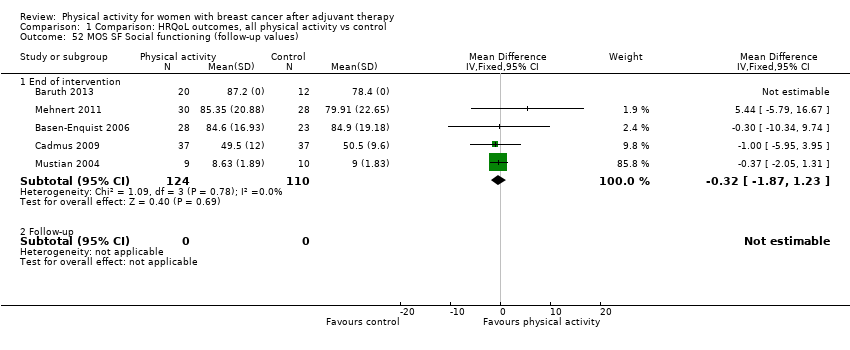 Comparison 1 Comparison: HRQoL outcomes, all physical activity vs control, Outcome 52 MOS SF Social functioning (follow‐up values). | ||||
| 52.1 End of intervention | 5 | 234 | Mean Difference (IV, Fixed, 95% CI) | ‐0.32 [‐1.87, 1.23] |
| 52.2 Follow‐up | 0 | 0 | Mean Difference (IV, Fixed, 95% CI) | 0.0 [0.0, 0.0] |
| 53 MOS SF Social functioning (change values) Show forest plot | 4 | Mean Difference (IV, Fixed, 95% CI) | Subtotals only | |
| Analysis 1.53  Comparison 1 Comparison: HRQoL outcomes, all physical activity vs control, Outcome 53 MOS SF Social functioning (change values). | ||||
| 53.1 End of intervention | 4 | 213 | Mean Difference (IV, Fixed, 95% CI) | 1.05 [‐0.08, 2.18] |
| 53.2 Follow‐up | 0 | 0 | Mean Difference (IV, Fixed, 95% CI) | 0.0 [0.0, 0.0] |
| 54 EORTC QLQ‐C30 Social function (follow‐up values) Show forest plot | 2 | Mean Difference (IV, Random, 95% CI) | Subtotals only | |
| Analysis 1.54  Comparison 1 Comparison: HRQoL outcomes, all physical activity vs control, Outcome 54 EORTC QLQ‐C30 Social function (follow‐up values). | ||||
| 54.1 End of intervention | 2 | 73 | Mean Difference (IV, Random, 95% CI) | 7.55 [‐11.77, 26.86] |
| 54.2 Follow‐up | 0 | 0 | Mean Difference (IV, Random, 95% CI) | 0.0 [0.0, 0.0] |
| 55 EORTC QLQ‐C30 Social function (change values) Show forest plot | 3 | Mean Difference (IV, Random, 95% CI) | Subtotals only | |
| Analysis 1.55  Comparison 1 Comparison: HRQoL outcomes, all physical activity vs control, Outcome 55 EORTC QLQ‐C30 Social function (change values). | ||||
| 55.1 End of intervention | 3 | 573 | Mean Difference (IV, Random, 95% CI) | 2.14 [‐8.02, 12.30] |
| 55.2 Follow‐up | 0 | 0 | Mean Difference (IV, Random, 95% CI) | 0.0 [0.0, 0.0] |
| 56 Overall cognitive function (follow‐up values) Show forest plot | 5 | Std. Mean Difference (IV, Random, 95% CI) | Subtotals only | |
| Analysis 1.56  Comparison 1 Comparison: HRQoL outcomes, all physical activity vs control, Outcome 56 Overall cognitive function (follow‐up values). | ||||
| 56.1 End of intervention | 5 | 189 | Std. Mean Difference (IV, Random, 95% CI) | 0.40 [0.11, 0.69] |
| 56.2 Follow‐up | 2 | 97 | Std. Mean Difference (IV, Random, 95% CI) | 0.31 [‐0.09, 0.71] |
| 57 Overall cognitive function (change values) Show forest plot | 5 | Std. Mean Difference (IV, Random, 95% CI) | Subtotals only | |
| Analysis 1.57  Comparison 1 Comparison: HRQoL outcomes, all physical activity vs control, Outcome 57 Overall cognitive function (change values). | ||||
| 57.1 End of intervention | 5 | 672 | Std. Mean Difference (IV, Random, 95% CI) | ‐0.00 [‐0.27, 0.26] |
| 57.2 Follow‐up | 2 | 97 | Std. Mean Difference (IV, Random, 95% CI) | 0.20 [‐0.20, 0.60] |
| 58 EORTC QLQ‐C30 Cognitive function (follow‐up values) Show forest plot | 2 | Mean Difference (IV, Fixed, 95% CI) | Subtotals only | |
| Analysis 1.58  Comparison 1 Comparison: HRQoL outcomes, all physical activity vs control, Outcome 58 EORTC QLQ‐C30 Cognitive function (follow‐up values). | ||||
| 58.1 End of intervention | 2 | 73 | Mean Difference (IV, Fixed, 95% CI) | 2.43 [‐5.75, 10.61] |
| 58.2 Follow‐up | 0 | 0 | Mean Difference (IV, Fixed, 95% CI) | 0.0 [0.0, 0.0] |
| 59 EORTC QLQ‐C30 Cognitive function (change values) Show forest plot | 3 | Mean Difference (IV, Fixed, 95% CI) | Subtotals only | |
| Analysis 1.59 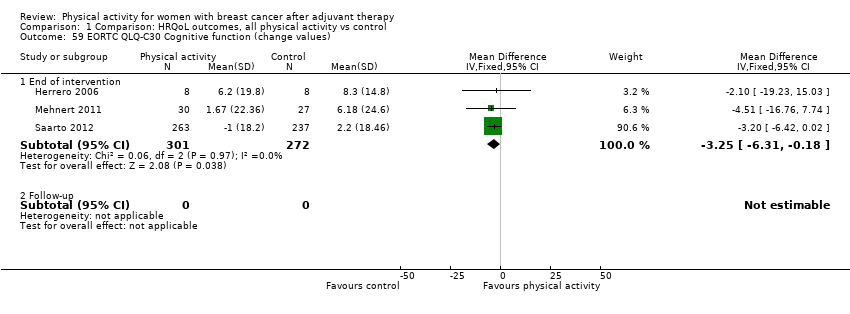 Comparison 1 Comparison: HRQoL outcomes, all physical activity vs control, Outcome 59 EORTC QLQ‐C30 Cognitive function (change values). | ||||
| 59.1 End of intervention | 3 | 573 | Mean Difference (IV, Fixed, 95% CI) | ‐3.25 [‐6.31, ‐0.18] |
| 59.2 Follow‐up | 0 | 0 | Mean Difference (IV, Fixed, 95% CI) | 0.0 [0.0, 0.0] |
| 60 POMS confusion subscale (follow‐up values) Show forest plot | 2 | Std. Mean Difference (IV, Fixed, 95% CI) | Subtotals only | |
| Analysis 1.60  Comparison 1 Comparison: HRQoL outcomes, all physical activity vs control, Outcome 60 POMS confusion subscale (follow‐up values). | ||||
| 60.1 End of intervention | 2 | 79 | Std. Mean Difference (IV, Fixed, 95% CI) | ‐0.66 [‐1.12, ‐0.19] |
| 60.2 Follow‐up | 1 | 61 | Std. Mean Difference (IV, Fixed, 95% CI) | ‐0.45 [‐0.96, 0.06] |
| 61 Overall general health (follow‐up values) Show forest plot | 9 | Std. Mean Difference (IV, Random, 95% CI) | Subtotals only | |
| Analysis 1.61 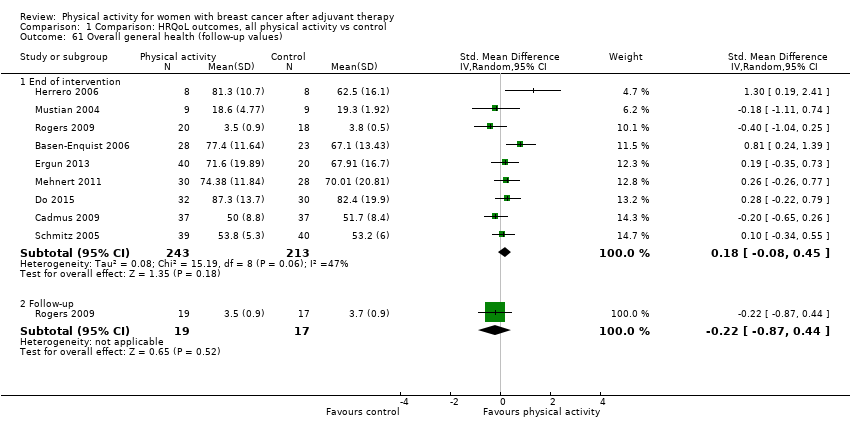 Comparison 1 Comparison: HRQoL outcomes, all physical activity vs control, Outcome 61 Overall general health (follow‐up values). | ||||
| 61.1 End of intervention | 9 | 456 | Std. Mean Difference (IV, Random, 95% CI) | 0.18 [‐0.08, 0.45] |
| 61.2 Follow‐up | 1 | 36 | Std. Mean Difference (IV, Random, 95% CI) | ‐0.22 [‐0.87, 0.44] |
| 62 Overall general health (change values) Show forest plot | 9 | Std. Mean Difference (IV, Random, 95% CI) | Subtotals only | |
| Analysis 1.62  Comparison 1 Comparison: HRQoL outcomes, all physical activity vs control, Outcome 62 Overall general health (change values). | ||||
| 62.1 End of intervention | 9 | 906 | Std. Mean Difference (IV, Random, 95% CI) | 0.17 [‐0.07, 0.40] |
| 62.2 Follow‐up | 1 | 36 | Std. Mean Difference (IV, Random, 95% CI) | 0.07 [‐0.59, 0.72] |
| 63 MOS SF General health (follow‐up values) Show forest plot | 5 | Mean Difference (IV, Random, 95% CI) | Subtotals only | |
| Analysis 1.63 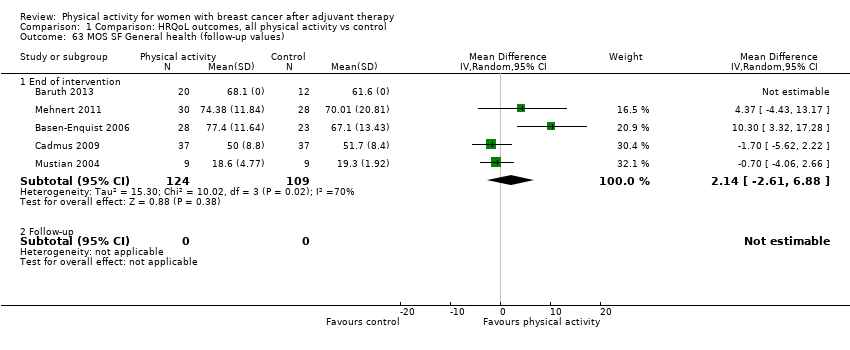 Comparison 1 Comparison: HRQoL outcomes, all physical activity vs control, Outcome 63 MOS SF General health (follow‐up values). | ||||
| 63.1 End of intervention | 5 | 233 | Mean Difference (IV, Random, 95% CI) | 2.14 [‐2.61, 6.88] |
| 63.2 Follow‐up | 0 | 0 | Mean Difference (IV, Random, 95% CI) | 0.0 [0.0, 0.0] |
| 64 MOS SF General health (change values) Show forest plot | 4 | Mean Difference (IV, Fixed, 95% CI) | Subtotals only | |
| Analysis 1.64 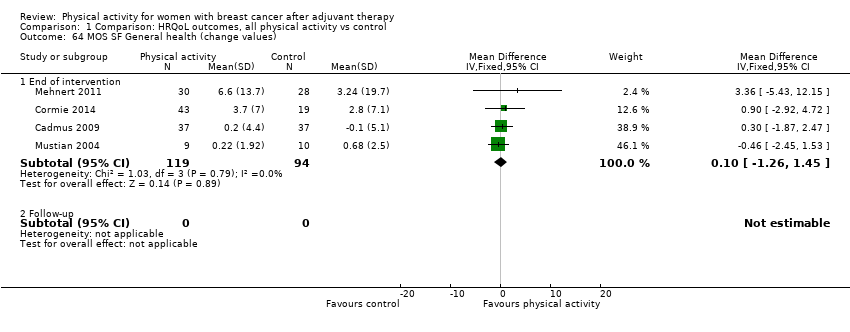 Comparison 1 Comparison: HRQoL outcomes, all physical activity vs control, Outcome 64 MOS SF General health (change values). | ||||
| 64.1 End of intervention | 4 | 213 | Mean Difference (IV, Fixed, 95% CI) | 0.10 [‐1.26, 1.45] |
| 64.2 Follow‐up | 0 | 0 | Mean Difference (IV, Fixed, 95% CI) | 0.0 [0.0, 0.0] |
| 65 Overall sexual function (follow‐up values) Show forest plot | 5 | Std. Mean Difference (IV, Fixed, 95% CI) | Subtotals only | |
| Analysis 1.65  Comparison 1 Comparison: HRQoL outcomes, all physical activity vs control, Outcome 65 Overall sexual function (follow‐up values). | ||||
| 65.1 End of intervention | 5 | 411 | Std. Mean Difference (IV, Fixed, 95% CI) | 0.16 [‐0.04, 0.35] |
| 65.2 Follow‐up | 1 | 102 | Std. Mean Difference (IV, Fixed, 95% CI) | 0.19 [‐0.20, 0.58] |
| 66 Overall sexual function (change values) Show forest plot | 3 | Std. Mean Difference (IV, Random, 95% CI) | Subtotals only | |
| Analysis 1.66  Comparison 1 Comparison: HRQoL outcomes, all physical activity vs control, Outcome 66 Overall sexual function (change values). | ||||
| 66.1 End of intervention | 3 | 693 | Std. Mean Difference (IV, Random, 95% CI) | 0.22 [‐0.08, 0.52] |
| 66.2 Follow‐up | 0 | 0 | Std. Mean Difference (IV, Random, 95% CI) | 0.0 [0.0, 0.0] |
| 67 Body Esteem Scale ‐ sexual attractiveness (follow‐up values) Show forest plot | 2 | Mean Difference (IV, Fixed, 95% CI) | Subtotals only | |
| Analysis 1.67 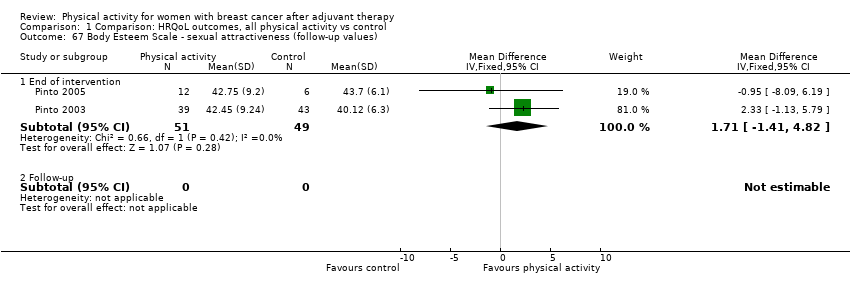 Comparison 1 Comparison: HRQoL outcomes, all physical activity vs control, Outcome 67 Body Esteem Scale ‐ sexual attractiveness (follow‐up values). | ||||
| 67.1 End of intervention | 2 | 100 | Mean Difference (IV, Fixed, 95% CI) | 1.71 [‐1.41, 4.82] |
| 67.2 Follow‐up | 0 | 0 | Mean Difference (IV, Fixed, 95% CI) | 0.0 [0.0, 0.0] |
| 68 Overall sleep (follow‐up values) Show forest plot | 5 | Std. Mean Difference (IV, Fixed, 95% CI) | Subtotals only | |
| Analysis 1.68  Comparison 1 Comparison: HRQoL outcomes, all physical activity vs control, Outcome 68 Overall sleep (follow‐up values). | ||||
| 68.1 End of intervention | 5 | 188 | Std. Mean Difference (IV, Fixed, 95% CI) | ‐0.09 [‐0.37, 0.20] |
| 68.2 Follow‐up | 1 | 31 | Std. Mean Difference (IV, Fixed, 95% CI) | ‐0.49 [‐1.20, 0.23] |
| 69 Overall sleep (change values) Show forest plot | 3 | Std. Mean Difference (IV, Random, 95% CI) | Subtotals only | |
| Analysis 1.69  Comparison 1 Comparison: HRQoL outcomes, all physical activity vs control, Outcome 69 Overall sleep (change values). | ||||
| 69.1 End of intervention | 3 | 136 | Std. Mean Difference (IV, Random, 95% CI) | 0.14 [‐0.20, 0.48] |
| 69.2 Follow‐up | 0 | 0 | Std. Mean Difference (IV, Random, 95% CI) | 0.0 [0.0, 0.0] |
| 70 PSQI Global sleep score (follow‐up values) Show forest plot | 5 | Mean Difference (IV, Fixed, 95% CI) | Subtotals only | |
| Analysis 1.70  Comparison 1 Comparison: HRQoL outcomes, all physical activity vs control, Outcome 70 PSQI Global sleep score (follow‐up values). | ||||
| 70.1 End of intervention | 5 | 317 | Mean Difference (IV, Fixed, 95% CI) | ‐0.47 [‐1.01, 0.08] |
| 70.2 Follow‐up | 1 | 31 | Mean Difference (IV, Fixed, 95% CI) | ‐1.5 [‐3.63, 0.63] |
| 71 PSQI Global sleep score (change values) Show forest plot | 2 | Mean Difference (IV, Fixed, 95% CI) | Subtotals only | |
| Analysis 1.71  Comparison 1 Comparison: HRQoL outcomes, all physical activity vs control, Outcome 71 PSQI Global sleep score (change values). | ||||
| 71.1 End of intervention | 2 | 80 | Mean Difference (IV, Fixed, 95% CI) | 0.54 [‐1.11, 2.19] |
| 71.2 Follow‐up | 0 | 0 | Mean Difference (IV, Fixed, 95% CI) | 0.0 [0.0, 0.0] |
| 72 PSQI sleep quality (follow‐up values) Show forest plot | 2 | Mean Difference (IV, Random, 95% CI) | Subtotals only | |
| Analysis 1.72 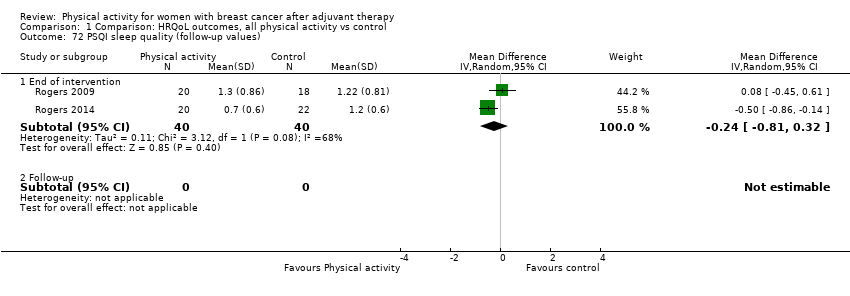 Comparison 1 Comparison: HRQoL outcomes, all physical activity vs control, Outcome 72 PSQI sleep quality (follow‐up values). | ||||
| 72.1 End of intervention | 2 | 80 | Mean Difference (IV, Random, 95% CI) | ‐0.24 [‐0.81, 0.32] |
| 72.2 Follow‐up | 0 | 0 | Mean Difference (IV, Random, 95% CI) | 0.0 [0.0, 0.0] |
| 73 PSQI sleep efficiency (follow‐up values) Show forest plot | 3 | Mean Difference (IV, Fixed, 95% CI) | Subtotals only | |
| Analysis 1.73  Comparison 1 Comparison: HRQoL outcomes, all physical activity vs control, Outcome 73 PSQI sleep efficiency (follow‐up values). | ||||
| 73.1 End of intervention | 3 | 100 | Mean Difference (IV, Fixed, 95% CI) | 0.15 [‐0.24, 0.53] |
| 73.2 Follow‐up | 0 | 0 | Mean Difference (IV, Fixed, 95% CI) | 0.0 [0.0, 0.0] |
| 74 PSQI sleep latency (follow‐up values) Show forest plot | 3 | Mean Difference (IV, Fixed, 95% CI) | Subtotals only | |
| Analysis 1.74  Comparison 1 Comparison: HRQoL outcomes, all physical activity vs control, Outcome 74 PSQI sleep latency (follow‐up values). | ||||
| 74.1 End of intervention | 3 | 100 | Mean Difference (IV, Fixed, 95% CI) | 0.19 [‐0.16, 0.55] |
| 74.2 Follow‐up | 0 | 0 | Mean Difference (IV, Fixed, 95% CI) | 0.0 [0.0, 0.0] |
| 75 PSQI sleep duration (follow‐up values) Show forest plot | 2 | Mean Difference (IV, Fixed, 95% CI) | Subtotals only | |
| Analysis 1.75  Comparison 1 Comparison: HRQoL outcomes, all physical activity vs control, Outcome 75 PSQI sleep duration (follow‐up values). | ||||
| 75.1 End of intervention | 2 | 80 | Mean Difference (IV, Fixed, 95% CI) | 0.06 [‐0.28, 0.41] |
| 75.2 Follow‐up | 0 | 0 | Mean Difference (IV, Fixed, 95% CI) | 0.0 [0.0, 0.0] |
| 76 PSQI daytime dysfunction (follow‐up values) Show forest plot | 3 | Mean Difference (IV, Random, 95% CI) | Subtotals only | |
| Analysis 1.76  Comparison 1 Comparison: HRQoL outcomes, all physical activity vs control, Outcome 76 PSQI daytime dysfunction (follow‐up values). | ||||
| 76.1 End of intervention | 3 | 100 | Mean Difference (IV, Random, 95% CI) | ‐0.08 [‐0.51, 0.35] |
| 76.2 Follow‐up | 0 | 0 | Mean Difference (IV, Random, 95% CI) | 0.0 [0.0, 0.0] |
| 77 PSQI medication use (follow‐up values) Show forest plot | 2 | Std. Mean Difference (IV, Random, 95% CI) | Subtotals only | |
| Analysis 1.77  Comparison 1 Comparison: HRQoL outcomes, all physical activity vs control, Outcome 77 PSQI medication use (follow‐up values). | ||||
| 77.1 End of intervention | 2 | 80 | Std. Mean Difference (IV, Random, 95% CI) | ‐0.06 [‐0.50, 0.38] |
| 77.2 Follow‐up | 0 | 0 | Std. Mean Difference (IV, Random, 95% CI) | 0.0 [0.0, 0.0] |
| 78 Accelerator‐derived sleep efficiency (follow‐up values) Show forest plot | 2 | Mean Difference (IV, Fixed, 95% CI) | Subtotals only | |
| Analysis 1.78  Comparison 1 Comparison: HRQoL outcomes, all physical activity vs control, Outcome 78 Accelerator‐derived sleep efficiency (follow‐up values). | ||||
| 78.1 End of intervention | 2 | 62 | Mean Difference (IV, Fixed, 95% CI) | ‐2.25 [‐5.52, 1.01] |
| 78.2 Follow‐up | 0 | 0 | Mean Difference (IV, Fixed, 95% CI) | 0.0 [0.0, 0.0] |
| 79 Accelerator‐derived sleep latency (follow‐up values) Show forest plot | 2 | Mean Difference (IV, Fixed, 95% CI) | Subtotals only | |
| Analysis 1.79 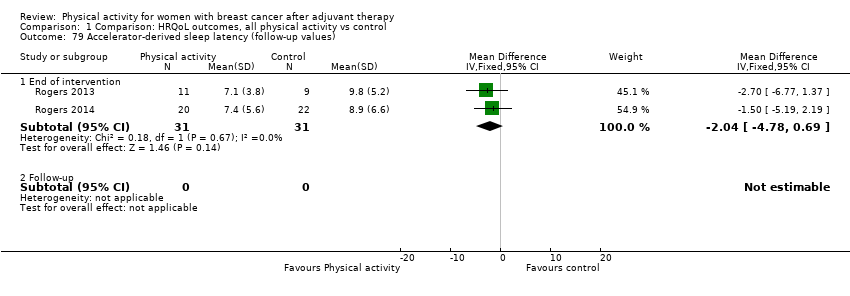 Comparison 1 Comparison: HRQoL outcomes, all physical activity vs control, Outcome 79 Accelerator‐derived sleep latency (follow‐up values). | ||||
| 79.1 End of intervention | 2 | 62 | Mean Difference (IV, Fixed, 95% CI) | ‐2.04 [‐4.78, 0.69] |
| 79.2 Follow‐up | 0 | 0 | Mean Difference (IV, Fixed, 95% CI) | 0.0 [0.0, 0.0] |
| Outcome or subgroup title | No. of studies | No. of participants | Statistical method | Effect size |
| 1 Overall anxiety (follow‐up values) Show forest plot | 7 | Std. Mean Difference (IV, Random, 95% CI) | Subtotals only | |
| Analysis 2.1 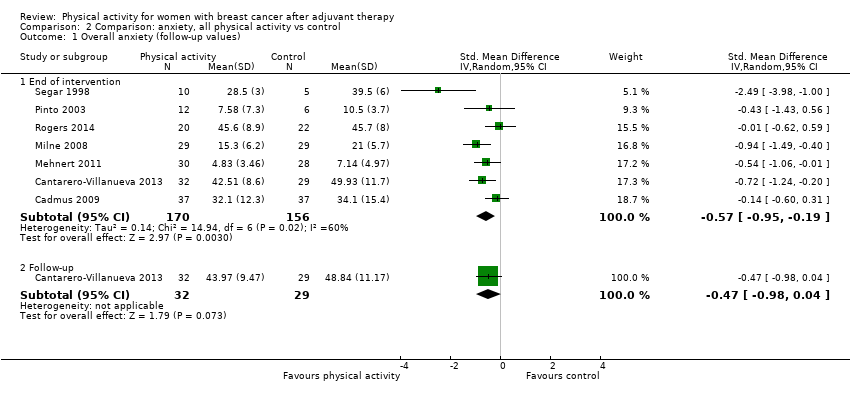 Comparison 2 Comparison: anxiety, all physical activity vs control, Outcome 1 Overall anxiety (follow‐up values). | ||||
| 1.1 End of intervention | 7 | 326 | Std. Mean Difference (IV, Random, 95% CI) | ‐0.57 [‐0.95, ‐0.19] |
| 1.2 Follow‐up | 1 | 61 | Std. Mean Difference (IV, Random, 95% CI) | ‐0.47 [‐0.98, 0.04] |
| 2 Overall anxiety (change values) Show forest plot | 4 | Std. Mean Difference (IV, Fixed, 95% CI) | Subtotals only | |
| Analysis 2.2 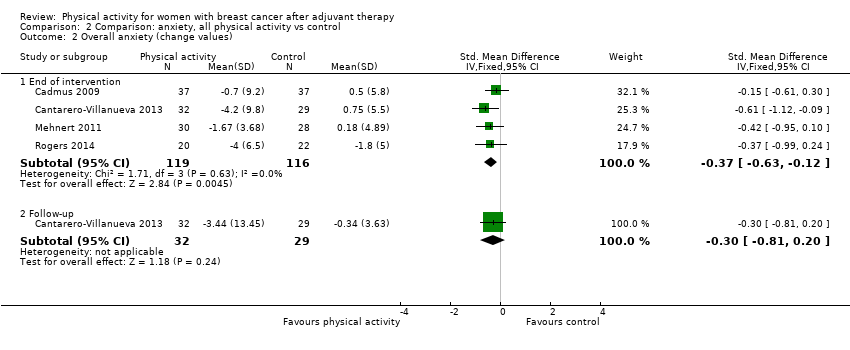 Comparison 2 Comparison: anxiety, all physical activity vs control, Outcome 2 Overall anxiety (change values). | ||||
| 2.1 End of intervention | 4 | 235 | Std. Mean Difference (IV, Fixed, 95% CI) | ‐0.37 [‐0.63, ‐0.12] |
| 2.2 Follow‐up | 1 | 61 | Std. Mean Difference (IV, Fixed, 95% CI) | ‐0.30 [‐0.81, 0.20] |
| 3 POMS tension ‐ anxiety (follow‐up values) Show forest plot | 2 | Std. Mean Difference (IV, Fixed, 95% CI) | Subtotals only | |
| Analysis 2.3 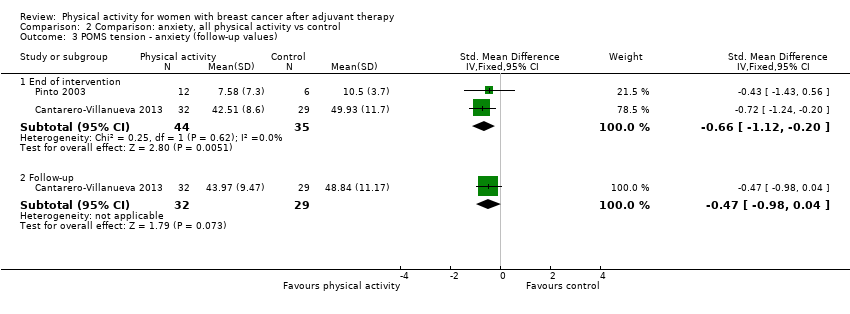 Comparison 2 Comparison: anxiety, all physical activity vs control, Outcome 3 POMS tension ‐ anxiety (follow‐up values). | ||||
| 3.1 End of intervention | 2 | 79 | Std. Mean Difference (IV, Fixed, 95% CI) | ‐0.66 [‐1.12, ‐0.20] |
| 3.2 Follow‐up | 1 | 61 | Std. Mean Difference (IV, Fixed, 95% CI) | ‐0.47 [‐0.98, 0.04] |
| 4 State Trait Anxiety Inventory (follow‐up values) Show forest plot | 2 | Std. Mean Difference (IV, Random, 95% CI) | Subtotals only | |
| Analysis 2.4 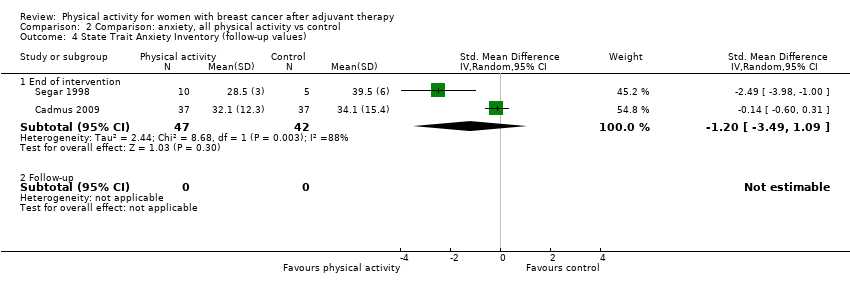 Comparison 2 Comparison: anxiety, all physical activity vs control, Outcome 4 State Trait Anxiety Inventory (follow‐up values). | ||||
| 4.1 End of intervention | 2 | 89 | Std. Mean Difference (IV, Random, 95% CI) | ‐1.20 [‐3.49, 1.09] |
| 4.2 Follow‐up | 0 | 0 | Std. Mean Difference (IV, Random, 95% CI) | 0.0 [0.0, 0.0] |
| 5 Cohen's Perceived Stress Scale Show forest plot | 2 | Mean Difference (IV, Fixed, 95% CI) | Subtotals only | |
| Analysis 2.5 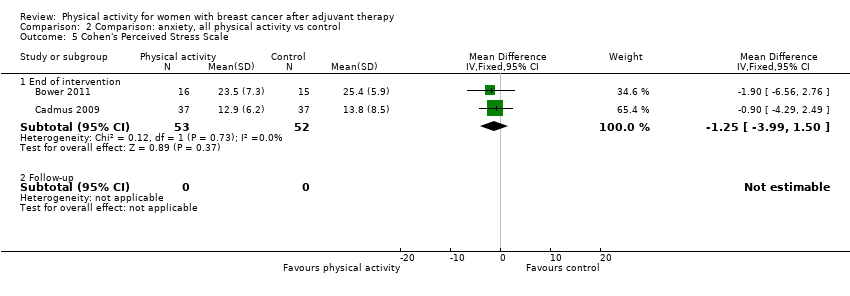 Comparison 2 Comparison: anxiety, all physical activity vs control, Outcome 5 Cohen's Perceived Stress Scale. | ||||
| 5.1 End of intervention | 2 | 105 | Mean Difference (IV, Fixed, 95% CI) | ‐1.25 [‐3.99, 1.50] |
| 5.2 Follow‐up | 0 | 0 | Mean Difference (IV, Fixed, 95% CI) | 0.0 [0.0, 0.0] |
| Outcome or subgroup title | No. of studies | No. of participants | Statistical method | Effect size |
| 1 Overall depression (follow‐up values) Show forest plot | 12 | Std. Mean Difference (IV, Random, 95% CI) | Subtotals only | |
| Analysis 3.1 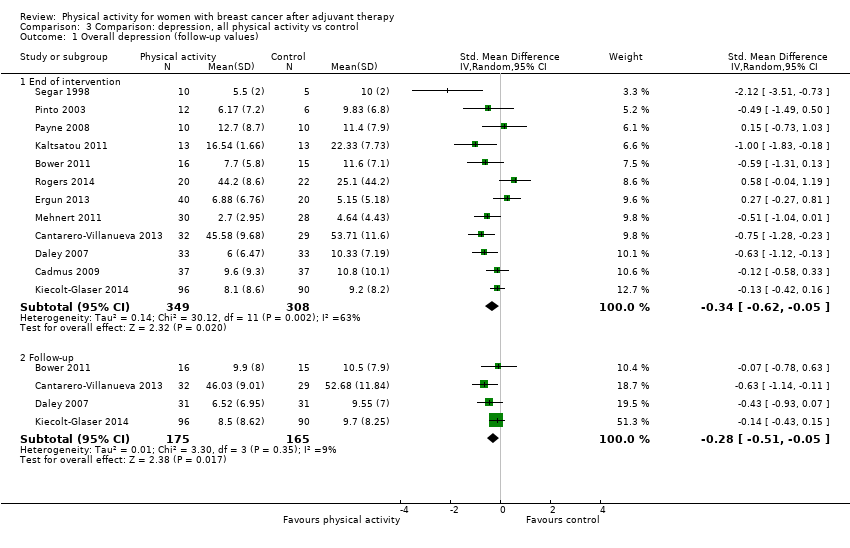 Comparison 3 Comparison: depression, all physical activity vs control, Outcome 1 Overall depression (follow‐up values). | ||||
| 1.1 End of intervention | 12 | 657 | Std. Mean Difference (IV, Random, 95% CI) | ‐0.34 [‐0.62, ‐0.05] |
| 1.2 Follow‐up | 4 | 340 | Std. Mean Difference (IV, Random, 95% CI) | ‐0.28 [‐0.51, ‐0.05] |
| 2 Overall depression (change values) Show forest plot | 7 | Std. Mean Difference (IV, Random, 95% CI) | Subtotals only | |
| Analysis 3.2 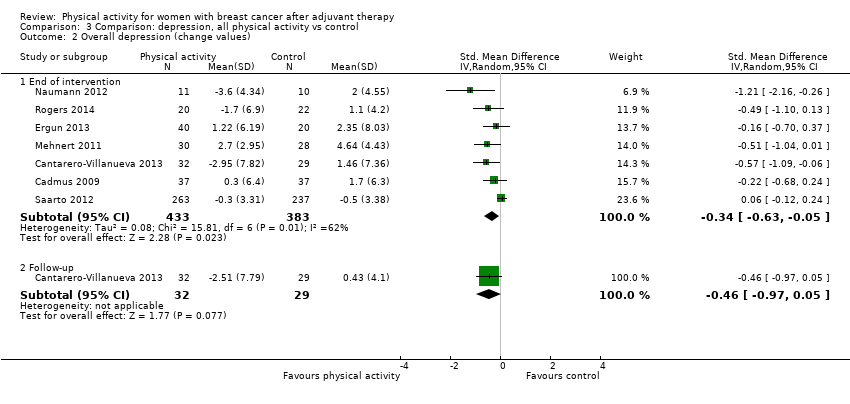 Comparison 3 Comparison: depression, all physical activity vs control, Outcome 2 Overall depression (change values). | ||||
| 2.1 End of intervention | 7 | 816 | Std. Mean Difference (IV, Random, 95% CI) | ‐0.34 [‐0.63, ‐0.05] |
| 2.2 Follow‐up | 1 | 61 | Std. Mean Difference (IV, Random, 95% CI) | ‐0.46 [‐0.97, 0.05] |
| 3 Beck Depression Inventory‐II (follow‐up values) Show forest plot | 5 | Mean Difference (IV, Random, 95% CI) | Subtotals only | |
| Analysis 3.3 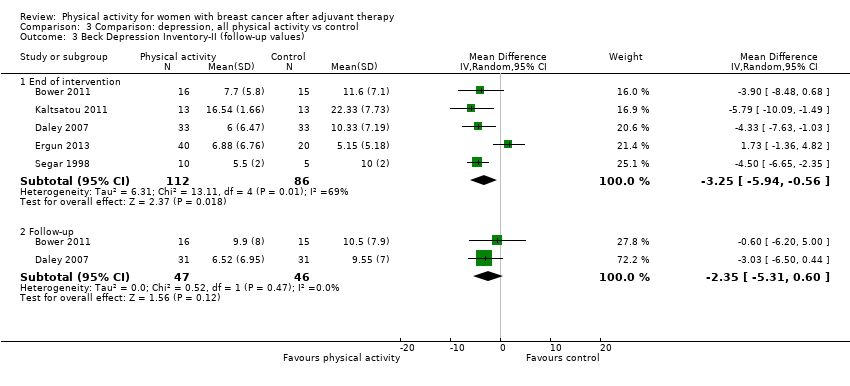 Comparison 3 Comparison: depression, all physical activity vs control, Outcome 3 Beck Depression Inventory‐II (follow‐up values). | ||||
| 3.1 End of intervention | 5 | 198 | Mean Difference (IV, Random, 95% CI) | ‐3.25 [‐5.94, ‐0.56] |
| 3.2 Follow‐up | 2 | 93 | Mean Difference (IV, Random, 95% CI) | ‐2.35 [‐5.31, 0.60] |
| 4 Beck Depression Inventory‐II (change values) Show forest plot | 3 | Mean Difference (IV, Random, 95% CI) | Subtotals only | |
| Analysis 3.4 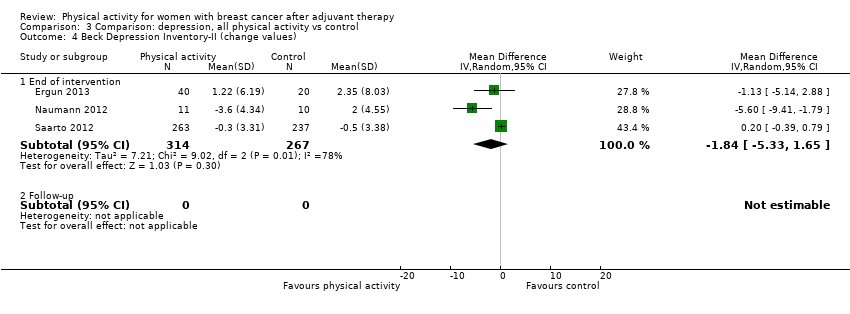 Comparison 3 Comparison: depression, all physical activity vs control, Outcome 4 Beck Depression Inventory‐II (change values). | ||||
| 4.1 End of intervention | 3 | 581 | Mean Difference (IV, Random, 95% CI) | ‐1.84 [‐5.33, 1.65] |
| 4.2 Follow‐up | 0 | 0 | Mean Difference (IV, Random, 95% CI) | 0.0 [0.0, 0.0] |
| 5 CES‐Depression scale (follow‐up values) Show forest plot | 3 | Mean Difference (IV, Fixed, 95% CI) | Subtotals only | |
| Analysis 3.5 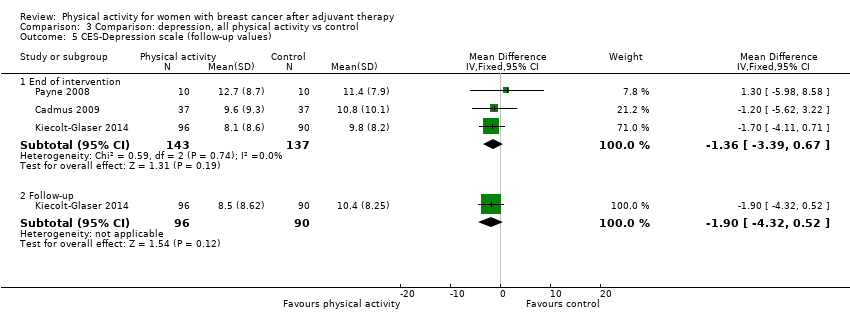 Comparison 3 Comparison: depression, all physical activity vs control, Outcome 5 CES‐Depression scale (follow‐up values). | ||||
| 5.1 End of intervention | 3 | 280 | Mean Difference (IV, Fixed, 95% CI) | ‐1.36 [‐3.39, 0.67] |
| 5.2 Follow‐up | 1 | 186 | Mean Difference (IV, Fixed, 95% CI) | ‐1.90 [‐4.32, 0.52] |
| 6 POMS depression subscale (follow‐up values) Show forest plot | 2 | Mean Difference (IV, Random, 95% CI) | Subtotals only | |
| Analysis 3.6 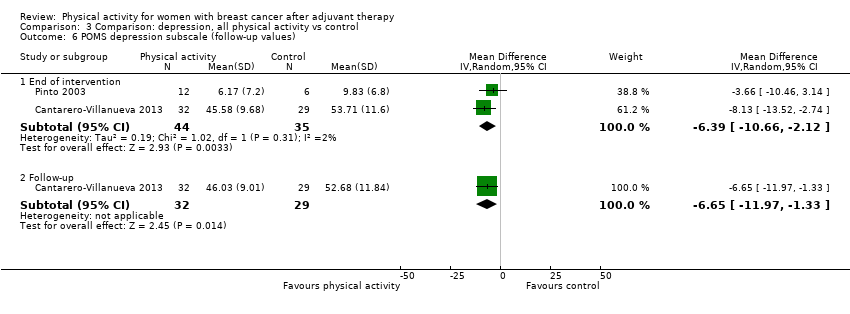 Comparison 3 Comparison: depression, all physical activity vs control, Outcome 6 POMS depression subscale (follow‐up values). | ||||
| 6.1 End of intervention | 2 | 79 | Mean Difference (IV, Random, 95% CI) | ‐6.39 [‐10.66, ‐2.12] |
| 6.2 Follow‐up | 1 | 61 | Mean Difference (IV, Random, 95% CI) | ‐6.65 [‐11.97, ‐1.33] |
| 7 POMS tension subscale (follow‐up values) Show forest plot | 2 | Mean Difference (IV, Random, 95% CI) | Subtotals only | |
| Analysis 3.7 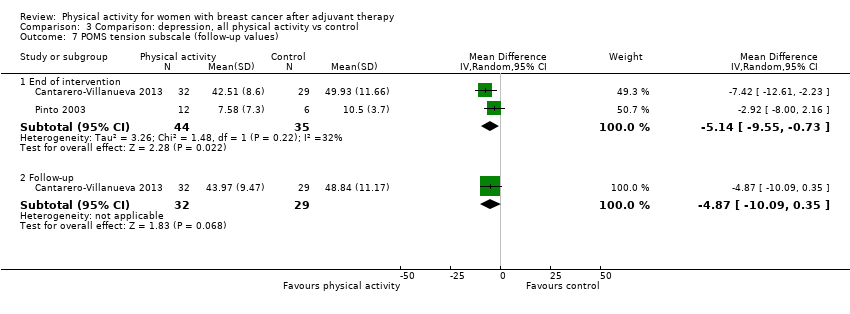 Comparison 3 Comparison: depression, all physical activity vs control, Outcome 7 POMS tension subscale (follow‐up values). | ||||
| 7.1 End of intervention | 2 | 79 | Mean Difference (IV, Random, 95% CI) | ‐5.14 [‐9.55, ‐0.73] |
| 7.2 Follow‐up | 1 | 61 | Mean Difference (IV, Random, 95% CI) | ‐4.87 [‐10.09, 0.35] |
| Outcome or subgroup title | No. of studies | No. of participants | Statistical method | Effect size |
| 1 Overall fatigue (follow‐up values) Show forest plot | 26 | Std. Mean Difference (IV, Random, 95% CI) | Subtotals only | |
| Analysis 4.1  Comparison 4 Comparison: fatigue and vigour, all physical activity vs control, Outcome 1 Overall fatigue (follow‐up values). | ||||
| 1.1 End of intervention | 26 | 2020 | Std. Mean Difference (IV, Random, 95% CI) | ‐0.32 [‐0.47, ‐0.18] |
| 1.2 Follow‐up | 7 | 536 | Std. Mean Difference (IV, Random, 95% CI) | ‐0.43 [‐0.60, ‐0.26] |
| 2 Overall fatigue (change values) Show forest plot | 13 | Std. Mean Difference (IV, Random, 95% CI) | Subtotals only | |
| Analysis 4.2 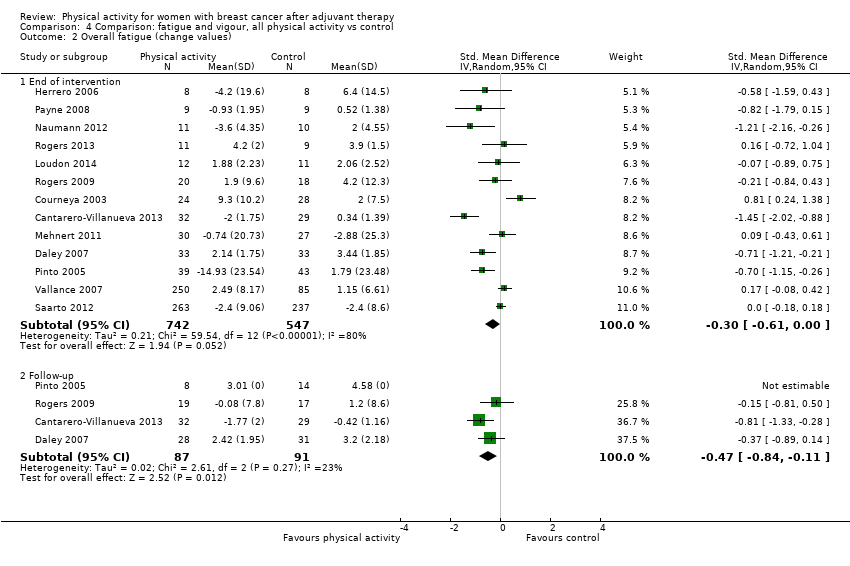 Comparison 4 Comparison: fatigue and vigour, all physical activity vs control, Outcome 2 Overall fatigue (change values). | ||||
| 2.1 End of intervention | 13 | 1289 | Std. Mean Difference (IV, Random, 95% CI) | ‐0.30 [‐0.61, 0.00] |
| 2.2 Follow‐up | 4 | 178 | Std. Mean Difference (IV, Random, 95% CI) | ‐0.47 [‐0.84, ‐0.11] |
| 3 FACT‐Fatigue (follow‐up values) Show forest plot | 7 | Mean Difference (IV, Fixed, 95% CI) | Subtotals only | |
| Analysis 4.3  Comparison 4 Comparison: fatigue and vigour, all physical activity vs control, Outcome 3 FACT‐Fatigue (follow‐up values). | ||||
| 3.1 End of intervention | 7 | 952 | Mean Difference (IV, Fixed, 95% CI) | 1.14 [‐0.06, 2.35] |
| 3.2 Follow‐up | 2 | 112 | Mean Difference (IV, Fixed, 95% CI) | 1.49 [‐1.95, 4.93] |
| 4 FACT‐Fatigue (change values) Show forest plot | 4 | Mean Difference (IV, Random, 95% CI) | Subtotals only | |
| Analysis 4.4  Comparison 4 Comparison: fatigue and vigour, all physical activity vs control, Outcome 4 FACT‐Fatigue (change values). | ||||
| 4.1 End of intervention | 4 | 925 | Mean Difference (IV, Random, 95% CI) | ‐0.54 [‐3.23, 2.14] |
| 4.2 Follow‐up | 1 | 36 | Mean Difference (IV, Random, 95% CI) | 1.28 [‐4.11, 6.67] |
| 5 EORTC QLQ‐C30 Fatigue scale (follow‐up values) Show forest plot | 2 | Mean Difference (IV, Fixed, 95% CI) | Subtotals only | |
| Analysis 4.5 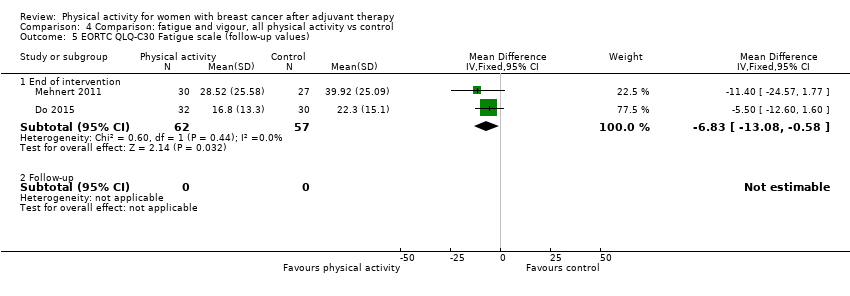 Comparison 4 Comparison: fatigue and vigour, all physical activity vs control, Outcome 5 EORTC QLQ‐C30 Fatigue scale (follow‐up values). | ||||
| 5.1 End of intervention | 2 | 119 | Mean Difference (IV, Fixed, 95% CI) | ‐6.83 [‐13.08, ‐0.58] |
| 5.2 Follow‐up | 0 | 0 | Mean Difference (IV, Fixed, 95% CI) | 0.0 [0.0, 0.0] |
| 6 EORTC QLQ‐C30 Fatigue scale (change values) Show forest plot | 2 | Mean Difference (IV, Random, 95% CI) | Subtotals only | |
| Analysis 4.6 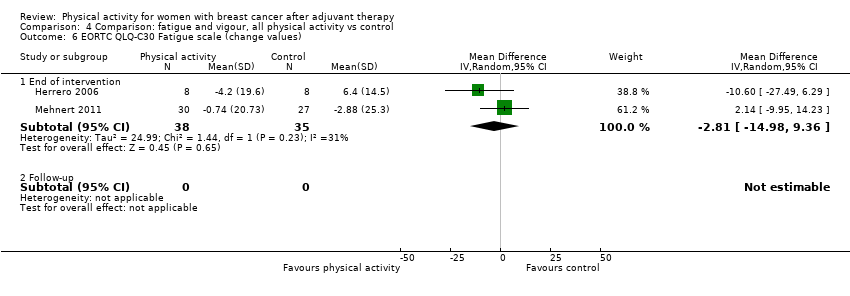 Comparison 4 Comparison: fatigue and vigour, all physical activity vs control, Outcome 6 EORTC QLQ‐C30 Fatigue scale (change values). | ||||
| 6.1 End of intervention | 2 | 73 | Mean Difference (IV, Random, 95% CI) | ‐2.81 [‐14.98, 9.36] |
| 6.2 Follow‐up | 0 | 0 | Mean Difference (IV, Random, 95% CI) | 0.0 [0.0, 0.0] |
| 7 Multidimensional Fatigue Symptom Inventory (follow‐up values) Show forest plot | 5 | Mean Difference (IV, Random, 95% CI) | Subtotals only | |
| Analysis 4.7  Comparison 4 Comparison: fatigue and vigour, all physical activity vs control, Outcome 7 Multidimensional Fatigue Symptom Inventory (follow‐up values). | ||||
| 7.1 End of intervention | 5 | 366 | Mean Difference (IV, Random, 95% CI) | ‐0.53 [‐1.35, 0.29] |
| 7.2 Follow‐up | 3 | 304 | Mean Difference (IV, Random, 95% CI) | ‐2.04 [‐4.30, 0.23] |
| 8 Multidimensional Fatigue Symptom Inventory ‐ interference (follow‐up values) Show forest plot | 2 | Mean Difference (IV, Random, 95% CI) | Subtotals only | |
| Analysis 4.8  Comparison 4 Comparison: fatigue and vigour, all physical activity vs control, Outcome 8 Multidimensional Fatigue Symptom Inventory ‐ interference (follow‐up values). | ||||
| 8.1 End of intervention | 2 | 62 | Mean Difference (IV, Random, 95% CI) | ‐0.37 [‐1.34, 0.60] |
| 8.2 Follow‐up | 0 | 0 | Mean Difference (IV, Random, 95% CI) | 0.0 [0.0, 0.0] |
| 9 Revised Piper Fatigue Scale total fatigue (follow‐up values) Show forest plot | 4 | Mean Difference (IV, Random, 95% CI) | Subtotals only | |
| Analysis 4.9  Comparison 4 Comparison: fatigue and vigour, all physical activity vs control, Outcome 9 Revised Piper Fatigue Scale total fatigue (follow‐up values). | ||||
| 9.1 End of intervention | 4 | 187 | Mean Difference (IV, Random, 95% CI) | ‐1.18 [‐2.38, 0.02] |
| 9.2 Follow‐up | 2 | 120 | Mean Difference (IV, Random, 95% CI) | ‐1.15 [‐1.86, ‐0.43] |
| 10 Revised Piper Fatigue Scale total fatigue (change values) Show forest plot | 4 | Mean Difference (IV, Random, 95% CI) | Subtotals only | |
| Analysis 4.10  Comparison 4 Comparison: fatigue and vigour, all physical activity vs control, Outcome 10 Revised Piper Fatigue Scale total fatigue (change values). | ||||
| 10.1 End of intervention | 4 | 166 | Mean Difference (IV, Random, 95% CI) | ‐1.96 [‐2.93, 1.00] |
| 10.2 Follow‐up | 2 | 120 | Mean Difference (IV, Random, 95% CI) | ‐1.14 [‐1.78, ‐0.49] |
| 11 Revised Piper Fatigue Scale behavioural/severity (follow‐up values) Show forest plot | 3 | Mean Difference (IV, Random, 95% CI) | Subtotals only | |
| Analysis 4.11  Comparison 4 Comparison: fatigue and vigour, all physical activity vs control, Outcome 11 Revised Piper Fatigue Scale behavioural/severity (follow‐up values). | ||||
| 11.1 End of intervention | 3 | 121 | Mean Difference (IV, Random, 95% CI) | ‐1.24 [‐2.49, 0.01] |
| 11.2 Follow‐up | 1 | 61 | Mean Difference (IV, Random, 95% CI) | ‐1.41 [‐2.57, ‐0.25] |
| 12 Revised Piper Fatigue Scale affective/meaning (follow‐up values) Show forest plot | 3 | Mean Difference (IV, Fixed, 95% CI) | Subtotals only | |
| Analysis 4.12  Comparison 4 Comparison: fatigue and vigour, all physical activity vs control, Outcome 12 Revised Piper Fatigue Scale affective/meaning (follow‐up values). | ||||
| 12.1 End of intervention | 3 | 121 | Mean Difference (IV, Fixed, 95% CI) | ‐2.11 [‐3.03, ‐1.20] |
| 12.2 Follow‐up | 1 | 61 | Mean Difference (IV, Fixed, 95% CI) | ‐2.05 [‐3.21, ‐0.89] |
| 13 Revised Piper Fatigue Scale sensory (follow‐up values) Show forest plot | 3 | Mean Difference (IV, Random, 95% CI) | Subtotals only | |
| Analysis 4.13  Comparison 4 Comparison: fatigue and vigour, all physical activity vs control, Outcome 13 Revised Piper Fatigue Scale sensory (follow‐up values). | ||||
| 13.1 End of intervention | 3 | 121 | Mean Difference (IV, Random, 95% CI) | ‐0.44 [‐3.11, 2.22] |
| 13.2 Follow‐up | 1 | 61 | Mean Difference (IV, Random, 95% CI) | ‐1.60 [‐2.65, ‐0.55] |
| 14 Revised Piper Fatigue Scale cognitive/mood (follow‐up values) Show forest plot | 3 | Mean Difference (IV, Random, 95% CI) | Subtotals only | |
| Analysis 4.14  Comparison 4 Comparison: fatigue and vigour, all physical activity vs control, Outcome 14 Revised Piper Fatigue Scale cognitive/mood (follow‐up values). | ||||
| 14.1 End of intervention | 3 | 121 | Mean Difference (IV, Random, 95% CI) | ‐0.72 [‐2.31, 0.87] |
| 14.2 Follow‐up | 1 | 61 | Mean Difference (IV, Random, 95% CI) | ‐1.40 [‐2.50, ‐0.30] |
| 15 Schwartz Cancer Fatigue Scale (follow‐up values) Show forest plot | 2 | Mean Difference (IV, Random, 95% CI) | Subtotals only | |
| Analysis 4.15  Comparison 4 Comparison: fatigue and vigour, all physical activity vs control, Outcome 15 Schwartz Cancer Fatigue Scale (follow‐up values). | ||||
| 15.1 End of intervention | 2 | 125 | Mean Difference (IV, Random, 95% CI) | ‐2.01 [‐9.25, 5.23] |
| 15.2 Follow‐up | 0 | 0 | Mean Difference (IV, Random, 95% CI) | 0.0 [0.0, 0.0] |
| 16 POMS fatigue scale (follow‐up values) Show forest plot | 2 | Std. Mean Difference (IV, Fixed, 95% CI) | Subtotals only | |
| Analysis 4.16 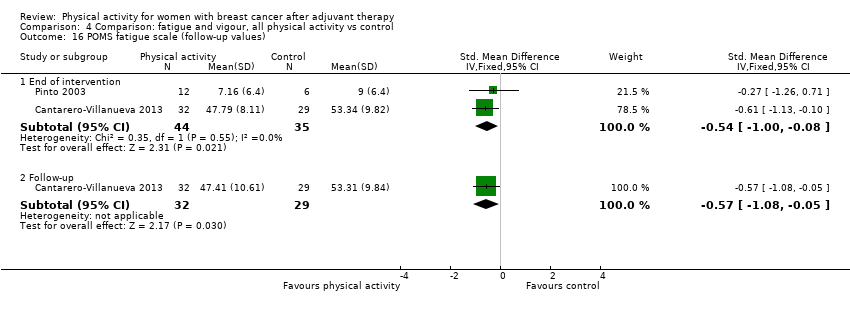 Comparison 4 Comparison: fatigue and vigour, all physical activity vs control, Outcome 16 POMS fatigue scale (follow‐up values). | ||||
| 16.1 End of intervention | 2 | 79 | Std. Mean Difference (IV, Fixed, 95% CI) | ‐0.54 [1.00, ‐0.08] |
| 16.2 Follow‐up | 1 | 61 | Std. Mean Difference (IV, Fixed, 95% CI) | ‐0.57 [‐1.08, ‐0.05] |
| 17 Visual analogue scale fatigue (follow‐up and change values) Show forest plot | 4 | Std. Mean Difference (IV, Fixed, 95% CI) | Subtotals only | |
| Analysis 4.17  Comparison 4 Comparison: fatigue and vigour, all physical activity vs control, Outcome 17 Visual analogue scale fatigue (follow‐up and change values). | ||||
| 17.1 End of intervention | 4 | 148 | Std. Mean Difference (IV, Fixed, 95% CI) | ‐0.51 [‐0.88, ‐0.14] |
| 17.2 Follow‐up | 1 | 22 | Std. Mean Difference (IV, Fixed, 95% CI) | 0.0 [0.0, 0.0] |
| 18 Overall vigour/vitality (follow‐up values) Show forest plot | 10 | Std. Mean Difference (IV, Random, 95% CI) | Subtotals only | |
| Analysis 4.18  Comparison 4 Comparison: fatigue and vigour, all physical activity vs control, Outcome 18 Overall vigour/vitality (follow‐up values). | ||||
| 18.1 End of intervention | 10 | 762 | Std. Mean Difference (IV, Random, 95% CI) | 0.36 [0.21, 0.50] |
| 18.2 Follow‐up | 4 | 454 | Std. Mean Difference (IV, Random, 95% CI) | 0.26 [0.04, 0.48] |
| 19 Overall vigour/vitality (change values) Show forest plot | 6 | Std. Mean Difference (IV, Random, 95% CI) | Subtotals only | |
| Analysis 4.19  Comparison 4 Comparison: fatigue and vigour, all physical activity vs control, Outcome 19 Overall vigour/vitality (change values). | ||||
| 19.1 End of intervention | 6 | 359 | Std. Mean Difference (IV, Random, 95% CI) | 0.23 [0.00, 0.45] |
| 19.2 Follow‐up | 2 | 233 | Std. Mean Difference (IV, Random, 95% CI) | 0.20 [‐0.06, 0.46] |
| 20 MOS SF vitality (follow‐up values) Show forest plot | 6 | Mean Difference (IV, Fixed, 95% CI) | Subtotals only | |
| Analysis 4.20 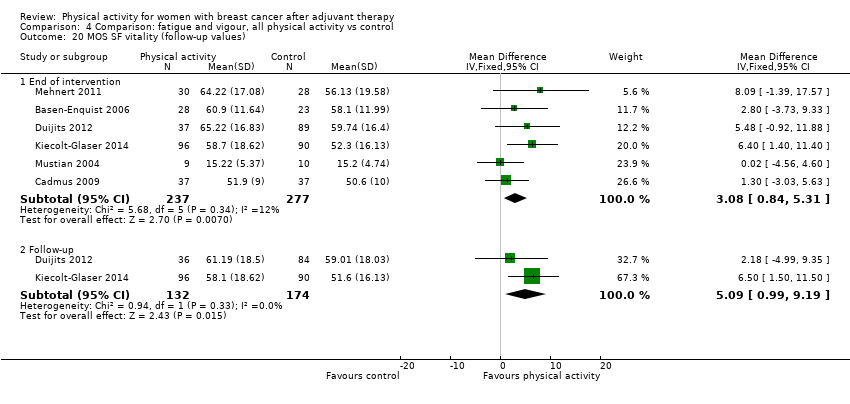 Comparison 4 Comparison: fatigue and vigour, all physical activity vs control, Outcome 20 MOS SF vitality (follow‐up values). | ||||
| 20.1 End of intervention | 6 | 514 | Mean Difference (IV, Fixed, 95% CI) | 3.08 [0.84, 5.31] |
| 20.2 Follow‐up | 2 | 306 | Mean Difference (IV, Fixed, 95% CI) | 5.09 [0.99, 9.19] |
| 21 MOS SF vitality (change values) Show forest plot | 4 | Mean Difference (IV, Fixed, 95% CI) | Subtotals only | |
| Analysis 4.21  Comparison 4 Comparison: fatigue and vigour, all physical activity vs control, Outcome 21 MOS SF vitality (change values). | ||||
| 21.1 End of intervention | 4 | 212 | Mean Difference (IV, Fixed, 95% CI) | 1.36 [‐0.52, 3.25] |
| 21.2 Follow‐up | 0 | 0 | Mean Difference (IV, Fixed, 95% CI) | 0.0 [0.0, 0.0] |
| 22 POMS vigour scale (follow‐up values) Show forest plot | 4 | Std. Mean Difference (IV, Random, 95% CI) | Subtotals only | |
| Analysis 4.22  Comparison 4 Comparison: fatigue and vigour, all physical activity vs control, Outcome 22 POMS vigour scale (follow‐up values). | ||||
| 22.1 End of intervention | 4 | 248 | Std. Mean Difference (IV, Random, 95% CI) | 0.46 [0.13, 0.79] |
| 22.2 Follow‐up | 2 | 148 | Std. Mean Difference (IV, Random, 95% CI) | 0.21 [‐0.34, 0.77] |
| 23 POMS vigour scale (change values) Show forest plot | 2 | Std. Mean Difference (IV, Random, 95% CI) | Subtotals only | |
| Analysis 4.23  Comparison 4 Comparison: fatigue and vigour, all physical activity vs control, Outcome 23 POMS vigour scale (change values). | ||||
| 23.1 End of intervention | 2 | 147 | Std. Mean Difference (IV, Random, 95% CI) | 0.25 [‐0.45, 0.95] |
| 23.2 Follow‐up | 2 | 233 | Std. Mean Difference (IV, Random, 95% CI) | 0.20 [‐0.06, 0.46] |
| Outcome or subgroup title | No. of studies | No. of participants | Statistical method | Effect size |
| 1 Overall pain/disability (follow‐up values) Show forest plot | 9 | Std. Mean Difference (IV, Random, 95% CI) | Subtotals only | |
| Analysis 5.1 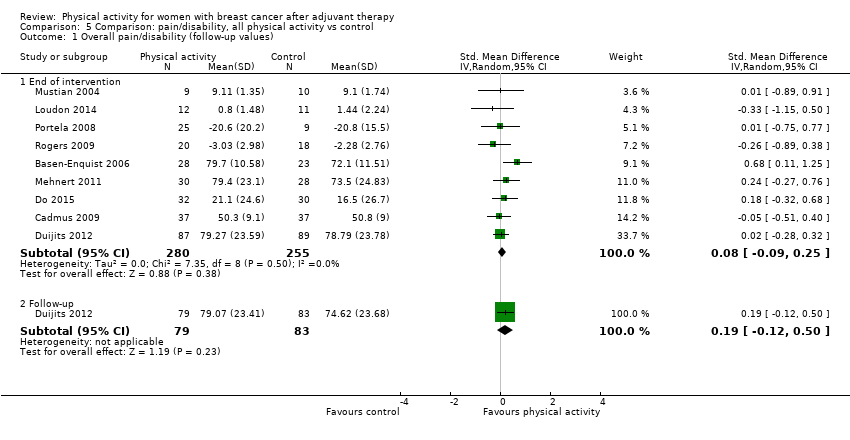 Comparison 5 Comparison: pain/disability, all physical activity vs control, Outcome 1 Overall pain/disability (follow‐up values). | ||||
| 1.1 End of intervention | 9 | 535 | Std. Mean Difference (IV, Random, 95% CI) | 0.08 [‐0.09, 0.25] |
| 1.2 Follow‐up | 1 | 162 | Std. Mean Difference (IV, Random, 95% CI) | 0.19 [‐0.12, 0.50] |
| 2 Overall pain/disability (change values) Show forest plot | 6 | Std. Mean Difference (IV, Random, 95% CI) | Subtotals only | |
| Analysis 5.2  Comparison 5 Comparison: pain/disability, all physical activity vs control, Outcome 2 Overall pain/disability (change values). | ||||
| 2.1 End of intervention | 5 | 296 | Std. Mean Difference (IV, Random, 95% CI) | ‐0.08 [‐0.33, 0.16] |
| 2.2 Follow‐up | 1 | 36 | Std. Mean Difference (IV, Random, 95% CI) | 0.22 [‐0.43, 0.88] |
| 3 Brief Pain Inventory severity score (change values) Show forest plot | 2 | Mean Difference (IV, Random, 95% CI) | Subtotals only | |
| Analysis 5.3 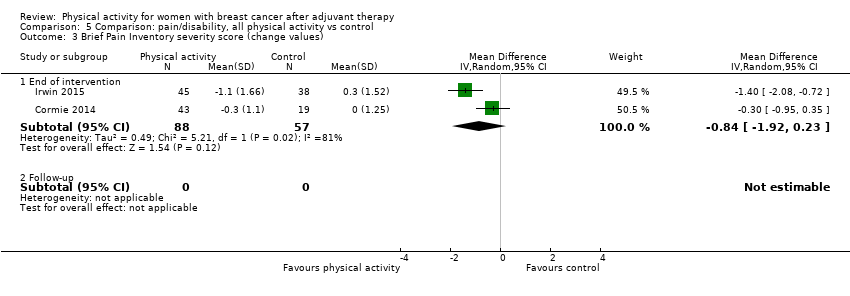 Comparison 5 Comparison: pain/disability, all physical activity vs control, Outcome 3 Brief Pain Inventory severity score (change values). | ||||
| 3.1 End of intervention | 2 | 145 | Mean Difference (IV, Random, 95% CI) | ‐0.84 [‐1.92, 0.23] |
| 3.2 Follow‐up | 0 | 0 | Mean Difference (IV, Random, 95% CI) | 0.0 [0.0, 0.0] |
| 4 Brief Pain Inventory interference score (change values) Show forest plot | 2 | Mean Difference (IV, Random, 95% CI) | Subtotals only | |
| Analysis 5.4 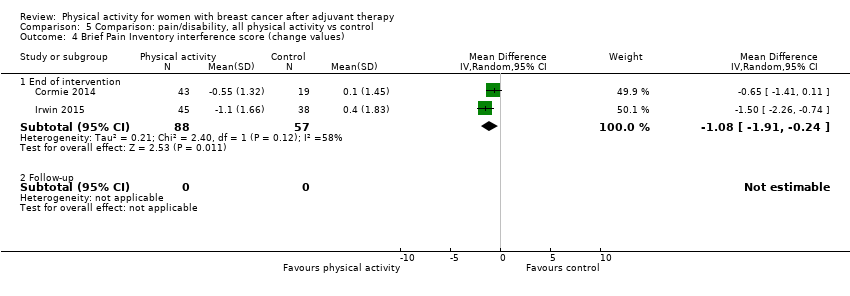 Comparison 5 Comparison: pain/disability, all physical activity vs control, Outcome 4 Brief Pain Inventory interference score (change values). | ||||
| 4.1 End of intervention | 2 | 145 | Mean Difference (IV, Random, 95% CI) | ‐1.08 [‐1.91, ‐0.24] |
| 4.2 Follow‐up | 0 | 0 | Mean Difference (IV, Random, 95% CI) | 0.0 [0.0, 0.0] |
| 5 DASH (follow‐up and change values) Show forest plot | 3 | Mean Difference (IV, Fixed, 95% CI) | Subtotals only | |
| Analysis 5.5 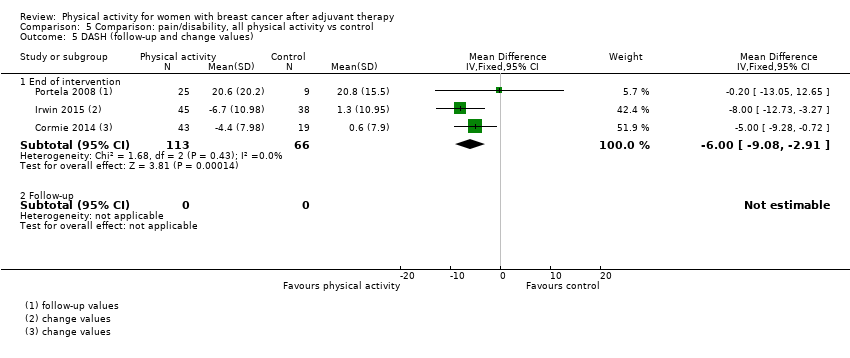 Comparison 5 Comparison: pain/disability, all physical activity vs control, Outcome 5 DASH (follow‐up and change values). | ||||
| 5.1 End of intervention | 3 | 179 | Mean Difference (IV, Fixed, 95% CI) | ‐4.00 [‐9.08, ‐2.91] |
| 5.2 Follow‐up | 0 | 0 | Mean Difference (IV, Fixed, 95% CI) | 0.0 [0.0, 0.0] |
| 6 EORTC QLQ‐C30 Pain scale (follow‐up and change values) Show forest plot | 2 | Mean Difference (IV, Fixed, 95% CI) | Subtotals only | |
| Analysis 5.6 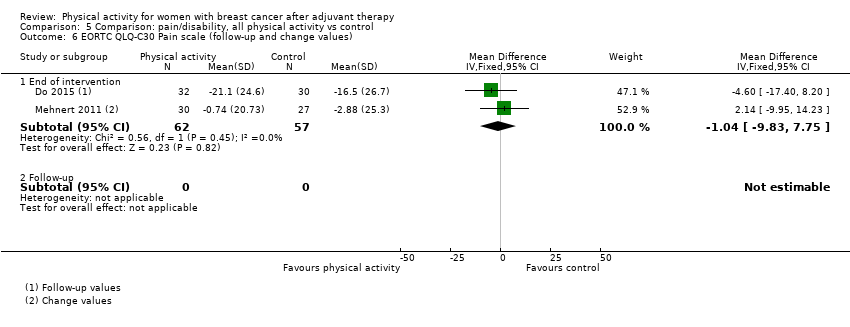 Comparison 5 Comparison: pain/disability, all physical activity vs control, Outcome 6 EORTC QLQ‐C30 Pain scale (follow‐up and change values). | ||||
| 6.1 End of intervention | 2 | 119 | Mean Difference (IV, Fixed, 95% CI) | ‐1.04 [‐9.83, 7.75] |
| 6.2 Follow‐up | 0 | 0 | Mean Difference (IV, Fixed, 95% CI) | 0.0 [0.0, 0.0] |
| 7 MOS SF Pain (follow‐up values) Show forest plot | 5 | Mean Difference (IV, Random, 95% CI) | Subtotals only | |
| Analysis 5.7 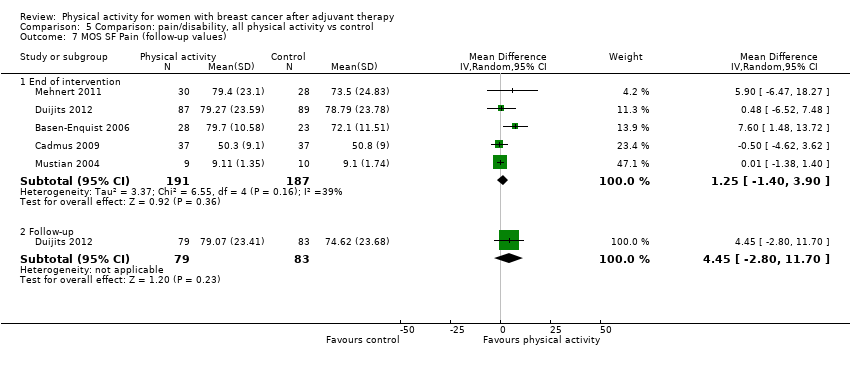 Comparison 5 Comparison: pain/disability, all physical activity vs control, Outcome 7 MOS SF Pain (follow‐up values). | ||||
| 7.1 End of intervention | 5 | 378 | Mean Difference (IV, Random, 95% CI) | 1.25 [‐1.40, 3.90] |
| 7.2 Follow‐up | 1 | 162 | Mean Difference (IV, Random, 95% CI) | 4.45 [‐2.80, 11.70] |
| 8 MOS SF Pain (change values) Show forest plot | 4 | Mean Difference (IV, Fixed, 95% CI) | Subtotals only | |
| Analysis 5.8  Comparison 5 Comparison: pain/disability, all physical activity vs control, Outcome 8 MOS SF Pain (change values). | ||||
| 8.1 End of intervention | 4 | 213 | Mean Difference (IV, Fixed, 95% CI) | 0.07 [‐1.04, 1.17] |
| 8.2 Follow‐up | 0 | 0 | Mean Difference (IV, Fixed, 95% CI) | 0.0 [0.0, 0.0] |
| 9 WOMAC joint pain (follow‐up and change values) Show forest plot | 2 | Mean Difference (IV, Random, 95% CI) | Subtotals only | |
| Analysis 5.9  Comparison 5 Comparison: pain/disability, all physical activity vs control, Outcome 9 WOMAC joint pain (follow‐up and change values). | ||||
| 9.1 End of intervention | 2 | 121 | Mean Difference (IV, Random, 95% CI) | ‐2.36 [‐7.55, 2.82] |
| 9.2 Follow‐up | 0 | 0 | Mean Difference (IV, Random, 95% CI) | 0.0 [0.0, 0.0] |
| 10 WOMAC physical dysfunction (follow‐up and change values) Show forest plot | 2 | Mean Difference (IV, Random, 95% CI) | Subtotals only | |
| Analysis 5.10  Comparison 5 Comparison: pain/disability, all physical activity vs control, Outcome 10 WOMAC physical dysfunction (follow‐up and change values). | ||||
| 10.1 End of intervention | 2 | 121 | Mean Difference (IV, Random, 95% CI) | ‐6.15 [‐16.21, 3.92] |
| 10.2 Follow‐up | 0 | 0 | Mean Difference (IV, Random, 95% CI) | 0.0 [0.0, 0.0] |
| 11 WOMAC total score (follow‐up and change values) Show forest plot | 2 | Mean Difference (IV, Random, 95% CI) | Subtotals only | |
| Analysis 5.11 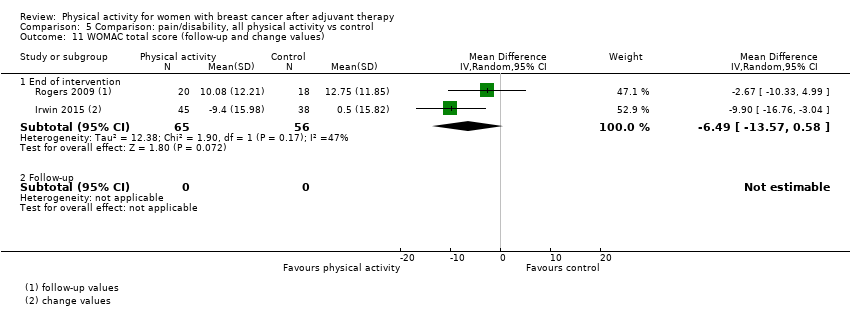 Comparison 5 Comparison: pain/disability, all physical activity vs control, Outcome 11 WOMAC total score (follow‐up and change values). | ||||
| 11.1 End of intervention | 2 | 121 | Mean Difference (IV, Random, 95% CI) | ‐6.49 [‐13.57, 0.58] |
| 11.2 Follow‐up | 0 | 0 | Mean Difference (IV, Random, 95% CI) | 0.0 [0.0, 0.0] |
| Outcome or subgroup title | No. of studies | No. of participants | Statistical method | Effect size |
| 1 Overall self‐esteem/body image (follow‐up values) Show forest plot | 12 | Std. Mean Difference (IV, Random, 95% CI) | Subtotals only | |
| Analysis 6.1  Comparison 6 Comparison: self‐esteem, all physical activity vs control, Outcome 1 Overall self‐esteem/body image (follow‐up values). | ||||
| 1.1 End of intervention | 12 | 667 | Std. Mean Difference (IV, Random, 95% CI) | 0.27 [0.05, 0.48] |
| 1.2 Follow‐up | 1 | 61 | Std. Mean Difference (IV, Random, 95% CI) | 0.57 [0.05, 1.08] |
| 2 Overall self‐esteem/body image (change values) Show forest plot | 9 | Std. Mean Difference (IV, Random, 95% CI) | Subtotals only | |
| Analysis 6.2 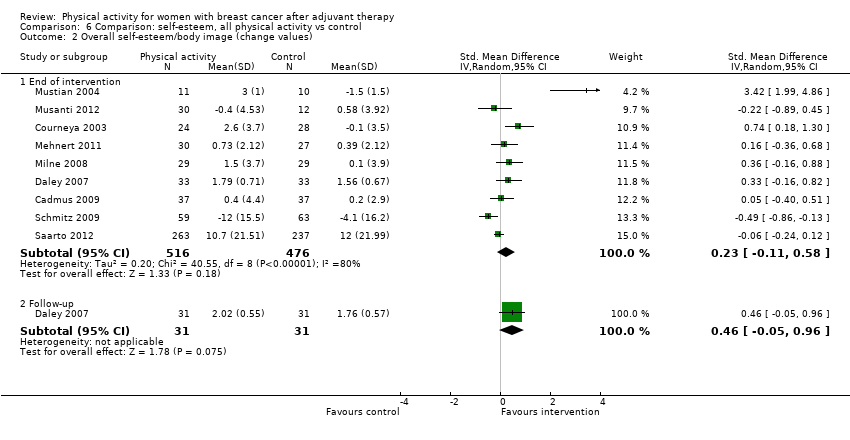 Comparison 6 Comparison: self‐esteem, all physical activity vs control, Outcome 2 Overall self‐esteem/body image (change values). | ||||
| 2.1 End of intervention | 9 | 992 | Std. Mean Difference (IV, Random, 95% CI) | 0.23 [‐0.11, 0.58] |
| 2.2 Follow‐up | 1 | 62 | Std. Mean Difference (IV, Random, 95% CI) | 0.46 [‐0.05, 0.96] |
| 3 Body Esteem Scale ‐ weight concern (follow‐up values) Show forest plot | 2 | Mean Difference (IV, Random, 95% CI) | Subtotals only | |
| Analysis 6.3  Comparison 6 Comparison: self‐esteem, all physical activity vs control, Outcome 3 Body Esteem Scale ‐ weight concern (follow‐up values). | ||||
| 3.1 End of intervention | 2 | 100 | Mean Difference (IV, Random, 95% CI) | 4.22 [‐1.01, 9.45] |
| 3.2 Follow‐up | 0 | 0 | Mean Difference (IV, Random, 95% CI) | 0.0 [0.0, 0.0] |
| 4 Physical self‐perception profile ‐ attractiveness of body (follow‐up values) Show forest plot | 2 | Mean Difference (IV, Fixed, 95% CI) | Subtotals only | |
| Analysis 6.4  Comparison 6 Comparison: self‐esteem, all physical activity vs control, Outcome 4 Physical self‐perception profile ‐ attractiveness of body (follow‐up values). | ||||
| 4.1 End of intervention | 2 | 107 | Mean Difference (IV, Fixed, 95% CI) | 0.46 [0.13, 0.79] |
| 4.2 Follow‐up | 1 | 61 | Mean Difference (IV, Fixed, 95% CI) | 0.29 [0.04, 0.54] |
| 5 Physical self‐perception profile ‐ attractiveness of body (change values) Show forest plot | 2 | Mean Difference (IV, Fixed, 95% CI) | Subtotals only | |
| Analysis 6.5  Comparison 6 Comparison: self‐esteem, all physical activity vs control, Outcome 5 Physical self‐perception profile ‐ attractiveness of body (change values). | ||||
| 5.1 End of intervention | 2 | 108 | Mean Difference (IV, Fixed, 95% CI) | 0.26 [‐0.07, 0.59] |
| 5.2 Follow‐up | 1 | 62 | Mean Difference (IV, Fixed, 95% CI) | 0.26 [‐0.02, 0.54] |
| 6 Rosenberg Self‐Esteem Scale (follow‐up values) Show forest plot | 4 | Mean Difference (IV, Random, 95% CI) | Subtotals only | |
| Analysis 6.6 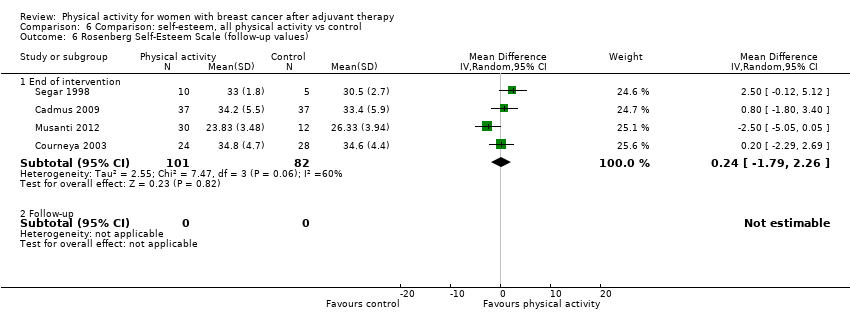 Comparison 6 Comparison: self‐esteem, all physical activity vs control, Outcome 6 Rosenberg Self‐Esteem Scale (follow‐up values). | ||||
| 6.1 End of intervention | 4 | 183 | Mean Difference (IV, Random, 95% CI) | 0.24 [‐1.79, 2.26] |
| 6.2 Follow‐up | 0 | 0 | Mean Difference (IV, Random, 95% CI) | 0.0 [0.0, 0.0] |
| 7 Rosenberg Self‐Esteem Scale (change values) Show forest plot | 4 | Mean Difference (IV, Fixed, 95% CI) | Subtotals only | |
| Analysis 6.7  Comparison 6 Comparison: self‐esteem, all physical activity vs control, Outcome 7 Rosenberg Self‐Esteem Scale (change values). | ||||
| 7.1 End of intervention | 4 | 189 | Mean Difference (IV, Fixed, 95% CI) | 2.78 [1.98, 3.58] |
| 7.2 Follow‐up | 0 | 0 | Mean Difference (IV, Fixed, 95% CI) | 0.0 [0.0, 0.0] |
| 8 EORTC QLQ‐C30 Body image (follow‐up and change values) Show forest plot | 2 | Mean Difference (IV, Fixed, 95% CI) | Subtotals only | |
| Analysis 6.8  Comparison 6 Comparison: self‐esteem, all physical activity vs control, Outcome 8 EORTC QLQ‐C30 Body image (follow‐up and change values). | ||||
| 8.1 End of intervention | 2 | 562 | Mean Difference (IV, Fixed, 95% CI) | ‐0.85 [‐4.38, 2.68] |
| 8.2 Follow‐up | 0 | 0 | Mean Difference (IV, Fixed, 95% CI) | 0.0 [0.0, 0.0] |
| Outcome or subgroup title | No. of studies | No. of participants | Statistical method | Effect size |
| 1 Overall cardiorespiratory fitness (follow‐up values) Show forest plot | 23 | Std. Mean Difference (IV, Random, 95% CI) | Subtotals only | |
| Analysis 7.1 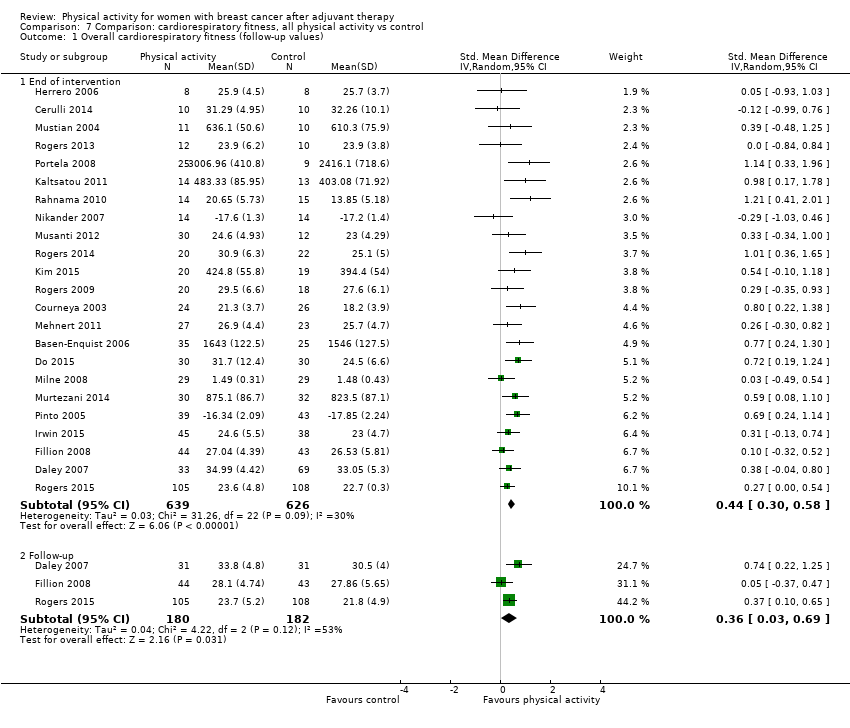 Comparison 7 Comparison: cardiorespiratory fitness, all physical activity vs control, Outcome 1 Overall cardiorespiratory fitness (follow‐up values). | ||||
| 1.1 End of intervention | 23 | 1265 | Std. Mean Difference (IV, Random, 95% CI) | 0.44 [0.30, 0.58] |
| 1.2 Follow‐up | 3 | 362 | Std. Mean Difference (IV, Random, 95% CI) | 0.36 [0.03, 0.69] |
| 2 Overall cardiorespiratory fitness (change values) Show forest plot | 10 | Std. Mean Difference (IV, Random, 95% CI) | Subtotals only | |
| Analysis 7.2  Comparison 7 Comparison: cardiorespiratory fitness, all physical activity vs control, Outcome 2 Overall cardiorespiratory fitness (change values). | ||||
| 2.1 End of intervention | 9 | 863 | Std. Mean Difference (IV, Random, 95% CI) | 0.83 [0.40, 1.27] |
| 2.2 Follow‐up | 2 | 115 | Std. Mean Difference (IV, Random, 95% CI) | 0.42 [0.05, 0.79] |
| 3 Directly assessed VO₂max/peak (follow‐up values) Show forest plot | 4 | Mean Difference (IV, Fixed, 95% CI) | Subtotals only | |
| Analysis 7.3  Comparison 7 Comparison: cardiorespiratory fitness, all physical activity vs control, Outcome 3 Directly assessed VO₂max/peak (follow‐up values). | ||||
| 3.1 End of intervention | 4 | 199 | Mean Difference (IV, Fixed, 95% CI) | 1.89 [0.65, 3.13] |
| 3.2 Follow‐up | 0 | 0 | Mean Difference (IV, Fixed, 95% CI) | 0.0 [0.0, 0.0] |
| 4 Directly assessed VO₂max/peak (change values) Show forest plot | 3 | Std. Mean Difference (IV, Random, 95% CI) | Subtotals only | |
| Analysis 7.4  Comparison 7 Comparison: cardiorespiratory fitness, all physical activity vs control, Outcome 4 Directly assessed VO₂max/peak (change values). | ||||
| 4.1 End of intervention | 3 | 166 | Std. Mean Difference (IV, Random, 95% CI) | 1.31 [0.66, 1.96] |
| 4.2 Follow‐up | 0 | 0 | Std. Mean Difference (IV, Random, 95% CI) | 0.0 [0.0, 0.0] |
| 5 Directly assessed VO₂max/peak ‐ treadmill (follow‐up and change values) Show forest plot | 2 | Std. Mean Difference (IV, Random, 95% CI) | Subtotals only | |
| Analysis 7.5  Comparison 7 Comparison: cardiorespiratory fitness, all physical activity vs control, Outcome 5 Directly assessed VO₂max/peak ‐ treadmill (follow‐up and change values). | ||||
| 5.1 End of intervention | 2 | 116 | Std. Mean Difference (IV, Random, 95% CI) | 1.04 [‐0.49, 2.58] |
| 5.2 Follow‐up | 0 | 0 | Std. Mean Difference (IV, Random, 95% CI) | 0.0 [0.0, 0.0] |
| 6 Directly assessed VO₂max/peak ‐ cycle ergometer (follow‐up values) Show forest plot | 3 | Mean Difference (IV, Random, 95% CI) | Subtotals only | |
| Analysis 7.6 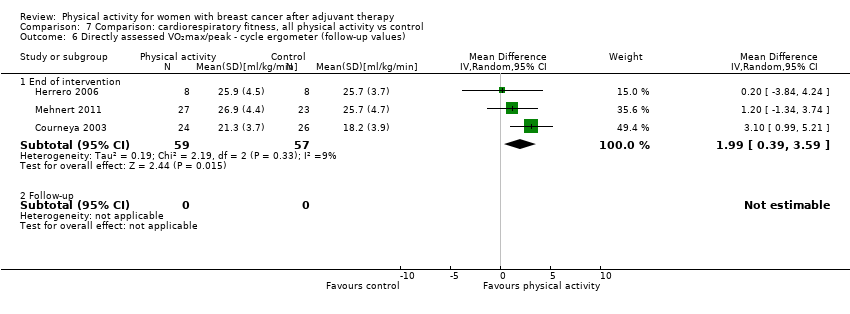 Comparison 7 Comparison: cardiorespiratory fitness, all physical activity vs control, Outcome 6 Directly assessed VO₂max/peak ‐ cycle ergometer (follow‐up values). | ||||
| 6.1 End of intervention | 3 | 116 | Mean Difference (IV, Random, 95% CI) | 1.99 [0.39, 3.59] |
| 6.2 Follow‐up | 0 | 0 | Mean Difference (IV, Random, 95% CI) | 0.0 [0.0, 0.0] |
| 7 Peak Power Output ‐ cycle ergometer test (follow‐up values) Show forest plot | 2 | Mean Difference (IV, Fixed, 95% CI) | Subtotals only | |
| Analysis 7.7 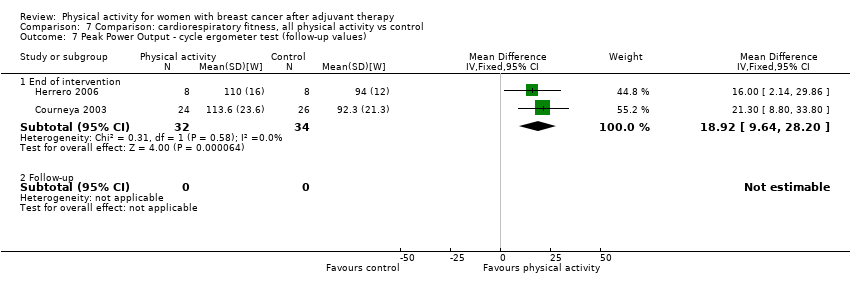 Comparison 7 Comparison: cardiorespiratory fitness, all physical activity vs control, Outcome 7 Peak Power Output ‐ cycle ergometer test (follow‐up values). | ||||
| 7.1 End of intervention | 2 | 66 | Mean Difference (IV, Fixed, 95% CI) | 18.92 [9.64, 28.20] |
| 7.2 Follow‐up | 0 | 0 | Mean Difference (IV, Fixed, 95% CI) | 0.0 [0.0, 0.0] |
| 8 Peak Respiratory Exchange Ratio ‐ cycle ergometer test (follow‐up values) Show forest plot | 2 | Mean Difference (IV, Fixed, 95% CI) | Subtotals only | |
| Analysis 7.8  Comparison 7 Comparison: cardiorespiratory fitness, all physical activity vs control, Outcome 8 Peak Respiratory Exchange Ratio ‐ cycle ergometer test (follow‐up values). | ||||
| 8.1 End of intervention | 2 | 66 | Mean Difference (IV, Fixed, 95% CI) | ‐0.01 [‐0.04, 0.03] |
| 8.2 Follow‐up | 0 | 0 | Mean Difference (IV, Fixed, 95% CI) | 0.0 [0.0, 0.0] |
| 9 Peak Heart Rate ‐ cycle ergometer test (follow‐up values) Show forest plot | 2 | Mean Difference (IV, Fixed, 95% CI) | Subtotals only | |
| Analysis 7.9  Comparison 7 Comparison: cardiorespiratory fitness, all physical activity vs control, Outcome 9 Peak Heart Rate ‐ cycle ergometer test (follow‐up values). | ||||
| 9.1 End of intervention | 2 | 66 | Mean Difference (IV, Fixed, 95% CI) | 2.02 [‐5.65, 9.68] |
| 9.2 Follow‐up | 0 | 0 | Mean Difference (IV, Fixed, 95% CI) | 0.0 [0.0, 0.0] |
| 10 Ebbeling single‐stage treadmill test (follow‐up and change values) Show forest plot | 2 | Mean Difference (IV, Random, 95% CI) | Subtotals only | |
| Analysis 7.10 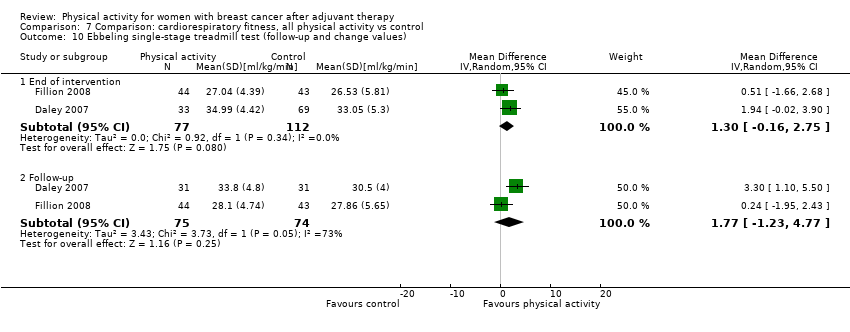 Comparison 7 Comparison: cardiorespiratory fitness, all physical activity vs control, Outcome 10 Ebbeling single‐stage treadmill test (follow‐up and change values). | ||||
| 10.1 End of intervention | 2 | 189 | Mean Difference (IV, Random, 95% CI) | 1.30 [‐0.16, 2.75] |
| 10.2 Follow‐up | 2 | 149 | Mean Difference (IV, Random, 95% CI) | 1.77 [‐1.23, 4.77] |
| 11 Modified Bruce treadmill test (follow‐up and change values) Show forest plot | 3 | Mean Difference (IV, Random, 95% CI) | Subtotals only | |
| Analysis 7.11  Comparison 7 Comparison: cardiorespiratory fitness, all physical activity vs control, Outcome 11 Modified Bruce treadmill test (follow‐up and change values). | ||||
| 11.1 End of intervention | 3 | 92 | Mean Difference (IV, Random, 95% CI) | 3.57 [0.95, 6.19] |
| 11.2 Follow‐up | 0 | 0 | Mean Difference (IV, Random, 95% CI) | 0.0 [0.0, 0.0] |
| 12 Naughton submaximal treadmill test (follow‐up and change values) Show forest plot | 4 | Mean Difference (IV, Random, 95% CI) | Subtotals only | |
| Analysis 7.12 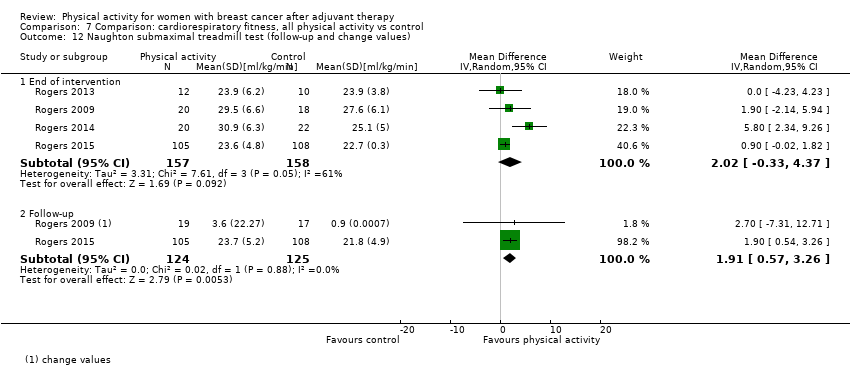 Comparison 7 Comparison: cardiorespiratory fitness, all physical activity vs control, Outcome 12 Naughton submaximal treadmill test (follow‐up and change values). | ||||
| 12.1 End of intervention | 4 | 315 | Mean Difference (IV, Random, 95% CI) | 2.02 [‐0.33, 4.37] |
| 12.2 Follow‐up | 2 | 249 | Mean Difference (IV, Random, 95% CI) | 1.91 [0.57, 3.26] |
| 13 Cardiorespiratory fitness walk tests (follow‐up values) Show forest plot | 7 | Std. Mean Difference (IV, Random, 95% CI) | Subtotals only | |
| Analysis 7.13 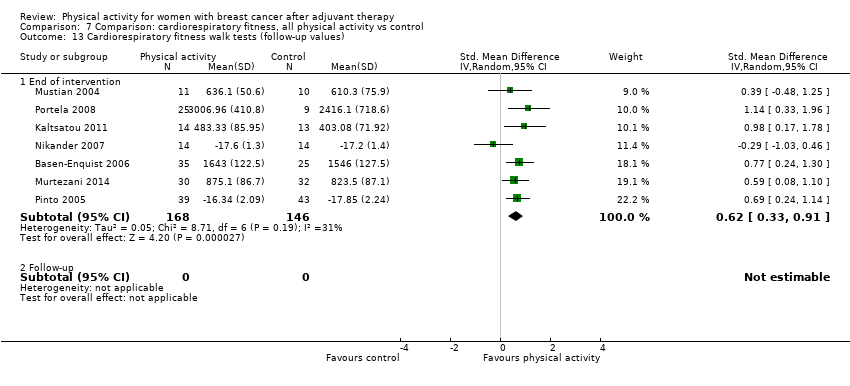 Comparison 7 Comparison: cardiorespiratory fitness, all physical activity vs control, Outcome 13 Cardiorespiratory fitness walk tests (follow‐up values). | ||||
| 13.1 End of intervention | 7 | 314 | Std. Mean Difference (IV, Random, 95% CI) | 0.62 [0.33, 0.91] |
| 13.2 Follow‐up | 0 | 0 | Std. Mean Difference (IV, Random, 95% CI) | 0.0 [0.0, 0.0] |
| 14 Cardiorespiratory fitness walk tests (change values) Show forest plot | 3 | Std. Mean Difference (IV, Random, 95% CI) | Subtotals only | |
| Analysis 7.14 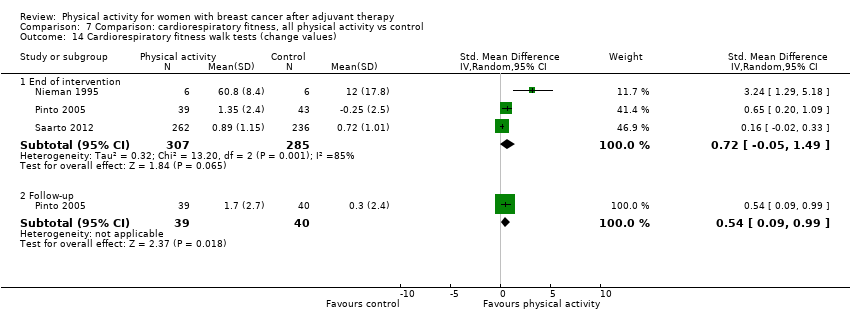 Comparison 7 Comparison: cardiorespiratory fitness, all physical activity vs control, Outcome 14 Cardiorespiratory fitness walk tests (change values). | ||||
| 14.1 End of intervention | 3 | 592 | Std. Mean Difference (IV, Random, 95% CI) | 0.72 [‐0.05, 1.49] |
| 14.2 Follow‐up | 1 | 79 | Std. Mean Difference (IV, Random, 95% CI) | 0.54 [0.09, 0.99] |
| 15 6‐Minute walk test (follow‐up and change values) Show forest plot | 5 | Mean Difference (IV, Random, 95% CI) | Subtotals only | |
| Analysis 7.15 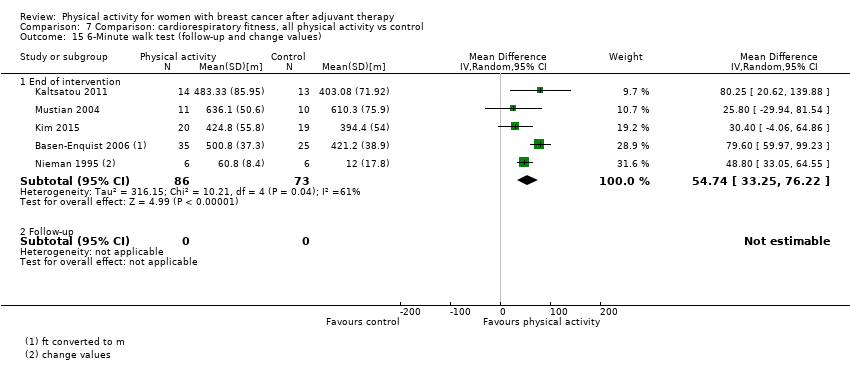 Comparison 7 Comparison: cardiorespiratory fitness, all physical activity vs control, Outcome 15 6‐Minute walk test (follow‐up and change values). | ||||
| 15.1 End of intervention | 5 | 159 | Mean Difference (IV, Random, 95% CI) | 54.74 [33.25, 76.22] |
| 15.2 Follow‐up | 0 | 0 | Mean Difference (IV, Random, 95% CI) | 0.0 [0.0, 0.0] |
| 16 12‐Minute walk test (follow‐up values) Show forest plot | 2 | Mean Difference (IV, Random, 95% CI) | Subtotals only | |
| Analysis 7.16 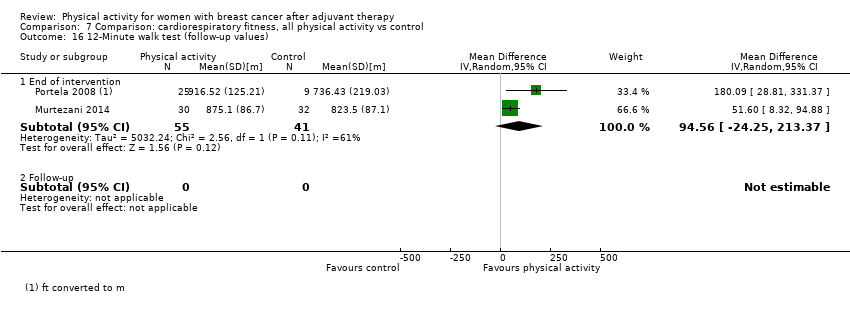 Comparison 7 Comparison: cardiorespiratory fitness, all physical activity vs control, Outcome 16 12‐Minute walk test (follow‐up values). | ||||
| 16.1 End of intervention | 2 | 96 | Mean Difference (IV, Random, 95% CI) | 94.56 [‐24.25, 213.37] |
| 16.2 Follow‐up | 0 | 0 | Mean Difference (IV, Random, 95% CI) | 0.0 [0.0, 0.0] |
| 17 2‐Kilometer walk test (follow‐up and change values) Show forest plot | 2 | Mean Difference (IV, Random, 95% CI) | Subtotals only | |
| Analysis 7.17  Comparison 7 Comparison: cardiorespiratory fitness, all physical activity vs control, Outcome 17 2‐Kilometer walk test (follow‐up and change values). | ||||
| 17.1 End of intervention | 2 | 526 | Mean Difference (IV, Random, 95% CI) | ‐0.11 [‐0.46, 0.25] |
| 17.2 Follow‐up | 0 | 0 | Mean Difference (IV, Random, 95% CI) | 0.0 [0.0, 0.0] |
| 18 Resting Heart Rate (follow‐up values) Show forest plot | 2 | Mean Difference (IV, Fixed, 95% CI) | Subtotals only | |
| Analysis 7.18 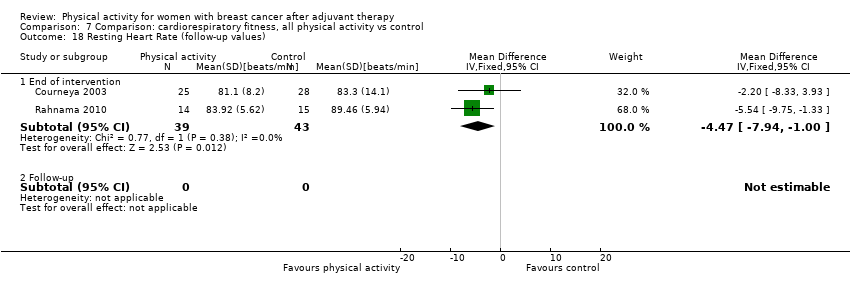 Comparison 7 Comparison: cardiorespiratory fitness, all physical activity vs control, Outcome 18 Resting Heart Rate (follow‐up values). | ||||
| 18.1 End of intervention | 2 | 82 | Mean Difference (IV, Fixed, 95% CI) | ‐4.47 [‐7.94, ‐1.00] |
| 18.2 Follow‐up | 0 | 0 | Mean Difference (IV, Fixed, 95% CI) | 0.0 [0.0, 0.0] |
| 19 Resting Heart Rate (change values) Show forest plot | 2 | Std. Mean Difference (IV, Random, 95% CI) | Subtotals only | |
| Analysis 7.19  Comparison 7 Comparison: cardiorespiratory fitness, all physical activity vs control, Outcome 19 Resting Heart Rate (change values). | ||||
| 19.1 End of intervention | 2 | 86 | Std. Mean Difference (IV, Random, 95% CI) | ‐1.05 [‐2.22, 0.11] |
| 19.2 Follow‐up | 0 | 0 | Std. Mean Difference (IV, Random, 95% CI) | 0.0 [0.0, 0.0] |
| 20 Resting Systolic Blood Pressure (follow‐up values) Show forest plot | 4 | Mean Difference (IV, Random, 95% CI) | Subtotals only | |
| Analysis 7.20  Comparison 7 Comparison: cardiorespiratory fitness, all physical activity vs control, Outcome 20 Resting Systolic Blood Pressure (follow‐up values). | ||||
| 20.1 End of intervention | 4 | 134 | Mean Difference (IV, Random, 95% CI) | ‐0.83 [‐3.72, 2.05] |
| 20.2 Follow‐up | 1 | 26 | Mean Difference (IV, Random, 95% CI) | 5.20 [‐5.35, 15.75] |
| 21 Resting Systolic Blood Pressure (change values) Show forest plot | 3 | Mean Difference (IV, Random, 95% CI) | Subtotals only | |
| Analysis 7.21 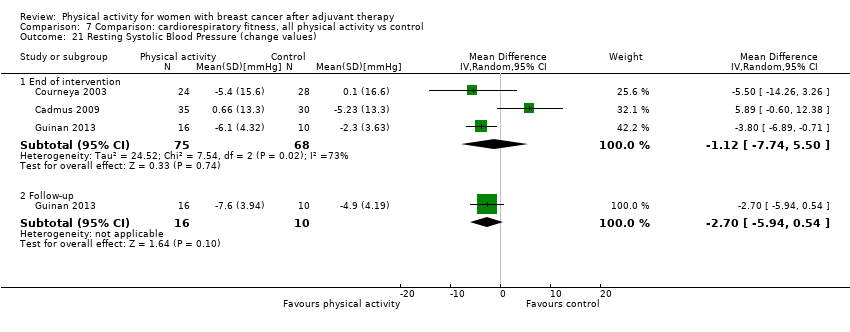 Comparison 7 Comparison: cardiorespiratory fitness, all physical activity vs control, Outcome 21 Resting Systolic Blood Pressure (change values). | ||||
| 21.1 End of intervention | 3 | 143 | Mean Difference (IV, Random, 95% CI) | ‐1.12 [‐7.74, 5.50] |
| 21.2 Follow‐up | 1 | 26 | Mean Difference (IV, Random, 95% CI) | ‐2.70 [‐5.94, 0.54] |
| 22 Resting Diastolic Blood Pressure (follow‐up values) Show forest plot | 3 | Mean Difference (IV, Random, 95% CI) | Subtotals only | |
| Analysis 7.22 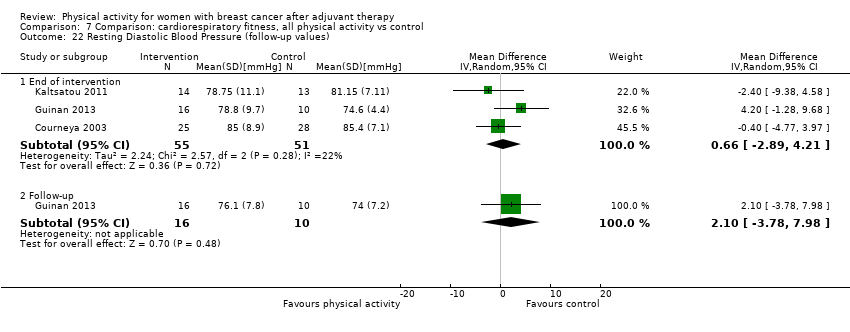 Comparison 7 Comparison: cardiorespiratory fitness, all physical activity vs control, Outcome 22 Resting Diastolic Blood Pressure (follow‐up values). | ||||
| 22.1 End of intervention | 3 | 106 | Mean Difference (IV, Random, 95% CI) | 0.66 [‐2.89, 4.21] |
| 22.2 Follow‐up | 1 | 26 | Mean Difference (IV, Random, 95% CI) | 2.10 [‐3.78, 7.98] |
| 23 Resting Diastolic Blood Pressure (change values) Show forest plot | 3 | 170 | Mean Difference (IV, Random, 95% CI) | ‐0.04 [‐1.82, 1.73] |
| Analysis 7.23 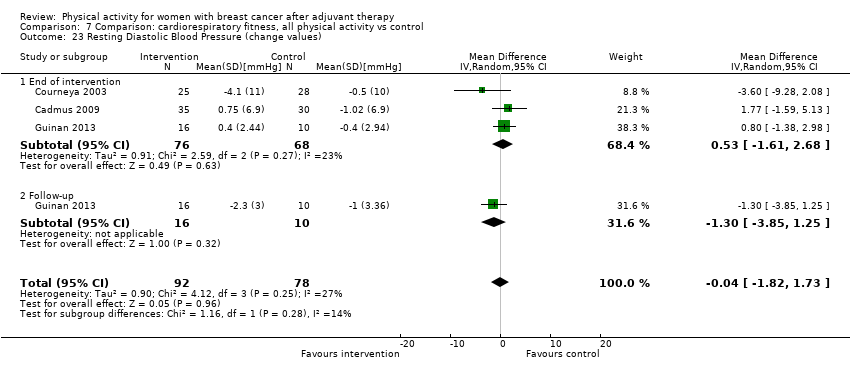 Comparison 7 Comparison: cardiorespiratory fitness, all physical activity vs control, Outcome 23 Resting Diastolic Blood Pressure (change values). | ||||
| 23.1 End of intervention | 3 | 144 | Mean Difference (IV, Random, 95% CI) | 0.53 [‐1.61, 2.68] |
| 23.2 Follow‐up | 1 | 26 | Mean Difference (IV, Random, 95% CI) | ‐1.30 [‐3.85, 1.25] |
| Outcome or subgroup title | No. of studies | No. of participants | Statistical method | Effect size |
| 1 Overall self‐reported physical activity (follow‐up values) Show forest plot | 17 | Std. Mean Difference (IV, Random, 95% CI) | Subtotals only | |
| Analysis 8.1  Comparison 8 Comparison: physical activity, all physical activity vs control, Outcome 1 Overall self‐reported physical activity (follow‐up values). | ||||
| 1.1 End of intervention | 17 | 2012 | Std. Mean Difference (IV, Random, 95% CI) | 0.52 [0.33, 0.71] |
| 1.2 Follow‐up | 4 | 683 | Std. Mean Difference (IV, Random, 95% CI) | 0.44 [0.17, 0.72] |
| 2 Overall self‐reported physical activity (change values) Show forest plot | 9 | Std. Mean Difference (IV, Random, 95% CI) | Subtotals only | |
| Analysis 8.2 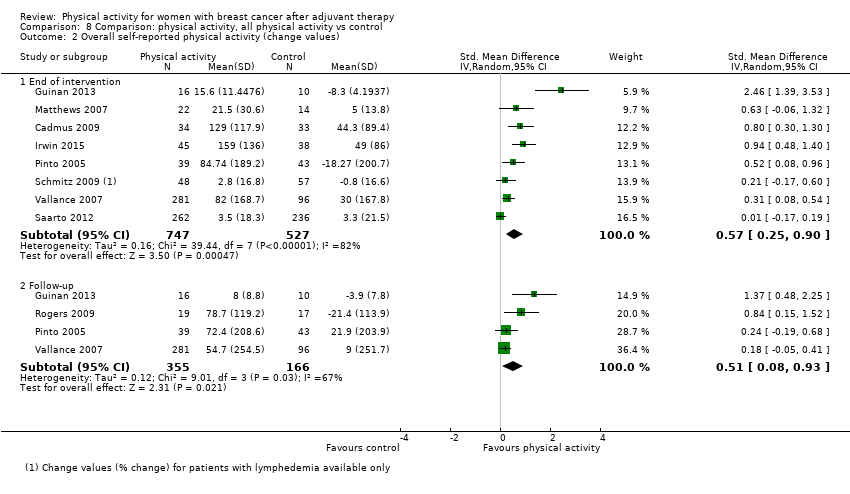 Comparison 8 Comparison: physical activity, all physical activity vs control, Outcome 2 Overall self‐reported physical activity (change values). | ||||
| 2.1 End of intervention | 8 | 1274 | Std. Mean Difference (IV, Random, 95% CI) | 0.57 [0.25, 0.90] |
| 2.2 Follow‐up | 4 | 521 | Std. Mean Difference (IV, Random, 95% CI) | 0.51 [0.08, 0.93] |
| 3 Self‐reported total physical activity (follow‐up values) Show forest plot | 9 | Std. Mean Difference (IV, Random, 95% CI) | Subtotals only | |
| Analysis 8.3  Comparison 8 Comparison: physical activity, all physical activity vs control, Outcome 3 Self‐reported total physical activity (follow‐up values). | ||||
| 3.1 End of intervention | 9 | 881 | Std. Mean Difference (IV, Random, 95% CI) | 0.57 [0.28, 0.86] |
| 3.2 Follow‐up | 1 | 26 | Std. Mean Difference (IV, Random, 95% CI) | 0.37 [‐0.43, 1.16] |
| 4 Self‐reported total physical activity (change values) Show forest plot | 5 | Std. Mean Difference (IV, Random, 95% CI) | Subtotals only | |
| Analysis 8.4  Comparison 8 Comparison: physical activity, all physical activity vs control, Outcome 4 Self‐reported total physical activity (change values). | ||||
| 4.1 End of intervention | 5 | 332 | Std. Mean Difference (IV, Random, 95% CI) | 0.80 [0.30, 1.31] |
| 4.2 Follow‐up | 2 | 108 | Std. Mean Difference (IV, Random, 95% CI) | 0.73 [‐0.36, 1.83] |
| 5 Self‐reported moderate physical activity (follow‐up values) Show forest plot | 4 | Std. Mean Difference (IV, Random, 95% CI) | Subtotals only | |
| Analysis 8.5 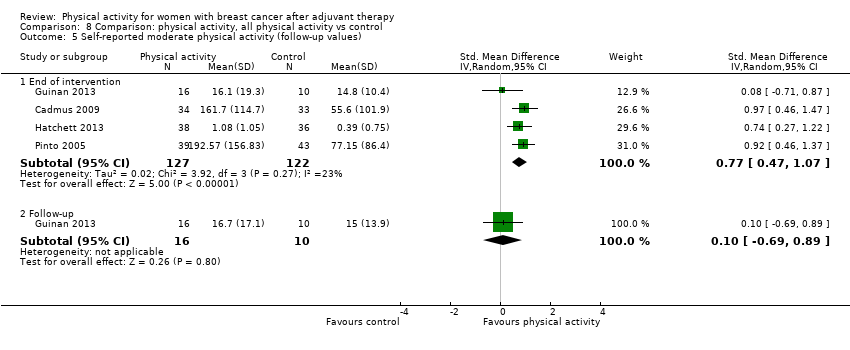 Comparison 8 Comparison: physical activity, all physical activity vs control, Outcome 5 Self‐reported moderate physical activity (follow‐up values). | ||||
| 5.1 End of intervention | 4 | 249 | Std. Mean Difference (IV, Random, 95% CI) | 0.77 [0.47, 1.07] |
| 5.2 Follow‐up | 1 | 26 | Std. Mean Difference (IV, Random, 95% CI) | 0.10 [‐0.69, 0.89] |
| 6 Self‐reported moderate physical activity (change values) Show forest plot | 2 | Std. Mean Difference (IV, Random, 95% CI) | Subtotals only | |
| Analysis 8.6  Comparison 8 Comparison: physical activity, all physical activity vs control, Outcome 6 Self‐reported moderate physical activity (change values). | ||||
| 6.1 End of intervention | 2 | 93 | Std. Mean Difference (IV, Random, 95% CI) | 1.19 [0.27, 2.11] |
| 6.2 Follow‐up | 1 | 26 | Std. Mean Difference (IV, Random, 95% CI) | 1.20 [0.33, 2.06] |
| 7 Self‐reported moderate‐vigorous physical activity (follow‐up values) Show forest plot | 6 | Std. Mean Difference (IV, Random, 95% CI) | Subtotals only | |
| Analysis 8.7  Comparison 8 Comparison: physical activity, all physical activity vs control, Outcome 7 Self‐reported moderate‐vigorous physical activity (follow‐up values). | ||||
| 7.1 End of intervention | 6 | 1025 | Std. Mean Difference (IV, Random, 95% CI) | 0.42 [0.12, 0.72] |
| 7.2 Follow‐up | 3 | 657 | Std. Mean Difference (IV, Random, 95% CI) | 0.46 [0.13, 0.78] |
| 8 Self‐reported moderate‐vigorous physical activity (change values) Show forest plot | 4 | Std. Mean Difference (IV, Random, 95% CI) | Subtotals only | |
| Analysis 8.8 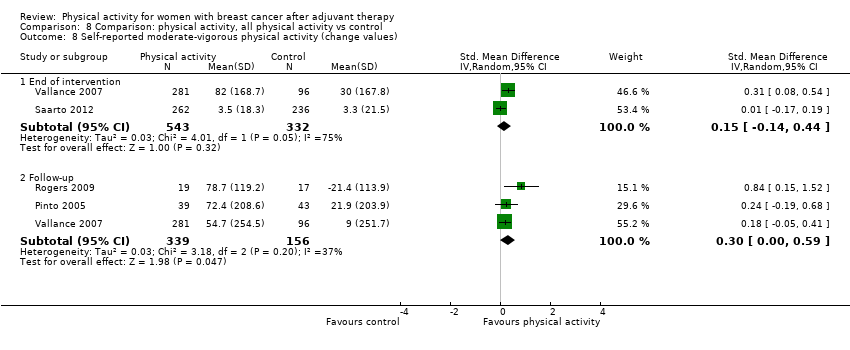 Comparison 8 Comparison: physical activity, all physical activity vs control, Outcome 8 Self‐reported moderate‐vigorous physical activity (change values). | ||||
| 8.1 End of intervention | 2 | 875 | Std. Mean Difference (IV, Random, 95% CI) | 0.15 [‐0.14, 0.44] |
| 8.2 Follow‐up | 3 | 495 | Std. Mean Difference (IV, Random, 95% CI) | 0.30 [0.00, 0.59] |
| 9 Self‐reported vigorous physical activity (follow‐up values) Show forest plot | 3 | Std. Mean Difference (IV, Random, 95% CI) | Subtotals only | |
| Analysis 8.9 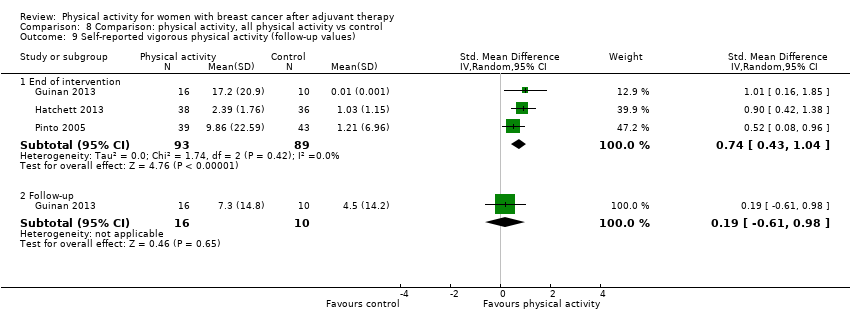 Comparison 8 Comparison: physical activity, all physical activity vs control, Outcome 9 Self‐reported vigorous physical activity (follow‐up values). | ||||
| 9.1 End of intervention | 3 | 182 | Std. Mean Difference (IV, Random, 95% CI) | 0.74 [0.43, 1.04] |
| 9.2 Follow‐up | 1 | 26 | Std. Mean Difference (IV, Random, 95% CI) | 0.19 [‐0.61, 0.98] |
| 10 Self‐reported vigorous physical activity (change values) Show forest plot | 2 | Std. Mean Difference (IV, Random, 95% CI) | Subtotals only | |
| Analysis 8.10  Comparison 8 Comparison: physical activity, all physical activity vs control, Outcome 10 Self‐reported vigorous physical activity (change values). | ||||
| 10.1 End of intervention | 2 | 108 | Std. Mean Difference (IV, Random, 95% CI) | 1.72 [0.78, 2.66] |
| 10.2 Follow‐up | 2 | 108 | Std. Mean Difference (IV, Random, 95% CI) | ‐0.13 [‐0.92, 0.66] |
| 11 Self‐reported walking (follow‐up values) Show forest plot | 2 | Std. Mean Difference (IV, Random, 95% CI) | Subtotals only | |
| Analysis 8.11  Comparison 8 Comparison: physical activity, all physical activity vs control, Outcome 11 Self‐reported walking (follow‐up values). | ||||
| 11.1 End of intervention | 2 | 374 | Std. Mean Difference (IV, Random, 95% CI) | 0.40 [‐0.06, 0.86] |
| 11.2 Follow‐up | 1 | 338 | Std. Mean Difference (IV, Random, 95% CI) | 0.09 [‐0.15, 0.34] |
| 12 Self‐reported walking (change values) Show forest plot | 2 | Std. Mean Difference (IV, Random, 95% CI) | Subtotals only | |
| Analysis 8.12  Comparison 8 Comparison: physical activity, all physical activity vs control, Outcome 12 Self‐reported walking (change values). | ||||
| 12.1 End of intervention | 2 | 374 | Std. Mean Difference (IV, Random, 95% CI) | 0.50 [0.23, 0.77] |
| 12.2 Follow‐up | 1 | 338 | Std. Mean Difference (IV, Random, 95% CI) | 0.23 [‐0.02, 0.47] |
| 13 7‐Day PAR self‐reported moderate physical activity (follow‐up values) Show forest plot | 2 | Mean Difference (IV, Fixed, 95% CI) | Subtotals only | |
| Analysis 8.13 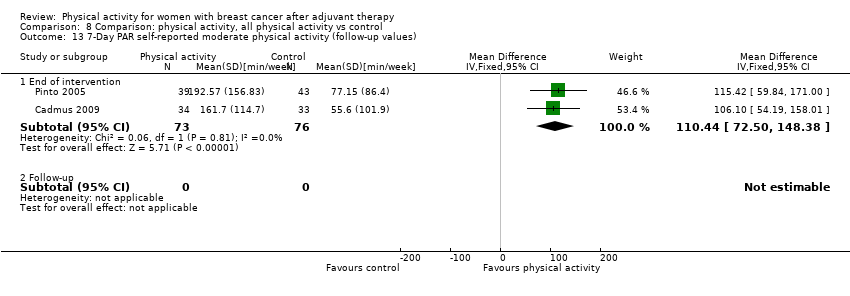 Comparison 8 Comparison: physical activity, all physical activity vs control, Outcome 13 7‐Day PAR self‐reported moderate physical activity (follow‐up values). | ||||
| 13.1 End of intervention | 2 | 149 | Mean Difference (IV, Fixed, 95% CI) | 110.44 [72.50, 148.38] |
| 13.2 Follow‐up | 0 | 0 | Mean Difference (IV, Fixed, 95% CI) | 0.0 [0.0, 0.0] |
| 14 7‐day PAR self‐reported moderate‐vigorous physical activity (follow‐up values) Show forest plot | 2 | Mean Difference (IV, Random, 95% CI) | Subtotals only | |
| Analysis 8.14 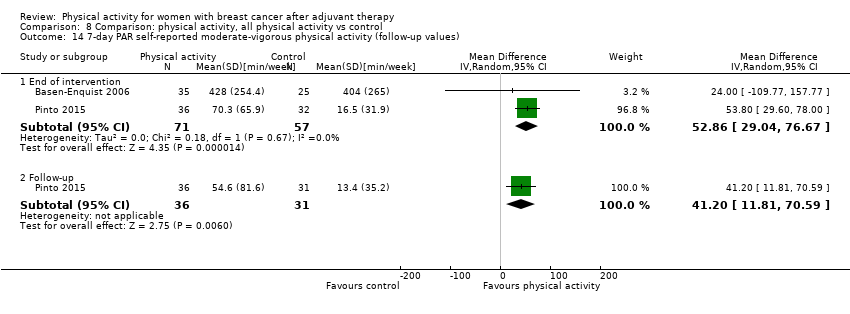 Comparison 8 Comparison: physical activity, all physical activity vs control, Outcome 14 7‐day PAR self‐reported moderate‐vigorous physical activity (follow‐up values). | ||||
| 14.1 End of intervention | 2 | 128 | Mean Difference (IV, Random, 95% CI) | 52.86 [29.04, 76.67] |
| 14.2 Follow‐up | 1 | 67 | Mean Difference (IV, Random, 95% CI) | 41.2 [11.81, 70.59] |
| 15 Godin LSI self‐reported moderate‐vigorous physical activity (follow‐up values) Show forest plot | 5 | Mean Difference (IV, Random, 95% CI) | Subtotals only | |
| Analysis 8.15 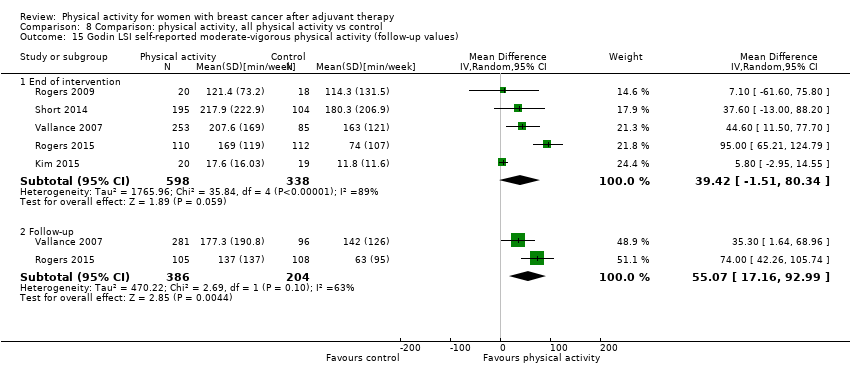 Comparison 8 Comparison: physical activity, all physical activity vs control, Outcome 15 Godin LSI self‐reported moderate‐vigorous physical activity (follow‐up values). | ||||
| 15.1 End of intervention | 5 | 936 | Mean Difference (IV, Random, 95% CI) | 39.42 [‐1.51, 80.34] |
| 15.2 Follow‐up | 2 | 590 | Mean Difference (IV, Random, 95% CI) | 55.07 [17.16, 92.99] |
| 16 Meeting recommended physical activity guidelines (follow‐up values) Show forest plot | 6 | Odds Ratio (M‐H, Random, 95% CI) | Subtotals only | |
| Analysis 8.16  Comparison 8 Comparison: physical activity, all physical activity vs control, Outcome 16 Meeting recommended physical activity guidelines (follow‐up values). | ||||
| 16.1 End of intervention | 6 | 819 | Odds Ratio (M‐H, Random, 95% CI) | 8.44 [2.41, 29.56] |
| 16.2 Follow‐up | 2 | 280 | Odds Ratio (M‐H, Random, 95% CI) | 3.11 [1.50, 6.46] |
| 17 Overall objective physical activity (follow‐up values) Show forest plot | 10 | Std. Mean Difference (IV, Random, 95% CI) | Subtotals only | |
| Analysis 8.17  Comparison 8 Comparison: physical activity, all physical activity vs control, Outcome 17 Overall objective physical activity (follow‐up values). | ||||
| 17.1 End of intervention | 10 | 1248 | Std. Mean Difference (IV, Random, 95% CI) | 0.43 [0.19, 0.66] |
| 17.2 Follow‐up | 3 | 305 | Std. Mean Difference (IV, Random, 95% CI) | 0.22 [‐0.21, 0.66] |
| 18 Overall objective physical activity (change values) Show forest plot | 6 | Std. Mean Difference (IV, Random, 95% CI) | Subtotals only | |
| Analysis 8.18 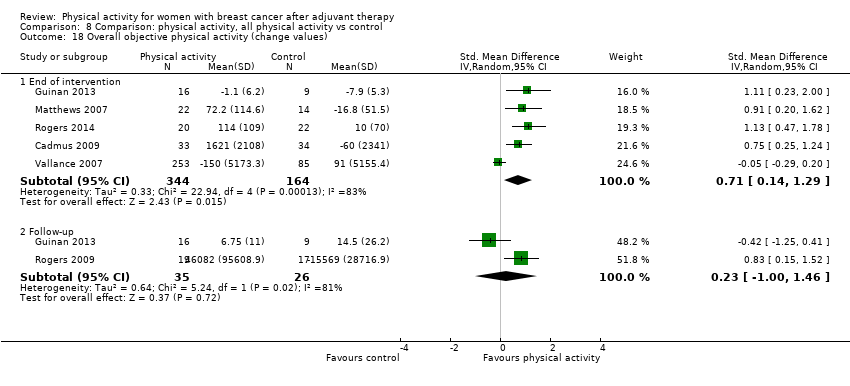 Comparison 8 Comparison: physical activity, all physical activity vs control, Outcome 18 Overall objective physical activity (change values). | ||||
| 18.1 End of intervention | 5 | 508 | Std. Mean Difference (IV, Random, 95% CI) | 0.71 [0.14, 1.29] |
| 18.2 Follow‐up | 2 | 61 | Std. Mean Difference (IV, Random, 95% CI) | 0.23 [1.00, 1.46] |
| 19 Objective moderate‐vigorous physical activity (follow‐up values) Show forest plot | 5 | Std. Mean Difference (IV, Random, 95% CI) | Subtotals only | |
| Analysis 8.19  Comparison 8 Comparison: physical activity, all physical activity vs control, Outcome 19 Objective moderate‐vigorous physical activity (follow‐up values). | ||||
| 19.1 End of intervention | 5 | 390 | Std. Mean Difference (IV, Random, 95% CI) | 1.49 [0.47, 2.51] |
| 19.2 Follow‐up | 2 | 280 | Std. Mean Difference (IV, Random, 95% CI) | 0.36 [‐0.08, 0.79] |
| 20 Objective moderate‐vigorous physical activity (change values) Show forest plot | 3 | Std. Mean Difference (IV, Random, 95% CI) | Subtotals only | |
| Analysis 8.20  Comparison 8 Comparison: physical activity, all physical activity vs control, Outcome 20 Objective moderate‐vigorous physical activity (change values). | ||||
| 20.1 End of intervention | 2 | 78 | Std. Mean Difference (IV, Random, 95% CI) | 0.92 [0.45, 1.40] |
| 20.2 Follow‐up | 1 | 36 | Std. Mean Difference (IV, Random, 95% CI) | 0.84 [0.15, 1.52] |
| 21 Objective vigorous physical activity (follow‐up values) Show forest plot | 2 | Std. Mean Difference (IV, Random, 95% CI) | Subtotals only | |
| Analysis 8.21  Comparison 8 Comparison: physical activity, all physical activity vs control, Outcome 21 Objective vigorous physical activity (follow‐up values). | ||||
| 21.1 End of intervention | 2 | 63 | Std. Mean Difference (IV, Random, 95% CI) | 0.46 [‐0.05, 0.97] |
| 21.2 Follow‐up | 1 | 25 | Std. Mean Difference (IV, Random, 95% CI) | ‐0.16 [‐0.97, 0.66] |
| 22 Accelerometer counts (follow‐up values) Show forest plot | 2 | Std. Mean Difference (IV, Random, 95% CI) | Subtotals only | |
| Analysis 8.22  Comparison 8 Comparison: physical activity, all physical activity vs control, Outcome 22 Accelerometer counts (follow‐up values). | ||||
| 22.1 End of intervention | 2 | 74 | Std. Mean Difference (IV, Random, 95% CI) | 0.90 [0.08, 1.72] |
| 22.2 Follow‐up | 0 | 0 | Std. Mean Difference (IV, Random, 95% CI) | 0.0 [0.0, 0.0] |
| 23 Pedometer/accelerometer steps/d (follow‐up values) Show forest plot | 5 | Std. Mean Difference (IV, Random, 95% CI) | Subtotals only | |
| Analysis 8.23 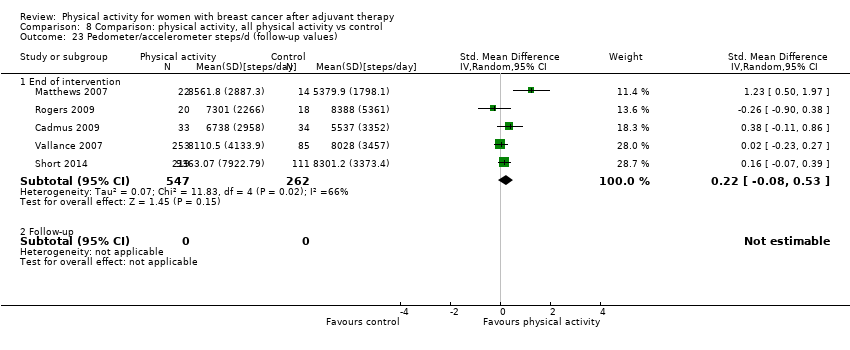 Comparison 8 Comparison: physical activity, all physical activity vs control, Outcome 23 Pedometer/accelerometer steps/d (follow‐up values). | ||||
| 23.1 End of intervention | 5 | 809 | Std. Mean Difference (IV, Random, 95% CI) | 0.22 [‐0.08, 0.53] |
| 23.2 Follow‐up | 0 | 0 | Std. Mean Difference (IV, Random, 95% CI) | 0.0 [0.0, 0.0] |
| 24 Pedometer/accelerometer steps/d (change values) Show forest plot | 3 | Std. Mean Difference (IV, Random, 95% CI) | Subtotals only | |
| Analysis 8.24  Comparison 8 Comparison: physical activity, all physical activity vs control, Outcome 24 Pedometer/accelerometer steps/d (change values). | ||||
| 24.1 End of intervention | 3 | 441 | Std. Mean Difference (IV, Random, 95% CI) | 0.45 [‐0.18, 1.09] |
| 24.2 Follow‐up | 0 | 0 | Std. Mean Difference (IV, Random, 95% CI) | 0.0 [0.0, 0.0] |
| 25 Overall sedentary behaviour (follow‐up values) Show forest plot | 4 | Std. Mean Difference (IV, Random, 95% CI) | Subtotals only | |
| Analysis 8.25 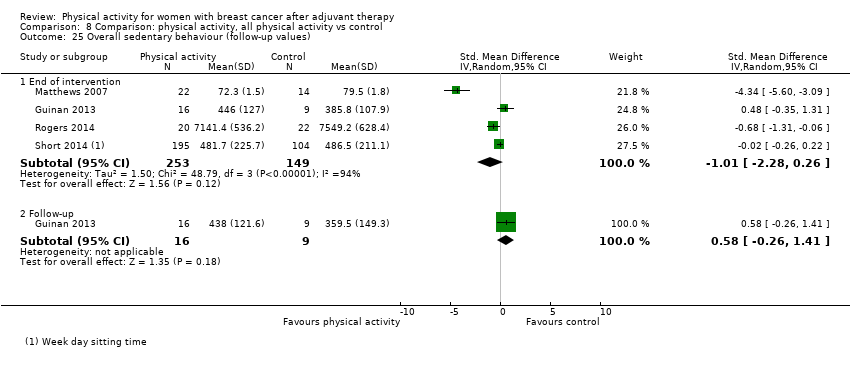 Comparison 8 Comparison: physical activity, all physical activity vs control, Outcome 25 Overall sedentary behaviour (follow‐up values). | ||||
| 25.1 End of intervention | 4 | 402 | Std. Mean Difference (IV, Random, 95% CI) | ‐1.01 [‐2.28, 0.26] |
| 25.2 Follow‐up | 1 | 25 | Std. Mean Difference (IV, Random, 95% CI) | 0.58 [‐0.26, 1.41] |
| 26 Objective sedentary behaviour (follow‐up values) Show forest plot | 3 | Std. Mean Difference (IV, Random, 95% CI) | Subtotals only | |
| Analysis 8.26 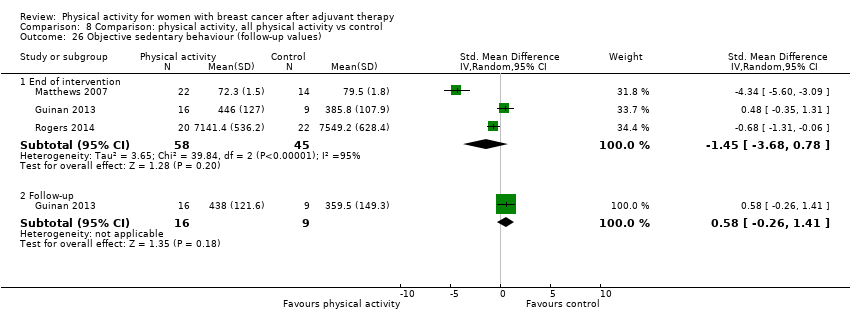 Comparison 8 Comparison: physical activity, all physical activity vs control, Outcome 26 Objective sedentary behaviour (follow‐up values). | ||||
| 26.1 End of intervention | 3 | 103 | Std. Mean Difference (IV, Random, 95% CI) | ‐1.45 [‐3.68, 0.78] |
| 26.2 Follow‐up | 1 | 25 | Std. Mean Difference (IV, Random, 95% CI) | 0.58 [‐0.26, 1.41] |
| 27 Objective sedentary behaviour (change values) Show forest plot | 3 | Std. Mean Difference (IV, Random, 95% CI) | Subtotals only | |
| Analysis 8.27 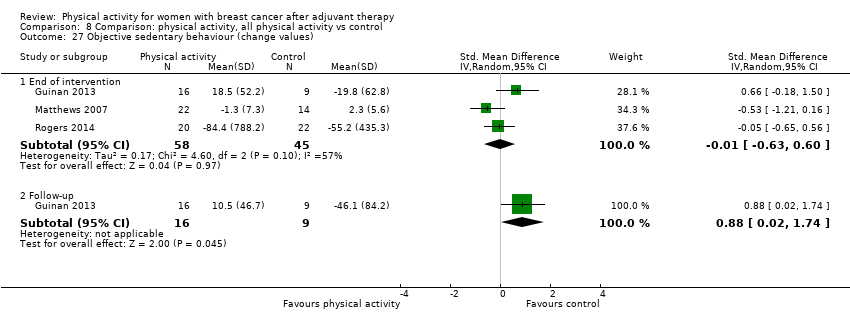 Comparison 8 Comparison: physical activity, all physical activity vs control, Outcome 27 Objective sedentary behaviour (change values). | ||||
| 27.1 End of intervention | 3 | 103 | Std. Mean Difference (IV, Random, 95% CI) | ‐0.01 [‐0.63, 0.60] |
| 27.2 Follow‐up | 1 | 25 | Std. Mean Difference (IV, Random, 95% CI) | 0.88 [0.02, 1.74] |
| Outcome or subgroup title | No. of studies | No. of participants | Statistical method | Effect size |
| 1 Mass (follow‐up values) Show forest plot | 16 | Mean Difference (IV, Fixed, 95% CI) | Subtotals only | |
| Analysis 9.1  Comparison 9 Comparison: anthropometric outcomes, all physical activity vs control, Outcome 1 Mass (follow‐up values). | ||||
| 1.1 End of intervention | 16 | 1210 | Mean Difference (IV, Fixed, 95% CI) | 0.00 [‐0.57, 0.58] |
| 1.2 Follow‐up | 1 | 49 | Mean Difference (IV, Fixed, 95% CI) | 5.02 [‐5.17, 15.21] |
| 2 Mass (change values) Show forest plot | 11 | Mean Difference (IV, Random, 95% CI) | Subtotals only | |
| Analysis 9.2 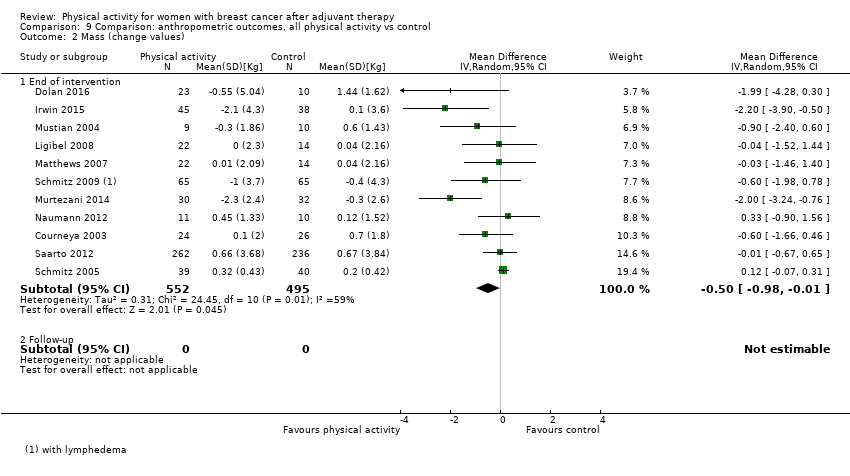 Comparison 9 Comparison: anthropometric outcomes, all physical activity vs control, Outcome 2 Mass (change values). | ||||
| 2.1 End of intervention | 11 | 1047 | Mean Difference (IV, Random, 95% CI) | ‐0.50 [‐0.98, ‐0.01] |
| 2.2 Follow‐up | 0 | 0 | Mean Difference (IV, Random, 95% CI) | 0.0 [0.0, 0.0] |
| 3 BMI (follow‐up values) Show forest plot | 17 | Mean Difference (IV, Fixed, 95% CI) | Subtotals only | |
| Analysis 9.3  Comparison 9 Comparison: anthropometric outcomes, all physical activity vs control, Outcome 3 BMI (follow‐up values). | ||||
| 3.1 End of intervention | 17 | 1481 | Mean Difference (IV, Fixed, 95% CI) | 0.01 [‐0.19, 0.22] |
| 3.2 Follow‐up | 0 | 0 | Mean Difference (IV, Fixed, 95% CI) | 0.0 [0.0, 0.0] |
| 4 BMI (change values) Show forest plot | 8 | Mean Difference (IV, Random, 95% CI) | Subtotals only | |
| Analysis 9.4 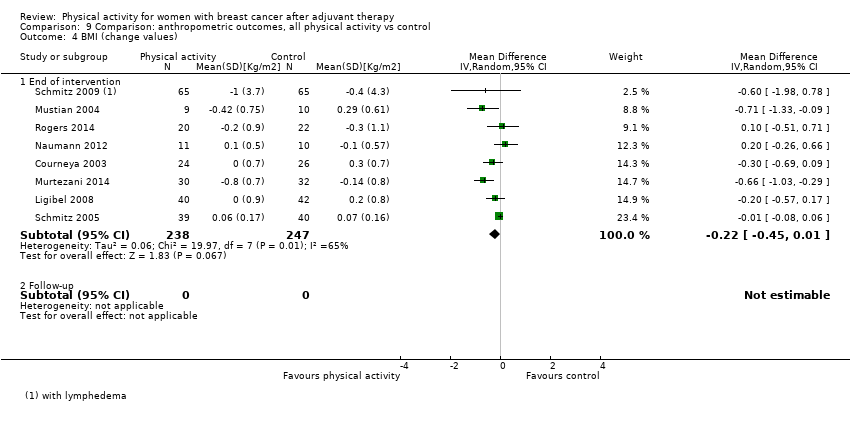 Comparison 9 Comparison: anthropometric outcomes, all physical activity vs control, Outcome 4 BMI (change values). | ||||
| 4.1 End of intervention | 8 | 485 | Mean Difference (IV, Random, 95% CI) | ‐0.22 [‐0.45, 0.01] |
| 4.2 Follow‐up | 0 | 0 | Mean Difference (IV, Random, 95% CI) | 0.0 [0.0, 0.0] |
| 5 Overall body fat (follow‐up values) Show forest plot | 18 | Std. Mean Difference (IV, Random, 95% CI) | Subtotals only | |
| Analysis 9.5  Comparison 9 Comparison: anthropometric outcomes, all physical activity vs control, Outcome 5 Overall body fat (follow‐up values). | ||||
| 5.1 End of intervention | 18 | 1162 | Std. Mean Difference (IV, Random, 95% CI) | ‐0.18 [‐0.34, ‐0.03] |
| 5.2 Follow‐up | 1 | 49 | Std. Mean Difference (IV, Random, 95% CI) | 0.08 [‐0.48, 0.64] |
| 6 Overall body fat (change values) Show forest plot | 9 | Std. Mean Difference (IV, Random, 95% CI) | Subtotals only | |
| Analysis 9.6 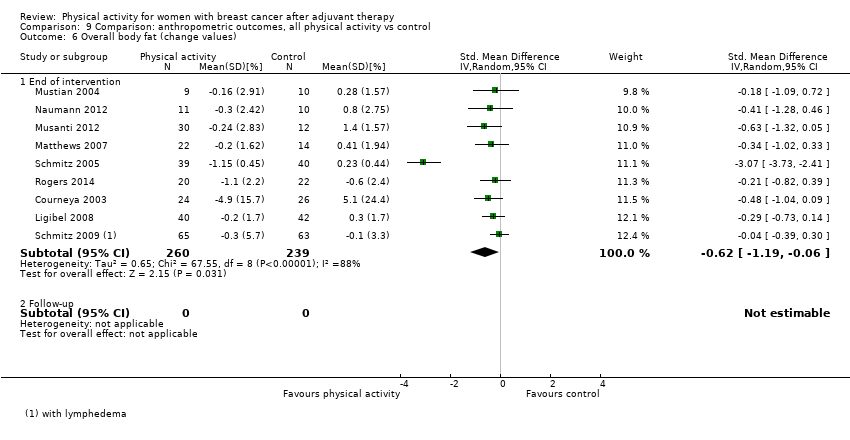 Comparison 9 Comparison: anthropometric outcomes, all physical activity vs control, Outcome 6 Overall body fat (change values). | ||||
| 6.1 End of intervention | 9 | 499 | Std. Mean Difference (IV, Random, 95% CI) | ‐0.62 [‐1.19, ‐0.06] |
| 6.2 Follow‐up | 0 | 0 | Std. Mean Difference (IV, Random, 95% CI) | 0.0 [0.0, 0.0] |
| 7 Percentage body fat ‐ DEXA (follow‐up values) Show forest plot | 6 | Mean Difference (IV, Random, 95% CI) | Subtotals only | |
| Analysis 9.7  Comparison 9 Comparison: anthropometric outcomes, all physical activity vs control, Outcome 7 Percentage body fat ‐ DEXA (follow‐up values). | ||||
| 7.1 End of intervention | 6 | 580 | Mean Difference (IV, Random, 95% CI) | ‐0.66 [‐1.70, 0.37] |
| 7.2 Follow‐up | 1 | 49 | Mean Difference (IV, Random, 95% CI) | 0.52 [‐3.18, 4.22] |
| 8 Percentage body fat ‐ DEXA (change values) Show forest plot | 3 | Mean Difference (IV, Random, 95% CI) | Subtotals only | |
| Analysis 9.8  Comparison 9 Comparison: anthropometric outcomes, all physical activity vs control, Outcome 8 Percentage body fat ‐ DEXA (change values). | ||||
| 8.1 End of intervention | 3 | 228 | Mean Difference (IV, Random, 95% CI) | ‐1.32 [‐1.66, ‐0.99] |
| 8.2 Follow‐up | 0 | 0 | Mean Difference (IV, Random, 95% CI) | 0.0 [0.0, 0.0] |
| 9 Percentage body fat ‐ BIA (follow‐up values) Show forest plot | 7 | Mean Difference (IV, Fixed, 95% CI) | Subtotals only | |
| Analysis 9.9 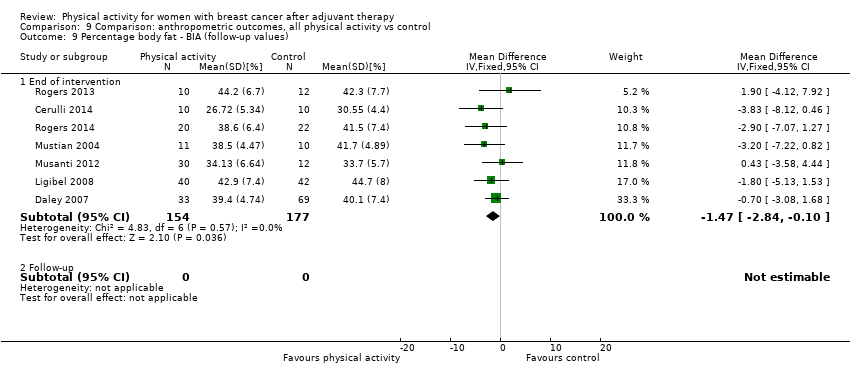 Comparison 9 Comparison: anthropometric outcomes, all physical activity vs control, Outcome 9 Percentage body fat ‐ BIA (follow‐up values). | ||||
| 9.1 End of intervention | 7 | 331 | Mean Difference (IV, Fixed, 95% CI) | ‐1.47 [‐2.84, ‐0.10] |
| 9.2 Follow‐up | 0 | 0 | Mean Difference (IV, Fixed, 95% CI) | 0.0 [0.0, 0.0] |
| 10 Percentage body fat ‐ BIA (change values) Show forest plot | 4 | Mean Difference (IV, Fixed, 95% CI) | Subtotals only | |
| Analysis 9.10  Comparison 9 Comparison: anthropometric outcomes, all physical activity vs control, Outcome 10 Percentage body fat ‐ BIA (change values). | ||||
| 10.1 End of intervention | 4 | 185 | Mean Difference (IV, Fixed, 95% CI) | ‐0.70 [‐1.26, ‐0.13] |
| 10.2 Follow‐up | 0 | 0 | Mean Difference (IV, Fixed, 95% CI) | 0.0 [0.0, 0.0] |
| 11 Percentage body fat ‐ SKF (follow‐up values) Show forest plot | 3 | Mean Difference (IV, Random, 95% CI) | Subtotals only | |
| Analysis 9.11 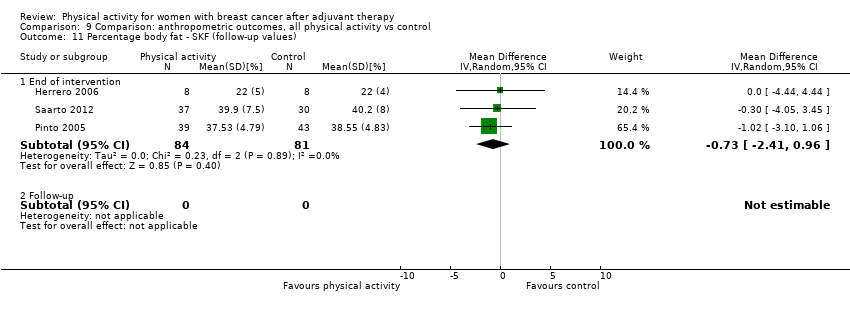 Comparison 9 Comparison: anthropometric outcomes, all physical activity vs control, Outcome 11 Percentage body fat ‐ SKF (follow‐up values). | ||||
| 11.1 End of intervention | 3 | 165 | Mean Difference (IV, Random, 95% CI) | ‐0.73 [‐2.41, 0.96] |
| 11.2 Follow‐up | 0 | 0 | Mean Difference (IV, Random, 95% CI) | 0.0 [0.0, 0.0] |
| 12 Fat mass (follow‐up values) Show forest plot | 5 | Mean Difference (IV, Fixed, 95% CI) | Subtotals only | |
| Analysis 9.12  Comparison 9 Comparison: anthropometric outcomes, all physical activity vs control, Outcome 12 Fat mass (follow‐up values). | ||||
| 12.1 End of intervention | 5 | 460 | Mean Difference (IV, Fixed, 95% CI) | ‐0.70 [‐1.40, ‐0.00] |
| 12.2 Follow‐up | 0 | 0 | Mean Difference (IV, Fixed, 95% CI) | 0.0 [0.0, 0.0] |
| 13 Fat mass (change values) Show forest plot | 4 | Mean Difference (IV, Random, 95% CI) | Subtotals only | |
| Analysis 9.13  Comparison 9 Comparison: anthropometric outcomes, all physical activity vs control, Outcome 13 Fat mass (change values). | ||||
| 13.1 End of intervention | 4 | 768 | Mean Difference (IV, Random, 95% CI) | ‐0.46 [‐1.08, 0.15] |
| 13.2 Follow‐up | 0 | 0 | Mean Difference (IV, Random, 95% CI) | 0.0 [0.0, 0.0] |
| 14 Fat mass ‐ DEXA (follow‐up values) Show forest plot | 3 | Mean Difference (IV, Fixed, 95% CI) | Subtotals only | |
| Analysis 9.14 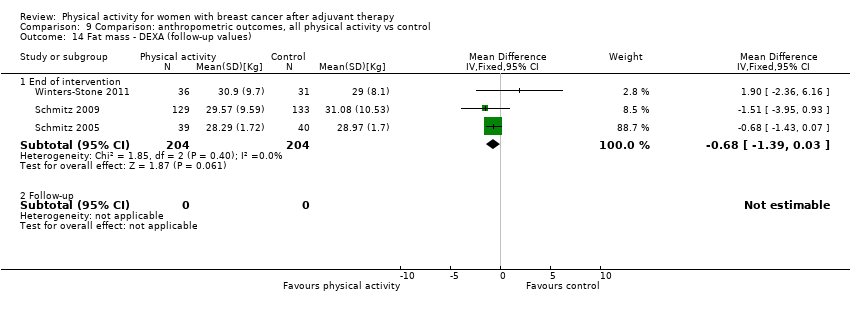 Comparison 9 Comparison: anthropometric outcomes, all physical activity vs control, Outcome 14 Fat mass ‐ DEXA (follow‐up values). | ||||
| 14.1 End of intervention | 3 | 408 | Mean Difference (IV, Fixed, 95% CI) | ‐0.68 [‐1.39, 0.03] |
| 14.2 Follow‐up | 0 | 0 | Mean Difference (IV, Fixed, 95% CI) | 0.0 [0.0, 0.0] |
| 15 Fat mass ‐ DEXA (change values) Show forest plot | 2 | Mean Difference (IV, Random, 95% CI) | Subtotals only | |
| Analysis 9.15  Comparison 9 Comparison: anthropometric outcomes, all physical activity vs control, Outcome 15 Fat mass ‐ DEXA (change values). | ||||
| 15.1 End of intervention | 2 | 207 | Mean Difference (IV, Random, 95% CI) | ‐0.74 [‐0.93, ‐0.56] |
| 15.2 Follow‐up | 0 | 0 | Mean Difference (IV, Random, 95% CI) | 0.0 [0.0, 0.0] |
| 16 Lean mass (follow‐up values) Show forest plot | 8 | Std. Mean Difference (IV, Fixed, 95% CI) | Subtotals only | |
| Analysis 9.16  Comparison 9 Comparison: anthropometric outcomes, all physical activity vs control, Outcome 16 Lean mass (follow‐up values). | ||||
| 16.1 End of intervention | 8 | 612 | Std. Mean Difference (IV, Fixed, 95% CI) | 0.05 [‐0.11, 0.21] |
| 16.2 Follow‐up | 1 | 49 | Std. Mean Difference (IV, Fixed, 95% CI) | 0.33 [‐0.24, 0.89] |
| 17 Lean mass (change values) Show forest plot | 5 | Std. Mean Difference (IV, Random, 95% CI) | Subtotals only | |
| Analysis 9.17 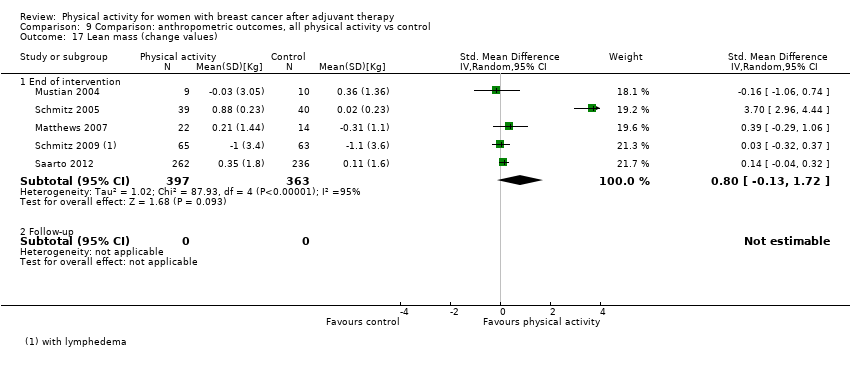 Comparison 9 Comparison: anthropometric outcomes, all physical activity vs control, Outcome 17 Lean mass (change values). | ||||
| 17.1 End of intervention | 5 | 760 | Std. Mean Difference (IV, Random, 95% CI) | 0.80 [‐0.13, 1.72] |
| 17.2 Follow‐up | 0 | 0 | Std. Mean Difference (IV, Random, 95% CI) | 0.0 [0.0, 0.0] |
| 18 Lean mass ‐ DEXA (follow‐up values) Show forest plot | 5 | Mean Difference (IV, Fixed, 95% CI) | Subtotals only | |
| Analysis 9.18 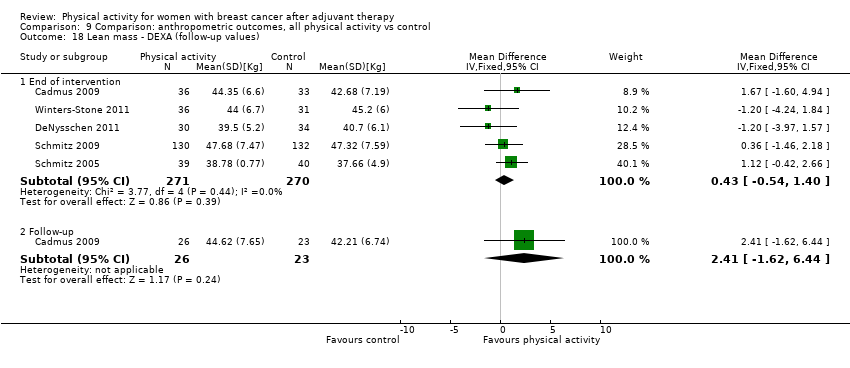 Comparison 9 Comparison: anthropometric outcomes, all physical activity vs control, Outcome 18 Lean mass ‐ DEXA (follow‐up values). | ||||
| 18.1 End of intervention | 5 | 541 | Mean Difference (IV, Fixed, 95% CI) | 0.43 [‐0.54, 1.40] |
| 18.2 Follow‐up | 1 | 49 | Mean Difference (IV, Fixed, 95% CI) | 2.41 [‐1.62, 6.44] |
| 19 Lean mass ‐ DEXA (change values) Show forest plot | 2 | Mean Difference (IV, Random, 95% CI) | Subtotals only | |
| Analysis 9.19  Comparison 9 Comparison: anthropometric outcomes, all physical activity vs control, Outcome 19 Lean mass ‐ DEXA (change values). | ||||
| 19.1 End of intervention | 2 | 207 | Mean Difference (IV, Random, 95% CI) | 0.73 [0.17, 1.29] |
| 19.2 Follow‐up | 0 | 0 | Mean Difference (IV, Random, 95% CI) | 0.0 [0.0, 0.0] |
| 20 Waist‐to‐hip ratio (follow‐up values) Show forest plot | 5 | Mean Difference (IV, Random, 95% CI) | Subtotals only | |
| Analysis 9.20 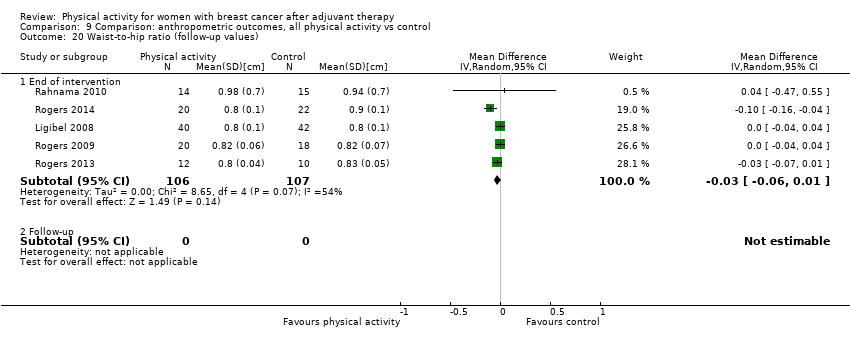 Comparison 9 Comparison: anthropometric outcomes, all physical activity vs control, Outcome 20 Waist‐to‐hip ratio (follow‐up values). | ||||
| 20.1 End of intervention | 5 | 213 | Mean Difference (IV, Random, 95% CI) | ‐0.03 [‐0.06, 0.01] |
| 20.2 Follow‐up | 0 | 0 | Mean Difference (IV, Random, 95% CI) | 0.0 [0.0, 0.0] |
| 21 Waist‐to‐hip ratio (change values) Show forest plot | 3 | Mean Difference (IV, Fixed, 95% CI) | Subtotals only | |
| Analysis 9.21  Comparison 9 Comparison: anthropometric outcomes, all physical activity vs control, Outcome 21 Waist‐to‐hip ratio (change values). | ||||
| 21.1 End of intervention | 2 | 124 | Mean Difference (IV, Fixed, 95% CI) | 0.0 [‐0.01, 0.01] |
| 21.2 Follow‐up | 1 | 36 | Mean Difference (IV, Fixed, 95% CI) | 0.04 [‐0.14, 0.22] |
| 22 Waist circumference (follow‐up values) Show forest plot | 6 | Mean Difference (IV, Fixed, 95% CI) | Subtotals only | |
| Analysis 9.22  Comparison 9 Comparison: anthropometric outcomes, all physical activity vs control, Outcome 22 Waist circumference (follow‐up values). | ||||
| 22.1 End of intervention | 6 | 330 | Mean Difference (IV, Fixed, 95% CI) | ‐0.50 [‐3.18, 2.18] |
| 22.2 Follow‐up | 1 | 26 | Mean Difference (IV, Fixed, 95% CI) | 1.40 [‐8.29, 11.09] |
| 23 Waist circumference (change values) Show forest plot | 5 | Mean Difference (IV, Random, 95% CI) | Subtotals only | |
| Analysis 9.23  Comparison 9 Comparison: anthropometric outcomes, all physical activity vs control, Outcome 23 Waist circumference (change values). | ||||
| 23.1 End of intervention | 5 | 285 | Mean Difference (IV, Random, 95% CI) | ‐1.71 [‐2.56, ‐0.86] |
| 23.2 Follow‐up | 1 | 26 | Mean Difference (IV, Random, 95% CI) | ‐0.90 [‐2.61, 0.81] |
| 24 Hip circumference (follow‐up values) Show forest plot | 4 | Mean Difference (IV, Fixed, 95% CI) | Subtotals only | |
| Analysis 9.24  Comparison 9 Comparison: anthropometric outcomes, all physical activity vs control, Outcome 24 Hip circumference (follow‐up values). | ||||
| 24.1 End of intervention | 4 | 249 | Mean Difference (IV, Fixed, 95% CI) | ‐0.97 [‐3.96, 2.01] |
| 24.2 Follow‐up | 0 | 0 | Mean Difference (IV, Fixed, 95% CI) | 0.0 [0.0, 0.0] |
| 25 Hip circumference (change values) Show forest plot | 2 | Mean Difference (IV, Random, 95% CI) | Subtotals only | |
| Analysis 9.25  Comparison 9 Comparison: anthropometric outcomes, all physical activity vs control, Outcome 25 Hip circumference (change values). | ||||
| 25.1 End of intervention | 2 | 115 | Mean Difference (IV, Random, 95% CI) | ‐2.37 [‐3.31, ‐1.44] |
| 25.2 Follow‐up | 0 | 0 | Mean Difference (IV, Random, 95% CI) | 0.0 [0.0, 0.0] |
| Outcome or subgroup title | No. of studies | No. of participants | Statistical method | Effect size |
| 1 Lower body strength (follow‐up values) Show forest plot | 10 | Std. Mean Difference (IV, Random, 95% CI) | Subtotals only | |
| Analysis 10.1 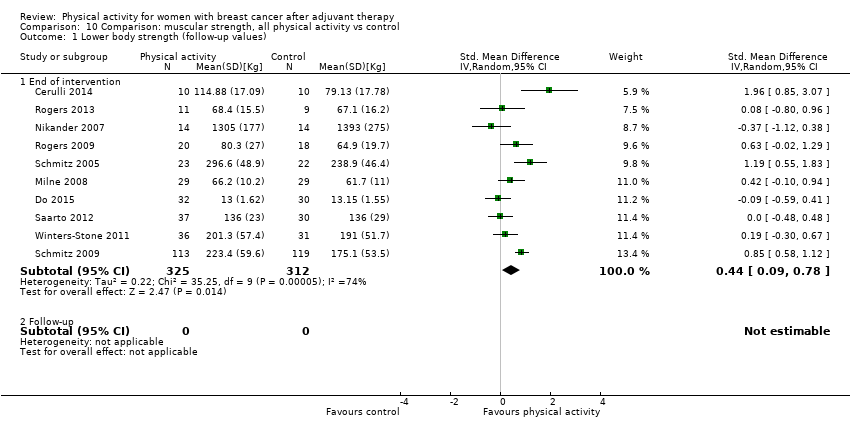 Comparison 10 Comparison: muscular strength, all physical activity vs control, Outcome 1 Lower body strength (follow‐up values). | ||||
| 1.1 End of intervention | 10 | 637 | Std. Mean Difference (IV, Random, 95% CI) | 0.44 [0.09, 0.78] |
| 1.2 Follow‐up | 0 | 0 | Std. Mean Difference (IV, Random, 95% CI) | 0.0 [0.0, 0.0] |
| 2 Lower body strength (change values) Show forest plot | 9 | Std. Mean Difference (IV, Random, 95% CI) | Subtotals only | |
| Analysis 10.2 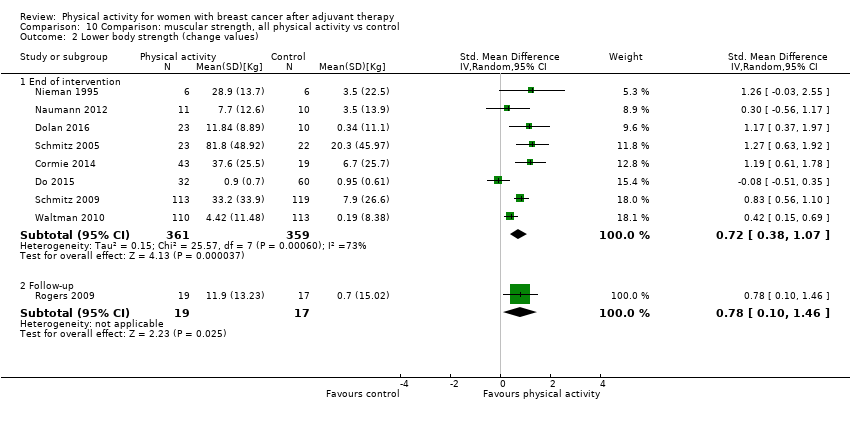 Comparison 10 Comparison: muscular strength, all physical activity vs control, Outcome 2 Lower body strength (change values). | ||||
| 2.1 End of intervention | 8 | 720 | Std. Mean Difference (IV, Random, 95% CI) | 0.72 [0.38, 1.07] |
| 2.2 Follow‐up | 1 | 36 | Std. Mean Difference (IV, Random, 95% CI) | 0.78 [0.10, 1.46] |
| 3 Leg press (follow‐up values) Show forest plot | 5 | Std. Mean Difference (IV, Random, 95% CI) | Subtotals only | |
| Analysis 10.3  Comparison 10 Comparison: muscular strength, all physical activity vs control, Outcome 3 Leg press (follow‐up values). | ||||
| 3.1 End of intervention | 5 | 422 | Std. Mean Difference (IV, Random, 95% CI) | 0.79 [0.35, 1.22] |
| 3.2 Follow‐up | 0 | 0 | Std. Mean Difference (IV, Random, 95% CI) | 0.0 [0.0, 0.0] |
| 4 Leg press (change values) Show forest plot | 5 | Std. Mean Difference (IV, Random, 95% CI) | Subtotals only | |
| Analysis 10.4  Comparison 10 Comparison: muscular strength, all physical activity vs control, Outcome 4 Leg press (change values). | ||||
| 4.1 End of intervention | 5 | 393 | Std. Mean Difference (IV, Random, 95% CI) | 0.94 [0.68, 1.20] |
| 4.2 Follow‐up | 0 | 0 | Std. Mean Difference (IV, Random, 95% CI) | 0.0 [0.0, 0.0] |
| 5 Back & leg strength (follow‐up values) Show forest plot | 2 | Mean Difference (IV, Fixed, 95% CI) | Subtotals only | |
| Analysis 10.5  Comparison 10 Comparison: muscular strength, all physical activity vs control, Outcome 5 Back & leg strength (follow‐up values). | ||||
| 5.1 End of intervention | 2 | 58 | Mean Difference (IV, Fixed, 95% CI) | 7.90 [‐2.31, 18.11] |
| 5.2 Follow‐up | 0 | 0 | Mean Difference (IV, Fixed, 95% CI) | 0.0 [0.0, 0.0] |
| 6 Leg extension (follow‐up values) Show forest plot | 4 | Std. Mean Difference (IV, Random, 95% CI) | Subtotals only | |
| Analysis 10.6  Comparison 10 Comparison: muscular strength, all physical activity vs control, Outcome 6 Leg extension (follow‐up values). | ||||
| 6.1 End of intervention | 4 | 177 | Std. Mean Difference (IV, Random, 95% CI) | ‐0.01 [‐0.34, 0.32] |
| 6.2 Follow‐up | 0 | 0 | Std. Mean Difference (IV, Random, 95% CI) | 0.0 [0.0, 0.0] |
| 7 Leg extension (change values) Show forest plot | 4 | Std. Mean Difference (IV, Random, 95% CI) | Subtotals only | |
| Analysis 10.7  Comparison 10 Comparison: muscular strength, all physical activity vs control, Outcome 7 Leg extension (change values). | ||||
| 7.1 End of intervention | 4 | 389 | Std. Mean Difference (IV, Random, 95% CI) | 0.57 [0.03, 1.12] |
| 7.2 Follow‐up | 0 | 0 | Std. Mean Difference (IV, Random, 95% CI) | 0.0 [0.0, 0.0] |
| 8 Hip extension (follow‐up values) Show forest plot | 2 | Std. Mean Difference (IV, Random, 95% CI) | Subtotals only | |
| Analysis 10.8  Comparison 10 Comparison: muscular strength, all physical activity vs control, Outcome 8 Hip extension (follow‐up values). | ||||
| 8.1 End of intervention | 2 | 285 | Std. Mean Difference (IV, Random, 95% CI) | 0.14 [‐0.45, 0.72] |
| 8.2 Follow‐up | 0 | 0 | Std. Mean Difference (IV, Random, 95% CI) | 0.0 [0.0, 0.0] |
| 9 Hip flexion (follow‐up values) Show forest plot | 2 | Std. Mean Difference (IV, Random, 95% CI) | Subtotals only | |
| Analysis 10.9 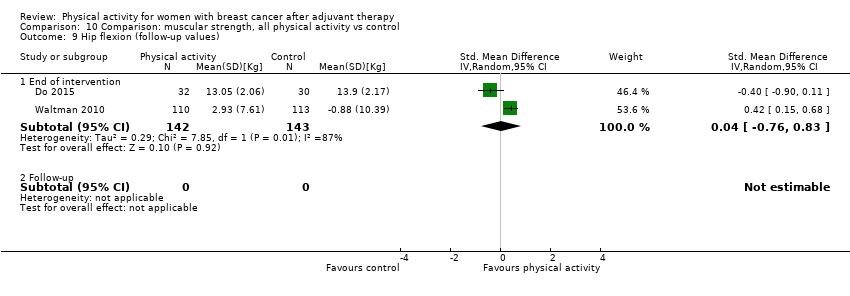 Comparison 10 Comparison: muscular strength, all physical activity vs control, Outcome 9 Hip flexion (follow‐up values). | ||||
| 9.1 End of intervention | 2 | 285 | Std. Mean Difference (IV, Random, 95% CI) | 0.04 [‐0.76, 0.83] |
| 9.2 Follow‐up | 0 | 0 | Std. Mean Difference (IV, Random, 95% CI) | 0.0 [0.0, 0.0] |
| 10 Leg flexion (follow‐up values) Show forest plot | 2 | Std. Mean Difference (IV, Random, 95% CI) | Subtotals only | |
| Analysis 10.10  Comparison 10 Comparison: muscular strength, all physical activity vs control, Outcome 10 Leg flexion (follow‐up values). | ||||
| 10.1 End of intervention | 2 | 243 | Std. Mean Difference (IV, Random, 95% CI) | 0.86 [‐0.05, 1.76] |
| 10.2 Follow‐up | 0 | 0 | Std. Mean Difference (IV, Random, 95% CI) | 0.0 [0.0, 0.0] |
| 11 Upper body strength (follow‐up values) Show forest plot | 13 | Std. Mean Difference (IV, Random, 95% CI) | Subtotals only | |
| Analysis 10.11  Comparison 10 Comparison: muscular strength, all physical activity vs control, Outcome 11 Upper body strength (follow‐up values). | ||||
| 11.1 End of intervention | 13 | 768 | Std. Mean Difference (IV, Random, 95% CI) | 0.42 [0.08, 0.76] |
| 11.2 Follow‐up | 0 | 0 | Std. Mean Difference (IV, Random, 95% CI) | 0.0 [0.0, 0.0] |
| 12 Upper body strength (change values) Show forest plot | 9 | Std. Mean Difference (IV, Random, 95% CI) | Subtotals only | |
| Analysis 10.12  Comparison 10 Comparison: muscular strength, all physical activity vs control, Outcome 12 Upper body strength (change values). | ||||
| 12.1 End of intervention | 8 | 832 | Std. Mean Difference (IV, Random, 95% CI) | 0.72 [0.30, 1.14] |
| 12.2 Follow‐up | 1 | 36 | Std. Mean Difference (IV, Random, 95% CI) | 0.76 [0.08, 1.44] |
| 13 Chest press (follow‐up values) Show forest plot | 5 | Std. Mean Difference (IV, Random, 95% CI) | Subtotals only | |
| Analysis 10.13  Comparison 10 Comparison: muscular strength, all physical activity vs control, Outcome 13 Chest press (follow‐up values). | ||||
| 13.1 End of intervention | 5 | 444 | Std. Mean Difference (IV, Random, 95% CI) | 0.51 [‐0.15, 1.17] |
| 13.2 Follow‐up | 0 | 0 | Std. Mean Difference (IV, Random, 95% CI) | 0.0 [0.0, 0.0] |
| 14 Chest press (change values) Show forest plot | 4 | Std. Mean Difference (IV, Random, 95% CI) | Subtotals only | |
| Analysis 10.14  Comparison 10 Comparison: muscular strength, all physical activity vs control, Outcome 14 Chest press (change values). | ||||
| 14.1 End of intervention | 4 | 381 | Std. Mean Difference (IV, Random, 95% CI) | 1.13 [0.46, 1.80] |
| 14.2 Follow‐up | 0 | 0 | Std. Mean Difference (IV, Random, 95% CI) | 0.0 [0.0, 0.0] |
| 15 Grip strength (follow‐up) Show forest plot | 7 | Mean Difference (IV, Random, 95% CI) | Subtotals only | |
| Analysis 10.15 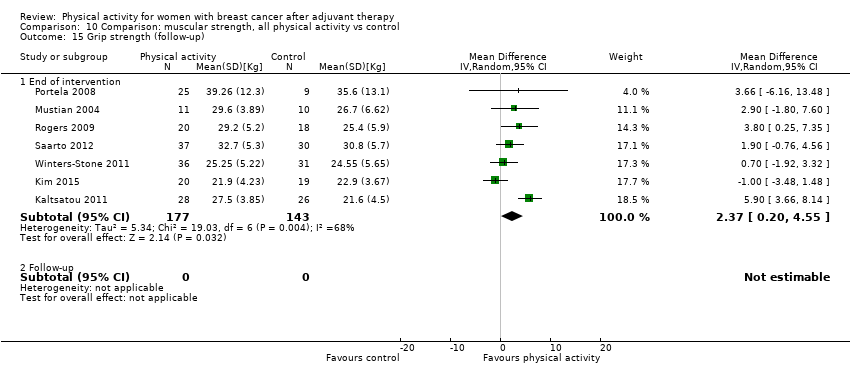 Comparison 10 Comparison: muscular strength, all physical activity vs control, Outcome 15 Grip strength (follow‐up). | ||||
| 15.1 End of intervention | 7 | 320 | Mean Difference (IV, Random, 95% CI) | 2.37 [0.20, 4.55] |
| 15.2 Follow‐up | 0 | 0 | Mean Difference (IV, Random, 95% CI) | 0.0 [0.0, 0.0] |
| 16 Grip strength (change values) Show forest plot | 3 | Std. Mean Difference (IV, Random, 95% CI) | Subtotals only | |
| Analysis 10.16  Comparison 10 Comparison: muscular strength, all physical activity vs control, Outcome 16 Grip strength (change values). | ||||
| 16.1 End of intervention | 2 | 145 | Std. Mean Difference (IV, Random, 95% CI) | 0.24 [‐0.09, 0.58] |
| 16.2 Follow‐up | 1 | 36 | Std. Mean Difference (IV, Random, 95% CI) | 0.76 [0.08, 1.44] |
| 17 Grip strength right hand (follow‐up) Show forest plot | 5 | Mean Difference (IV, Random, 95% CI) | Subtotals only | |
| Analysis 10.17  Comparison 10 Comparison: muscular strength, all physical activity vs control, Outcome 17 Grip strength right hand (follow‐up). | ||||
| 17.1 End of intervention | 5 | 232 | Mean Difference (IV, Random, 95% CI) | 2.30 [‐0.56, 5.16] |
| 17.2 Follow‐up | 0 | 0 | Mean Difference (IV, Random, 95% CI) | 0.0 [0.0, 0.0] |
| 18 Grip strength left hand (follow‐up) Show forest plot | 4 | Mean Difference (IV, Random, 95% CI) | Subtotals only | |
| Analysis 10.18 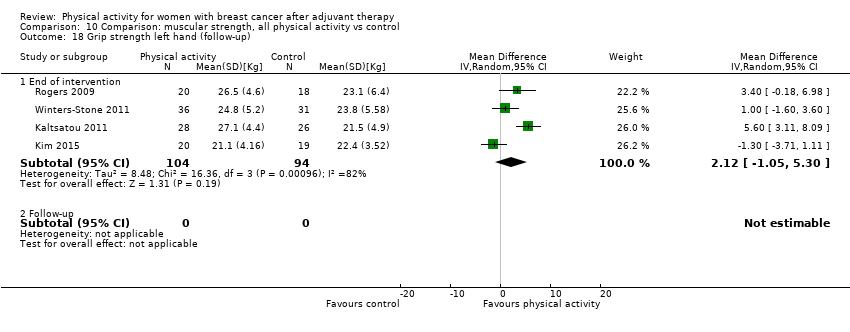 Comparison 10 Comparison: muscular strength, all physical activity vs control, Outcome 18 Grip strength left hand (follow‐up). | ||||
| 18.1 End of intervention | 4 | 198 | Mean Difference (IV, Random, 95% CI) | 2.12 [‐1.05, 5.30] |
| 18.2 Follow‐up | 0 | 0 | Mean Difference (IV, Random, 95% CI) | 0.0 [0.0, 0.0] |
| 19 Elbow flexion (follow‐up values) Show forest plot | 3 | Std. Mean Difference (IV, Fixed, 95% CI) | Subtotals only | |
| Analysis 10.19  Comparison 10 Comparison: muscular strength, all physical activity vs control, Outcome 19 Elbow flexion (follow‐up values). | ||||
| 19.1 End of intervention | 3 | 148 | Std. Mean Difference (IV, Fixed, 95% CI) | ‐0.08 [‐0.41, 0.24] |
| 19.2 Follow‐up | 0 | 0 | Std. Mean Difference (IV, Fixed, 95% CI) | 0.0 [0.0, 0.0] |
| Outcome or subgroup title | No. of studies | No. of participants | Statistical method | Effect size |
| 1 Bone mineral content (follow‐up and change values) Show forest plot | 2 | Std. Mean Difference (IV, Random, 95% CI) | Subtotals only | |
| Analysis 11.1  Comparison 11 Comparison: bone health, all physical activity vs control, Outcome 1 Bone mineral content (follow‐up and change values). | ||||
| 1.1 End of intervention | 2 | 525 | Std. Mean Difference (IV, Random, 95% CI) | 0.04 [‐0.20, 0.27] |
| 1.2 Follow‐up | 0 | 0 | Std. Mean Difference (IV, Random, 95% CI) | 0.0 [0.0, 0.0] |
| 2 Bone mineral density ‐ femoral neck (follow‐up and change values) Show forest plot | 4 | Std. Mean Difference (IV, Random, 95% CI) | Subtotals only | |
| Analysis 11.2  Comparison 11 Comparison: bone health, all physical activity vs control, Outcome 2 Bone mineral density ‐ femoral neck (follow‐up and change values). | ||||
| 2.1 End of intervention | 4 | 786 | Std. Mean Difference (IV, Random, 95% CI) | 0.21 [‐0.13, 0.55] |
| 2.2 Follow‐up | 0 | 0 | Std. Mean Difference (IV, Random, 95% CI) | 0.0 [0.0, 0.0] |
| 3 Bone mineral density ‐ lumbar spine (follow‐up and change values) Show forest plot | 4 | Std. Mean Difference (IV, Random, 95% CI) | Subtotals only | |
| Analysis 11.3  Comparison 11 Comparison: bone health, all physical activity vs control, Outcome 3 Bone mineral density ‐ lumbar spine (follow‐up and change values). | ||||
| 3.1 End of intervention | 4 | 786 | Std. Mean Difference (IV, Random, 95% CI) | 0.22 [‐0.09, 0.53] |
| 3.2 Follow‐up | 0 | 0 | Std. Mean Difference (IV, Random, 95% CI) | 0.0 [0.0, 0.0] |
| 4 Bone mineral density ‐ total hip (follow‐up and change values) Show forest plot | 3 | Std. Mean Difference (IV, Random, 95% CI) | Subtotals only | |
| Analysis 11.4 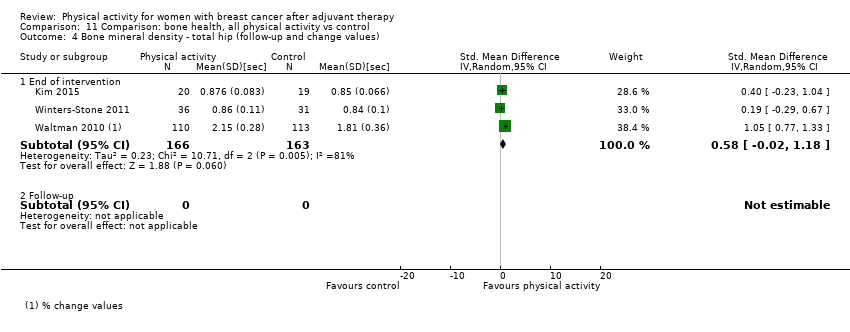 Comparison 11 Comparison: bone health, all physical activity vs control, Outcome 4 Bone mineral density ‐ total hip (follow‐up and change values). | ||||
| 4.1 End of intervention | 3 | 329 | Std. Mean Difference (IV, Random, 95% CI) | 0.58 [‐0.02, 1.18] |
| 4.2 Follow‐up | 0 | 0 | Std. Mean Difference (IV, Random, 95% CI) | 0.0 [0.0, 0.0] |
| 5 Bone formation ‐ alkaline phosphatase (follow‐up and change values) Show forest plot | 2 | Std. Mean Difference (IV, Random, 95% CI) | Subtotals only | |
| Analysis 11.5  Comparison 11 Comparison: bone health, all physical activity vs control, Outcome 5 Bone formation ‐ alkaline phosphatase (follow‐up and change values). | ||||
| 5.1 End of intervention | 2 | 239 | Std. Mean Difference (IV, Random, 95% CI) | ‐0.25 [‐1.81, 1.31] |
| 5.2 Follow‐up | 0 | 0 | Std. Mean Difference (IV, Random, 95% CI) | 0.0 [0.0, 0.0] |
| 6 Bone resorption ‐ serum NTx (follow‐up and change values) Show forest plot | 3 | Std. Mean Difference (IV, Random, 95% CI) | Subtotals only | |
| Analysis 11.6 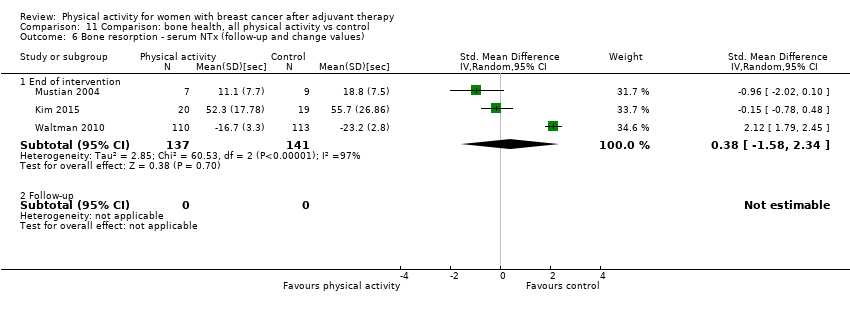 Comparison 11 Comparison: bone health, all physical activity vs control, Outcome 6 Bone resorption ‐ serum NTx (follow‐up and change values). | ||||
| 6.1 End of intervention | 3 | 278 | Std. Mean Difference (IV, Random, 95% CI) | 0.38 [‐1.58, 2.34] |
| 6.2 Follow‐up | 0 | 0 | Std. Mean Difference (IV, Random, 95% CI) | 0.0 [0.0, 0.0] |
| Outcome or subgroup title | No. of studies | No. of participants | Statistical method | Effect size |
| 1 Overall HRQoL (follow‐up values) Show forest plot | 9 | Std. Mean Difference (IV, Random, 95% CI) | Subtotals only | |
| Analysis 12.1  Comparison 12 Subanalysis: outcomes by menopausal status, Outcome 1 Overall HRQoL (follow‐up values). | ||||
| 1.1 Postmenopausal only | 3 | 186 | Std. Mean Difference (IV, Random, 95% CI) | 0.24 [‐0.05, 0.54] |
| 1.2 Not postmenopausal only | 6 | 818 | Std. Mean Difference (IV, Random, 95% CI) | 0.55 [0.11, 0.98] |
| 2 Overall HRQoL (change values) Show forest plot | 7 | Std. Mean Difference (IV, Random, 95% CI) | Subtotals only | |
| Analysis 12.2 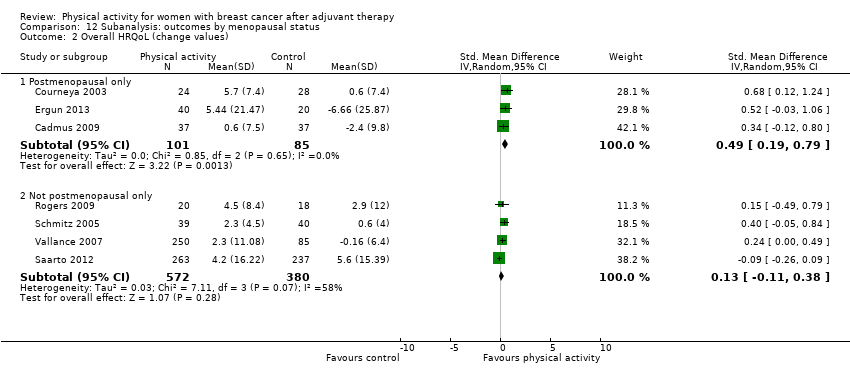 Comparison 12 Subanalysis: outcomes by menopausal status, Outcome 2 Overall HRQoL (change values). | ||||
| 2.1 Postmenopausal only | 3 | 186 | Std. Mean Difference (IV, Random, 95% CI) | 0.49 [0.19, 0.79] |
| 2.2 Not postmenopausal only | 4 | 952 | Std. Mean Difference (IV, Random, 95% CI) | 0.13 [‐0.11, 0.38] |
| 3 Overall emotional function/mental health (follow‐up values) Show forest plot | 11 | Std. Mean Difference (IV, Random, 95% CI) | Subtotals only | |
| Analysis 12.3 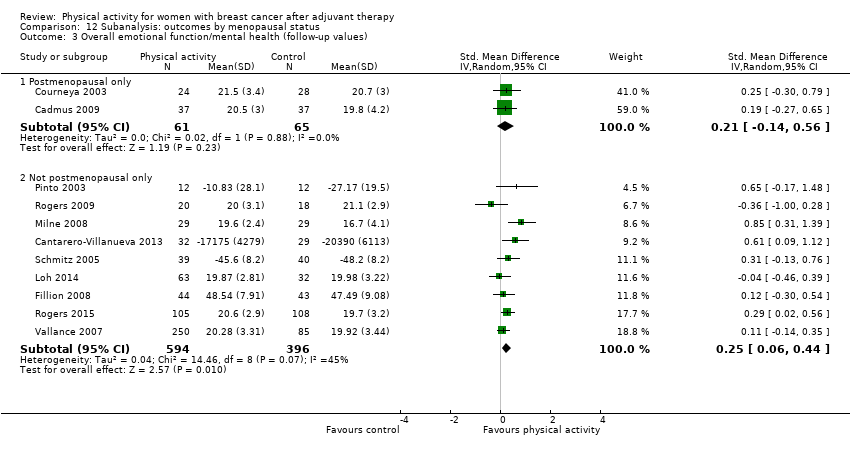 Comparison 12 Subanalysis: outcomes by menopausal status, Outcome 3 Overall emotional function/mental health (follow‐up values). | ||||
| 3.1 Postmenopausal only | 2 | 126 | Std. Mean Difference (IV, Random, 95% CI) | 0.21 [‐0.14, 0.56] |
| 3.2 Not postmenopausal only | 9 | 990 | Std. Mean Difference (IV, Random, 95% CI) | 0.25 [0.06, 0.44] |
| 4 Overall emotional function/mental health (change values) Show forest plot | 7 | Std. Mean Difference (IV, Random, 95% CI) | Subtotals only | |
| Analysis 12.4 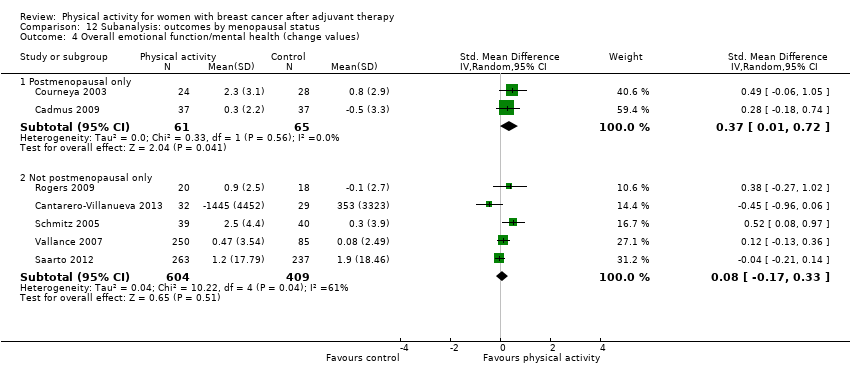 Comparison 12 Subanalysis: outcomes by menopausal status, Outcome 4 Overall emotional function/mental health (change values). | ||||
| 4.1 Postmenopausal only | 2 | 126 | Std. Mean Difference (IV, Random, 95% CI) | 0.37 [0.01, 0.72] |
| 4.2 Not postmenopausal only | 5 | 1013 | Std. Mean Difference (IV, Random, 95% CI) | 0.08 [‐0.17, 0.33] |
| 5 Overall physical function (follow‐up values) Show forest plot | 11 | Std. Mean Difference (IV, Random, 95% CI) | Subtotals only | |
| Analysis 12.5  Comparison 12 Subanalysis: outcomes by menopausal status, Outcome 5 Overall physical function (follow‐up values). | ||||
| 5.1 Postmenopausal only | 3 | 187 | Std. Mean Difference (IV, Random, 95% CI) | 0.09 [‐0.20, 0.38] |
| 5.2 Not postmenopausal only | 8 | 929 | Std. Mean Difference (IV, Random, 95% CI) | 0.50 [0.10, 0.90] |
| 6 Overall physical function (change values) Show forest plot | 6 | Std. Mean Difference (IV, Random, 95% CI) | Subtotals only | |
| Analysis 12.6 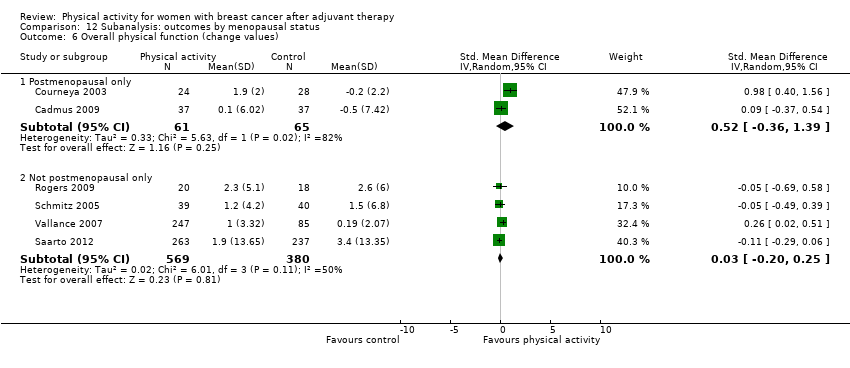 Comparison 12 Subanalysis: outcomes by menopausal status, Outcome 6 Overall physical function (change values). | ||||
| 6.1 Postmenopausal only | 2 | 126 | Std. Mean Difference (IV, Random, 95% CI) | 0.52 [‐0.36, 1.39] |
| 6.2 Not postmenopausal only | 4 | 949 | Std. Mean Difference (IV, Random, 95% CI) | 0.03 [‐0.20, 0.25] |
| 7 Overall role function (follow‐up values) Show forest plot | 8 | Std. Mean Difference (IV, Random, 95% CI) | Subtotals only | |
| Analysis 12.7 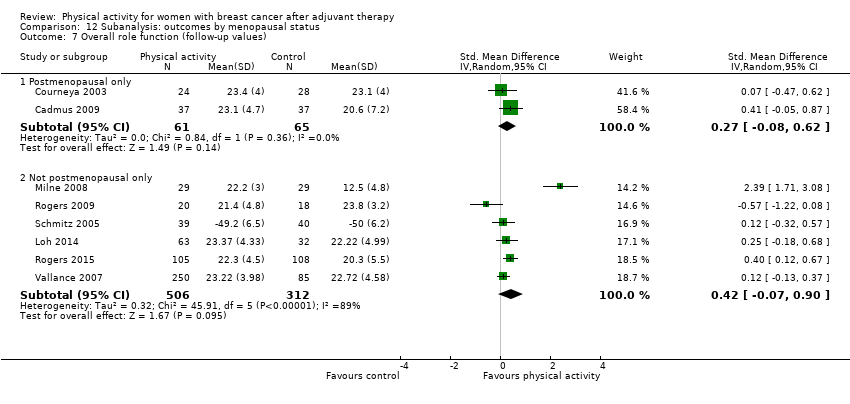 Comparison 12 Subanalysis: outcomes by menopausal status, Outcome 7 Overall role function (follow‐up values). | ||||
| 7.1 Postmenopausal only | 2 | 126 | Std. Mean Difference (IV, Random, 95% CI) | 0.27 [‐0.08, 0.62] |
| 7.2 Not postmenopausal only | 6 | 818 | Std. Mean Difference (IV, Random, 95% CI) | 0.42 [‐0.07, 0.90] |
| 8 Overall role function (change values) Show forest plot | 6 | Std. Mean Difference (IV, Random, 95% CI) | Subtotals only | |
| Analysis 12.8 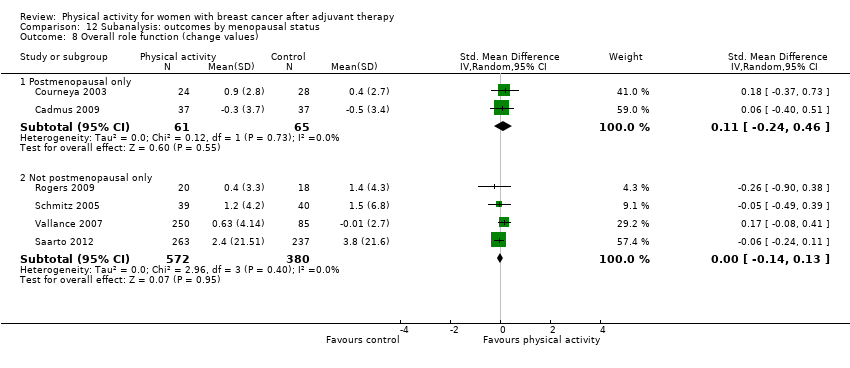 Comparison 12 Subanalysis: outcomes by menopausal status, Outcome 8 Overall role function (change values). | ||||
| 8.1 Postmenopausal only | 2 | 126 | Std. Mean Difference (IV, Random, 95% CI) | 0.11 [‐0.24, 0.46] |
| 8.2 Not postmenopausal only | 4 | 952 | Std. Mean Difference (IV, Random, 95% CI) | ‐0.00 [‐0.14, 0.13] |
| 9 Overall social well‐being/function (follow‐up values) Show forest plot | 8 | Std. Mean Difference (IV, Random, 95% CI) | Subtotals only | |
| Analysis 12.9  Comparison 12 Subanalysis: outcomes by menopausal status, Outcome 9 Overall social well‐being/function (follow‐up values). | ||||
| 9.1 Postmenopausal only | 3 | 168 | Std. Mean Difference (IV, Random, 95% CI) | 0.43 [‐0.06, 0.91] |
| 9.2 Not postmenopausal only | 5 | 867 | Std. Mean Difference (IV, Random, 95% CI) | 0.09 [‐0.05, 0.24] |
| 10 Overall social well‐being/function (change values) Show forest plot | 6 | Std. Mean Difference (IV, Random, 95% CI) | Subtotals only | |
| Analysis 12.10  Comparison 12 Subanalysis: outcomes by menopausal status, Outcome 10 Overall social well‐being/function (change values). | ||||
| 10.1 Postmenopausal only | 3 | 168 | Std. Mean Difference (IV, Random, 95% CI) | 0.50 [0.19, 0.80] |
| 10.2 Not postmenopausal only | 3 | 873 | Std. Mean Difference (IV, Random, 95% CI) | 0.50 [‐0.39, 1.40] |
| 11 Overall cognitive function (follow‐up values) Show forest plot | 3 | Std. Mean Difference (IV, Random, 95% CI) | Subtotals only | |
| Analysis 12.11  Comparison 12 Subanalysis: outcomes by menopausal status, Outcome 11 Overall cognitive function (follow‐up values). | ||||
| 11.1 Postmenopausal only | 0 | 0 | Std. Mean Difference (IV, Random, 95% CI) | 0.0 [0.0, 0.0] |
| 11.2 Not postmenopausal only | 3 | 116 | Std. Mean Difference (IV, Random, 95% CI) | 0.58 [0.20, 0.95] |
| 12 Overall cognitive function (change values) Show forest plot | 3 | Std. Mean Difference (IV, Random, 95% CI) | Subtotals only | |
| Analysis 12.12  Comparison 12 Subanalysis: outcomes by menopausal status, Outcome 12 Overall cognitive function (change values). | ||||
| 12.1 Postmenopausal only | 0 | 0 | Std. Mean Difference (IV, Random, 95% CI) | 0.0 [0.0, 0.0] |
| 12.2 Not postmenopausal only | 3 | 599 | Std. Mean Difference (IV, Random, 95% CI) | 0.12 [‐0.31, 0.55] |
| 13 Overall general health (follow‐up values) Show forest plot | 4 | Std. Mean Difference (IV, Random, 95% CI) | Subtotals only | |
| Analysis 12.13  Comparison 12 Subanalysis: outcomes by menopausal status, Outcome 13 Overall general health (follow‐up values). | ||||
| 13.1 Postmenopausal only | 2 | 134 | Std. Mean Difference (IV, Random, 95% CI) | ‐0.03 [‐0.41, 0.35] |
| 13.2 Not postmenopausal only | 2 | 117 | Std. Mean Difference (IV, Random, 95% CI) | ‐0.09 [‐0.57, 0.39] |
| 14 Overall general health (change values) Show forest plot | 5 | Std. Mean Difference (IV, Random, 95% CI) | Subtotals only | |
| Analysis 12.14  Comparison 12 Subanalysis: outcomes by menopausal status, Outcome 14 Overall general health (change values). | ||||
| 14.1 Postmenopausal only | 2 | 134 | Std. Mean Difference (IV, Random, 95% CI) | 0.27 [‐0.18, 0.71] |
| 14.2 Not postmenopausal only | 3 | 617 | Std. Mean Difference (IV, Random, 95% CI) | ‐0.01 [‐0.22, 0.21] |
| 15 Overall sexual function (follow‐up values) Show forest plot | 2 | Std. Mean Difference (IV, Fixed, 95% CI) | Subtotals only | |
| Analysis 12.15  Comparison 12 Subanalysis: outcomes by menopausal status, Outcome 15 Overall sexual function (follow‐up values). | ||||
| 15.1 Postmenopausal only | 0 | 0 | Std. Mean Difference (IV, Fixed, 95% CI) | 0.0 [0.0, 0.0] |
| 15.2 Not postmenopausal only | 2 | 161 | Std. Mean Difference (IV, Fixed, 95% CI) | 0.31 [‐0.00, 0.62] |
| 16 Overall sexual function (change values) Show forest plot | 2 | Std. Mean Difference (IV, Random, 95% CI) | Subtotals only | |
| Analysis 12.16  Comparison 12 Subanalysis: outcomes by menopausal status, Outcome 16 Overall sexual function (change values). | ||||
| 16.1 Postmenopausal only | 0 | 0 | Std. Mean Difference (IV, Random, 95% CI) | 0.0 [0.0, 0.0] |
| 16.2 Not postmenopausal only | 2 | 579 | Std. Mean Difference (IV, Random, 95% CI) | 0.08 [‐0.14, 0.30] |
| 17 Overall sleep (follow‐up values) Show forest plot | 4 | Std. Mean Difference (IV, Fixed, 95% CI) | Subtotals only | |
| Analysis 12.17  Comparison 12 Subanalysis: outcomes by menopausal status, Outcome 17 Overall sleep (follow‐up values). | ||||
| 17.1 Postmenopausal only | 1 | 42 | Std. Mean Difference (IV, Fixed, 95% CI) | ‐0.11 [‐0.72, 0.49] |
| 17.2 Not postmenopausal only | 3 | 89 | Std. Mean Difference (IV, Fixed, 95% CI) | 0.18 [‐0.24, 0.60] |
| 18 Overall sleep (change values) Show forest plot | 2 | Std. Mean Difference (IV, Random, 95% CI) | Subtotals only | |
| Analysis 12.18  Comparison 12 Subanalysis: outcomes by menopausal status, Outcome 18 Overall sleep (change values). | ||||
| 18.1 Postmenopausal only | 1 | 42 | Std. Mean Difference (IV, Random, 95% CI) | 0.23 [‐0.38, 0.84] |
| 18.2 Not postmenopausal only | 1 | 38 | Std. Mean Difference (IV, Random, 95% CI) | 0.05 [‐0.59, 0.68] |
| 19 Overall anxiety (follow‐up values) Show forest plot | 4 | Std. Mean Difference (IV, Random, 95% CI) | Subtotals only | |
| Analysis 12.19  Comparison 12 Subanalysis: outcomes by menopausal status, Outcome 19 Overall anxiety (follow‐up values). | ||||
| 19.1 Postmenopausal only | 2 | 116 | Std. Mean Difference (IV, Random, 95% CI) | ‐0.09 [‐0.46, 0.27] |
| 19.2 Not postmenopausal only | 2 | 79 | Std. Mean Difference (IV, Random, 95% CI) | ‐0.66 [‐1.12, ‐0.20] |
| 20 Overall anxiety (change values) Show forest plot | 3 | Std. Mean Difference (IV, Fixed, 95% CI) | Subtotals only | |
| Analysis 12.20  Comparison 12 Subanalysis: outcomes by menopausal status, Outcome 20 Overall anxiety (change values). | ||||
| 20.1 Postmenopausal only | 2 | 116 | Std. Mean Difference (IV, Fixed, 95% CI) | ‐0.23 [‐0.60, 0.13] |
| 20.2 Not postmenopausal only | 1 | 61 | Std. Mean Difference (IV, Fixed, 95% CI) | ‐0.61 [‐1.12, ‐0.09] |
| 21 Overall self‐esteem/body image (follow‐up values) Show forest plot | 4 | Std. Mean Difference (IV, Random, 95% CI) | Subtotals only | |
| Analysis 12.21  Comparison 12 Subanalysis: outcomes by menopausal status, Outcome 21 Overall self‐esteem/body image (follow‐up values). | ||||
| 21.1 Postmenopausal only | 2 | 126 | Std. Mean Difference (IV, Random, 95% CI) | 0.10 [‐0.25, 0.45] |
| 21.2 Not postmenopausal only | 2 | 76 | Std. Mean Difference (IV, Random, 95% CI) | 0.60 [‐0.15, 1.35] |
| 22 Overall self‐esteem/body image (change values) Show forest plot | 4 | Std. Mean Difference (IV, Random, 95% CI) | Subtotals only | |
| Analysis 12.22  Comparison 12 Subanalysis: outcomes by menopausal status, Outcome 22 Overall self‐esteem/body image (change values). | ||||
| 22.1 Postmenopausal only | 2 | 126 | Std. Mean Difference (IV, Random, 95% CI) | 0.38 [‐0.30, 1.05] |
| 22.2 Not postmenopausal only | 2 | 558 | Std. Mean Difference (IV, Random, 95% CI) | 0.08 [‐0.31, 0.47] |
| 23 Overall depression (follow‐up values) Show forest plot | 8 | Std. Mean Difference (IV, Random, 95% CI) | Subtotals only | |
| Analysis 12.23 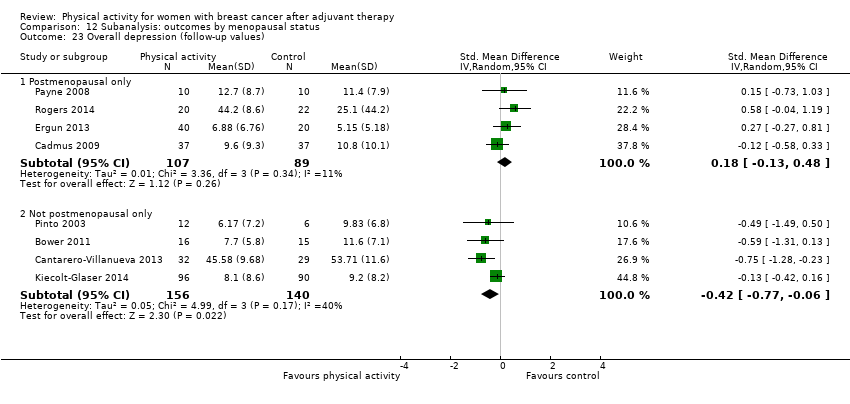 Comparison 12 Subanalysis: outcomes by menopausal status, Outcome 23 Overall depression (follow‐up values). | ||||
| 23.1 Postmenopausal only | 4 | 196 | Std. Mean Difference (IV, Random, 95% CI) | 0.18 [‐0.13, 0.48] |
| 23.2 Not postmenopausal only | 4 | 296 | Std. Mean Difference (IV, Random, 95% CI) | ‐0.42 [‐0.77, ‐0.06] |
| 24 Overall depression (change values) Show forest plot | 5 | Std. Mean Difference (IV, Random, 95% CI) | Subtotals only | |
| Analysis 12.24  Comparison 12 Subanalysis: outcomes by menopausal status, Outcome 24 Overall depression (change values). | ||||
| 24.1 Postmenopausal only | 3 | 176 | Std. Mean Difference (IV, Random, 95% CI) | ‐0.27 [‐0.57, 0.04] |
| 24.2 Not postmenopausal only | 2 | 561 | Std. Mean Difference (IV, Random, 95% CI) | ‐0.21 [‐0.82, 0.40] |
| 25 Overall fatigue (follow‐up values) Show forest plot | 15 | Std. Mean Difference (IV, Random, 95% CI) | Subtotals only | |
| Analysis 12.25  Comparison 12 Subanalysis: outcomes by menopausal status, Outcome 25 Overall fatigue (follow‐up values). | ||||
| 25.1 Postmenopausal only | 6 | 313 | Std. Mean Difference (IV, Random, 95% CI) | 0.04 [‐0.19, 0.26] |
| 25.2 Not postmenopausal only | 9 | 834 | Std. Mean Difference (IV, Random, 95% CI) | ‐0.53 [‐0.87, ‐0.18] |
| 26 Overall fatigue (change values) Show forest plot | 7 | Std. Mean Difference (IV, Random, 95% CI) | Subtotals only | |
| Analysis 12.26 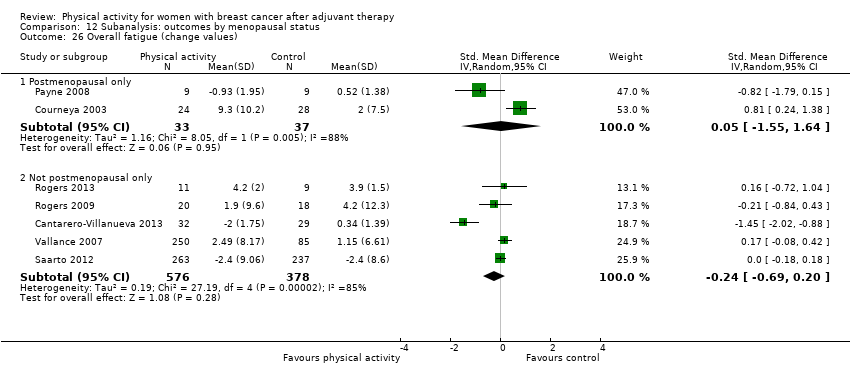 Comparison 12 Subanalysis: outcomes by menopausal status, Outcome 26 Overall fatigue (change values). | ||||
| 26.1 Postmenopausal only | 2 | 70 | Std. Mean Difference (IV, Random, 95% CI) | 0.05 [‐1.55, 1.64] |
| 26.2 Not postmenopausal only | 5 | 954 | Std. Mean Difference (IV, Random, 95% CI) | ‐0.24 [‐0.69, 0.20] |
| 27 Overall pain/disability (follow‐up values) Show forest plot | 2 | Std. Mean Difference (IV, Random, 95% CI) | Subtotals only | |
| Analysis 12.27  Comparison 12 Subanalysis: outcomes by menopausal status, Outcome 27 Overall pain/disability (follow‐up values). | ||||
| 27.1 Postmenopausal only | 1 | 74 | Std. Mean Difference (IV, Random, 95% CI) | ‐0.05 [‐0.51, 0.40] |
| 27.2 Not postmenopausal only | 1 | 38 | Std. Mean Difference (IV, Random, 95% CI) | ‐0.26 [‐0.89, 0.38] |
| 28 Overall pain/disability (change values) Show forest plot | 3 | Std. Mean Difference (IV, Random, 95% CI) | Subtotals only | |
| Analysis 12.28 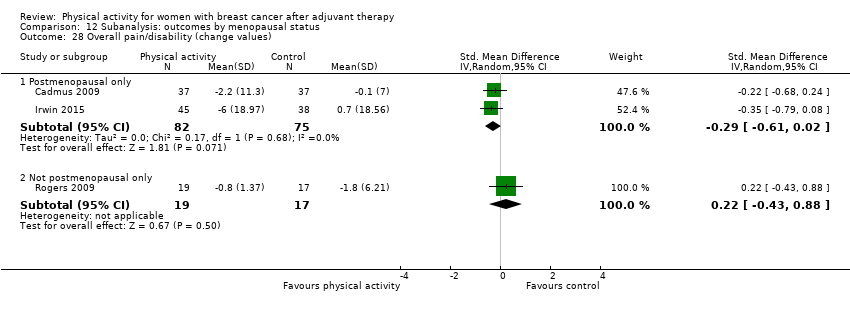 Comparison 12 Subanalysis: outcomes by menopausal status, Outcome 28 Overall pain/disability (change values). | ||||
| 28.1 Postmenopausal only | 2 | 157 | Std. Mean Difference (IV, Random, 95% CI) | ‐0.29 [‐0.61, 0.02] |
| 28.2 Not postmenopausal only | 1 | 36 | Std. Mean Difference (IV, Random, 95% CI) | 0.22 [‐0.43, 0.88] |
| 29 Overall cardiorespiratory fitness (follow‐up values) Show forest plot | 9 | Std. Mean Difference (IV, Random, 95% CI) | Subtotals only | |
| Analysis 12.29  Comparison 12 Subanalysis: outcomes by menopausal status, Outcome 29 Overall cardiorespiratory fitness (follow‐up values). | ||||
| 29.1 Postmenopausal only | 4 | 214 | Std. Mean Difference (IV, Random, 95% CI) | 0.61 [0.30, 0.92] |
| 29.2 Not postmenopausal only | 5 | 418 | Std. Mean Difference (IV, Random, 95% CI) | 0.19 [‐0.01, 0.38] |
| 30 Overall cardiorespiratory fitness (change values) Show forest plot | 5 | Std. Mean Difference (IV, Random, 95% CI) | Subtotals only | |
| Analysis 12.30  Comparison 12 Subanalysis: outcomes by menopausal status, Outcome 30 Overall cardiorespiratory fitness (change values). | ||||
| 30.1 Postmenopausal only | 4 | 208 | Std. Mean Difference (IV, Random, 95% CI) | 1.07 [0.48, 1.67] |
| 30.2 Not postmenopausal only | 1 | 498 | Std. Mean Difference (IV, Random, 95% CI) | 0.16 [‐0.02, 0.33] |
| 31 Overall self‐reported physical activity (follow‐up values) Show forest plot | 10 | Std. Mean Difference (IV, Random, 95% CI) | Subtotals only | |
| Analysis 12.31 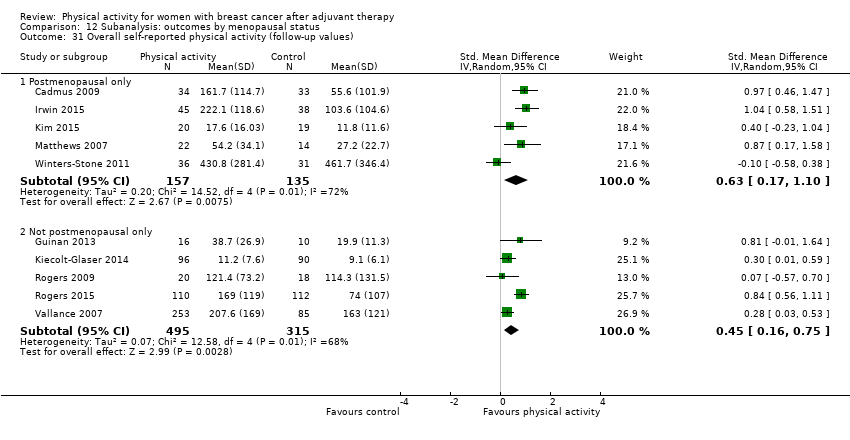 Comparison 12 Subanalysis: outcomes by menopausal status, Outcome 31 Overall self‐reported physical activity (follow‐up values). | ||||
| 31.1 Postmenopausal only | 5 | 292 | Std. Mean Difference (IV, Random, 95% CI) | 0.63 [0.17, 1.10] |
| 31.2 Not postmenopausal only | 5 | 810 | Std. Mean Difference (IV, Random, 95% CI) | 0.45 [0.16, 0.75] |
| 32 Overall self‐reported physical activity (change values) Show forest plot | 6 | Std. Mean Difference (IV, Random, 95% CI) | Subtotals only | |
| Analysis 12.32 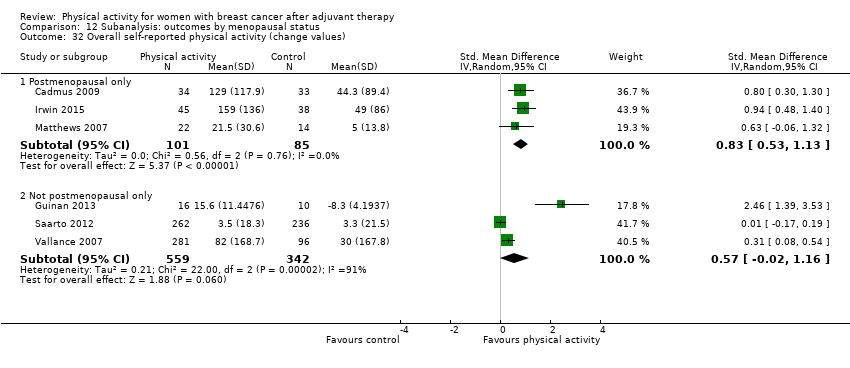 Comparison 12 Subanalysis: outcomes by menopausal status, Outcome 32 Overall self‐reported physical activity (change values). | ||||
| 32.1 Postmenopausal only | 3 | 186 | Std. Mean Difference (IV, Random, 95% CI) | 0.83 [0.53, 1.13] |
| 32.2 Not postmenopausal only | 3 | 901 | Std. Mean Difference (IV, Random, 95% CI) | 0.57 [‐0.02, 1.16] |
| 33 Overall objective physical activity (follow‐up values) Show forest plot | 8 | Std. Mean Difference (IV, Random, 95% CI) | Subtotals only | |
| Analysis 12.33  Comparison 12 Subanalysis: outcomes by menopausal status, Outcome 33 Overall objective physical activity (follow‐up values). | ||||
| 33.1 Postmenopausal only | 3 | 145 | Std. Mean Difference (IV, Random, 95% CI) | 0.87 [0.27, 1.46] |
| 33.2 Not postmenopausal only | 5 | 645 | Std. Mean Difference (IV, Random, 95% CI) | 0.19 [‐0.03, 0.42] |
| 34 Overall objective physical activity (change values) Show forest plot | 5 | Std. Mean Difference (IV, Random, 95% CI) | Subtotals only | |
| Analysis 12.34  Comparison 12 Subanalysis: outcomes by menopausal status, Outcome 34 Overall objective physical activity (change values). | ||||
| 34.1 Postmenopausal only | 3 | 145 | Std. Mean Difference (IV, Random, 95% CI) | 0.89 [0.54, 1.24] |
| 34.2 Not postmenopausal only | 2 | 363 | Std. Mean Difference (IV, Random, 95% CI) | 0.45 [‐0.67, 1.58] |
| 35 Mass (follow‐up values) Show forest plot | 8 | Mean Difference (IV, Fixed, 95% CI) | Subtotals only | |
| Analysis 12.35  Comparison 12 Subanalysis: outcomes by menopausal status, Outcome 35 Mass (follow‐up values). | ||||
| 35.1 Postmenopausal only | 4 | 222 | Mean Difference (IV, Fixed, 95% CI) | 0.69 [‐3.74, 5.13] |
| 35.2 Not postmenopausal only | 4 | 411 | Mean Difference (IV, Fixed, 95% CI) | 0.08 [‐0.52, 0.68] |
| 36 Mass (change values) Show forest plot | 7 | Mean Difference (IV, Random, 95% CI) | Subtotals only | |
| Analysis 12.36 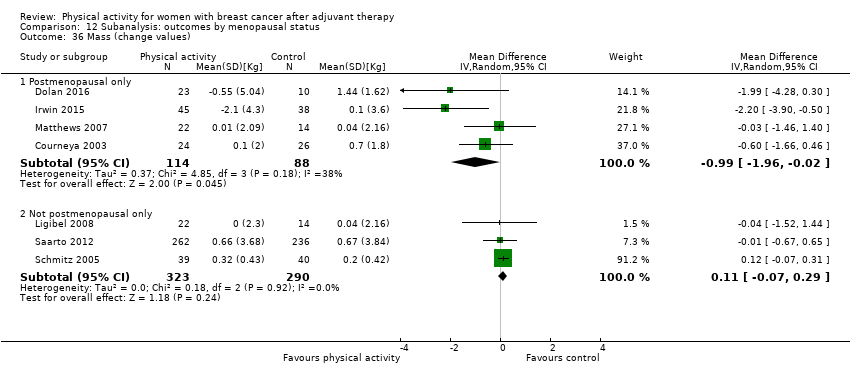 Comparison 12 Subanalysis: outcomes by menopausal status, Outcome 36 Mass (change values). | ||||
| 36.1 Postmenopausal only | 4 | 202 | Mean Difference (IV, Random, 95% CI) | ‐0.99 [‐1.96, ‐0.02] |
| 36.2 Not postmenopausal only | 3 | 613 | Mean Difference (IV, Random, 95% CI) | 0.11 [‐0.07, 0.29] |
| 37 BMI (follow‐up values) Show forest plot | 9 | Mean Difference (IV, Fixed, 95% CI) | Subtotals only | |
| Analysis 12.37  Comparison 12 Subanalysis: outcomes by menopausal status, Outcome 37 BMI (follow‐up values). | ||||
| 37.1 Postmenopausal only | 3 | 161 | Mean Difference (IV, Fixed, 95% CI) | ‐0.60 [‐2.62, 1.42] |
| 37.2 Not postmenopausal only | 6 | 745 | Mean Difference (IV, Fixed, 95% CI) | 0.08 [‐0.13, 0.29] |
| 38 BMI (change values) Show forest plot | 4 | Mean Difference (IV, Random, 95% CI) | Subtotals only | |
| Analysis 12.38 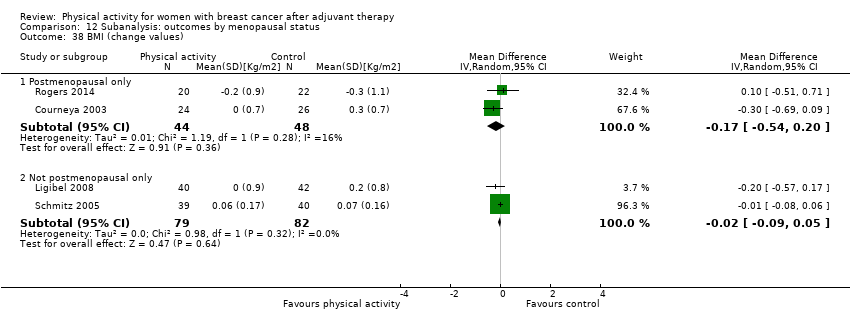 Comparison 12 Subanalysis: outcomes by menopausal status, Outcome 38 BMI (change values). | ||||
| 38.1 Postmenopausal only | 2 | 92 | Mean Difference (IV, Random, 95% CI) | ‐0.17 [‐0.54, 0.20] |
| 38.2 Not postmenopausal only | 2 | 161 | Mean Difference (IV, Random, 95% CI) | ‐0.02 [‐0.09, 0.05] |
| 39 Overall body fat (follow‐up values) Show forest plot | 11 | Std. Mean Difference (IV, Random, 95% CI) | Subtotals only | |
| Analysis 12.39 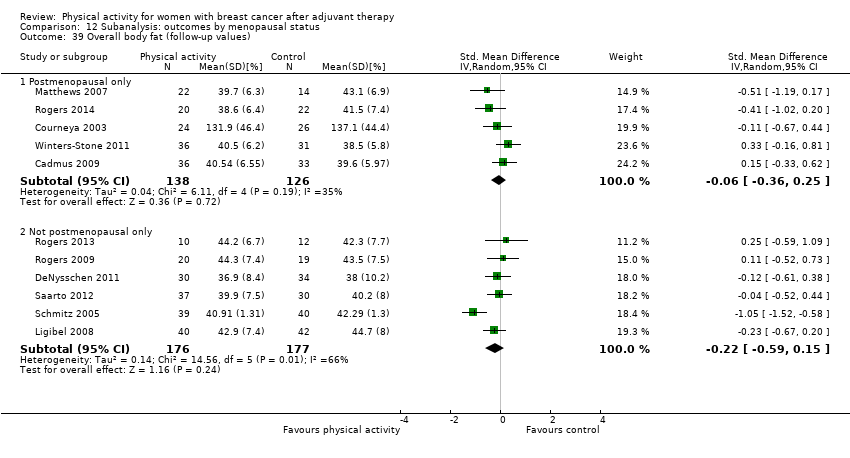 Comparison 12 Subanalysis: outcomes by menopausal status, Outcome 39 Overall body fat (follow‐up values). | ||||
| 39.1 Postmenopausal only | 5 | 264 | Std. Mean Difference (IV, Random, 95% CI) | ‐0.06 [‐0.36, 0.25] |
| 39.2 Not postmenopausal only | 6 | 353 | Std. Mean Difference (IV, Random, 95% CI) | ‐0.22 [‐0.59, 0.15] |
| 40 Overall body fat (change values) Show forest plot | 5 | Std. Mean Difference (IV, Random, 95% CI) | Subtotals only | |
| Analysis 12.40  Comparison 12 Subanalysis: outcomes by menopausal status, Outcome 40 Overall body fat (change values). | ||||
| 40.1 Postmenopausal only | 3 | 128 | Std. Mean Difference (IV, Random, 95% CI) | ‐0.35 [‐0.70, 0.00] |
| 40.2 Not postmenopausal only | 2 | 161 | Std. Mean Difference (IV, Random, 95% CI) | ‐1.67 [‐4.39, 1.05] |
| 41 Lower body strength (follow‐up values) Show forest plot | 6 | Std. Mean Difference (IV, Random, 95% CI) | Subtotals only | |
| Analysis 12.41  Comparison 12 Subanalysis: outcomes by menopausal status, Outcome 41 Lower body strength (follow‐up values). | ||||
| 41.1 Postmenopausal only | 1 | 67 | Std. Mean Difference (IV, Random, 95% CI) | 0.19 [‐0.30, 0.67] |
| 41.2 Not postmenopausal only | 5 | 228 | Std. Mean Difference (IV, Random, 95% CI) | 0.46 [0.04, 0.88] |
| 42 Lower body strength (change values) Show forest plot | 3 | Std. Mean Difference (IV, Random, 95% CI) | Subtotals only | |
| Analysis 12.42 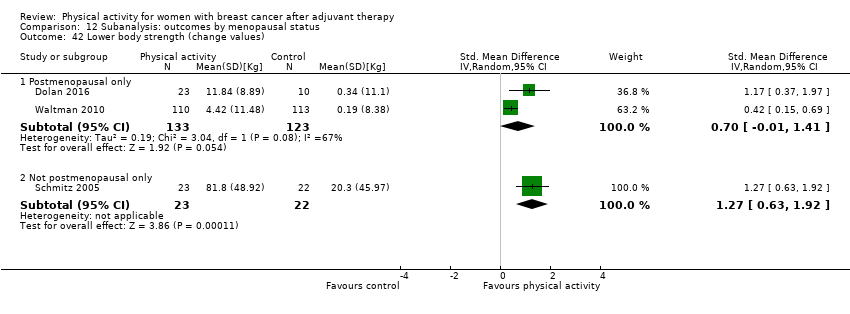 Comparison 12 Subanalysis: outcomes by menopausal status, Outcome 42 Lower body strength (change values). | ||||
| 42.1 Postmenopausal only | 2 | 256 | Std. Mean Difference (IV, Random, 95% CI) | 0.70 [‐0.01, 1.41] |
| 42.2 Not postmenopausal only | 1 | 45 | Std. Mean Difference (IV, Random, 95% CI) | 1.27 [0.63, 1.92] |
| 43 Upper body strength (follow‐up values) Show forest plot | 5 | Std. Mean Difference (IV, Random, 95% CI) | Subtotals only | |
| Analysis 12.43 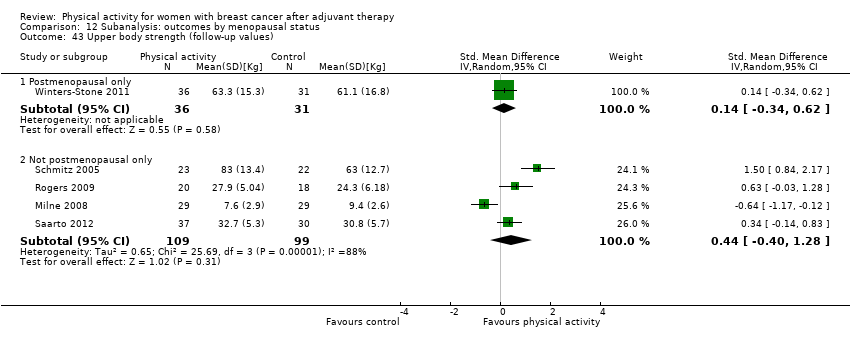 Comparison 12 Subanalysis: outcomes by menopausal status, Outcome 43 Upper body strength (follow‐up values). | ||||
| 43.1 Postmenopausal only | 1 | 67 | Std. Mean Difference (IV, Random, 95% CI) | 0.14 [‐0.34, 0.62] |
| 43.2 Not postmenopausal only | 4 | 208 | Std. Mean Difference (IV, Random, 95% CI) | 0.44 [‐0.40, 1.28] |
| 44 Upper body strength (change values) Show forest plot | 4 | Std. Mean Difference (IV, Random, 95% CI) | Subtotals only | |
| Analysis 12.44  Comparison 12 Subanalysis: outcomes by menopausal status, Outcome 44 Upper body strength (change values). | ||||
| 44.1 Postmenopausal only | 2 | 306 | Std. Mean Difference (IV, Random, 95% CI) | 0.25 [0.03, 0.48] |
| 44.2 Not postmenopausal only | 2 | 81 | Std. Mean Difference (IV, Random, 95% CI) | 1.49 [0.04, 2.93] |
| 45 Bone mineral density ‐ femoral neck (follow‐up and change values) Show forest plot | 4 | Std. Mean Difference (IV, Random, 95% CI) | Subtotals only | |
| Analysis 12.45 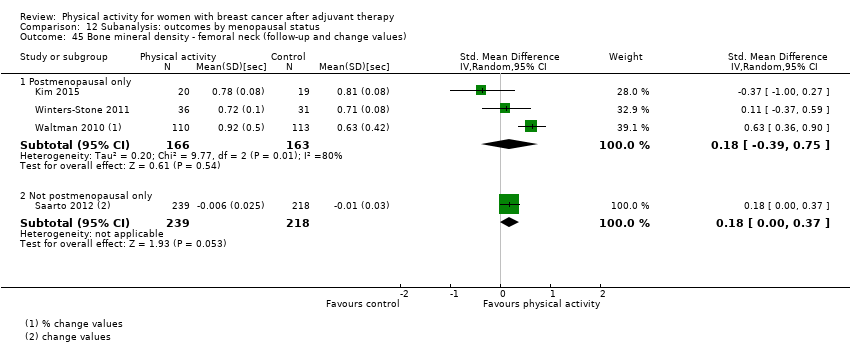 Comparison 12 Subanalysis: outcomes by menopausal status, Outcome 45 Bone mineral density ‐ femoral neck (follow‐up and change values). | ||||
| 45.1 Postmenopausal only | 3 | 329 | Std. Mean Difference (IV, Random, 95% CI) | 0.18 [‐0.39, 0.75] |
| 45.2 Not postmenopausal only | 1 | 457 | Std. Mean Difference (IV, Random, 95% CI) | 0.18 [‐0.00, 0.37] |
| 46 Bone mineral density ‐ lumbar spine (follow‐up and change values) Show forest plot | 4 | Std. Mean Difference (IV, Random, 95% CI) | Subtotals only | |
| Analysis 12.46  Comparison 12 Subanalysis: outcomes by menopausal status, Outcome 46 Bone mineral density ‐ lumbar spine (follow‐up and change values). | ||||
| 46.1 Postmenopausal only | 3 | 329 | Std. Mean Difference (IV, Random, 95% CI) | 0.27 [‐0.16, 0.70] |
| 46.2 Not postmenopausal only | 1 | 457 | Std. Mean Difference (IV, Random, 95% CI) | 0.09 [‐0.09, 0.27] |
| Outcome or subgroup title | No. of studies | No. of participants | Statistical method | Effect size |
| 1 Overall HRQoL (follow‐up values) Show forest plot | 22 | Std. Mean Difference (IV, Random, 95% CI) | Subtotals only | |
| Analysis 13.1  Comparison 13 Subanalysis: outcomes by mode of physical activity intervention, Outcome 1 Overall HRQoL (follow‐up values). | ||||
| 1.1 Aerobic exercise interventions | 12 | 971 | Std. Mean Difference (IV, Random, 95% CI) | 0.41 [0.19, 0.63] |
| 1.2 Resistance exercise interventions | 1 | 79 | Std. Mean Difference (IV, Random, 95% CI) | 0.35 [‐0.09, 0.79] |
| 1.3 Combined aerobic and resistance exercise | 7 | 589 | Std. Mean Difference (IV, Random, 95% CI) | 0.63 [0.08, 1.19] |
| 1.4 Yoga, Tai Chi, and Pilates interventions | 3 | 184 | Std. Mean Difference (IV, Random, 95% CI) | 0.11 [‐0.22, 0.45] |
| 2 Overall HRQoL (change values) Show forest plot | 14 | Std. Mean Difference (IV, Random, 95% CI) | Subtotals only | |
| Analysis 13.2  Comparison 13 Subanalysis: outcomes by mode of physical activity intervention, Outcome 2 Overall HRQoL (change values). | ||||
| 2.1 Aerobic exercise interventions | 9 | 1280 | Std. Mean Difference (IV, Random, 95% CI) | 0.68 [0.22, 1.15] |
| 2.2 Resistance exercise interventions | 1 | 79 | Std. Mean Difference (IV, Random, 95% CI) | 0.40 [‐0.05, 0.84] |
| 2.3 Combined aerobic and resistance exercise | 4 | 139 | Std. Mean Difference (IV, Random, 95% CI) | 0.69 [0.01, 1.38] |
| 2.4 Yoga, Tai Chi, and Pilates interventions | 1 | 21 | Std. Mean Difference (IV, Random, 95% CI) | 2.88 [1.59, 4.17] |
| 3 Overall emotional function/mental health (follow‐up values) Show forest plot | 26 | Std. Mean Difference (IV, Random, 95% CI) | Subtotals only | |
| Analysis 13.3 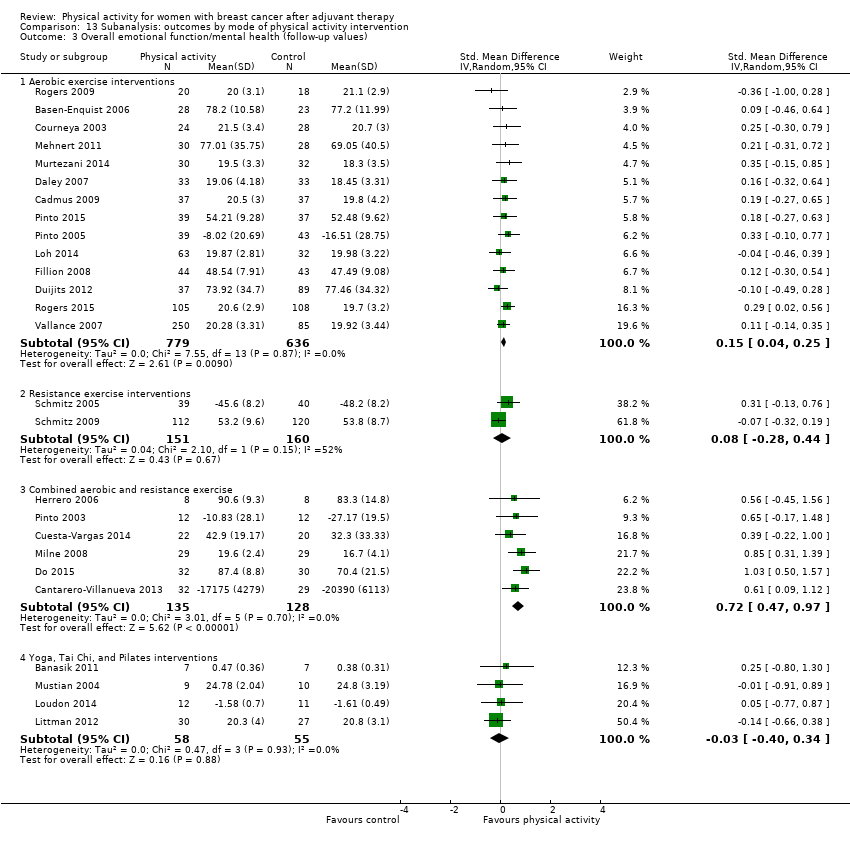 Comparison 13 Subanalysis: outcomes by mode of physical activity intervention, Outcome 3 Overall emotional function/mental health (follow‐up values). | ||||
| 3.1 Aerobic exercise interventions | 14 | 1415 | Std. Mean Difference (IV, Random, 95% CI) | 0.15 [0.04, 0.25] |
| 3.2 Resistance exercise interventions | 2 | 311 | Std. Mean Difference (IV, Random, 95% CI) | 0.08 [‐0.28, 0.44] |
| 3.3 Combined aerobic and resistance exercise | 6 | 263 | Std. Mean Difference (IV, Random, 95% CI) | 0.72 [0.47, 0.97] |
| 3.4 Yoga, Tai Chi, and Pilates interventions | 4 | 113 | Std. Mean Difference (IV, Random, 95% CI) | ‐0.03 [‐0.40, 0.34] |
| 4 Overall emotional function/mental health (change values) Show forest plot | 15 | Std. Mean Difference (IV, Random, 95% CI) | Subtotals only | |
| Analysis 13.4 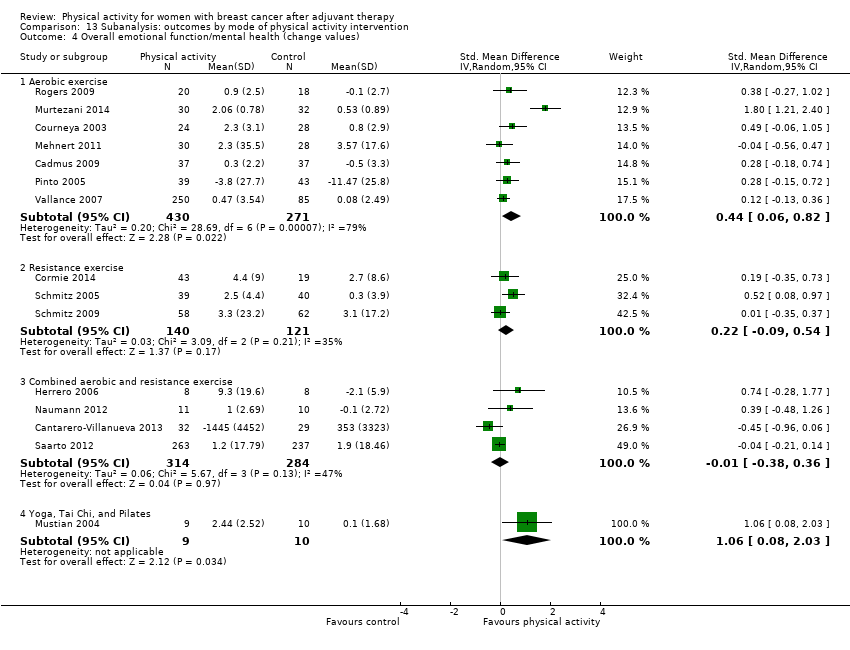 Comparison 13 Subanalysis: outcomes by mode of physical activity intervention, Outcome 4 Overall emotional function/mental health (change values). | ||||
| 4.1 Aerobic exercise | 7 | 701 | Std. Mean Difference (IV, Random, 95% CI) | 0.44 [0.06, 0.82] |
| 4.2 Resistance exercise | 3 | 261 | Std. Mean Difference (IV, Random, 95% CI) | 0.22 [‐0.09, 0.54] |
| 4.3 Combined aerobic and resistance exercise | 4 | 598 | Std. Mean Difference (IV, Random, 95% CI) | ‐0.01 [‐0.38, 0.36] |
| 4.4 Yoga, Tai Chi, and Pilates | 1 | 19 | Std. Mean Difference (IV, Random, 95% CI) | 1.06 [0.08, 2.03] |
| 5 Overall physical function (follow‐up values) Show forest plot | 25 | Std. Mean Difference (IV, Random, 95% CI) | Subtotals only | |
| Analysis 13.5  Comparison 13 Subanalysis: outcomes by mode of physical activity intervention, Outcome 5 Overall physical function (follow‐up values). | ||||
| 5.1 Aerobic exercise | 14 | 1465 | Std. Mean Difference (IV, Random, 95% CI) | 0.28 [0.15, 0.41] |
| 5.2 Resistance exercise | 3 | 372 | Std. Mean Difference (IV, Random, 95% CI) | 0.23 [‐0.11, 0.57] |
| 5.3 Combined aerobic and resistance exercise | 5 | 202 | Std. Mean Difference (IV, Random, 95% CI) | 0.80 [‐0.04, 1.64] |
| 5.4 Yoga, Tai Chi, and Pilates | 3 | 90 | Std. Mean Difference (IV, Random, 95% CI) | 0.16 [‐0.26, 0.57] |
| 6 Overall physical function (change values) Show forest plot | 13 | Std. Mean Difference (IV, Random, 95% CI) | Subtotals only | |
| Analysis 13.6 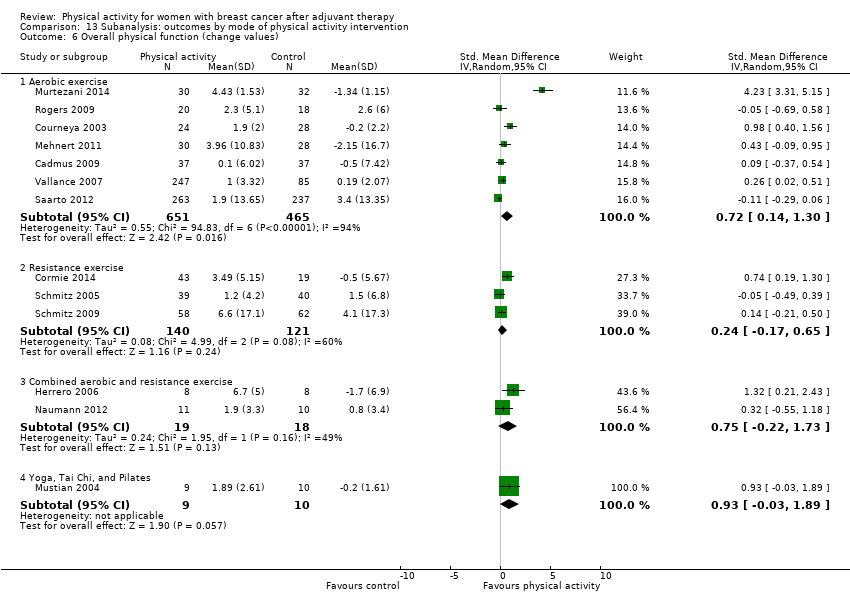 Comparison 13 Subanalysis: outcomes by mode of physical activity intervention, Outcome 6 Overall physical function (change values). | ||||
| 6.1 Aerobic exercise | 7 | 1116 | Std. Mean Difference (IV, Random, 95% CI) | 0.72 [0.14, 1.30] |
| 6.2 Resistance exercise | 3 | 261 | Std. Mean Difference (IV, Random, 95% CI) | 0.24 [‐0.17, 0.65] |
| 6.3 Combined aerobic and resistance exercise | 2 | 37 | Std. Mean Difference (IV, Random, 95% CI) | 0.75 [‐0.22, 1.73] |
| 6.4 Yoga, Tai Chi, and Pilates | 1 | 19 | Std. Mean Difference (IV, Random, 95% CI) | 0.93 [‐0.03, 1.89] |
| 7 Overall role function (follow‐up values) Show forest plot | 18 | Std. Mean Difference (IV, Random, 95% CI) | Subtotals only | |
| Analysis 13.7  Comparison 13 Subanalysis: outcomes by mode of physical activity intervention, Outcome 7 Overall role function (follow‐up values). | ||||
| 7.1 Aerobic exercise | 10 | 1043 | Std. Mean Difference (IV, Random, 95% CI) | 0.28 [0.12, 0.44] |
| 7.2 Resistance exercise | 1 | 79 | Std. Mean Difference (IV, Random, 95% CI) | 0.12 [‐0.32, 0.57] |
| 7.3 Combined aerobic and resistance exercise | 3 | 136 | Std. Mean Difference (IV, Random, 95% CI) | 0.61 [‐1.15, 2.37] |
| 7.4 Yoga, Tai Chi, and Pilates | 4 | 112 | Std. Mean Difference (IV, Random, 95% CI) | 0.11 [‐0.26, 0.48] |
| 8 Overall role function (change values) Show forest plot | 12 | Std. Mean Difference (IV, Random, 95% CI) | Subtotals only | |
| Analysis 13.8  Comparison 13 Subanalysis: outcomes by mode of physical activity intervention, Outcome 8 Overall role function (change values). | ||||
| 8.1 Aerobic exercise | 7 | 1118 | Std. Mean Difference (IV, Random, 95% CI) | 0.16 [‐0.10, 0.43] |
| 8.2 Resistance exercise | 2 | 141 | Std. Mean Difference (IV, Random, 95% CI) | 0.17 [‐0.32, 0.65] |
| 8.3 Combined aerobic and resistance exercise | 2 | 37 | Std. Mean Difference (IV, Random, 95% CI) | 0.12 [‐0.52, 0.77] |
| 8.4 Yoga, Tai Chi, and Pilates | 1 | 19 | Std. Mean Difference (IV, Random, 95% CI) | ‐0.15 [‐1.05, 0.76] |
| 9 Overall social well‐being/function (follow‐up values) Show forest plot | 18 | Std. Mean Difference (IV, Random, 95% CI) | Subtotals only | |
| Analysis 13.9 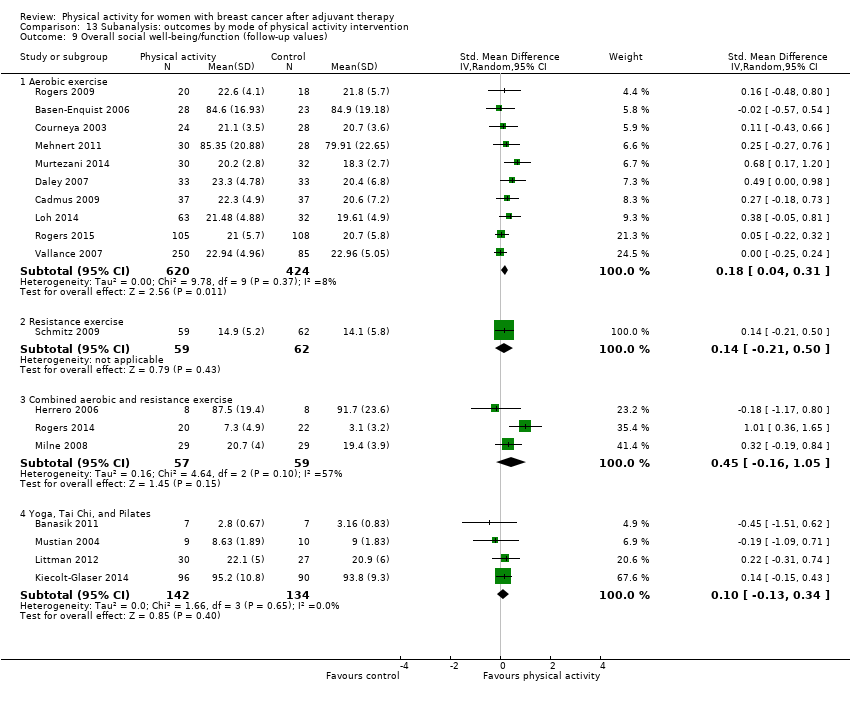 Comparison 13 Subanalysis: outcomes by mode of physical activity intervention, Outcome 9 Overall social well‐being/function (follow‐up values). | ||||
| 9.1 Aerobic exercise | 10 | 1044 | Std. Mean Difference (IV, Random, 95% CI) | 0.18 [0.04, 0.31] |
| 9.2 Resistance exercise | 1 | 121 | Std. Mean Difference (IV, Random, 95% CI) | 0.14 [‐0.21, 0.50] |
| 9.3 Combined aerobic and resistance exercise | 3 | 116 | Std. Mean Difference (IV, Random, 95% CI) | 0.45 [‐0.16, 1.05] |
| 9.4 Yoga, Tai Chi, and Pilates | 4 | 276 | Std. Mean Difference (IV, Random, 95% CI) | 0.10 [‐0.13, 0.34] |
| 10 Overall social well‐being/function (change values) Show forest plot | 12 | Std. Mean Difference (IV, Random, 95% CI) | Subtotals only | |
| Analysis 13.10  Comparison 13 Subanalysis: outcomes by mode of physical activity intervention, Outcome 10 Overall social well‐being/function (change values). | ||||
| 10.1 Aerobic exercise | 7 | 1119 | Std. Mean Difference (IV, Random, 95% CI) | 0.60 [0.07, 1.13] |
| 10.2 Resistance exercise | 2 | 183 | Std. Mean Difference (IV, Random, 95% CI) | 0.11 [‐0.19, 0.41] |
| 10.3 Combined aerobic and resistance exercise | 2 | 63 | Std. Mean Difference (IV, Random, 95% CI) | 0.66 [0.15, 1.17] |
| 10.4 Yoga, Tai Chi, and Pilates | 1 | 19 | Std. Mean Difference (IV, Random, 95% CI) | 0.76 [‐0.18, 1.70] |
| 11 Overall cognitive function (follow‐up values) Show forest plot | 5 | Std. Mean Difference (IV, Random, 95% CI) | Subtotals only | |
| Analysis 13.11  Comparison 13 Subanalysis: outcomes by mode of physical activity intervention, Outcome 11 Overall cognitive function (follow‐up values). | ||||
| 11.1 Aerobic exercise | 2 | 94 | Std. Mean Difference (IV, Random, 95% CI) | 0.24 [‐0.17, 0.65] |
| 11.2 Resistance exercise | 0 | 0 | Std. Mean Difference (IV, Random, 95% CI) | 0.0 [0.0, 0.0] |
| 11.3 Combined aerobic and resistance exercise | 3 | 95 | Std. Mean Difference (IV, Random, 95% CI) | 0.57 [0.15, 0.98] |
| 11.4 Yoga, Tai Chi, and Pilates | 0 | 0 | Std. Mean Difference (IV, Random, 95% CI) | 0.0 [0.0, 0.0] |
| 12 Overall cognitive function (change values) Show forest plot | 5 | Std. Mean Difference (IV, Random, 95% CI) | Subtotals only | |
| Analysis 13.12  Comparison 13 Subanalysis: outcomes by mode of physical activity intervention, Outcome 12 Overall cognitive function (change values). | ||||
| 12.1 Aerobic exercise | 2 | 95 | Std. Mean Difference (IV, Random, 95% CI) | 0.08 [‐0.50, 0.65] |
| 12.2 Resistance exercise | 0 | 0 | Std. Mean Difference (IV, Random, 95% CI) | 0.0 [0.0, 0.0] |
| 12.3 Combined aerobic and resistance exercise | 3 | 577 | Std. Mean Difference (IV, Random, 95% CI) | ‐0.01 [‐0.38, 0.35] |
| 12.4 Yoga, Tai Chi, and Pilates | 0 | 0 | Std. Mean Difference (IV, Random, 95% CI) | 0.0 [0.0, 0.0] |
| 13 Overall general health (follow‐up values) Show forest plot | 10 | Std. Mean Difference (IV, Random, 95% CI) | Subtotals only | |
| Analysis 13.13  Comparison 13 Subanalysis: outcomes by mode of physical activity intervention, Outcome 13 Overall general health (follow‐up values). | ||||
| 13.1 Aerobic exercise | 6 | 293 | Std. Mean Difference (IV, Random, 95% CI) | 0.11 [‐0.29, 0.51] |
| 13.2 Resistance exercise | 1 | 79 | Std. Mean Difference (IV, Random, 95% CI) | 0.10 [‐0.34, 0.55] |
| 13.3 Combined aerobic and resistance exercise | 3 | 118 | Std. Mean Difference (IV, Random, 95% CI) | 0.46 [0.00, 0.91] |
| 13.4 Yoga, Tai Chi, and Pilates | 1 | 18 | Std. Mean Difference (IV, Random, 95% CI) | ‐0.18 [‐1.11, 0.74] |
| 14 Overall general health (change values) Show forest plot | 9 | Std. Mean Difference (IV, Fixed, 95% CI) | Subtotals only | |
| Analysis 13.14  Comparison 13 Subanalysis: outcomes by mode of physical activity intervention, Outcome 14 Overall general health (change values). | ||||
| 14.1 Aerobic exercise | 5 | 710 | Std. Mean Difference (IV, Fixed, 95% CI) | ‐0.02 [‐0.17, 0.13] |
| 14.2 Resistance exercise | 2 | 141 | Std. Mean Difference (IV, Fixed, 95% CI) | 0.23 [‐0.12, 0.57] |
| 14.3 Combined aerobic and resistance exercise | 2 | 76 | Std. Mean Difference (IV, Fixed, 95% CI) | 0.66 [0.17, 1.16] |
| 14.4 Yoga, Tai Chi, and Pilates | 1 | 19 | Std. Mean Difference (IV, Fixed, 95% CI) | ‐0.20 [‐1.10, 0.71] |
| 15 Overall sexual function (follow‐up values) Show forest plot | 5 | Std. Mean Difference (IV, Fixed, 95% CI) | Subtotals only | |
| Analysis 13.15 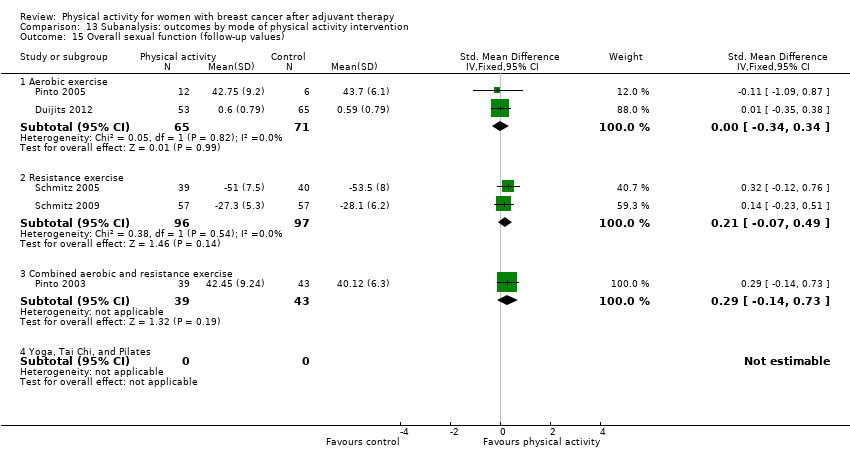 Comparison 13 Subanalysis: outcomes by mode of physical activity intervention, Outcome 15 Overall sexual function (follow‐up values). | ||||
| 15.1 Aerobic exercise | 2 | 136 | Std. Mean Difference (IV, Fixed, 95% CI) | ‐0.00 [‐0.34, 0.34] |
| 15.2 Resistance exercise | 2 | 193 | Std. Mean Difference (IV, Fixed, 95% CI) | 0.21 [‐0.07, 0.49] |
| 15.3 Combined aerobic and resistance exercise | 1 | 82 | Std. Mean Difference (IV, Fixed, 95% CI) | 0.29 [‐0.14, 0.73] |
| 15.4 Yoga, Tai Chi, and Pilates | 0 | 0 | Std. Mean Difference (IV, Fixed, 95% CI) | 0.0 [0.0, 0.0] |
| 16 Overall sexual function (change values) Show forest plot | 3 | Mean Difference (IV, Random, 95% CI) | Subtotals only | |
| Analysis 13.16  Comparison 13 Subanalysis: outcomes by mode of physical activity intervention, Outcome 16 Overall sexual function (change values). | ||||
| 16.1 Aerobic exercise | 1 | 500 | Mean Difference (IV, Random, 95% CI) | 0.5 [‐3.86, 4.86] |
| 16.2 Resistance exercise | 2 | 193 | Mean Difference (IV, Random, 95% CI) | 3.83 [‐1.83, 9.48] |
| 16.3 Combined aerobic and resistance exercise | 0 | 0 | Mean Difference (IV, Random, 95% CI) | 0.0 [0.0, 0.0] |
| 16.4 Yoga, Tai Chi, and Pilates | 0 | 0 | Mean Difference (IV, Random, 95% CI) | 0.0 [0.0, 0.0] |
| 17 Overall sleep (follow‐up values) Show forest plot | 5 | Std. Mean Difference (IV, Fixed, 95% CI) | Subtotals only | |
| Analysis 13.17  Comparison 13 Subanalysis: outcomes by mode of physical activity intervention, Outcome 17 Overall sleep (follow‐up values). | ||||
| 17.1 Aerobic exercise | 2 | 95 | Std. Mean Difference (IV, Fixed, 95% CI) | ‐0.18 [‐0.59, 0.23] |
| 17.2 Resistance exercise | 0 | 0 | Std. Mean Difference (IV, Fixed, 95% CI) | 0.0 [0.0, 0.0] |
| 17.3 Combined aerobic and resistance exercise | 2 | 62 | Std. Mean Difference (IV, Fixed, 95% CI) | ‐0.07 [‐0.57, 0.43] |
| 17.4 Yoga, Tai Chi, and Pilates | 1 | 31 | Std. Mean Difference (IV, Fixed, 95% CI) | 0.15 [‐0.55, 0.86] |
| 18 Overall sleep (change values) Show forest plot | 3 | Std. Mean Difference (IV, Random, 95% CI) | Subtotals only | |
| Analysis 13.18 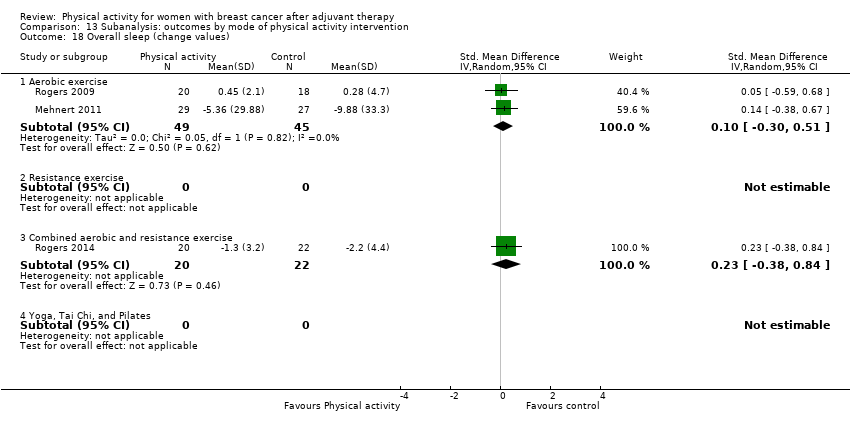 Comparison 13 Subanalysis: outcomes by mode of physical activity intervention, Outcome 18 Overall sleep (change values). | ||||
| 18.1 Aerobic exercise | 2 | 94 | Std. Mean Difference (IV, Random, 95% CI) | 0.10 [‐0.30, 0.51] |
| 18.2 Resistance exercise | 0 | 0 | Std. Mean Difference (IV, Random, 95% CI) | 0.0 [0.0, 0.0] |
| 18.3 Combined aerobic and resistance exercise | 1 | 42 | Std. Mean Difference (IV, Random, 95% CI) | 0.23 [‐0.38, 0.84] |
| 18.4 Yoga, Tai Chi, and Pilates | 0 | 0 | Std. Mean Difference (IV, Random, 95% CI) | 0.0 [0.0, 0.0] |
| 19 Overall anxiety (follow‐up values) Show forest plot | 7 | Std. Mean Difference (IV, Random, 95% CI) | Subtotals only | |
| Analysis 13.19  Comparison 13 Subanalysis: outcomes by mode of physical activity intervention, Outcome 19 Overall anxiety (follow‐up values). | ||||
| 19.1 Aerobic exercise | 4 | 205 | Std. Mean Difference (IV, Random, 95% CI) | ‐0.76 [‐1.37, ‐0.14] |
| 19.2 Resistance exercise | 0 | 0 | Std. Mean Difference (IV, Random, 95% CI) | 0.0 [0.0, 0.0] |
| 19.3 Combined aerobic and resistance exercise | 3 | 121 | Std. Mean Difference (IV, Random, 95% CI) | ‐0.40 [‐0.87, 0.07] |
| 19.4 Yoga, Tai Chi, and Pilates | 0 | 0 | Std. Mean Difference (IV, Random, 95% CI) | 0.0 [0.0, 0.0] |
| 20 Overall anxiety (change values) Show forest plot | 4 | Std. Mean Difference (IV, Fixed, 95% CI) | Subtotals only | |
| Analysis 13.20 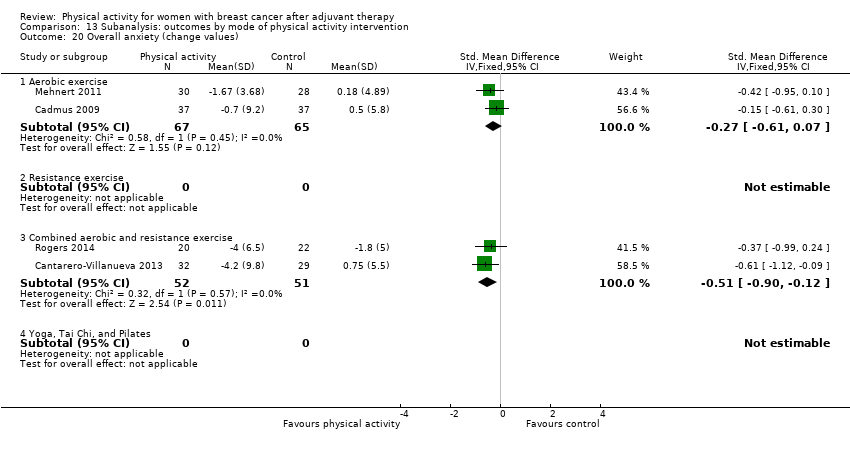 Comparison 13 Subanalysis: outcomes by mode of physical activity intervention, Outcome 20 Overall anxiety (change values). | ||||
| 20.1 Aerobic exercise | 2 | 132 | Std. Mean Difference (IV, Fixed, 95% CI) | ‐0.27 [‐0.61, 0.07] |
| 20.2 Resistance exercise | 0 | 0 | Std. Mean Difference (IV, Fixed, 95% CI) | 0.0 [0.0, 0.0] |
| 20.3 Combined aerobic and resistance exercise | 2 | 103 | Std. Mean Difference (IV, Fixed, 95% CI) | ‐0.51 [‐0.90, ‐0.12] |
| 20.4 Yoga, Tai Chi, and Pilates | 0 | 0 | Std. Mean Difference (IV, Fixed, 95% CI) | 0.0 [0.0, 0.0] |
| 21 Overall depression (follow‐up values) Show forest plot | 12 | Std. Mean Difference (IV, Random, 95% CI) | Subtotals only | |
| Analysis 13.21  Comparison 13 Subanalysis: outcomes by mode of physical activity intervention, Outcome 21 Overall depression (follow‐up values). | ||||
| 21.1 Aerobic exercise | 6 | 273 | Std. Mean Difference (IV, Random, 95% CI) | ‐0.32 [‐0.78, 0.14] |
| 21.2 Resistance exercise | 0 | 0 | Std. Mean Difference (IV, Random, 95% CI) | 0.0 [0.0, 0.0] |
| 21.3 Combined aerobic and resistance exercise | 5 | 187 | Std. Mean Difference (IV, Random, 95% CI) | ‐0.33 [‐0.90, 0.24] |
| 21.4 Yoga, Tai Chi, and Pilates | 2 | 217 | Std. Mean Difference (IV, Random, 95% CI) | ‐0.23 [‐0.61, 0.14] |
| 22 Overall depression (change values) Show forest plot | 7 | Std. Mean Difference (IV, Random, 95% CI) | Subtotals only | |
| Analysis 13.22 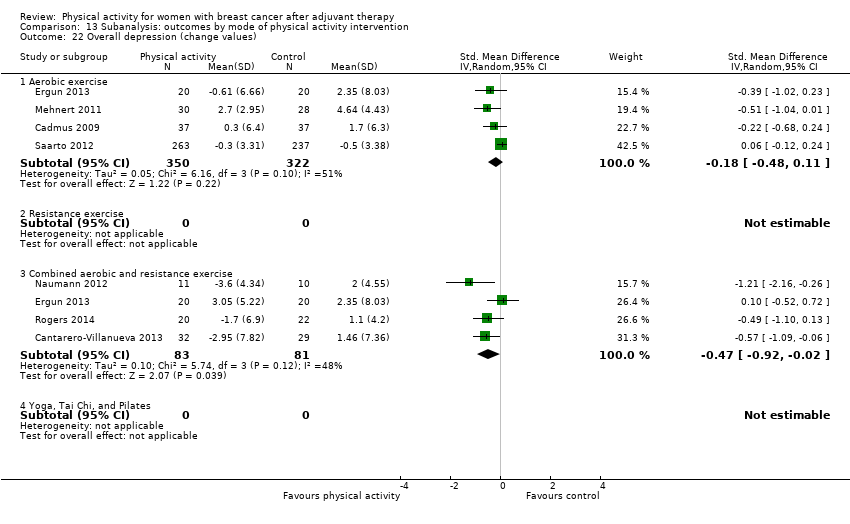 Comparison 13 Subanalysis: outcomes by mode of physical activity intervention, Outcome 22 Overall depression (change values). | ||||
| 22.1 Aerobic exercise | 4 | 672 | Std. Mean Difference (IV, Random, 95% CI) | ‐0.18 [‐0.48, 0.11] |
| 22.2 Resistance exercise | 0 | 0 | Std. Mean Difference (IV, Random, 95% CI) | 0.0 [0.0, 0.0] |
| 22.3 Combined aerobic and resistance exercise | 4 | 164 | Std. Mean Difference (IV, Random, 95% CI) | ‐0.47 [‐0.92, ‐0.02] |
| 22.4 Yoga, Tai Chi, and Pilates | 0 | 0 | Std. Mean Difference (IV, Random, 95% CI) | 0.0 [0.0, 0.0] |
| 23 Overall fatigue (follow‐up values) Show forest plot | 25 | Std. Mean Difference (IV, Random, 95% CI) | Subtotals only | |
| Analysis 13.23  Comparison 13 Subanalysis: outcomes by mode of physical activity intervention, Outcome 23 Overall fatigue (follow‐up values). | ||||
| 23.1 Aerobic exercise | 11 | 925 | Std. Mean Difference (IV, Random, 95% CI) | ‐0.24 [‐0.41, ‐0.07] |
| 23.2 Resistance exercise | 1 | 67 | Std. Mean Difference (IV, Random, 95% CI) | 0.23 [‐0.25, 0.72] |
| 23.3 Combined aerobic and resistance exercise | 9 | 642 | Std. Mean Difference (IV, Random, 95% CI) | ‐0.48 [‐0.83, ‐0.13] |
| 23.4 Yoga, Tai Chi, and Pilates | 5 | 311 | Std. Mean Difference (IV, Random, 95% CI) | ‐0.36 [‐0.58, ‐0.13] |
| 24 Overall fatigue (change values) Show forest plot | 12 | Std. Mean Difference (IV, Random, 95% CI) | Subtotals only | |
| Analysis 13.24 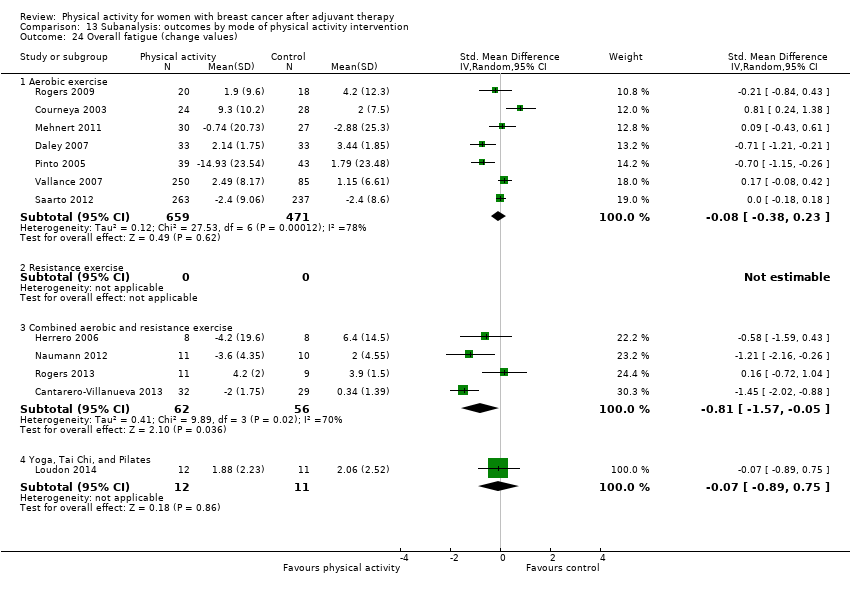 Comparison 13 Subanalysis: outcomes by mode of physical activity intervention, Outcome 24 Overall fatigue (change values). | ||||
| 24.1 Aerobic exercise | 7 | 1130 | Std. Mean Difference (IV, Random, 95% CI) | ‐0.08 [‐0.38, 0.23] |
| 24.2 Resistance exercise | 0 | 0 | Std. Mean Difference (IV, Random, 95% CI) | 0.0 [0.0, 0.0] |
| 24.3 Combined aerobic and resistance exercise | 4 | 118 | Std. Mean Difference (IV, Random, 95% CI) | ‐0.81 [‐1.57, ‐0.05] |
| 24.4 Yoga, Tai Chi, and Pilates | 1 | 23 | Std. Mean Difference (IV, Random, 95% CI) | ‐0.07 [‐0.89, 0.75] |
| 25 Overall pain/disability (follow‐up values) Show forest plot | 9 | Std. Mean Difference (IV, Random, 95% CI) | Subtotals only | |
| Analysis 13.25  Comparison 13 Subanalysis: outcomes by mode of physical activity intervention, Outcome 25 Overall pain/disability (follow‐up values). | ||||
| 25.1 Aerobic exercise | 5 | 397 | Std. Mean Difference (IV, Random, 95% CI) | 0.11 [‐0.15, 0.37] |
| 25.2 Resistance exercise | 0 | 0 | Std. Mean Difference (IV, Random, 95% CI) | 0.0 [0.0, 0.0] |
| 25.3 Combined aerobic and resistance exercise | 2 | 96 | Std. Mean Difference (IV, Random, 95% CI) | 0.13 [‐0.29, 0.54] |
| 25.4 Yoga, Tai Chi, and Pilates | 2 | 42 | Std. Mean Difference (IV, Random, 95% CI) | ‐0.18 [‐0.78, 0.43] |
| 26 Overall pain/disability (change values) Show forest plot | 5 | Std. Mean Difference (IV, Random, 95% CI) | Subtotals only | |
| Analysis 13.26  Comparison 13 Subanalysis: outcomes by mode of physical activity intervention, Outcome 26 Overall pain/disability (change values). | ||||
| 26.1 Aerobic exercise | 2 | 132 | Std. Mean Difference (IV, Random, 95% CI) | ‐0.03 [‐0.44, 0.39] |
| 26.2 Resistance exercise | 1 | 62 | Std. Mean Difference (IV, Random, 95% CI) | 0.22 [‐0.33, 0.76] |
| 26.3 Combined aerobic and resistance exercise | 1 | 83 | Std. Mean Difference (IV, Random, 95% CI) | ‐0.35 [‐0.79, 0.08] |
| 26.4 Yoga, Tai Chi, and Pilates | 1 | 19 | Std. Mean Difference (IV, Random, 95% CI) | ‐0.15 [‐1.06, 0.75] |
| 27 Overall self‐esteem/body image (follow‐up values) Show forest plot | 12 | Std. Mean Difference (IV, Random, 95% CI) | Subtotals only | |
| Analysis 13.27  Comparison 13 Subanalysis: outcomes by mode of physical activity intervention, Outcome 27 Overall self‐esteem/body image (follow‐up values). | ||||
| 27.1 Aerobic exercise | 7 | 364 | Std. Mean Difference (IV, Random, 95% CI) | 0.29 [‐0.07, 0.64] |
| 27.2 Resistance exercise | 2 | 143 | Std. Mean Difference (IV, Random, 95% CI) | 0.06 [‐0.27, 0.39] |
| 27.3 Combined aerobic and resistance exercise | 4 | 161 | Std. Mean Difference (IV, Random, 95% CI) | 0.14 [‐0.46, 0.74] |
| 27.4 Yoga, Tai Chi, and Pilates | 1 | 23 | Std. Mean Difference (IV, Random, 95% CI) | 0.20 [‐0.62, 1.02] |
| 28 Overall self‐esteem/body image (change values) Show forest plot | 9 | Std. Mean Difference (IV, Random, 95% CI) | Subtotals only | |
| Analysis 13.28  Comparison 13 Subanalysis: outcomes by mode of physical activity intervention, Outcome 28 Overall self‐esteem/body image (change values). | ||||
| 28.1 Aerobic exercise | 6 | 771 | Std. Mean Difference (IV, Random, 95% CI) | 0.14 [‐0.12, 0.39] |
| 28.2 Resistance exercise | 2 | 143 | Std. Mean Difference (IV, Random, 95% CI) | ‐0.29 [‐0.88, 0.30] |
| 28.3 Combined aerobic and resistance exercise | 2 | 81 | Std. Mean Difference (IV, Random, 95% CI) | 0.10 [‐0.54, 0.75] |
| 28.4 Yoga, Tai Chi, and Pilates | 1 | 21 | Std. Mean Difference (IV, Random, 95% CI) | 3.42 [1.99, 4.86] |
| 29 Overall cardiorespiratory fitness (follow‐up values) Show forest plot | 23 | Std. Mean Difference (IV, Random, 95% CI) | Subtotals only | |
| Analysis 13.29 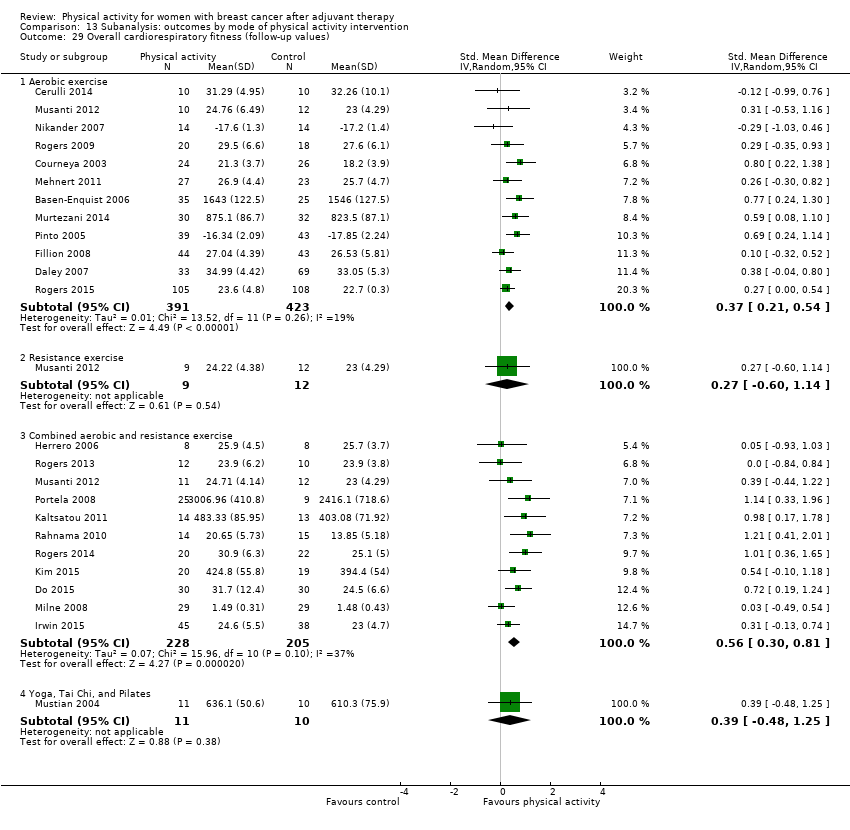 Comparison 13 Subanalysis: outcomes by mode of physical activity intervention, Outcome 29 Overall cardiorespiratory fitness (follow‐up values). | ||||
| 29.1 Aerobic exercise | 12 | 814 | Std. Mean Difference (IV, Random, 95% CI) | 0.37 [0.21, 0.54] |
| 29.2 Resistance exercise | 1 | 21 | Std. Mean Difference (IV, Random, 95% CI) | 0.27 [‐0.60, 1.14] |
| 29.3 Combined aerobic and resistance exercise | 11 | 433 | Std. Mean Difference (IV, Random, 95% CI) | 0.56 [0.30, 0.81] |
| 29.4 Yoga, Tai Chi, and Pilates | 1 | 21 | Std. Mean Difference (IV, Random, 95% CI) | 0.39 [‐0.48, 1.25] |
| 30 Overall cardiorespiratory fitness (change values) Show forest plot | 9 | Std. Mean Difference (IV, Random, 95% CI) | Subtotals only | |
| Analysis 13.30  Comparison 13 Subanalysis: outcomes by mode of physical activity intervention, Outcome 30 Overall cardiorespiratory fitness (change values). | ||||
| 30.1 Aerobic exercise | 5 | 685 | Std. Mean Difference (IV, Random, 95% CI) | 0.79 [0.17, 1.42] |
| 30.2 Resistance exercise | 1 | 21 | Std. Mean Difference (IV, Random, 95% CI) | ‐0.04 [‐0.91, 0.82] |
| 30.3 Combined aerobic and resistance exercise | 5 | 181 | Std. Mean Difference (IV, Random, 95% CI) | 0.75 [0.18, 1.31] |
| 30.4 Yoga, Tai Chi, and Pilates | 0 | 0 | Std. Mean Difference (IV, Random, 95% CI) | 0.0 [0.0, 0.0] |
| 31 Overall self‐reported physical activity (follow‐up values) Show forest plot | 17 | Std. Mean Difference (IV, Random, 95% CI) | Subtotals only | |
| Analysis 13.31  Comparison 13 Subanalysis: outcomes by mode of physical activity intervention, Outcome 31 Overall self‐reported physical activity (follow‐up values). | ||||
| 31.1 Aerobic exercise | 10 | 1011 | Std. Mean Difference (IV, Random, 95% CI) | 0.69 [0.44, 0.94] |
| 31.2 Resistance exercise | 2 | 331 | Std. Mean Difference (IV, Random, 95% CI) | 0.08 [‐0.13, 0.30] |
| 31.3 Combined aerobic and resistance exercise | 3 | 421 | Std. Mean Difference (IV, Random, 95% CI) | 0.53 [‐0.05, 1.10] |
| 31.4 Yoga, Tai Chi, and Pilates | 2 | 249 | Std. Mean Difference (IV, Random, 95% CI) | 0.33 [0.08, 0.58] |
| 32 Overall self‐reported physical activity (change values) Show forest plot | 8 | Std. Mean Difference (IV, Random, 95% CI) | Subtotals only | |
| Analysis 13.32  Comparison 13 Subanalysis: outcomes by mode of physical activity intervention, Outcome 32 Overall self‐reported physical activity (change values). | ||||
| 32.1 Aerobic exercise | 6 | 1086 | Std. Mean Difference (IV, Random, 95% CI) | 0.59 [0.20, 0.97] |
| 32.2 Resistance exercise | 1 | 105 | Std. Mean Difference (IV, Random, 95% CI) | 0.21 [‐0.17, 0.60] |
| 32.3 Combined aerobic and resistance exercise | 1 | 83 | Std. Mean Difference (IV, Random, 95% CI) | 0.94 [0.48, 1.40] |
| 32.4 Yoga, Tai Chi, and Pilates | 0 | 0 | Std. Mean Difference (IV, Random, 95% CI) | 0.0 [0.0, 0.0] |
| 33 Overall objective physical activity (follow‐up values) Show forest plot | 11 | Std. Mean Difference (IV, Random, 95% CI) | Subtotals only | |
| Analysis 13.33  Comparison 13 Subanalysis: outcomes by mode of physical activity intervention, Outcome 33 Overall objective physical activity (follow‐up values). | ||||
| 33.1 Aerobic exercise | 8 | 876 | Std. Mean Difference (IV, Random, 95% CI) | 0.43 [0.15, 0.70] |
| 33.2 Resistance exercise | 0 | 0 | Std. Mean Difference (IV, Random, 95% CI) | 0.0 [0.0, 0.0] |
| 33.3 Combined aerobic and resistance exercise | 3 | 394 | Std. Mean Difference (IV, Random, 95% CI) | 0.54 [‐0.31, 1.40] |
| 33.4 Yoga, Tai Chi, and Pilates | 0 | 0 | Std. Mean Difference (IV, Random, 95% CI) | 0.0 [0.0, 0.0] |
| 34 Overall objective physical activity (change values) Show forest plot | 5 | Std. Mean Difference (IV, Random, 95% CI) | Subtotals only | |
| Analysis 13.34 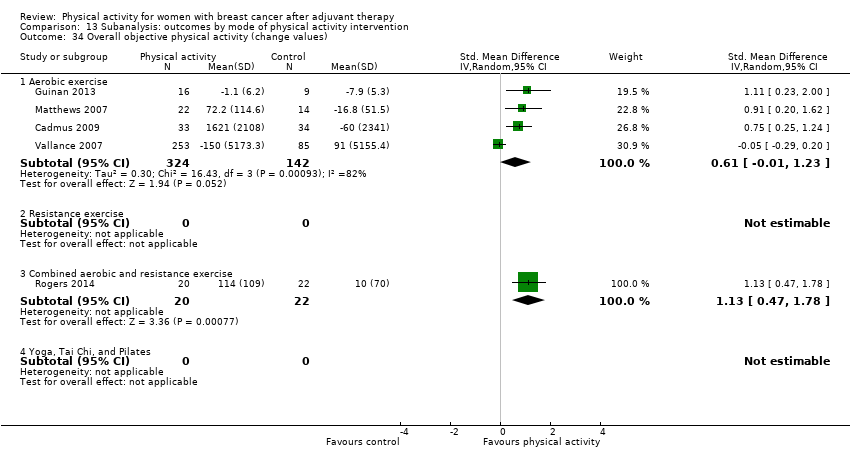 Comparison 13 Subanalysis: outcomes by mode of physical activity intervention, Outcome 34 Overall objective physical activity (change values). | ||||
| 34.1 Aerobic exercise | 4 | 466 | Std. Mean Difference (IV, Random, 95% CI) | 0.61 [‐0.01, 1.23] |
| 34.2 Resistance exercise | 0 | 0 | Std. Mean Difference (IV, Random, 95% CI) | 0.0 [0.0, 0.0] |
| 34.3 Combined aerobic and resistance exercise | 1 | 42 | Std. Mean Difference (IV, Random, 95% CI) | 1.13 [0.47, 1.78] |
| 34.4 Yoga, Tai Chi, and Pilates | 0 | 0 | Std. Mean Difference (IV, Random, 95% CI) | 0.0 [0.0, 0.0] |
| 35 Mass (follow‐up values) Show forest plot | 16 | Mean Difference (IV, Fixed, 95% CI) | Subtotals only | |
| Analysis 13.35  Comparison 13 Subanalysis: outcomes by mode of physical activity intervention, Outcome 35 Mass (follow‐up values). | ||||
| 35.1 Aerobic exercise | 7 | 411 | Mean Difference (IV, Fixed, 95% CI) | ‐1.29 [‐4.06, 1.47] |
| 35.2 Resistance exercise | 3 | 410 | Mean Difference (IV, Fixed, 95% CI) | 0.26 [‐0.67, 1.20] |
| 35.3 Combined aerobic and resistance exercise | 3 | 127 | Mean Difference (IV, Fixed, 95% CI) | ‐2.46 [‐7.24, 2.33] |
| 35.4 Yoga, Tai Chi, and Pilates | 3 | 262 | Mean Difference (IV, Fixed, 95% CI) | ‐0.01 [‐0.78, 0.76] |
| 36 Mass (change values) Show forest plot | 11 | Mean Difference (IV, Random, 95% CI) | Subtotals only | |
| Analysis 13.36  Comparison 13 Subanalysis: outcomes by mode of physical activity intervention, Outcome 36 Mass (change values). | ||||
| 36.1 Aerobic exercise | 5 | 679 | Mean Difference (IV, Random, 95% CI) | ‐0.74 [‐1.58, 0.09] |
| 36.2 Resistance exercise | 2 | 209 | Mean Difference (IV, Random, 95% CI) | 0.10 [‐0.15, 0.34] |
| 36.3 Combined aerobic and resistance exercise | 3 | 140 | Mean Difference (IV, Random, 95% CI) | ‐0.55 [‐1.99, 0.90] |
| 36.4 Yoga, Tai Chi, and Pilates | 1 | 19 | Mean Difference (IV, Random, 95% CI) | ‐0.90 [‐2.40, 0.60] |
| 37 BMI (follow‐up values) Show forest plot | 17 | Mean Difference (IV, Fixed, 95% CI) | Subtotals only | |
| Analysis 13.37 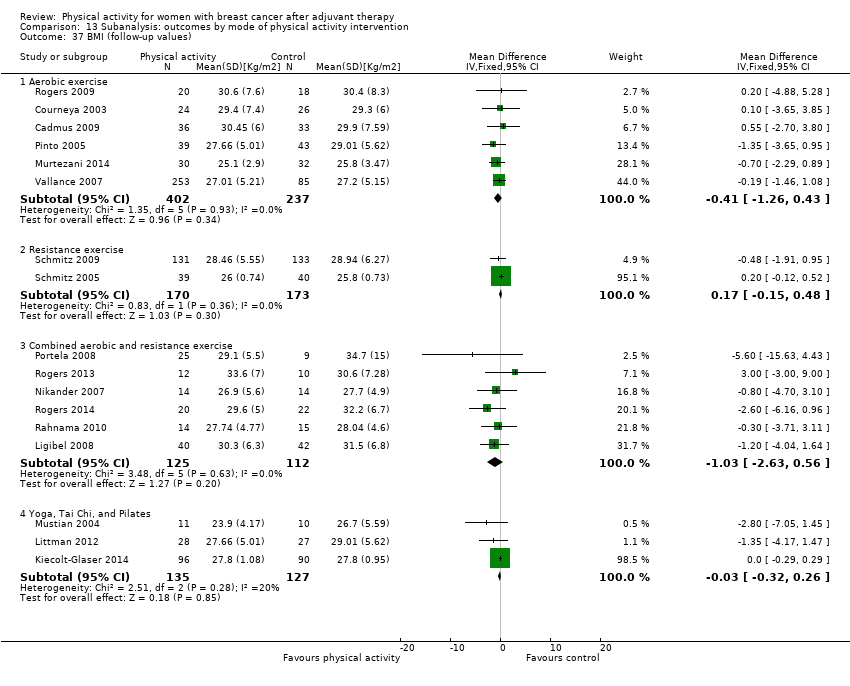 Comparison 13 Subanalysis: outcomes by mode of physical activity intervention, Outcome 37 BMI (follow‐up values). | ||||
| 37.1 Aerobic exercise | 6 | 639 | Mean Difference (IV, Fixed, 95% CI) | ‐0.41 [‐1.26, 0.43] |
| 37.2 Resistance exercise | 2 | 343 | Mean Difference (IV, Fixed, 95% CI) | 0.17 [‐0.15, 0.48] |
| 37.3 Combined aerobic and resistance exercise | 6 | 237 | Mean Difference (IV, Fixed, 95% CI) | ‐1.03 [‐2.63, 0.56] |
| 37.4 Yoga, Tai Chi, and Pilates | 3 | 262 | Mean Difference (IV, Fixed, 95% CI) | ‐0.03 [‐0.32, 0.26] |
| 38 BMI (change values) Show forest plot | 8 | Mean Difference (IV, Random, 95% CI) | Subtotals only | |
| Analysis 13.38  Comparison 13 Subanalysis: outcomes by mode of physical activity intervention, Outcome 38 BMI (change values). | ||||
| 38.1 Aerobic exercise | 2 | 112 | Mean Difference (IV, Random, 95% CI) | ‐0.48 [‐0.84, ‐0.13] |
| 38.2 Resistance exercise | 2 | 209 | Mean Difference (IV, Random, 95% CI) | ‐0.01 [‐0.08, 0.06] |
| 38.3 Combined aerobic and resistance exercise | 3 | 145 | Mean Difference (IV, Random, 95% CI) | ‐0.02 [‐0.28, 0.24] |
| 38.4 Yoga, Tai Chi, and Pilates | 1 | 19 | Mean Difference (IV, Random, 95% CI) | ‐0.71 [‐1.33, ‐0.09] |
| 39 Overall body fat (follow‐up values) Show forest plot | 18 | Std. Mean Difference (IV, Random, 95% CI) | Subtotals only | |
| Analysis 13.39 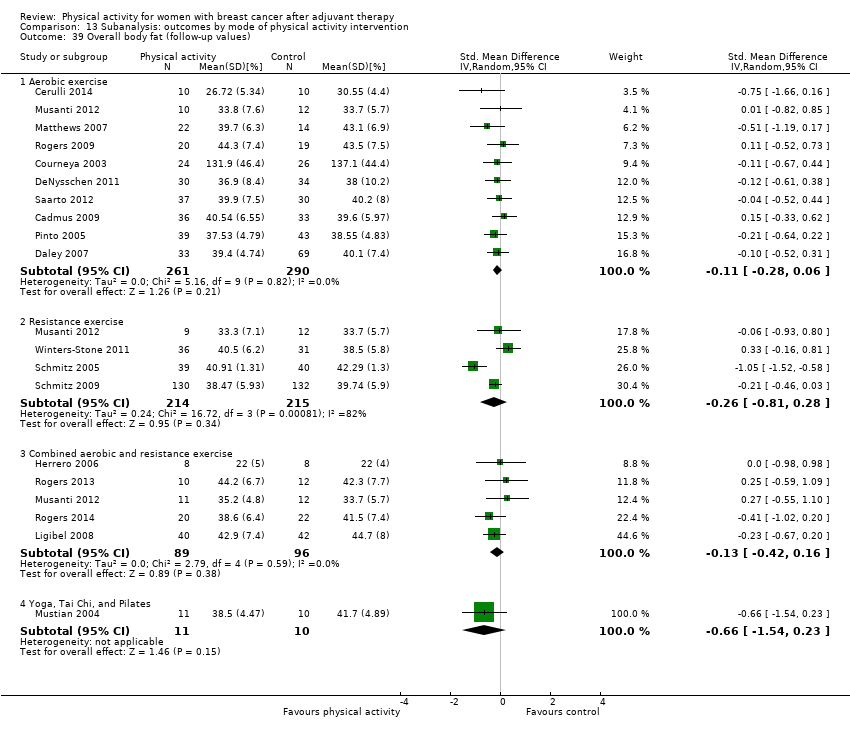 Comparison 13 Subanalysis: outcomes by mode of physical activity intervention, Outcome 39 Overall body fat (follow‐up values). | ||||
| 39.1 Aerobic exercise | 10 | 551 | Std. Mean Difference (IV, Random, 95% CI) | ‐0.11 [‐0.28, 0.06] |
| 39.2 Resistance exercise | 4 | 429 | Std. Mean Difference (IV, Random, 95% CI) | ‐0.26 [‐0.81, 0.28] |
| 39.3 Combined aerobic and resistance exercise | 5 | 185 | Std. Mean Difference (IV, Random, 95% CI) | ‐0.13 [‐0.42, 0.16] |
| 39.4 Yoga, Tai Chi, and Pilates | 1 | 21 | Std. Mean Difference (IV, Random, 95% CI) | ‐0.66 [‐1.54, 0.23] |
| 40 Overall body fat (change values) Show forest plot | 9 | Std. Mean Difference (IV, Random, 95% CI) | Subtotals only | |
| Analysis 13.40 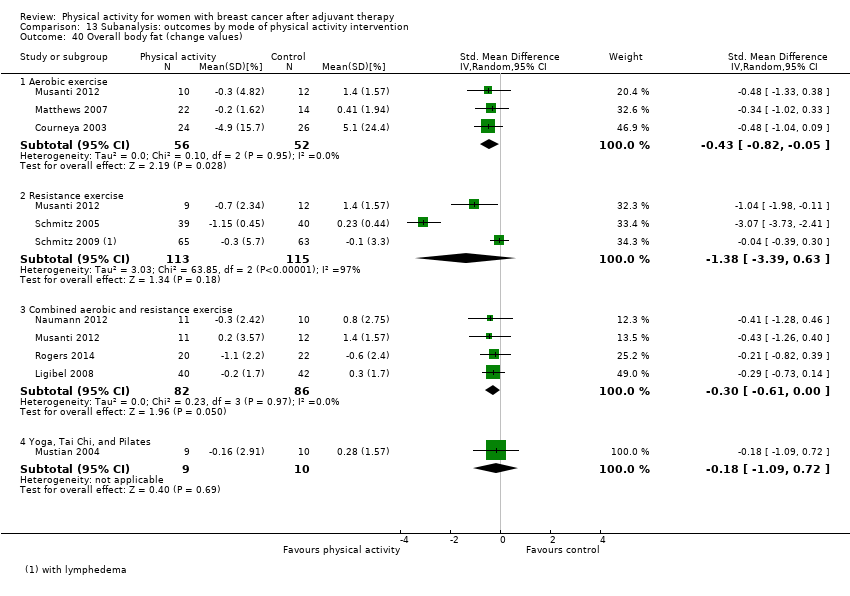 Comparison 13 Subanalysis: outcomes by mode of physical activity intervention, Outcome 40 Overall body fat (change values). | ||||
| 40.1 Aerobic exercise | 3 | 108 | Std. Mean Difference (IV, Random, 95% CI) | ‐0.43 [‐0.82, ‐0.05] |
| 40.2 Resistance exercise | 3 | 228 | Std. Mean Difference (IV, Random, 95% CI) | ‐1.38 [‐3.39, 0.63] |
| 40.3 Combined aerobic and resistance exercise | 4 | 168 | Std. Mean Difference (IV, Random, 95% CI) | ‐0.30 [‐0.61, 0.00] |
| 40.4 Yoga, Tai Chi, and Pilates | 1 | 19 | Std. Mean Difference (IV, Random, 95% CI) | ‐0.18 [‐1.09, 0.72] |
| 41 Lower body strength (follow‐up values) Show forest plot | 10 | Std. Mean Difference (IV, Random, 95% CI) | Subtotals only | |
| Analysis 13.41 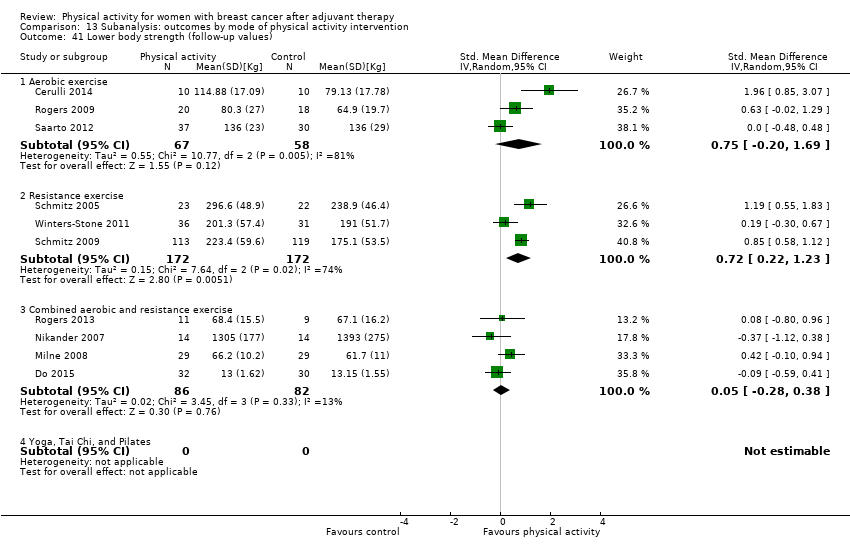 Comparison 13 Subanalysis: outcomes by mode of physical activity intervention, Outcome 41 Lower body strength (follow‐up values). | ||||
| 41.1 Aerobic exercise | 3 | 125 | Std. Mean Difference (IV, Random, 95% CI) | 0.75 [‐0.20, 1.69] |
| 41.2 Resistance exercise | 3 | 344 | Std. Mean Difference (IV, Random, 95% CI) | 0.72 [0.22, 1.23] |
| 41.3 Combined aerobic and resistance exercise | 4 | 168 | Std. Mean Difference (IV, Random, 95% CI) | 0.05 [‐0.28, 0.38] |
| 41.4 Yoga, Tai Chi, and Pilates | 0 | 0 | Std. Mean Difference (IV, Random, 95% CI) | 0.0 [0.0, 0.0] |
| 42 Lower body strength (change values) Show forest plot | 8 | Std. Mean Difference (IV, Random, 95% CI) | Subtotals only | |
| Analysis 13.42  Comparison 13 Subanalysis: outcomes by mode of physical activity intervention, Outcome 42 Lower body strength (change values). | ||||
| 42.1 Aerobic exercise | 1 | 33 | Std. Mean Difference (IV, Random, 95% CI) | 1.17 [0.37, 1.97] |
| 42.2 Resistance exercise | 4 | 562 | Std. Mean Difference (IV, Random, 95% CI) | 0.85 [0.48, 1.22] |
| 42.3 Combined aerobic and resistance exercise | 3 | 125 | Std. Mean Difference (IV, Random, 95% CI) | 0.28 [‐0.37, 0.93] |
| 42.4 Yoga, Tai Chi, and Pilates | 0 | 0 | Std. Mean Difference (IV, Random, 95% CI) | 0.0 [0.0, 0.0] |
| 43 Upper body strength (follow‐up values) Show forest plot | 13 | Std. Mean Difference (IV, Random, 95% CI) | Subtotals only | |
| Analysis 13.43  Comparison 13 Subanalysis: outcomes by mode of physical activity intervention, Outcome 43 Upper body strength (follow‐up values). | ||||
| 43.1 Aerobic exercise | 5 | 175 | Std. Mean Difference (IV, Random, 95% CI) | 0.35 [0.05, 0.65] |
| 43.2 Resistance exercise | 4 | 365 | Std. Mean Difference (IV, Random, 95% CI) | 0.80 [0.28, 1.33] |
| 43.3 Combined aerobic and resistance exercise | 5 | 231 | Std. Mean Difference (IV, Random, 95% CI) | 0.25 [‐0.47, 0.97] |
| 43.4 Yoga, Tai Chi, and Pilates | 1 | 21 | Std. Mean Difference (IV, Random, 95% CI) | 0.60 [‐0.28, 1.49] |
| 44 Upper body strength (change values) Show forest plot | 8 | Std. Mean Difference (IV, Random, 95% CI) | Subtotals only | |
| Analysis 13.44  Comparison 13 Subanalysis: outcomes by mode of physical activity intervention, Outcome 44 Upper body strength (change values). | ||||
| 44.1 Aerobic exercise | 1 | 22 | Std. Mean Difference (IV, Random, 95% CI) | 0.36 [‐0.48, 1.21] |
| 44.2 Resistance exercise | 5 | 583 | Std. Mean Difference (IV, Random, 95% CI) | 0.96 [0.43, 1.49] |
| 44.3 Combined aerobic and resistance exercise | 3 | 168 | Std. Mean Difference (IV, Random, 95% CI) | 0.07 [‐0.34, 0.48] |
| 44.4 Yoga, Tai Chi, and Pilates | 1 | 83 | Std. Mean Difference (IV, Random, 95% CI) | 1.30 [0.82, 1.78] |
| 45 Bone mineral density ‐ femoral neck (follow‐up and change values) Show forest plot | 4 | Std. Mean Difference (IV, Random, 95% CI) | Subtotals only | |
| Analysis 13.45  Comparison 13 Subanalysis: outcomes by mode of physical activity intervention, Outcome 45 Bone mineral density ‐ femoral neck (follow‐up and change values). | ||||
| 45.1 Aerobic exercise | 1 | 457 | Std. Mean Difference (IV, Random, 95% CI) | 0.18 [‐0.00, 0.37] |
| 45.2 Resistance exercise | 2 | 290 | Std. Mean Difference (IV, Random, 95% CI) | 0.41 [‐0.09, 0.91] |
| 45.3 Combined aerobic and resistance exercise | 1 | 39 | Std. Mean Difference (IV, Random, 95% CI) | ‐0.37 [‐1.00, 0.27] |
| 45.4 Yoga, Tai Chi, and Pilates | 0 | 0 | Std. Mean Difference (IV, Random, 95% CI) | 0.0 [0.0, 0.0] |
| 46 Bone mineral density ‐ lumbar spine (follow‐up and change values) Show forest plot | 4 | Std. Mean Difference (IV, Random, 95% CI) | Subtotals only | |
| Analysis 13.46 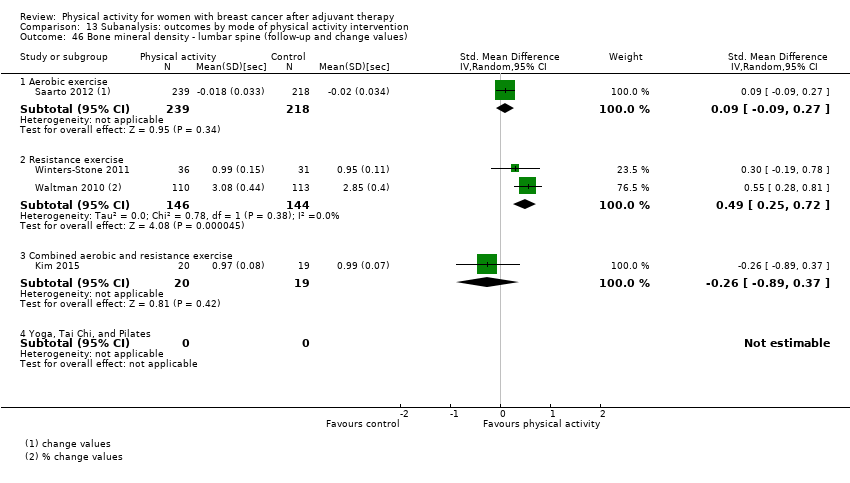 Comparison 13 Subanalysis: outcomes by mode of physical activity intervention, Outcome 46 Bone mineral density ‐ lumbar spine (follow‐up and change values). | ||||
| 46.1 Aerobic exercise | 1 | 457 | Std. Mean Difference (IV, Random, 95% CI) | 0.09 [‐0.09, 0.27] |
| 46.2 Resistance exercise | 2 | 290 | Std. Mean Difference (IV, Random, 95% CI) | 0.49 [0.25, 0.72] |
| 46.3 Combined aerobic and resistance exercise | 1 | 39 | Std. Mean Difference (IV, Random, 95% CI) | ‐0.26 [‐0.89, 0.37] |
| 46.4 Yoga, Tai Chi, and Pilates | 0 | 0 | Std. Mean Difference (IV, Random, 95% CI) | 0.0 [0.0, 0.0] |
| 47 Bone mineral density ‐ total hip (follow‐up and change values) Show forest plot | 3 | Std. Mean Difference (IV, Random, 95% CI) | Subtotals only | |
| Analysis 13.47  Comparison 13 Subanalysis: outcomes by mode of physical activity intervention, Outcome 47 Bone mineral density ‐ total hip (follow‐up and change values). | ||||
| 47.1 Aerobic exercise | 0 | 0 | Std. Mean Difference (IV, Random, 95% CI) | 0.0 [0.0, 0.0] |
| 47.2 Resistance exercise | 2 | 290 | Std. Mean Difference (IV, Random, 95% CI) | 0.64 [‐0.20, 1.48] |
| 47.3 Combined aerobic and resistance exercise | 1 | 39 | Std. Mean Difference (IV, Random, 95% CI) | 10.34 [7.84, 12.84] |
| 47.4 Yoga, Tai Chi, and Pilates | 0 | 0 | Std. Mean Difference (IV, Random, 95% CI) | 0.0 [0.0, 0.0] |
| Outcome or subgroup title | No. of studies | No. of participants | Statistical method | Effect size |
| 1 Overall HRQoL (follow‐up values) Show forest plot | 22 | Std. Mean Difference (IV, Random, 95% CI) | Subtotals only | |
| Analysis 14.1  Comparison 14 Subanalysis: outcomes by intensity of physical activity intervention, Outcome 1 Overall HRQoL (follow‐up values). | ||||
| 1.1 Light‐to‐moderate intensity | 16 | 983 | Std. Mean Difference (IV, Random, 95% CI) | 0.51 [0.25, 0.77] |
| 1.2 Moderate‐to‐high intensity | 6 | 820 | Std. Mean Difference (IV, Random, 95% CI) | 0.19 [‐0.05, 0.43] |
| 2 Overall HRQoL (change values) Show forest plot | 14 | Std. Mean Difference (IV, Random, 95% CI) | Subtotals only | |
| Analysis 14.2  Comparison 14 Subanalysis: outcomes by intensity of physical activity intervention, Outcome 2 Overall HRQoL (change values). | ||||
| 2.1 Light‐to‐moderate intensity | 10 | 534 | Std. Mean Difference (IV, Random, 95% CI) | 0.99 [0.39, 1.60] |
| 2.2 Moderate‐to‐high intensity | 4 | 925 | Std. Mean Difference (IV, Random, 95% CI) | 0.28 [‐0.11, 0.67] |
| 3 Overall emotional function/mental health (follow‐up values) Show forest plot | 26 | Std. Mean Difference (IV, Random, 95% CI) | Subtotals only | |
| Analysis 14.3  Comparison 14 Subanalysis: outcomes by intensity of physical activity intervention, Outcome 3 Overall emotional function/mental health (follow‐up values). | ||||
| 3.1 Light‐to‐moderate intensity | 21 | 1489 | Std. Mean Difference (IV, Random, 95% CI) | 0.19 [0.08, 0.30] |
| 3.2 Moderate‐to‐high intensity | 5 | 613 | Std. Mean Difference (IV, Random, 95% CI) | 0.29 [‐0.07, 0.65] |
| 4 Overall emotional function/mental health (change values) Show forest plot | 15 | Std. Mean Difference (IV, Random, 95% CI) | Subtotals only | |
| Analysis 14.4  Comparison 14 Subanalysis: outcomes by intensity of physical activity intervention, Outcome 4 Overall emotional function/mental health (change values). | ||||
| 4.1 Light‐to‐moderate intensity | 10 | 592 | Std. Mean Difference (IV, Random, 95% CI) | 0.41 [0.04, 0.77] |
| 4.2 Moderate‐to‐high intensity | 5 | 987 | Std. Mean Difference (IV, Random, 95% CI) | 0.07 [‐0.07, 0.21] |
| 5 Overall physical function (follow‐up values) Show forest plot | 25 | Std. Mean Difference (IV, Random, 95% CI) | Subtotals only | |
| Analysis 14.5 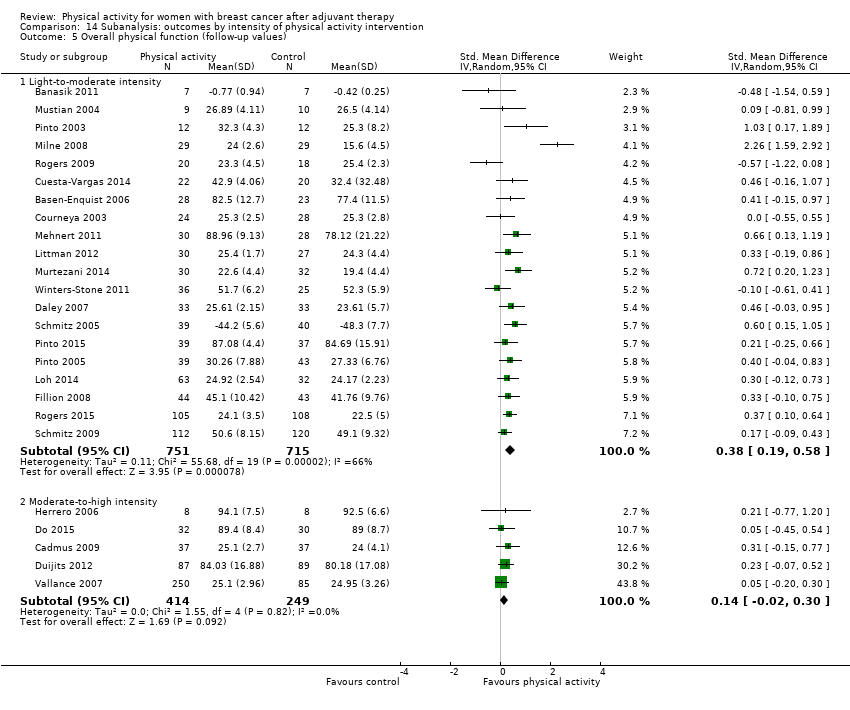 Comparison 14 Subanalysis: outcomes by intensity of physical activity intervention, Outcome 5 Overall physical function (follow‐up values). | ||||
| 5.1 Light‐to‐moderate intensity | 20 | 1466 | Std. Mean Difference (IV, Random, 95% CI) | 0.38 [0.19, 0.58] |
| 5.2 Moderate‐to‐high intensity | 5 | 663 | Std. Mean Difference (IV, Random, 95% CI) | 0.14 [‐0.02, 0.30] |
| 6 Overall physical function (change values) Show forest plot | 13 | Std. Mean Difference (IV, Random, 95% CI) | Subtotals only | |
| Analysis 14.6 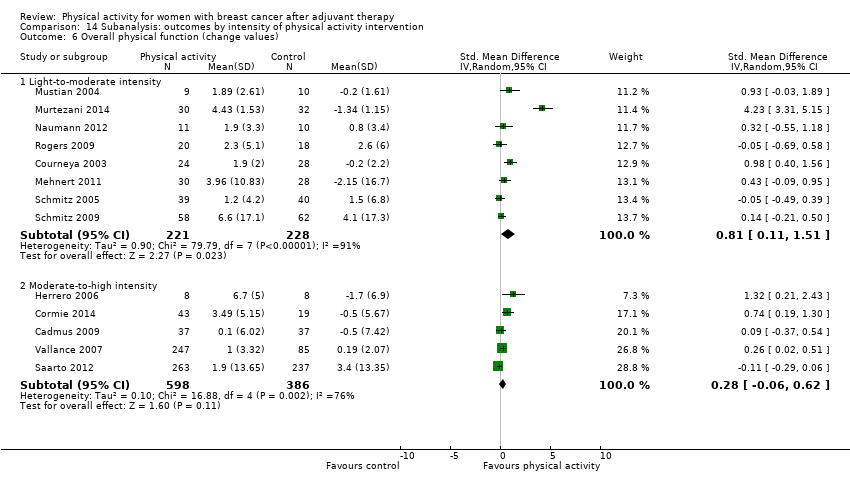 Comparison 14 Subanalysis: outcomes by intensity of physical activity intervention, Outcome 6 Overall physical function (change values). | ||||
| 6.1 Light‐to‐moderate intensity | 8 | 449 | Std. Mean Difference (IV, Random, 95% CI) | 0.81 [0.11, 1.51] |
| 6.2 Moderate‐to‐high intensity | 5 | 984 | Std. Mean Difference (IV, Random, 95% CI) | 0.28 [‐0.06, 0.62] |
| 7 Overall role function (follow‐up values) Show forest plot | 18 | Std. Mean Difference (IV, Random, 95% CI) | Subtotals only | |
| Analysis 14.7 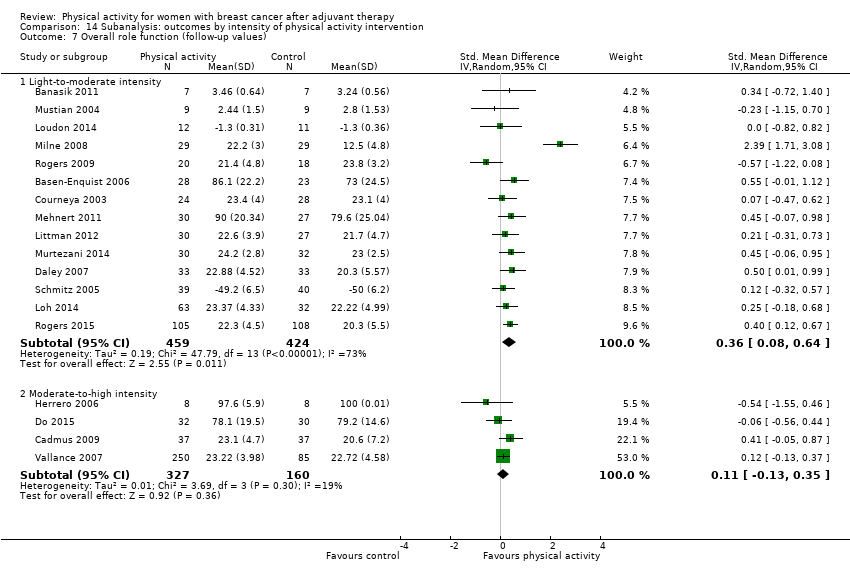 Comparison 14 Subanalysis: outcomes by intensity of physical activity intervention, Outcome 7 Overall role function (follow‐up values). | ||||
| 7.1 Light‐to‐moderate intensity | 14 | 883 | Std. Mean Difference (IV, Random, 95% CI) | 0.36 [0.08, 0.64] |
| 7.2 Moderate‐to‐high intensity | 4 | 487 | Std. Mean Difference (IV, Random, 95% CI) | 0.11 [‐0.13, 0.35] |
| 8 Overall role function (change values) Show forest plot | 12 | Std. Mean Difference (IV, Random, 95% CI) | Subtotals only | |
| Analysis 14.8  Comparison 14 Subanalysis: outcomes by intensity of physical activity intervention, Outcome 8 Overall role function (change values). | ||||
| 8.1 Light‐to‐moderate intensity | 7 | 328 | Std. Mean Difference (IV, Random, 95% CI) | 0.18 [‐0.19, 0.56] |
| 8.2 Moderate‐to‐high intensity | 5 | 987 | Std. Mean Difference (IV, Random, 95% CI) | 0.06 [‐0.09, 0.21] |
| 9 Overall social well‐being/function (follow‐up values) Show forest plot | 18 | Std. Mean Difference (IV, Random, 95% CI) | Subtotals only | |
| Analysis 14.9 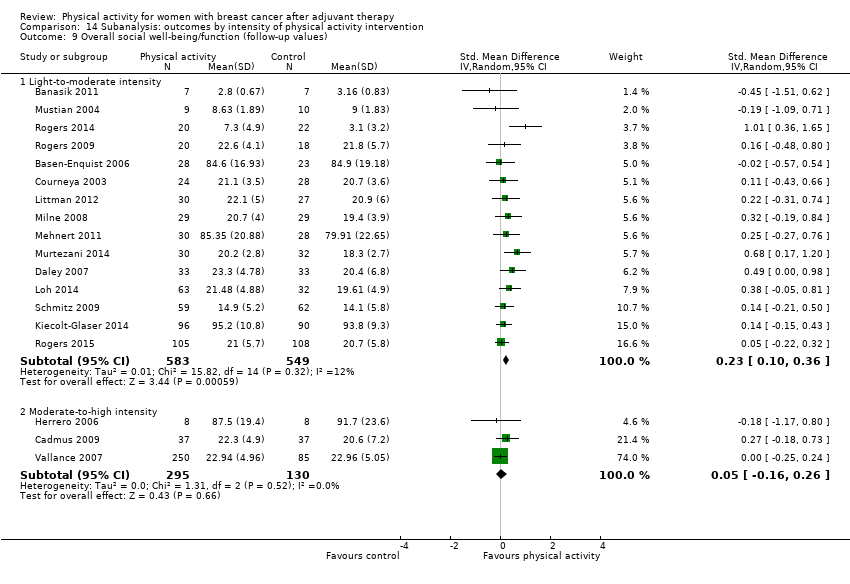 Comparison 14 Subanalysis: outcomes by intensity of physical activity intervention, Outcome 9 Overall social well‐being/function (follow‐up values). | ||||
| 9.1 Light‐to‐moderate intensity | 15 | 1132 | Std. Mean Difference (IV, Random, 95% CI) | 0.23 [0.10, 0.36] |
| 9.2 Moderate‐to‐high intensity | 3 | 425 | Std. Mean Difference (IV, Random, 95% CI) | 0.05 [‐0.16, 0.26] |
| 10 Overall social well‐being/function (change values) Show forest plot | 12 | Std. Mean Difference (IV, Random, 95% CI) | Subtotals only | |
| Analysis 14.10  Comparison 14 Subanalysis: outcomes by intensity of physical activity intervention, Outcome 10 Overall social well‐being/function (change values). | ||||
| 10.1 Light‐to‐moderate intensity | 8 | 413 | Std. Mean Difference (IV, Random, 95% CI) | 0.63 [0.21, 1.04] |
| 10.2 Moderate‐to‐high intensity | 4 | 971 | Std. Mean Difference (IV, Random, 95% CI) | 0.33 [‐0.33, 0.98] |
| 11 Overall cognitive function (follow‐up values) Show forest plot | 5 | Std. Mean Difference (IV, Random, 95% CI) | Subtotals only | |
| Analysis 14.11  Comparison 14 Subanalysis: outcomes by intensity of physical activity intervention, Outcome 11 Overall cognitive function (follow‐up values). | ||||
| 11.1 Light‐to‐moderate intensity | 4 | 173 | Std. Mean Difference (IV, Random, 95% CI) | 0.43 [0.11, 0.74] |
| 11.2 Moderate‐to‐high intensity | 1 | 16 | Std. Mean Difference (IV, Random, 95% CI) | 0.16 [‐0.82, 1.14] |
| 12 Overall cognitive function (change values) Show forest plot | 5 | Std. Mean Difference (IV, Random, 95% CI) | Subtotals only | |
| Analysis 14.12  Comparison 14 Subanalysis: outcomes by intensity of physical activity intervention, Outcome 12 Overall cognitive function (change values). | ||||
| 12.1 Light‐to‐moderate intensity | 3 | 156 | Std. Mean Difference (IV, Random, 95% CI) | 0.17 [‐0.21, 0.55] |
| 12.2 Moderate‐to‐high intensity | 2 | 516 | Std. Mean Difference (IV, Random, 95% CI) | ‐0.17 [‐0.35, 0.00] |
| 13 Overall general health (follow‐up values) Show forest plot | 10 | Std. Mean Difference (IV, Random, 95% CI) | Subtotals only | |
| Analysis 14.13  Comparison 14 Subanalysis: outcomes by intensity of physical activity intervention, Outcome 13 Overall general health (follow‐up values). | ||||
| 13.1 Light‐to‐moderate intensity | 6 | 304 | Std. Mean Difference (IV, Random, 95% CI) | 0.17 [‐0.14, 0.48] |
| 13.2 Moderate‐to‐high intensity | 4 | 184 | Std. Mean Difference (IV, Random, 95% CI) | 0.30 [‐0.35, 0.95] |
| 14 Overall general health (change values) Show forest plot | 9 | Std. Mean Difference (IV, Random, 95% CI) | Subtotals only | |
| Analysis 14.14  Comparison 14 Subanalysis: outcomes by intensity of physical activity intervention, Outcome 14 Overall general health (change values). | ||||
| 14.1 Light‐to‐moderate intensity | 5 | 254 | Std. Mean Difference (IV, Random, 95% CI) | 0.23 [‐0.02, 0.48] |
| 14.2 Moderate‐to‐high intensity | 4 | 652 | Std. Mean Difference (IV, Random, 95% CI) | 0.20 [‐0.24, 0.64] |
| 15 Overall sexual function (follow‐up values) Show forest plot | 5 | Std. Mean Difference (IV, Fixed, 95% CI) | Subtotals only | |
| Analysis 14.15  Comparison 14 Subanalysis: outcomes by intensity of physical activity intervention, Outcome 15 Overall sexual function (follow‐up values). | ||||
| 15.1 Light‐to‐moderate intensity | 4 | 293 | Std. Mean Difference (IV, Fixed, 95% CI) | 0.22 [‐0.01, 0.45] |
| 15.2 Moderate‐to‐high intensity | 1 | 118 | Std. Mean Difference (IV, Fixed, 95% CI) | 0.01 [‐0.35, 0.38] |
| 16 Overall sexual function (change values) Show forest plot | 3 | Mean Difference (IV, Random, 95% CI) | Subtotals only | |
| Analysis 14.16 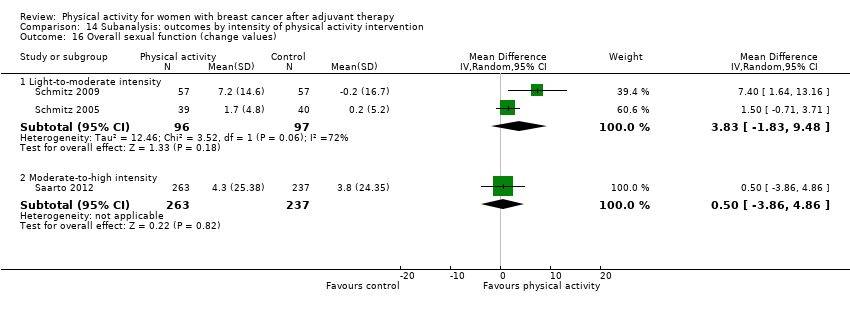 Comparison 14 Subanalysis: outcomes by intensity of physical activity intervention, Outcome 16 Overall sexual function (change values). | ||||
| 16.1 Light‐to‐moderate intensity | 2 | 193 | Mean Difference (IV, Random, 95% CI) | 3.83 [‐1.83, 9.48] |
| 16.2 Moderate‐to‐high intensity | 1 | 500 | Mean Difference (IV, Random, 95% CI) | 0.5 [‐3.86, 4.86] |
| 17 Overall anxiety (follow‐up values) Show forest plot | 7 | Std. Mean Difference (IV, Random, 95% CI) | Subtotals only | |
| Analysis 14.17  Comparison 14 Subanalysis: outcomes by intensity of physical activity intervention, Outcome 17 Overall anxiety (follow‐up values). | ||||
| 17.1 Light‐to‐moderate intensity | 5 | 237 | Std. Mean Difference (IV, Random, 95% CI) | ‐0.56 [‐0.88, ‐0.25] |
| 17.2 Moderate‐to‐high intensity | 2 | 89 | Std. Mean Difference (IV, Random, 95% CI) | ‐1.20 [‐3.49, 1.09] |
| 18 Overall anxiety (change values) Show forest plot | 4 | Std. Mean Difference (IV, Fixed, 95% CI) | Subtotals only | |
| Analysis 14.18  Comparison 14 Subanalysis: outcomes by intensity of physical activity intervention, Outcome 18 Overall anxiety (change values). | ||||
| 18.1 Light‐to‐moderate intensity | 3 | 161 | Std. Mean Difference (IV, Fixed, 95% CI) | ‐0.48 [‐0.79, ‐0.16] |
| 18.2 Moderate‐to‐high intensity | 1 | 74 | Std. Mean Difference (IV, Fixed, 95% CI) | ‐0.15 [‐0.61, 0.30] |
| 19 Overall depression (follow‐up values) Show forest plot | 12 | Std. Mean Difference (IV, Random, 95% CI) | Subtotals only | |
| Analysis 14.19 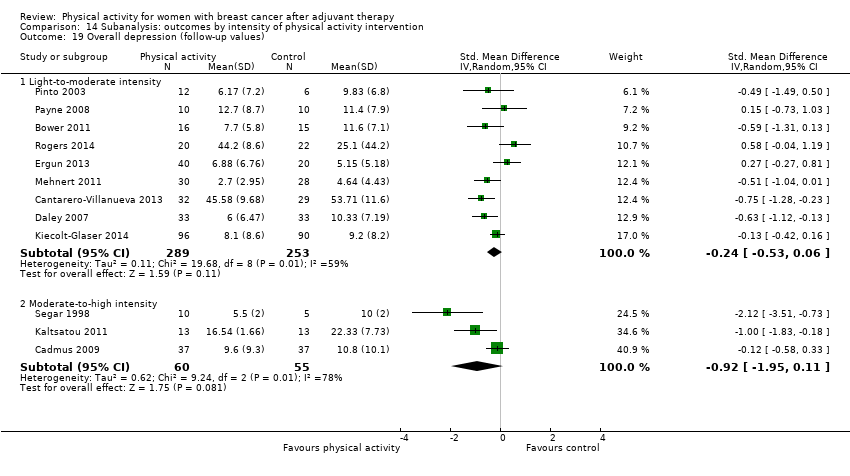 Comparison 14 Subanalysis: outcomes by intensity of physical activity intervention, Outcome 19 Overall depression (follow‐up values). | ||||
| 19.1 Light‐to‐moderate intensity | 9 | 542 | Std. Mean Difference (IV, Random, 95% CI) | ‐0.24 [‐0.53, 0.06] |
| 19.2 Moderate‐to‐high intensity | 3 | 115 | Std. Mean Difference (IV, Random, 95% CI) | ‐0.92 [‐1.95, 0.11] |
| 20 Overall depression (change values) Show forest plot | 6 | Std. Mean Difference (IV, Random, 95% CI) | Subtotals only | |
| Analysis 14.20  Comparison 14 Subanalysis: outcomes by intensity of physical activity intervention, Outcome 20 Overall depression (change values). | ||||
| 20.1 Light‐to‐moderate intensity | 4 | 182 | Std. Mean Difference (IV, Random, 95% CI) | ‐0.60 [‐0.89, ‐0.30] |
| 20.2 Moderate‐to‐high intensity | 2 | 574 | Std. Mean Difference (IV, Random, 95% CI) | 0.00 [‐0.21, 0.22] |
| 21 Overall fatigue (follow‐up values) Show forest plot | 25 | Std. Mean Difference (IV, Random, 95% CI) | Subtotals only | |
| Analysis 14.21 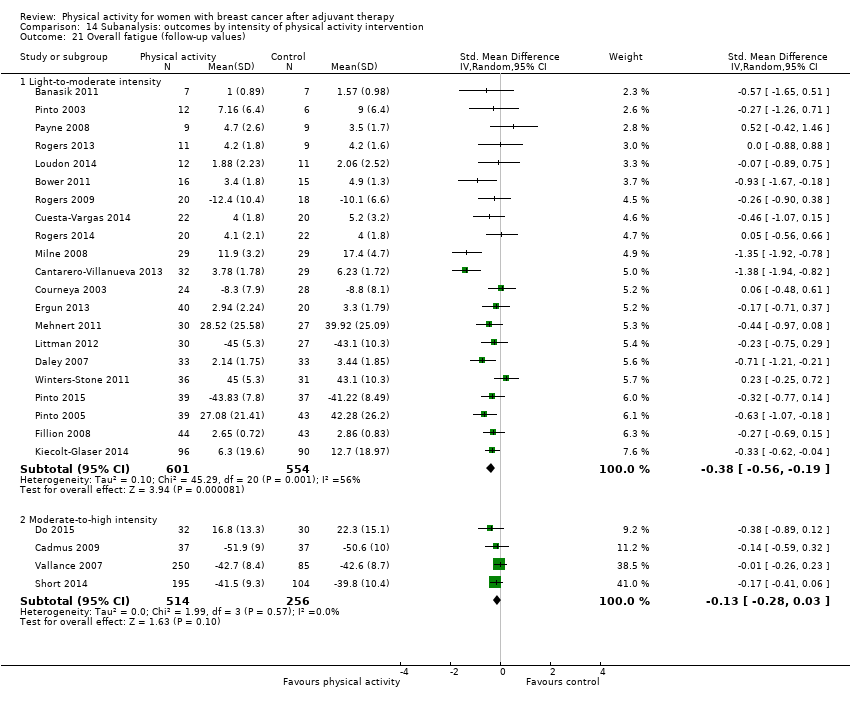 Comparison 14 Subanalysis: outcomes by intensity of physical activity intervention, Outcome 21 Overall fatigue (follow‐up values). | ||||
| 21.1 Light‐to‐moderate intensity | 21 | 1155 | Std. Mean Difference (IV, Random, 95% CI) | ‐0.38 [‐0.56, ‐0.19] |
| 21.2 Moderate‐to‐high intensity | 4 | 770 | Std. Mean Difference (IV, Random, 95% CI) | ‐0.13 [‐0.28, 0.03] |
| 22 Overall fatigue (change values) Show forest plot | 12 | Std. Mean Difference (IV, Random, 95% CI) | Subtotals only | |
| Analysis 14.22 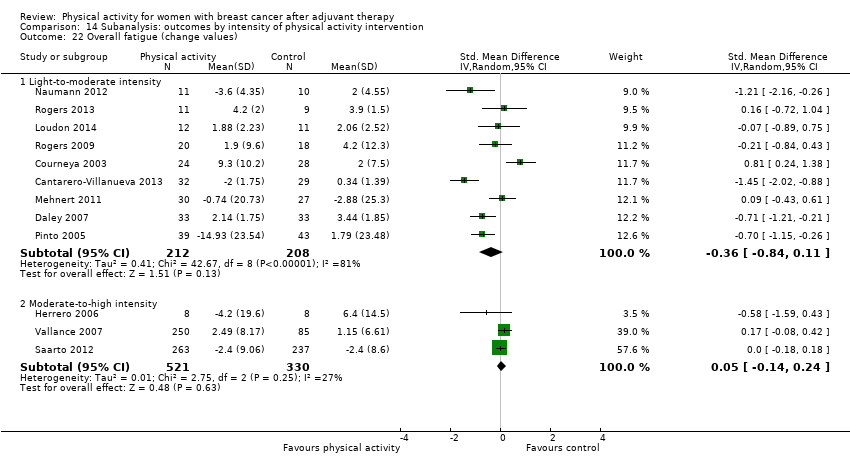 Comparison 14 Subanalysis: outcomes by intensity of physical activity intervention, Outcome 22 Overall fatigue (change values). | ||||
| 22.1 Light‐to‐moderate intensity | 9 | 420 | Std. Mean Difference (IV, Random, 95% CI) | ‐0.36 [‐0.84, 0.11] |
| 22.2 Moderate‐to‐high intensity | 3 | 851 | Std. Mean Difference (IV, Random, 95% CI) | 0.05 [‐0.14, 0.24] |
| 23 Overall pain/disability (follow‐up values) Show forest plot | 9 | Std. Mean Difference (IV, Random, 95% CI) | Subtotals only | |
| Analysis 14.23 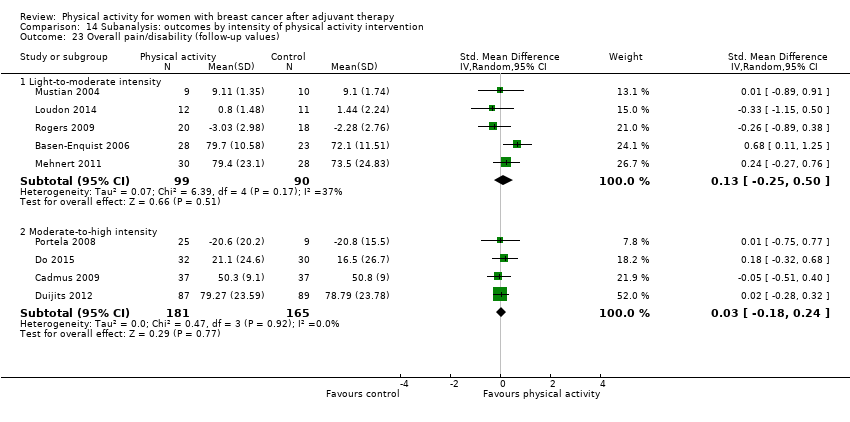 Comparison 14 Subanalysis: outcomes by intensity of physical activity intervention, Outcome 23 Overall pain/disability (follow‐up values). | ||||
| 23.1 Light‐to‐moderate intensity | 5 | 189 | Std. Mean Difference (IV, Random, 95% CI) | 0.13 [‐0.25, 0.50] |
| 23.2 Moderate‐to‐high intensity | 4 | 346 | Std. Mean Difference (IV, Random, 95% CI) | 0.03 [‐0.18, 0.24] |
| 24 Overall pain/disability (change values) Show forest plot | 5 | Std. Mean Difference (IV, Random, 95% CI) | Subtotals only | |
| Analysis 14.24 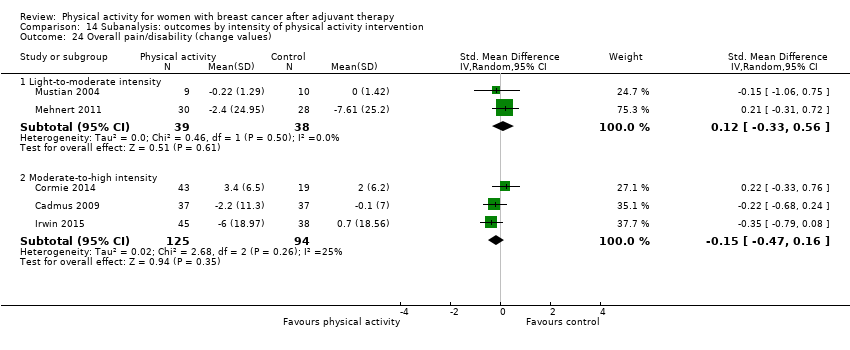 Comparison 14 Subanalysis: outcomes by intensity of physical activity intervention, Outcome 24 Overall pain/disability (change values). | ||||
| 24.1 Light‐to‐moderate intensity | 2 | 77 | Std. Mean Difference (IV, Random, 95% CI) | 0.12 [‐0.33, 0.56] |
| 24.2 Moderate‐to‐high intensity | 3 | 219 | Std. Mean Difference (IV, Random, 95% CI) | ‐0.15 [‐0.47, 0.16] |
| 25 Overall self‐esteem/body image (follow‐up values) Show forest plot | 12 | Std. Mean Difference (IV, Random, 95% CI) | Subtotals only | |
| Analysis 14.25  Comparison 14 Subanalysis: outcomes by intensity of physical activity intervention, Outcome 25 Overall self‐esteem/body image (follow‐up values). | ||||
| 25.1 Light‐to‐moderate intensity | 8 | 474 | Std. Mean Difference (IV, Random, 95% CI) | 0.35 [0.14, 0.55] |
| 25.2 Moderate‐to‐high intensity | 4 | 193 | Std. Mean Difference (IV, Random, 95% CI) | 0.06 [‐0.45, 0.56] |
| 26 Overall self‐esteem/body image (change values) Show forest plot | 9 | Std. Mean Difference (IV, Random, 95% CI) | Subtotals only | |
| Analysis 14.26  Comparison 14 Subanalysis: outcomes by intensity of physical activity intervention, Outcome 26 Overall self‐esteem/body image (change values). | ||||
| 26.1 Light‐to‐moderate intensity | 6 | 376 | Std. Mean Difference (IV, Random, 95% CI) | 0.52 [‐0.09, 1.13] |
| 26.2 Moderate‐to‐high intensity | 3 | 616 | Std. Mean Difference (IV, Random, 95% CI) | ‐0.05 [‐0.21, 0.10] |
| 27 Overall cardiorespiratory fitness (follow‐up values) Show forest plot | 23 | Std. Mean Difference (IV, Random, 95% CI) | Subtotals only | |
| Analysis 14.27  Comparison 14 Subanalysis: outcomes by intensity of physical activity intervention, Outcome 27 Overall cardiorespiratory fitness (follow‐up values). | ||||
| 27.1 Light‐to‐moderate intensity | 16 | 975 | Std. Mean Difference (IV, Random, 95% CI) | 0.43 [0.27, 0.59] |
| 27.2 Moderate‐to‐high intensity | 7 | 290 | Std. Mean Difference (IV, Random, 95% CI) | 0.46 [0.13, 0.80] |
| 28 Overall cardiorespiratory fitness (change values) Show forest plot | 9 | Std. Mean Difference (IV, Random, 95% CI) | Subtotals only | |
| Analysis 14.28 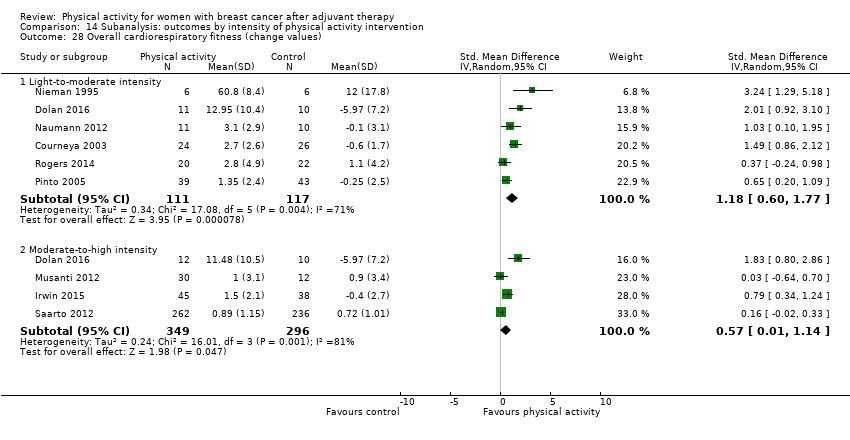 Comparison 14 Subanalysis: outcomes by intensity of physical activity intervention, Outcome 28 Overall cardiorespiratory fitness (change values). | ||||
| 28.1 Light‐to‐moderate intensity | 6 | 228 | Std. Mean Difference (IV, Random, 95% CI) | 1.18 [0.60, 1.77] |
| 28.2 Moderate‐to‐high intensity | 4 | 645 | Std. Mean Difference (IV, Random, 95% CI) | 0.57 [0.01, 1.14] |
| 29 Overall self‐reported physical activity (follow‐up values) Show forest plot | 17 | Std. Mean Difference (IV, Random, 95% CI) | Subtotals only | |
| Analysis 14.29  Comparison 14 Subanalysis: outcomes by intensity of physical activity intervention, Outcome 29 Overall self‐reported physical activity (follow‐up values). | ||||
| 29.1 Light‐to‐moderate intensity | 11 | 1112 | Std. Mean Difference (IV, Random, 95% CI) | 0.47 [0.23, 0.72] |
| 29.2 Moderate‐to‐high intensity | 6 | 893 | Std. Mean Difference (IV, Random, 95% CI) | 0.65 [0.27, 1.03] |
| 30 Overall self‐reported physical activity (change values) Show forest plot | 8 | Std. Mean Difference (IV, Random, 95% CI) | Subtotals only | |
| Analysis 14.30  Comparison 14 Subanalysis: outcomes by intensity of physical activity intervention, Outcome 30 Overall self‐reported physical activity (change values). | ||||
| 30.1 Light‐to‐moderate intensity | 4 | 249 | Std. Mean Difference (IV, Random, 95% CI) | 0.79 [0.15, 1.44] |
| 30.2 Moderate‐to‐high intensity | 4 | 1025 | Std. Mean Difference (IV, Random, 95% CI) | 0.46 [0.07, 0.85] |
| 31 Overall objective physical activity (follow‐up values) Show forest plot | 12 | Std. Mean Difference (IV, Random, 95% CI) | Subtotals only | |
| Analysis 14.31  Comparison 14 Subanalysis: outcomes by intensity of physical activity intervention, Outcome 31 Overall objective physical activity (follow‐up values). | ||||
| 31.1 Light‐to‐moderate intensity | 9 | 574 | Std. Mean Difference (IV, Random, 95% CI) | 0.58 [0.29, 0.87] |
| 31.2 Moderate‐to‐high intensity | 3 | 735 | Std. Mean Difference (IV, Random, 95% CI) | 0.12 [‐0.03, 0.28] |
| 32 Overall objective physical activity (change values) Show forest plot | 5 | Std. Mean Difference (IV, Random, 95% CI) | Subtotals only | |
| Analysis 14.32  Comparison 14 Subanalysis: outcomes by intensity of physical activity intervention, Outcome 32 Overall objective physical activity (change values). | ||||
| 32.1 Light‐to‐moderate intensity | 3 | 103 | Std. Mean Difference (IV, Random, 95% CI) | 1.05 [0.62, 1.47] |
| 32.2 Moderate‐to‐high intensity | 2 | 405 | Std. Mean Difference (IV, Random, 95% CI) | 0.32 [‐0.45, 1.09] |
| 33 Mass (follow‐up values) Show forest plot | 16 | Mean Difference (IV, Fixed, 95% CI) | Subtotals only | |
| Analysis 14.33  Comparison 14 Subanalysis: outcomes by intensity of physical activity intervention, Outcome 33 Mass (follow‐up values). | ||||
| 33.1 Light‐to‐moderate intensity | 12 | 1015 | Mean Difference (IV, Fixed, 95% CI) | 0.03 [‐0.56, 0.61] |
| 33.2 Moderate‐to‐high intensity | 4 | 195 | Mean Difference (IV, Fixed, 95% CI) | ‐1.34 [‐5.66, 2.98] |
| 34 Mass (change values) Show forest plot | 11 | Mean Difference (IV, Random, 95% CI) | Subtotals only | |
| Analysis 14.34  Comparison 14 Subanalysis: outcomes by intensity of physical activity intervention, Outcome 34 Mass (change values). | ||||
| 34.1 Light‐to‐moderate intensity | 8 | 418 | Mean Difference (IV, Random, 95% CI) | ‐0.58 [‐1.21, 0.05] |
| 34.2 Moderate‐to‐high intensity | 4 | 639 | Mean Difference (IV, Random, 95% CI) | ‐0.97 [‐2.18, 0.24] |
| 35 BMI (follow‐up values) Show forest plot | 17 | Mean Difference (IV, Fixed, 95% CI) | Subtotals only | |
| Analysis 14.35 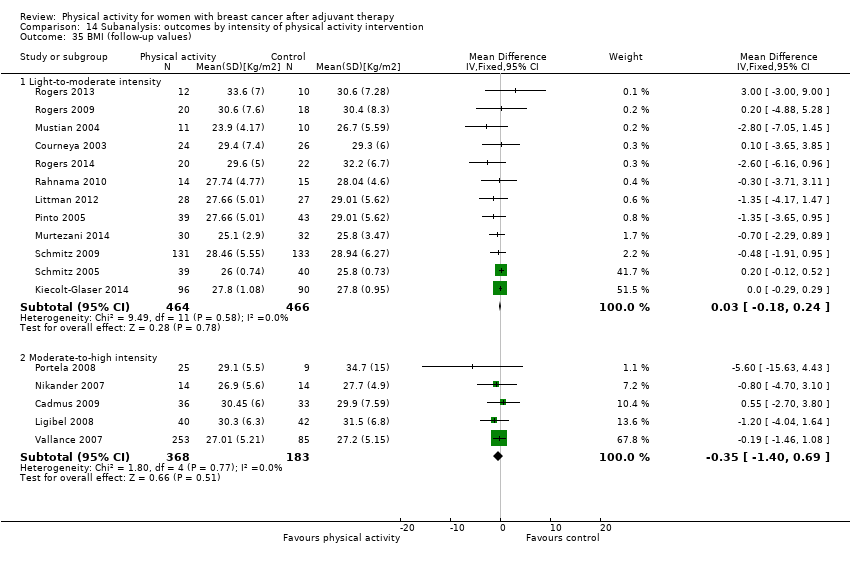 Comparison 14 Subanalysis: outcomes by intensity of physical activity intervention, Outcome 35 BMI (follow‐up values). | ||||
| 35.1 Light‐to‐moderate intensity | 12 | 930 | Mean Difference (IV, Fixed, 95% CI) | 0.03 [‐0.18, 0.24] |
| 35.2 Moderate‐to‐high intensity | 5 | 551 | Mean Difference (IV, Fixed, 95% CI) | ‐0.35 [‐1.40, 0.69] |
| 36 BMI (change values) Show forest plot | 8 | Mean Difference (IV, Random, 95% CI) | Subtotals only | |
| Analysis 14.36 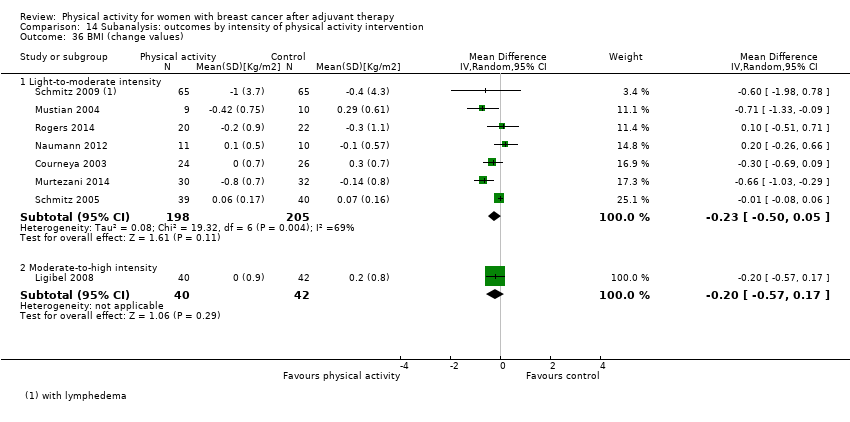 Comparison 14 Subanalysis: outcomes by intensity of physical activity intervention, Outcome 36 BMI (change values). | ||||
| 36.1 Light‐to‐moderate intensity | 7 | 403 | Mean Difference (IV, Random, 95% CI) | ‐0.23 [‐0.50, 0.05] |
| 36.2 Moderate‐to‐high intensity | 1 | 82 | Mean Difference (IV, Random, 95% CI) | ‐0.2 [‐0.57, 0.17] |
| 37 Overall body fat (follow‐up values) Show forest plot | 18 | Std. Mean Difference (IV, Random, 95% CI) | Subtotals only | |
| Analysis 14.37  Comparison 14 Subanalysis: outcomes by intensity of physical activity intervention, Outcome 37 Overall body fat (follow‐up values). | ||||
| 37.1 Light‐to‐moderate intensity | 13 | 886 | Std. Mean Difference (IV, Random, 95% CI) | ‐0.24 [‐0.44, ‐0.04] |
| 37.2 Moderate‐to‐high intensity | 5 | 276 | Std. Mean Difference (IV, Random, 95% CI) | ‐0.03 [‐0.27, 0.21] |
| 38 Overall body fat (change values) Show forest plot | 9 | Std. Mean Difference (IV, Random, 95% CI) | Subtotals only | |
| Analysis 14.38 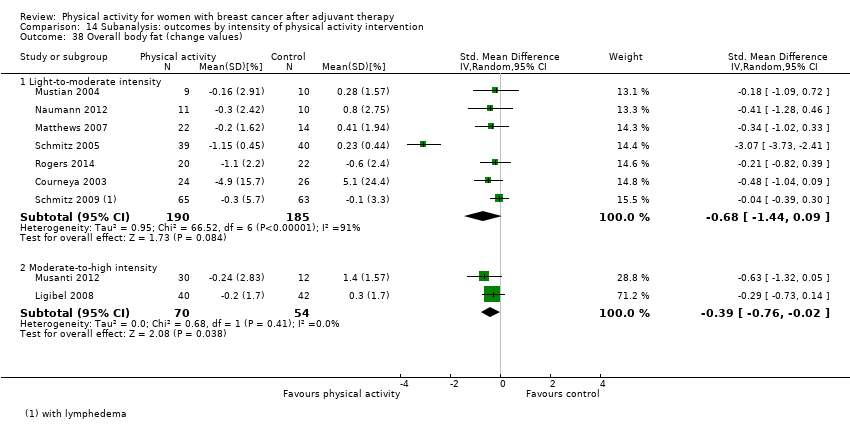 Comparison 14 Subanalysis: outcomes by intensity of physical activity intervention, Outcome 38 Overall body fat (change values). | ||||
| 38.1 Light‐to‐moderate intensity | 7 | 375 | Std. Mean Difference (IV, Random, 95% CI) | ‐0.68 [‐1.44, 0.09] |
| 38.2 Moderate‐to‐high intensity | 2 | 124 | Std. Mean Difference (IV, Random, 95% CI) | ‐0.39 [‐0.76, ‐0.02] |
| 39 Lower body strength (follow‐up values) Show forest plot | 10 | Std. Mean Difference (IV, Random, 95% CI) | Subtotals only | |
| Analysis 14.39  Comparison 14 Subanalysis: outcomes by intensity of physical activity intervention, Outcome 39 Lower body strength (follow‐up values). | ||||
| 39.1 Light‐to‐moderate intensity | 7 | 480 | Std. Mean Difference (IV, Random, 95% CI) | 0.69 [0.34, 1.04] |
| 39.2 Moderate‐to‐high intensity | 3 | 157 | Std. Mean Difference (IV, Random, 95% CI) | ‐0.10 [‐0.42, 0.21] |
| 40 Lower body strength (change values) Show forest plot | 8 | Std. Mean Difference (IV, Random, 95% CI) | Subtotals only | |
| Analysis 14.40  Comparison 14 Subanalysis: outcomes by intensity of physical activity intervention, Outcome 40 Lower body strength (change values). | ||||
| 40.1 Light‐to‐moderate intensity | 5 | 331 | Std. Mean Difference (IV, Random, 95% CI) | 0.87 [0.64, 1.09] |
| 40.2 Moderate‐to‐high intensity | 4 | 399 | Std. Mean Difference (IV, Random, 95% CI) | 0.62 [0.07, 1.17] |
| 41 Upper body strength (follow‐up values) Show forest plot | 13 | Std. Mean Difference (IV, Random, 95% CI) | Subtotals only | |
| Analysis 14.41 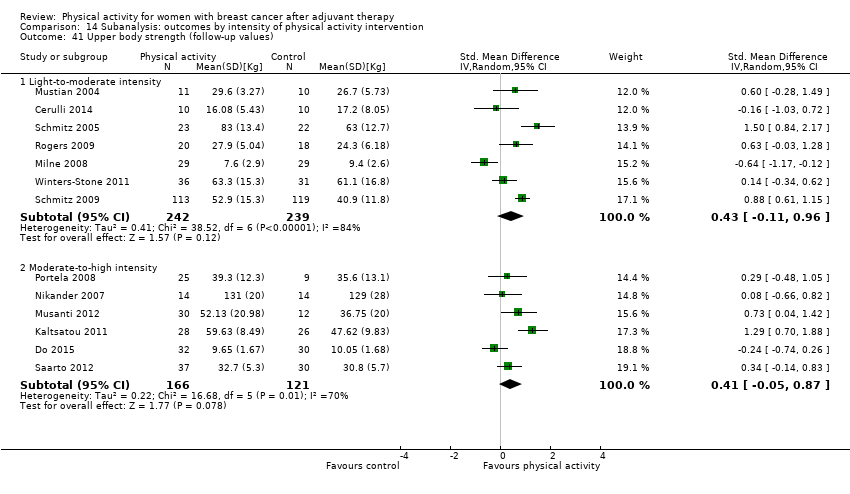 Comparison 14 Subanalysis: outcomes by intensity of physical activity intervention, Outcome 41 Upper body strength (follow‐up values). | ||||
| 41.1 Light‐to‐moderate intensity | 7 | 481 | Std. Mean Difference (IV, Random, 95% CI) | 0.43 [‐0.11, 0.96] |
| 41.2 Moderate‐to‐high intensity | 6 | 287 | Std. Mean Difference (IV, Random, 95% CI) | 0.41 [‐0.05, 0.87] |
| 42 Upper body strength (change values) Show forest plot | 8 | Std. Mean Difference (IV, Random, 95% CI) | Subtotals only | |
| Analysis 14.42  Comparison 14 Subanalysis: outcomes by intensity of physical activity intervention, Outcome 42 Upper body strength (change values). | ||||
| 42.1 Light‐to‐moderate intensity | 3 | 360 | Std. Mean Difference (IV, Random, 95% CI) | 1.32 [0.47, 2.16] |
| 42.2 Moderate‐to‐high intensity | 5 | 472 | Std. Mean Difference (IV, Random, 95% CI) | 0.37 [‐0.05, 0.79] |
| 43 Bone mineral density ‐ femoral neck (follow‐up and change values) Show forest plot | 4 | Std. Mean Difference (IV, Random, 95% CI) | Subtotals only | |
| Analysis 14.43  Comparison 14 Subanalysis: outcomes by intensity of physical activity intervention, Outcome 43 Bone mineral density ‐ femoral neck (follow‐up and change values). | ||||
| 43.1 Light‐to‐moderate intensity | 2 | 106 | Std. Mean Difference (IV, Random, 95% CI) | ‐0.08 [‐0.54, 0.37] |
| 43.2 Moderate‐to‐high intensity | 2 | 680 | Std. Mean Difference (IV, Random, 95% CI) | 0.39 [‐0.04, 0.83] |
| 44 Bone mineral density ‐ lumbar spine (follow‐up and change values) Show forest plot | 4 | Std. Mean Difference (IV, Random, 95% CI) | Subtotals only | |
| Analysis 14.44  Comparison 14 Subanalysis: outcomes by intensity of physical activity intervention, Outcome 44 Bone mineral density ‐ lumbar spine (follow‐up and change values). | ||||
| 44.1 Light‐to‐moderate intensity | 2 | 106 | Std. Mean Difference (IV, Random, 95% CI) | 0.06 [‐0.48, 0.60] |
| 44.2 Moderate‐to‐high intensity | 2 | 680 | Std. Mean Difference (IV, Random, 95% CI) | 0.31 [‐0.14, 0.75] |
| 45 Bone mineral density ‐ total hip (follow‐up and change values) Show forest plot | 3 | Std. Mean Difference (IV, Random, 95% CI) | Subtotals only | |
| Analysis 14.45 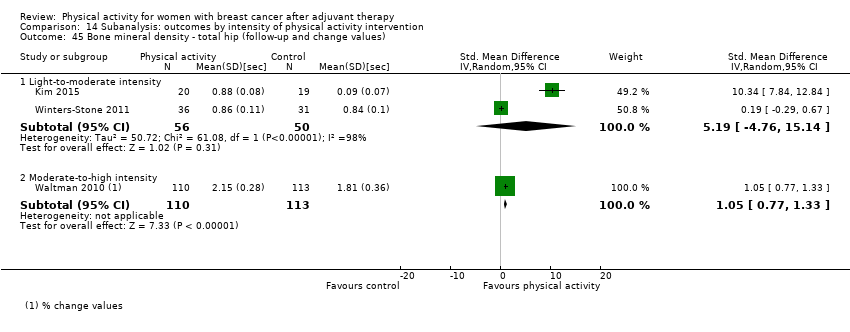 Comparison 14 Subanalysis: outcomes by intensity of physical activity intervention, Outcome 45 Bone mineral density ‐ total hip (follow‐up and change values). | ||||
| 45.1 Light‐to‐moderate intensity | 2 | 106 | Std. Mean Difference (IV, Random, 95% CI) | 5.19 [‐4.76, 15.14] |
| 45.2 Moderate‐to‐high intensity | 1 | 223 | Std. Mean Difference (IV, Random, 95% CI) | 1.05 [0.77, 1.33] |
| Outcome or subgroup title | No. of studies | No. of participants | Statistical method | Effect size |
| 1 Overall HRQoL (follow‐up values) Show forest plot | 22 | Std. Mean Difference (IV, Random, 95% CI) | Subtotals only | |
| Analysis 15.1 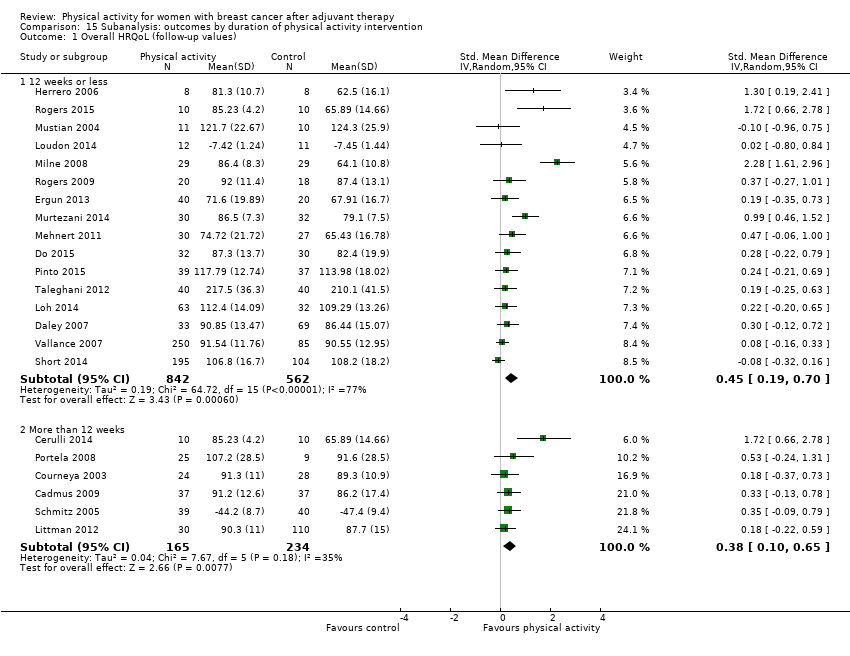 Comparison 15 Subanalysis: outcomes by duration of physical activity intervention, Outcome 1 Overall HRQoL (follow‐up values). | ||||
| 1.1 12 weeks or less | 16 | 1404 | Std. Mean Difference (IV, Random, 95% CI) | 0.45 [0.19, 0.70] |
| 1.2 More than 12 weeks | 6 | 399 | Std. Mean Difference (IV, Random, 95% CI) | 0.38 [0.10, 0.65] |
| 2 Overall HRQoL (change values) Show forest plot | 14 | Std. Mean Difference (IV, Random, 95% CI) | Subtotals only | |
| Analysis 15.2  Comparison 15 Subanalysis: outcomes by duration of physical activity intervention, Outcome 2 Overall HRQoL (change values). | ||||
| 2.1 12 weeks or less | 11 | 828 | Std. Mean Difference (IV, Random, 95% CI) | 0.99 [0.45, 1.52] |
| 2.2 More than 12 weeks | 3 | 631 | Std. Mean Difference (IV, Random, 95% CI) | 0.27 [‐0.21, 0.76] |
| 3 Overall emotional function/mental health (follow‐up values) Show forest plot | 26 | Std. Mean Difference (IV, Random, 95% CI) | Subtotals only | |
| Analysis 15.3  Comparison 15 Subanalysis: outcomes by duration of physical activity intervention, Outcome 3 Overall emotional function/mental health (follow‐up values). | ||||
| 3.1 12 weeks or less | 20 | 1557 | Std. Mean Difference (IV, Random, 95% CI) | 0.26 [0.12, 0.39] |
| 3.2 More than 12 weeks | 6 | 545 | Std. Mean Difference (IV, Random, 95% CI) | 0.06 [‐0.11, 0.23] |
| 4 Overall emotional function/mental health (change values) Show forest plot | 15 | Std. Mean Difference (IV, Random, 95% CI) | Subtotals only | |
| Analysis 15.4  Comparison 15 Subanalysis: outcomes by duration of physical activity intervention, Outcome 4 Overall emotional function/mental health (change values). | ||||
| 4.1 12 weeks or less | 10 | 754 | Std. Mean Difference (IV, Random, 95% CI) | 0.39 [0.03, 0.76] |
| 4.2 More than 12 weeks | 5 | 825 | Std. Mean Difference (IV, Random, 95% CI) | 0.19 [‐0.05, 0.43] |
| 5 Overall physical function (follow‐up values) Show forest plot | 25 | Std. Mean Difference (IV, Random, 95% CI) | Subtotals only | |
| Analysis 15.5  Comparison 15 Subanalysis: outcomes by duration of physical activity intervention, Outcome 5 Overall physical function (follow‐up values). | ||||
| 5.1 12 weeks or less | 18 | 1523 | Std. Mean Difference (IV, Random, 95% CI) | 0.37 [0.17, 0.58] |
| 5.2 More than 12 weeks | 7 | 606 | Std. Mean Difference (IV, Random, 95% CI) | 0.24 [0.08, 0.40] |
| 6 Overall physical function (change values) Show forest plot | 13 | Std. Mean Difference (IV, Random, 95% CI) | Subtotals only | |
| Analysis 15.6 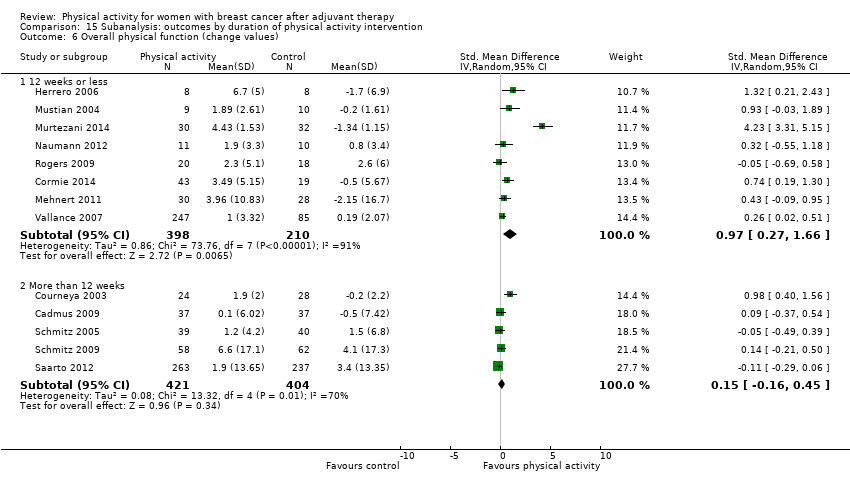 Comparison 15 Subanalysis: outcomes by duration of physical activity intervention, Outcome 6 Overall physical function (change values). | ||||
| 6.1 12 weeks or less | 8 | 608 | Std. Mean Difference (IV, Random, 95% CI) | 0.97 [0.27, 1.66] |
| 6.2 More than 12 weeks | 5 | 825 | Std. Mean Difference (IV, Random, 95% CI) | 0.15 [‐0.16, 0.45] |
| 7 Overall role function (follow‐up values) Show forest plot | 18 | Std. Mean Difference (IV, Random, 95% CI) | Subtotals only | |
| Analysis 15.7  Comparison 15 Subanalysis: outcomes by duration of physical activity intervention, Outcome 7 Overall role function (follow‐up values). | ||||
| 7.1 12 weeks or less | 13 | 1057 | Std. Mean Difference (IV, Random, 95% CI) | 0.30 [‐0.01, 0.60] |
| 7.2 More than 12 weeks | 5 | 313 | Std. Mean Difference (IV, Random, 95% CI) | 0.27 [0.04, 0.49] |
| 8 Overall role function (change values) Show forest plot | 12 | Std. Mean Difference (IV, Random, 95% CI) | Subtotals only | |
| Analysis 15.8  Comparison 15 Subanalysis: outcomes by duration of physical activity intervention, Outcome 8 Overall role function (change values). | ||||
| 8.1 12 weeks or less | 8 | 610 | Std. Mean Difference (IV, Random, 95% CI) | 0.24 [‐0.06, 0.55] |
| 8.2 More than 12 weeks | 4 | 705 | Std. Mean Difference (IV, Random, 95% CI) | ‐0.03 [‐0.18, 0.11] |
| 9 Overall social well‐being/function (follow‐up values) Show forest plot | 18 | Std. Mean Difference (IV, Random, 95% CI) | Subtotals only | |
| Analysis 15.9  Comparison 15 Subanalysis: outcomes by duration of physical activity intervention, Outcome 9 Overall social well‐being/function (follow‐up values). | ||||
| 9.1 12 weeks or less | 13 | 1202 | Std. Mean Difference (IV, Random, 95% CI) | 0.23 [0.06, 0.39] |
| 9.2 More than 12 weeks | 5 | 355 | Std. Mean Difference (IV, Random, 95% CI) | 0.15 [‐0.05, 0.36] |
| 10 Overall social well‐being/function (change values) Show forest plot | 12 | Std. Mean Difference (IV, Random, 95% CI) | Subtotals only | |
| Analysis 15.10 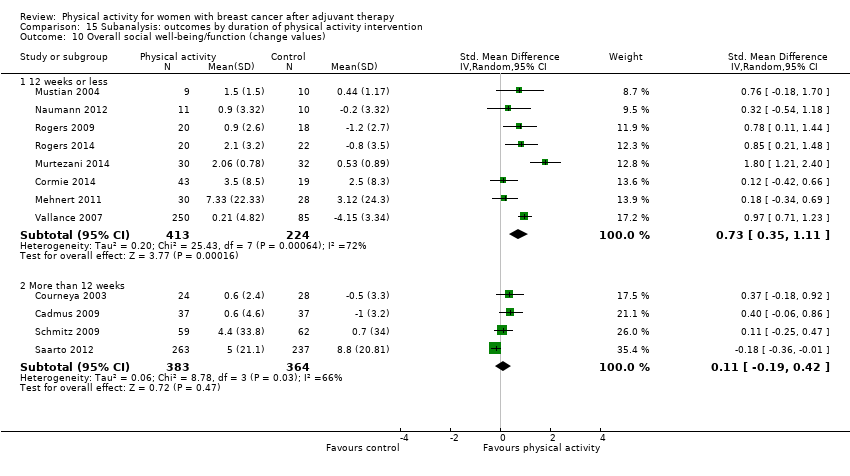 Comparison 15 Subanalysis: outcomes by duration of physical activity intervention, Outcome 10 Overall social well‐being/function (change values). | ||||
| 10.1 12 weeks or less | 8 | 637 | Std. Mean Difference (IV, Random, 95% CI) | 0.73 [0.35, 1.11] |
| 10.2 More than 12 weeks | 4 | 747 | Std. Mean Difference (IV, Random, 95% CI) | 0.11 [‐0.19, 0.42] |
| 11 Overall cognitive function (follow‐up values) Show forest plot | 5 | Std. Mean Difference (IV, Random, 95% CI) | Subtotals only | |
| Analysis 15.11 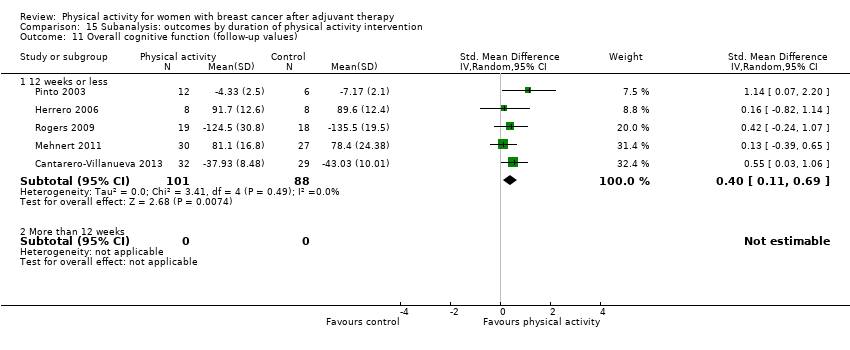 Comparison 15 Subanalysis: outcomes by duration of physical activity intervention, Outcome 11 Overall cognitive function (follow‐up values). | ||||
| 11.1 12 weeks or less | 5 | 189 | Std. Mean Difference (IV, Random, 95% CI) | 0.40 [0.11, 0.69] |
| 11.2 More than 12 weeks | 0 | 0 | Std. Mean Difference (IV, Random, 95% CI) | 0.0 [0.0, 0.0] |
| 12 Overall cognitive function (change values) Show forest plot | 5 | Std. Mean Difference (IV, Random, 95% CI) | Subtotals only | |
| Analysis 15.12 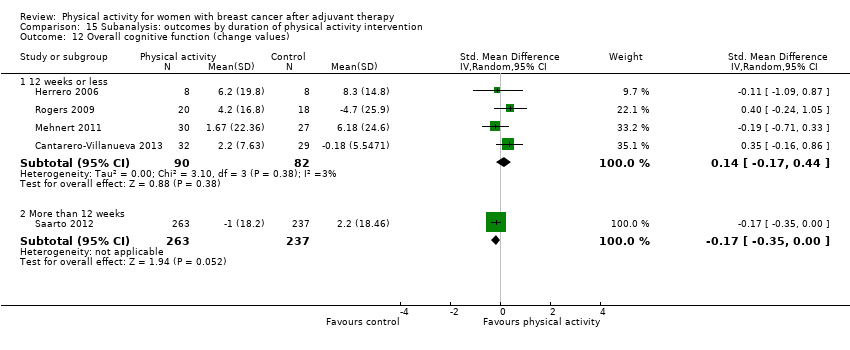 Comparison 15 Subanalysis: outcomes by duration of physical activity intervention, Outcome 12 Overall cognitive function (change values). | ||||
| 12.1 12 weeks or less | 4 | 172 | Std. Mean Difference (IV, Random, 95% CI) | 0.14 [‐0.17, 0.44] |
| 12.2 More than 12 weeks | 1 | 500 | Std. Mean Difference (IV, Random, 95% CI) | ‐0.17 [‐0.35, 0.00] |
| 13 Overall general health (follow‐up values) Show forest plot | 9 | Std. Mean Difference (IV, Random, 95% CI) | Subtotals only | |
| Analysis 15.13 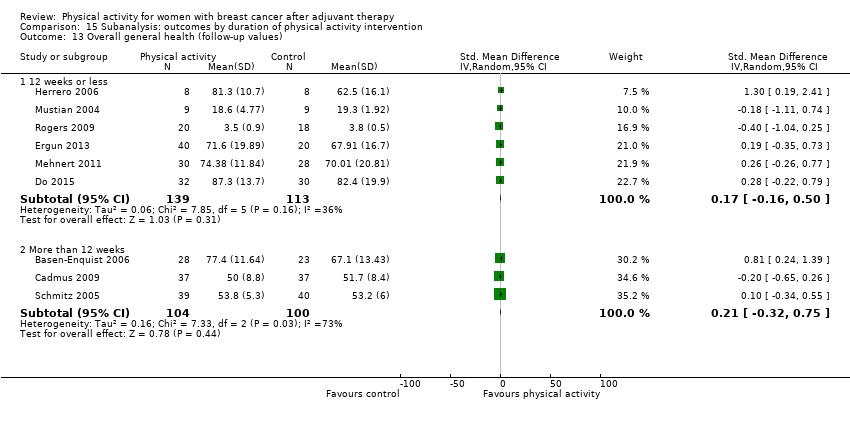 Comparison 15 Subanalysis: outcomes by duration of physical activity intervention, Outcome 13 Overall general health (follow‐up values). | ||||
| 13.1 12 weeks or less | 6 | 252 | Std. Mean Difference (IV, Random, 95% CI) | 0.17 [‐0.16, 0.50] |
| 13.2 More than 12 weeks | 3 | 204 | Std. Mean Difference (IV, Random, 95% CI) | 0.21 [‐0.32, 0.75] |
| 14 Overall general health (change values) Show forest plot | 9 | Std. Mean Difference (IV, Random, 95% CI) | Subtotals only | |
| Analysis 15.14 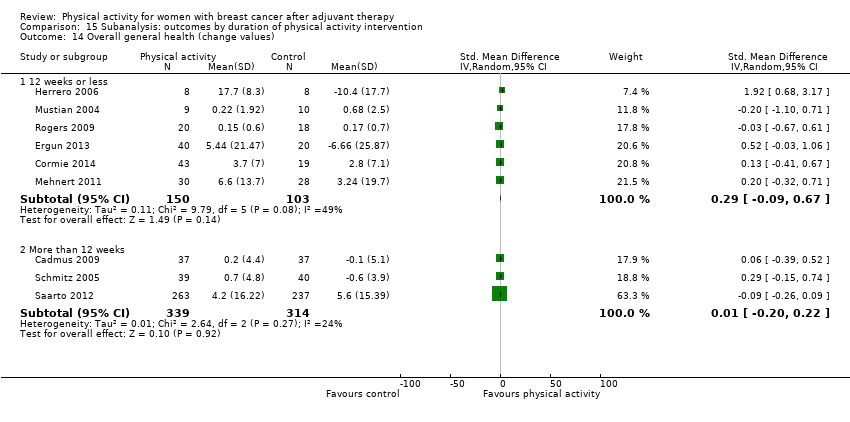 Comparison 15 Subanalysis: outcomes by duration of physical activity intervention, Outcome 14 Overall general health (change values). | ||||
| 14.1 12 weeks or less | 6 | 253 | Std. Mean Difference (IV, Random, 95% CI) | 0.29 [‐0.09, 0.67] |
| 14.2 More than 12 weeks | 3 | 653 | Std. Mean Difference (IV, Random, 95% CI) | 0.01 [‐0.20, 0.22] |
| 15 Overall sexual function (follow‐up values) Show forest plot | 5 | Std. Mean Difference (IV, Fixed, 95% CI) | Subtotals only | |
| Analysis 15.15 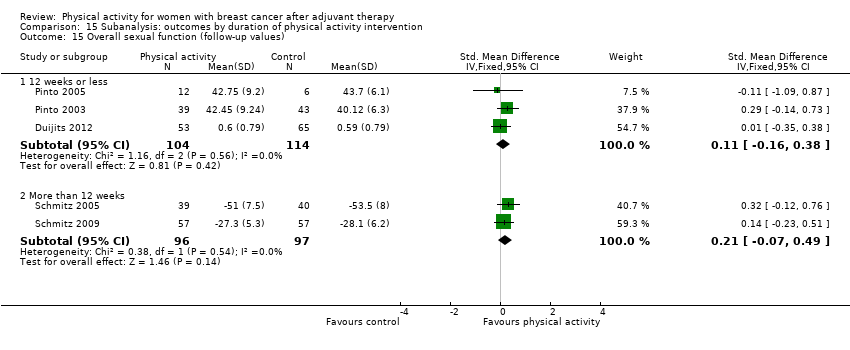 Comparison 15 Subanalysis: outcomes by duration of physical activity intervention, Outcome 15 Overall sexual function (follow‐up values). | ||||
| 15.1 12 weeks or less | 3 | 218 | Std. Mean Difference (IV, Fixed, 95% CI) | 0.11 [‐0.16, 0.38] |
| 15.2 More than 12 weeks | 2 | 193 | Std. Mean Difference (IV, Fixed, 95% CI) | 0.21 [‐0.07, 0.49] |
| 16 Overall sexual function (change values) Show forest plot | 3 | Mean Difference (IV, Random, 95% CI) | Subtotals only | |
| Analysis 15.16  Comparison 15 Subanalysis: outcomes by duration of physical activity intervention, Outcome 16 Overall sexual function (change values). | ||||
| 16.1 12 weeks or less | 0 | 0 | Mean Difference (IV, Random, 95% CI) | 0.0 [0.0, 0.0] |
| 16.2 More than 12 weeks | 3 | 693 | Mean Difference (IV, Random, 95% CI) | 2.44 [‐0.76, 5.64] |
| 17 Overall sleep (follow‐up values) Show forest plot | 5 | Std. Mean Difference (IV, Fixed, 95% CI) | Subtotals only | |
| Analysis 15.17  Comparison 15 Subanalysis: outcomes by duration of physical activity intervention, Outcome 17 Overall sleep (follow‐up values). | ||||
| 17.1 12 weeks or less | 5 | 188 | Std. Mean Difference (IV, Fixed, 95% CI) | ‐0.09 [‐0.37, 0.20] |
| 17.2 More than 12 weeks | 0 | 0 | Std. Mean Difference (IV, Fixed, 95% CI) | 0.0 [0.0, 0.0] |
| 18 Overall sleep (change values) Show forest plot | 3 | Std. Mean Difference (IV, Random, 95% CI) | Subtotals only | |
| Analysis 15.18  Comparison 15 Subanalysis: outcomes by duration of physical activity intervention, Outcome 18 Overall sleep (change values). | ||||
| 18.1 12 weeks or less | 3 | 136 | Std. Mean Difference (IV, Random, 95% CI) | 0.14 [‐0.20, 0.48] |
| 18.2 More than 12 weeks | 0 | 0 | Std. Mean Difference (IV, Random, 95% CI) | 0.0 [0.0, 0.0] |
| 19 Overall anxiety (follow‐up values) Show forest plot | 7 | Std. Mean Difference (IV, Random, 95% CI) | Subtotals only | |
| Analysis 15.19  Comparison 15 Subanalysis: outcomes by duration of physical activity intervention, Outcome 19 Overall anxiety (follow‐up values). | ||||
| 19.1 12 weeks or less | 6 | 252 | Std. Mean Difference (IV, Random, 95% CI) | ‐0.67 [‐1.09, ‐0.25] |
| 19.2 More than 12 weeks | 1 | 74 | Std. Mean Difference (IV, Random, 95% CI) | ‐0.14 [‐0.60, 0.31] |
| 20 Overall anxiety (change values) Show forest plot | 4 | Std. Mean Difference (IV, Fixed, 95% CI) | Subtotals only | |
| Analysis 15.20  Comparison 15 Subanalysis: outcomes by duration of physical activity intervention, Outcome 20 Overall anxiety (change values). | ||||
| 20.1 12 weeks or less | 3 | 161 | Std. Mean Difference (IV, Fixed, 95% CI) | ‐0.48 [‐0.79, ‐0.16] |
| 20.2 More than 12 weeks | 1 | 74 | Std. Mean Difference (IV, Fixed, 95% CI) | ‐0.15 [‐0.61, 0.30] |
| 21 Overall depression (follow‐up values) Show forest plot | 12 | Std. Mean Difference (IV, Random, 95% CI) | Subtotals only | |
| Analysis 15.21 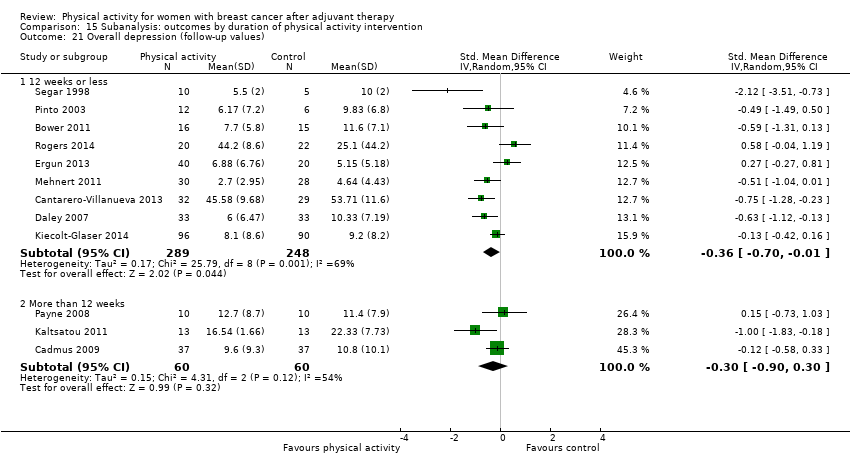 Comparison 15 Subanalysis: outcomes by duration of physical activity intervention, Outcome 21 Overall depression (follow‐up values). | ||||
| 21.1 12 weeks or less | 9 | 537 | Std. Mean Difference (IV, Random, 95% CI) | ‐0.36 [‐0.70, ‐0.01] |
| 21.2 More than 12 weeks | 3 | 120 | Std. Mean Difference (IV, Random, 95% CI) | ‐0.30 [‐0.90, 0.30] |
| 22 Overall depression (change values) Show forest plot | 6 | Std. Mean Difference (IV, Random, 95% CI) | Subtotals only | |
| Analysis 15.22  Comparison 15 Subanalysis: outcomes by duration of physical activity intervention, Outcome 22 Overall depression (change values). | ||||
| 22.1 12 weeks or less | 4 | 182 | Std. Mean Difference (IV, Random, 95% CI) | ‐0.60 [‐0.89, ‐0.30] |
| 22.2 More than 12 weeks | 2 | 574 | Std. Mean Difference (IV, Random, 95% CI) | 0.00 [‐0.21, 0.22] |
| 23 Overall fatigue (follow‐up values) Show forest plot | 25 | Std. Mean Difference (IV, Random, 95% CI) | Subtotals only | |
| Analysis 15.23  Comparison 15 Subanalysis: outcomes by duration of physical activity intervention, Outcome 23 Overall fatigue (follow‐up values). | ||||
| 23.1 12 weeks or less | 20 | 1657 | Std. Mean Difference (IV, Random, 95% CI) | ‐0.42 [‐0.59, ‐0.25] |
| 23.2 More than 12 weeks | 5 | 268 | Std. Mean Difference (IV, Random, 95% CI) | 0.02 [‐0.22, 0.26] |
| 24 Overall fatigue (change values) Show forest plot | 12 | Std. Mean Difference (IV, Random, 95% CI) | Subtotals only | |
| Analysis 15.24  Comparison 15 Subanalysis: outcomes by duration of physical activity intervention, Outcome 24 Overall fatigue (change values). | ||||
| 24.1 12 weeks or less | 10 | 719 | Std. Mean Difference (IV, Random, 95% CI) | ‐0.44 [‐0.83, ‐0.05] |
| 24.2 More than 12 weeks | 2 | 552 | Std. Mean Difference (IV, Random, 95% CI) | 0.36 [‐0.43, 1.15] |
| 25 Overall pain/disability (follow‐up values) Show forest plot | 9 | Std. Mean Difference (IV, Random, 95% CI) | Subtotals only | |
| Analysis 15.25 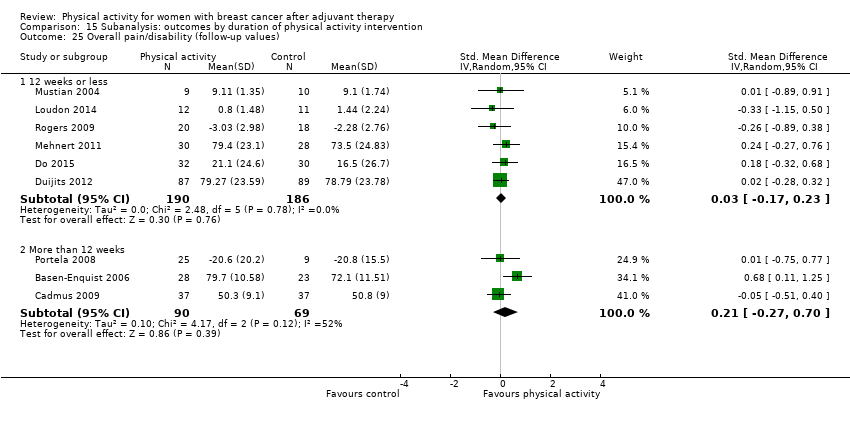 Comparison 15 Subanalysis: outcomes by duration of physical activity intervention, Outcome 25 Overall pain/disability (follow‐up values). | ||||
| 25.1 12 weeks or less | 6 | 376 | Std. Mean Difference (IV, Random, 95% CI) | 0.03 [‐0.17, 0.23] |
| 25.2 More than 12 weeks | 3 | 159 | Std. Mean Difference (IV, Random, 95% CI) | 0.21 [‐0.27, 0.70] |
| 26 Overall pain/disability (change values) Show forest plot | 5 | Std. Mean Difference (IV, Random, 95% CI) | Subtotals only | |
| Analysis 15.26 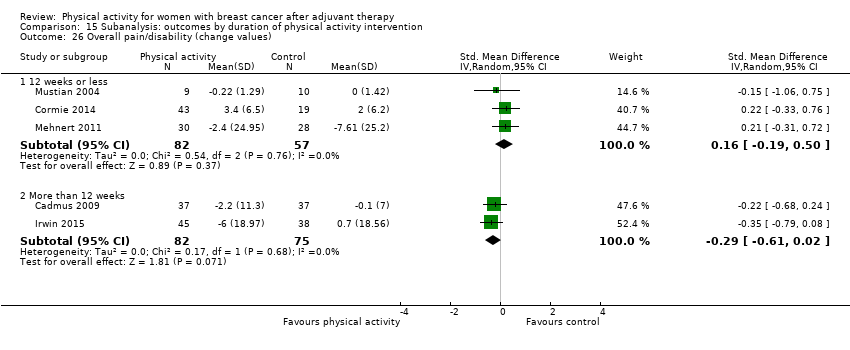 Comparison 15 Subanalysis: outcomes by duration of physical activity intervention, Outcome 26 Overall pain/disability (change values). | ||||
| 26.1 12 weeks or less | 3 | 139 | Std. Mean Difference (IV, Random, 95% CI) | 0.16 [‐0.19, 0.50] |
| 26.2 More than 12 weeks | 2 | 157 | Std. Mean Difference (IV, Random, 95% CI) | ‐0.29 [‐0.61, 0.02] |
| 27 Overall self‐esteem/body image (follow‐up values) Show forest plot | 12 | Std. Mean Difference (IV, Random, 95% CI) | Subtotals only | |
| Analysis 15.27  Comparison 15 Subanalysis: outcomes by duration of physical activity intervention, Outcome 27 Overall self‐esteem/body image (follow‐up values). | ||||
| 27.1 12 weeks or less | 9 | 419 | Std. Mean Difference (IV, Random, 95% CI) | 0.36 [0.07, 0.66] |
| 27.2 More than 12 weeks | 3 | 248 | Std. Mean Difference (IV, Random, 95% CI) | 0.08 [‐0.17, 0.33] |
| 28 Overall self‐esteem/body image (change values) Show forest plot | 9 | Std. Mean Difference (IV, Random, 95% CI) | Subtotals only | |
| Analysis 15.28 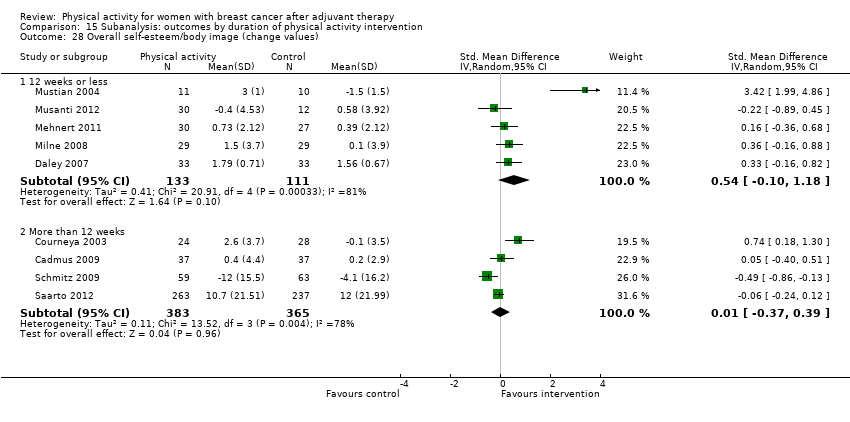 Comparison 15 Subanalysis: outcomes by duration of physical activity intervention, Outcome 28 Overall self‐esteem/body image (change values). | ||||
| 28.1 12 weeks or less | 5 | 244 | Std. Mean Difference (IV, Random, 95% CI) | 0.54 [‐0.10, 1.18] |
| 28.2 More than 12 weeks | 4 | 748 | Std. Mean Difference (IV, Random, 95% CI) | 0.01 [‐0.37, 0.39] |
| 29 Overall cardiorespiratory fitness (follow‐up values) Show forest plot | 23 | Std. Mean Difference (IV, Random, 95% CI) | Subtotals only | |
| Analysis 15.29 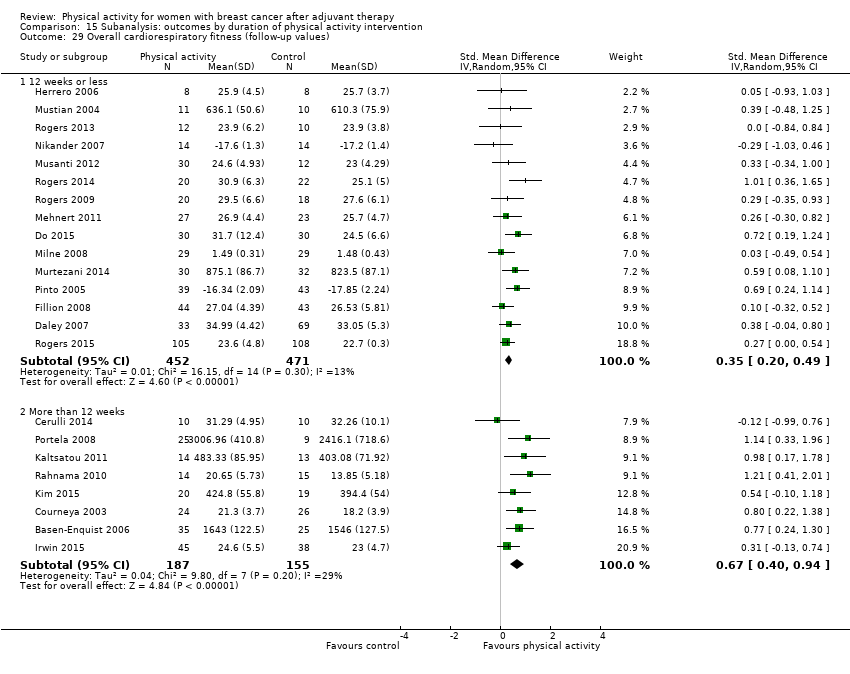 Comparison 15 Subanalysis: outcomes by duration of physical activity intervention, Outcome 29 Overall cardiorespiratory fitness (follow‐up values). | ||||
| 29.1 12 weeks or less | 15 | 923 | Std. Mean Difference (IV, Random, 95% CI) | 0.35 [0.20, 0.49] |
| 29.2 More than 12 weeks | 8 | 342 | Std. Mean Difference (IV, Random, 95% CI) | 0.67 [0.40, 0.94] |
| 30 Overall cardiorespiratory fitness (change values) Show forest plot | 9 | Std. Mean Difference (IV, Random, 95% CI) | Subtotals only | |
| Analysis 15.30  Comparison 15 Subanalysis: outcomes by duration of physical activity intervention, Outcome 30 Overall cardiorespiratory fitness (change values). | ||||
| 30.1 12 weeks or less | 6 | 232 | Std. Mean Difference (IV, Random, 95% CI) | 0.91 [0.31, 1.52] |
| 30.2 More than 12 weeks | 3 | 631 | Std. Mean Difference (IV, Random, 95% CI) | 0.76 [0.02, 1.51] |
| 31 Overall self‐reported physical activity (follow‐up values) Show forest plot | 18 | Std. Mean Difference (IV, Random, 95% CI) | Subtotals only | |
| Analysis 15.31  Comparison 15 Subanalysis: outcomes by duration of physical activity intervention, Outcome 31 Overall self‐reported physical activity (follow‐up values). | ||||
| 31.1 12 weeks or less | 11 | 1401 | Std. Mean Difference (IV, Random, 95% CI) | 0.60 [0.36, 0.84] |
| 31.2 More than 12 weeks | 7 | 643 | Std. Mean Difference (IV, Random, 95% CI) | 0.41 [0.09, 0.74] |
| 32 Overall self‐reported physical activity (change values) Show forest plot | 8 | Std. Mean Difference (IV, Random, 95% CI) | Subtotals only | |
| Analysis 15.32 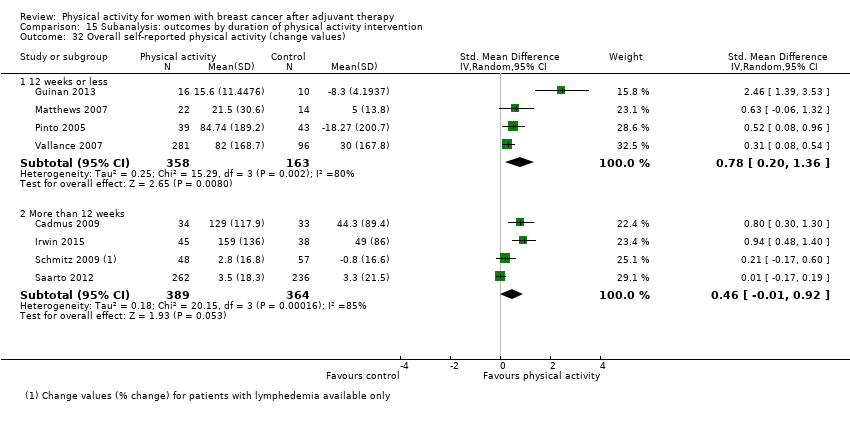 Comparison 15 Subanalysis: outcomes by duration of physical activity intervention, Outcome 32 Overall self‐reported physical activity (change values). | ||||
| 32.1 12 weeks or less | 4 | 521 | Std. Mean Difference (IV, Random, 95% CI) | 0.78 [0.20, 1.36] |
| 32.2 More than 12 weeks | 4 | 753 | Std. Mean Difference (IV, Random, 95% CI) | 0.46 [‐0.01, 0.92] |
| 33 Overall objective physical activity (follow‐up values) Show forest plot | 11 | Std. Mean Difference (IV, Random, 95% CI) | Subtotals only | |
| Analysis 15.33  Comparison 15 Subanalysis: outcomes by duration of physical activity intervention, Outcome 33 Overall objective physical activity (follow‐up values). | ||||
| 33.1 12 weeks or less | 10 | 1203 | Std. Mean Difference (IV, Random, 95% CI) | 0.44 [0.18, 0.70] |
| 33.2 More than 12 weeks | 1 | 67 | Std. Mean Difference (IV, Random, 95% CI) | 0.38 [‐0.11, 0.86] |
| 34 Overall objective physical activity (change values) Show forest plot | 5 | Std. Mean Difference (IV, Random, 95% CI) | Subtotals only | |
| Analysis 15.34  Comparison 15 Subanalysis: outcomes by duration of physical activity intervention, Outcome 34 Overall objective physical activity (change values). | ||||
| 34.1 12 weeks or less | 4 | 441 | Std. Mean Difference (IV, Random, 95% CI) | 0.72 [‐0.02, 1.46] |
| 34.2 More than 12 weeks | 1 | 67 | Std. Mean Difference (IV, Random, 95% CI) | 0.75 [0.25, 1.24] |
| 35 Mass (follow‐up values) Show forest plot | 16 | Mean Difference (IV, Fixed, 95% CI) | Subtotals only | |
| Analysis 15.35  Comparison 15 Subanalysis: outcomes by duration of physical activity intervention, Outcome 35 Mass (follow‐up values). | ||||
| 35.1 12 weeks or less | 7 | 451 | Mean Difference (IV, Fixed, 95% CI) | ‐0.10 [‐0.85, 0.65] |
| 35.2 More than 12 weeks | 9 | 759 | Mean Difference (IV, Fixed, 95% CI) | 0.14 [‐0.76, 1.05] |
| 36 Mass (change values) Show forest plot | 11 | Mean Difference (IV, Random, 95% CI) | Subtotals only | |
| Analysis 15.36  Comparison 15 Subanalysis: outcomes by duration of physical activity intervention, Outcome 36 Mass (change values). | ||||
| 36.1 12 weeks or less | 5 | 171 | Mean Difference (IV, Random, 95% CI) | ‐0.82 [‐1.81, 0.17] |
| 36.2 More than 12 weeks | 6 | 876 | Mean Difference (IV, Random, 95% CI) | ‐0.25 [‐0.73, 0.24] |
| 37 BMI (follow‐up values) Show forest plot | 17 | Mean Difference (IV, Fixed, 95% CI) | Subtotals only | |
| Analysis 15.37 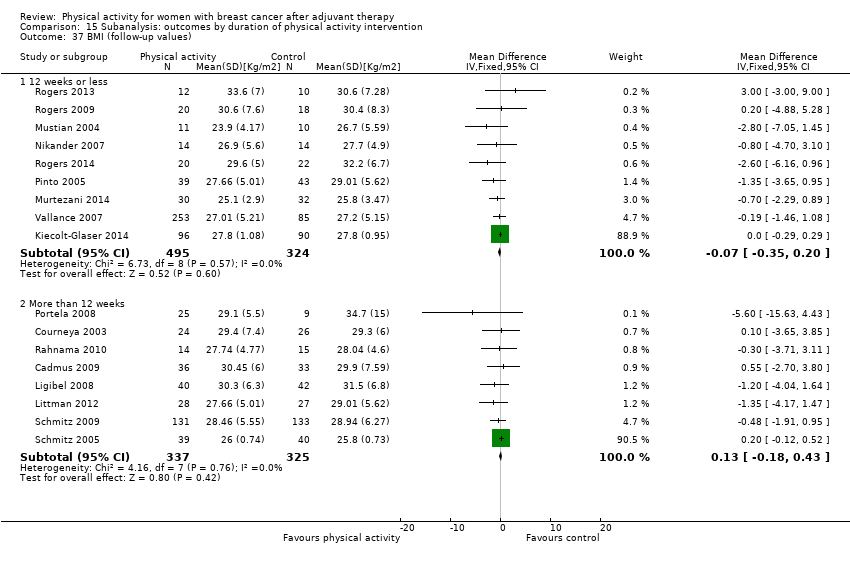 Comparison 15 Subanalysis: outcomes by duration of physical activity intervention, Outcome 37 BMI (follow‐up values). | ||||
| 37.1 12 weeks or less | 9 | 819 | Mean Difference (IV, Fixed, 95% CI) | ‐0.07 [‐0.35, 0.20] |
| 37.2 More than 12 weeks | 8 | 662 | Mean Difference (IV, Fixed, 95% CI) | 0.13 [‐0.18, 0.43] |
| 38 BMI (change values) Show forest plot | 8 | Mean Difference (IV, Random, 95% CI) | Subtotals only | |
| Analysis 15.38  Comparison 15 Subanalysis: outcomes by duration of physical activity intervention, Outcome 38 BMI (change values). | ||||
| 38.1 12 weeks or less | 4 | 144 | Mean Difference (IV, Random, 95% CI) | ‐0.27 [‐0.76, 0.22] |
| 38.2 More than 12 weeks | 4 | 341 | Mean Difference (IV, Random, 95% CI) | ‐0.08 [‐0.22, 0.07] |
| 39 Overall body fat (follow‐up values) Show forest plot | 18 | Std. Mean Difference (IV, Random, 95% CI) | Subtotals only | |
| Analysis 15.39  Comparison 15 Subanalysis: outcomes by duration of physical activity intervention, Outcome 39 Overall body fat (follow‐up values). | ||||
| 39.1 12 weeks or less | 9 | 402 | Std. Mean Difference (IV, Random, 95% CI) | ‐0.16 [‐0.37, 0.04] |
| 39.2 More than 12 weeks | 9 | 760 | Std. Mean Difference (IV, Random, 95% CI) | ‐0.20 [‐0.45, 0.05] |
| 40 Overall body fat (change values) Show forest plot | 9 | Std. Mean Difference (IV, Random, 95% CI) | Subtotals only | |
| Analysis 15.40 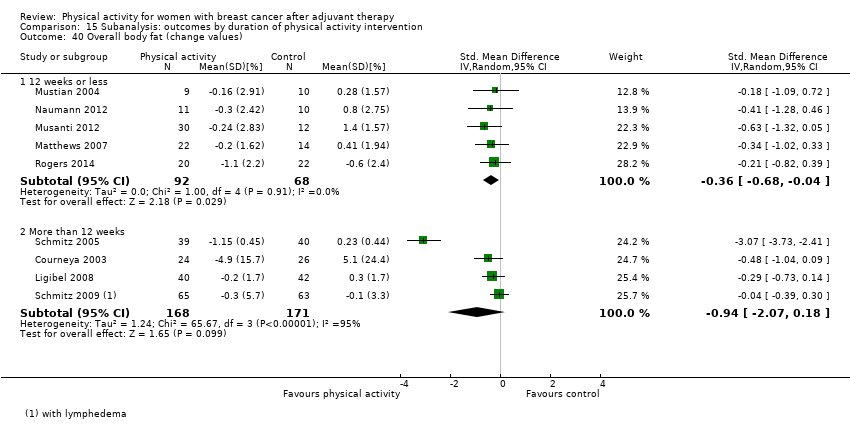 Comparison 15 Subanalysis: outcomes by duration of physical activity intervention, Outcome 40 Overall body fat (change values). | ||||
| 40.1 12 weeks or less | 5 | 160 | Std. Mean Difference (IV, Random, 95% CI) | ‐0.36 [‐0.68, ‐0.04] |
| 40.2 More than 12 weeks | 4 | 339 | Std. Mean Difference (IV, Random, 95% CI) | ‐0.94 [‐2.07, 0.18] |
| 41 Lower body strength (follow‐up values) Show forest plot | 10 | Std. Mean Difference (IV, Random, 95% CI) | Subtotals only | |
| Analysis 15.41  Comparison 15 Subanalysis: outcomes by duration of physical activity intervention, Outcome 41 Lower body strength (follow‐up values). | ||||
| 41.1 12 weeks or less | 5 | 206 | Std. Mean Difference (IV, Random, 95% CI) | 0.15 [‐0.19, 0.50] |
| 41.2 More than 12 weeks | 5 | 431 | Std. Mean Difference (IV, Random, 95% CI) | 0.72 [0.20, 1.24] |
| 42 Lower body strength (change values) Show forest plot | 8 | Std. Mean Difference (IV, Random, 95% CI) | Subtotals only | |
| Analysis 15.42  Comparison 15 Subanalysis: outcomes by duration of physical activity intervention, Outcome 42 Lower body strength (change values). | ||||
| 42.1 12 weeks or less | 5 | 220 | Std. Mean Difference (IV, Random, 95% CI) | 0.71 [0.06, 1.37] |
| 42.2 More than 12 weeks | 3 | 500 | Std. Mean Difference (IV, Random, 95% CI) | 0.76 [0.36, 1.17] |
| 43 Upper body strength (follow‐up values) Show forest plot | 13 | Std. Mean Difference (IV, Random, 95% CI) | Subtotals only | |
| Analysis 15.43 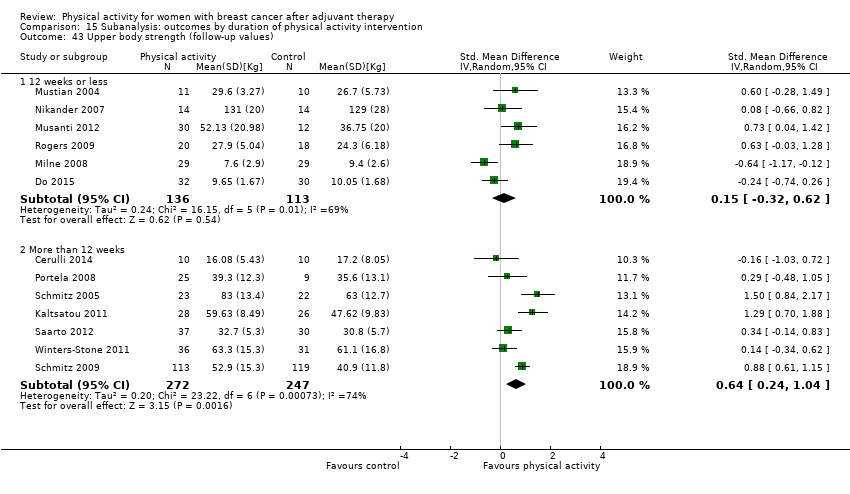 Comparison 15 Subanalysis: outcomes by duration of physical activity intervention, Outcome 43 Upper body strength (follow‐up values). | ||||
| 43.1 12 weeks or less | 6 | 249 | Std. Mean Difference (IV, Random, 95% CI) | 0.15 [‐0.32, 0.62] |
| 43.2 More than 12 weeks | 7 | 519 | Std. Mean Difference (IV, Random, 95% CI) | 0.64 [0.24, 1.04] |
| 44 Upper body strength (change values) Show forest plot | 8 | Std. Mean Difference (IV, Random, 95% CI) | Subtotals only | |
| Analysis 15.44  Comparison 15 Subanalysis: outcomes by duration of physical activity intervention, Outcome 44 Upper body strength (change values). | ||||
| 44.1 12 weeks or less | 4 | 249 | Std. Mean Difference (IV, Random, 95% CI) | 0.72 [‐0.06, 1.50] |
| 44.2 More than 12 weeks | 4 | 583 | Std. Mean Difference (IV, Random, 95% CI) | 0.71 [0.17, 1.25] |
| Outcome or subgroup title | No. of studies | No. of participants | Statistical method | Effect size |
| 1 Overall HRQoL (follow‐up values) Show forest plot | 21 | Std. Mean Difference (IV, Random, 95% CI) | Subtotals only | |
| Analysis 16.1 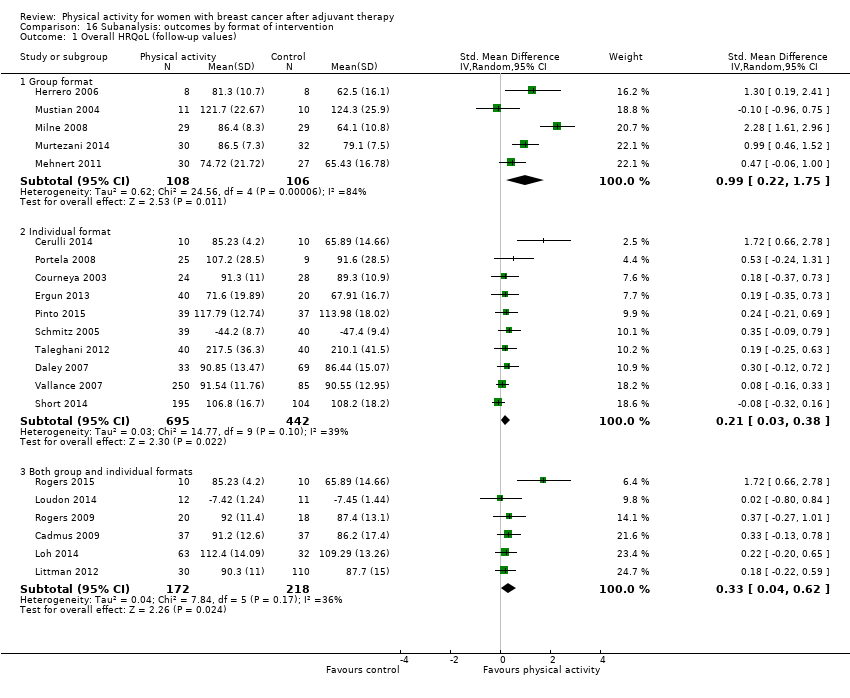 Comparison 16 Subanalysis: outcomes by format of intervention, Outcome 1 Overall HRQoL (follow‐up values). | ||||
| 1.1 Group format | 5 | 214 | Std. Mean Difference (IV, Random, 95% CI) | 0.99 [0.22, 1.75] |
| 1.2 Individual format | 10 | 1137 | Std. Mean Difference (IV, Random, 95% CI) | 0.21 [0.03, 0.38] |
| 1.3 Both group and individual formats | 6 | 390 | Std. Mean Difference (IV, Random, 95% CI) | 0.33 [0.04, 0.62] |
| 2 Overall HRQoL (change values) Show forest plot | 14 | Std. Mean Difference (IV, Random, 95% CI) | Subtotals only | |
| Analysis 16.2  Comparison 16 Subanalysis: outcomes by format of intervention, Outcome 2 Overall HRQoL (change values). | ||||
| 2.1 Group format | 5 | 198 | Std. Mean Difference (IV, Random, 95% CI) | 1.88 [0.19, 3.56] |
| 2.2 Individual format | 6 | 649 | Std. Mean Difference (IV, Random, 95% CI) | 0.43 [0.25, 0.61] |
| 2.3 Both group and individual formats | 3 | 612 | Std. Mean Difference (IV, Random, 95% CI) | 0.06 [‐0.22, 0.33] |
| 3 Overall emotional function/mental health (follow‐up values) Show forest plot | 26 | Std. Mean Difference (IV, Random, 95% CI) | Subtotals only | |
| Analysis 16.3 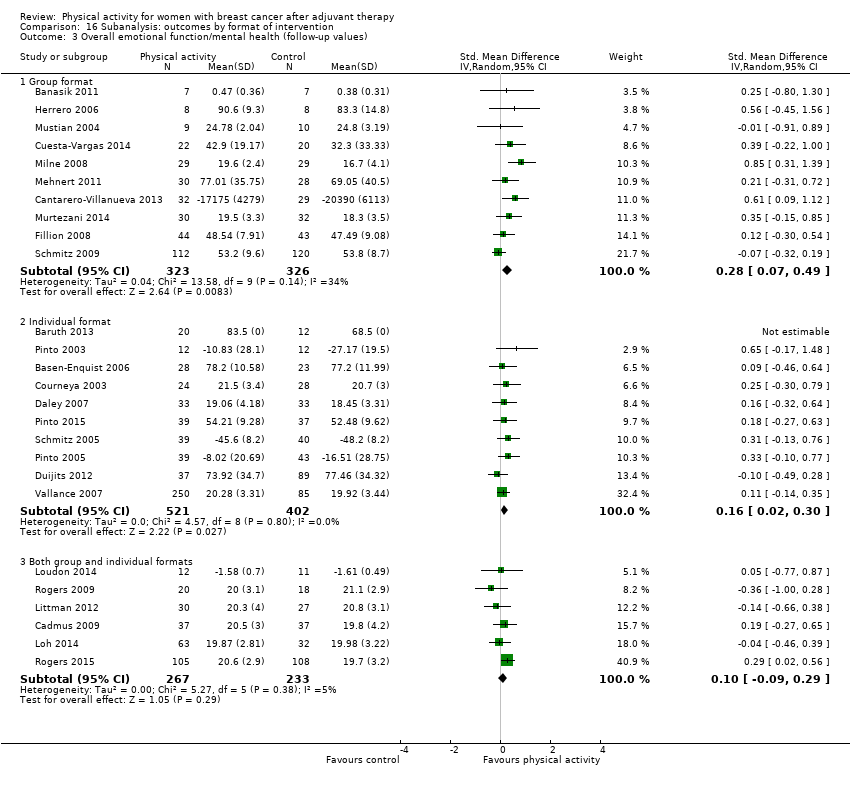 Comparison 16 Subanalysis: outcomes by format of intervention, Outcome 3 Overall emotional function/mental health (follow‐up values). | ||||
| 3.1 Group format | 10 | 649 | Std. Mean Difference (IV, Random, 95% CI) | 0.28 [0.07, 0.49] |
| 3.2 Individual format | 10 | 923 | Std. Mean Difference (IV, Random, 95% CI) | 0.16 [0.02, 0.30] |
| 3.3 Both group and individual formats | 6 | 500 | Std. Mean Difference (IV, Random, 95% CI) | 0.10 [‐0.09, 0.29] |
| 4 Overall emotional function/mental health (change values) Show forest plot | 15 | Std. Mean Difference (IV, Random, 95% CI) | Subtotals only | |
| Analysis 16.4 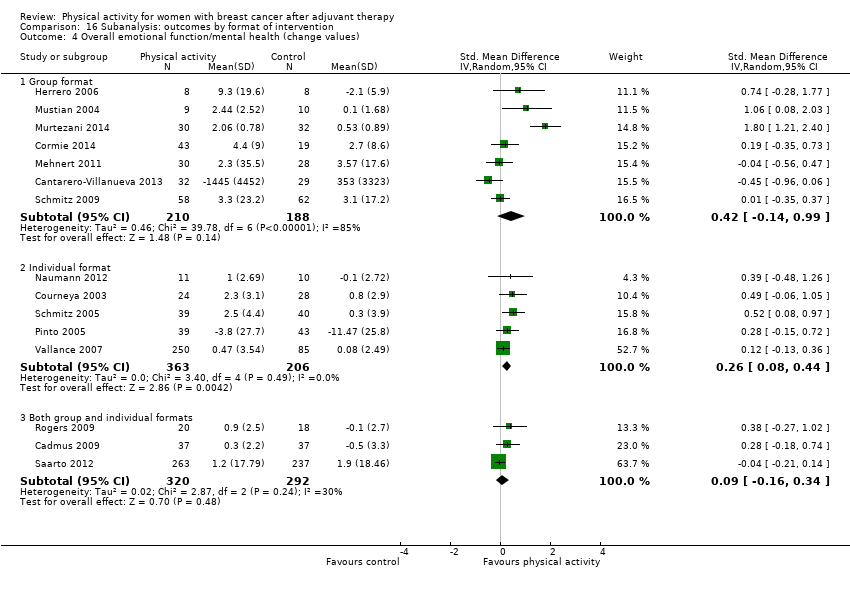 Comparison 16 Subanalysis: outcomes by format of intervention, Outcome 4 Overall emotional function/mental health (change values). | ||||
| 4.1 Group format | 7 | 398 | Std. Mean Difference (IV, Random, 95% CI) | 0.42 [‐0.14, 0.99] |
| 4.2 Individual format | 5 | 569 | Std. Mean Difference (IV, Random, 95% CI) | 0.26 [0.08, 0.44] |
| 4.3 Both group and individual formats | 3 | 612 | Std. Mean Difference (IV, Random, 95% CI) | 0.09 [‐0.16, 0.34] |
| 5 Overall physical function (follow‐up values) Show forest plot | 24 | Std. Mean Difference (IV, Random, 95% CI) | Subtotals only | |
| Analysis 16.5  Comparison 16 Subanalysis: outcomes by format of intervention, Outcome 5 Overall physical function (follow‐up values). | ||||
| 5.1 Group format | 9 | 588 | Std. Mean Difference (IV, Random, 95% CI) | 0.53 [0.12, 0.94] |
| 5.2 Individual format | 9 | 941 | Std. Mean Difference (IV, Random, 95% CI) | 0.28 [0.12, 0.45] |
| 5.3 Both group and individual formats | 6 | 538 | Std. Mean Difference (IV, Random, 95% CI) | 0.18 [‐0.06, 0.42] |
| 6 Overall physical function (change values) Show forest plot | 13 | Std. Mean Difference (IV, Random, 95% CI) | Subtotals only | |
| Analysis 16.6 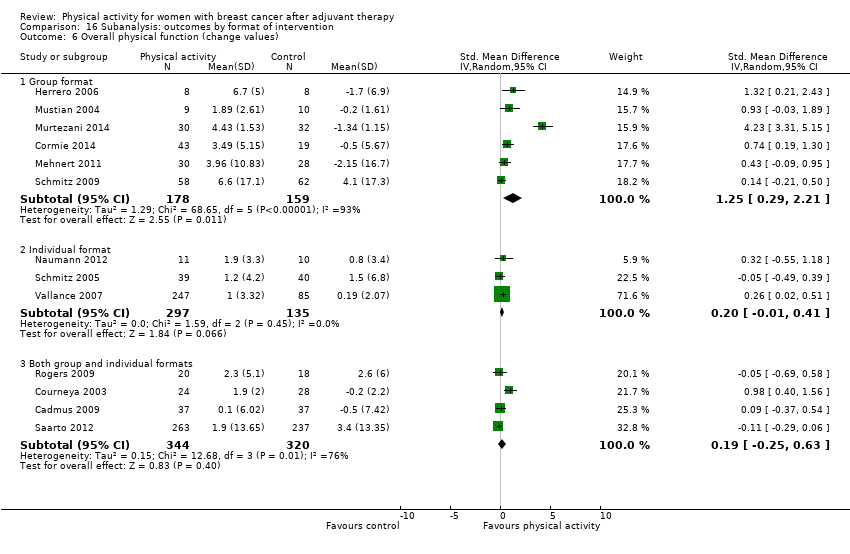 Comparison 16 Subanalysis: outcomes by format of intervention, Outcome 6 Overall physical function (change values). | ||||
| 6.1 Group format | 6 | 337 | Std. Mean Difference (IV, Random, 95% CI) | 1.25 [0.29, 2.21] |
| 6.2 Individual format | 3 | 432 | Std. Mean Difference (IV, Random, 95% CI) | 0.20 [‐0.01, 0.41] |
| 6.3 Both group and individual formats | 4 | 664 | Std. Mean Difference (IV, Random, 95% CI) | 0.19 [‐0.25, 0.63] |
| 7 Overall role function (follow‐up values) Show forest plot | 18 | Std. Mean Difference (IV, Random, 95% CI) | Subtotals only | |
| Analysis 16.7  Comparison 16 Subanalysis: outcomes by format of intervention, Outcome 7 Overall role function (follow‐up values). | ||||
| 7.1 Group format | 6 | 225 | Std. Mean Difference (IV, Random, 95% CI) | 0.52 [‐0.27, 1.30] |
| 7.2 Individual format | 7 | 689 | Std. Mean Difference (IV, Random, 95% CI) | 0.23 [0.07, 0.40] |
| 7.3 Both group and individual formats | 5 | 426 | Std. Mean Difference (IV, Random, 95% CI) | 0.15 [‐0.15, 0.45] |
| 8 Overall role function (change values) Show forest plot | 12 | Std. Mean Difference (IV, Random, 95% CI) | Subtotals only | |
| Analysis 16.8  Comparison 16 Subanalysis: outcomes by format of intervention, Outcome 8 Overall role function (change values). | ||||
| 8.1 Group format | 5 | 216 | Std. Mean Difference (IV, Random, 95% CI) | 0.36 [‐0.14, 0.85] |
| 8.2 Individual format | 4 | 487 | Std. Mean Difference (IV, Random, 95% CI) | 0.13 [‐0.07, 0.32] |
| 8.3 Both group and individual formats | 3 | 612 | Std. Mean Difference (IV, Random, 95% CI) | ‐0.06 [‐0.22, 0.10] |
| 9 Overall social well‐being/function (follow‐up values) Show forest plot | 18 | Std. Mean Difference (IV, Random, 95% CI) | Subtotals only | |
| Analysis 16.9  Comparison 16 Subanalysis: outcomes by format of intervention, Outcome 9 Overall social well‐being/function (follow‐up values). | ||||
| 9.1 Group format | 7 | 348 | Std. Mean Difference (IV, Random, 95% CI) | 0.22 [0.00, 0.45] |
| 9.2 Individual format | 5 | 546 | Std. Mean Difference (IV, Random, 95% CI) | 0.27 [‐0.07, 0.61] |
| 9.3 Both group and individual formats | 6 | 663 | Std. Mean Difference (IV, Random, 95% CI) | 0.16 [0.01, 0.32] |
| 10 Overall social well‐being/function (change values) Show forest plot | 12 | Std. Mean Difference (IV, Random, 95% CI) | Subtotals only | |
| Analysis 16.10  Comparison 16 Subanalysis: outcomes by format of intervention, Outcome 10 Overall social well‐being/function (change values). | ||||
| 10.1 Group format | 5 | 322 | Std. Mean Difference (IV, Random, 95% CI) | 0.57 [‐0.06, 1.19] |
| 10.2 Individual format | 4 | 450 | Std. Mean Difference (IV, Random, 95% CI) | 0.72 [0.38, 1.06] |
| 10.3 Both group and individual formats | 3 | 612 | Std. Mean Difference (IV, Random, 95% CI) | 0.27 [‐0.31, 0.85] |
| 11 Overall cognitive function (follow‐up values) Show forest plot | 5 | Std. Mean Difference (IV, Random, 95% CI) | Subtotals only | |
| Analysis 16.11  Comparison 16 Subanalysis: outcomes by format of intervention, Outcome 11 Overall cognitive function (follow‐up values). | ||||
| 11.1 Group format | 3 | 134 | Std. Mean Difference (IV, Random, 95% CI) | 0.32 [‐0.02, 0.66] |
| 11.2 Individual format | 1 | 18 | Std. Mean Difference (IV, Random, 95% CI) | 1.14 [0.07, 2.20] |
| 11.3 Both group and individual formats | 1 | 37 | Std. Mean Difference (IV, Random, 95% CI) | 0.42 [‐0.24, 1.07] |
| 12 Overall cognitive function (change values) Show forest plot | 5 | Std. Mean Difference (IV, Random, 95% CI) | Subtotals only | |
| Analysis 16.12  Comparison 16 Subanalysis: outcomes by format of intervention, Outcome 12 Overall cognitive function (change values). | ||||
| 12.1 Group format | 3 | 134 | Std. Mean Difference (IV, Random, 95% CI) | 0.06 [‐0.31, 0.43] |
| 12.2 Individual format | 0 | 0 | Std. Mean Difference (IV, Random, 95% CI) | 0.0 [0.0, 0.0] |
| 12.3 Both group and individual formats | 2 | 538 | Std. Mean Difference (IV, Random, 95% CI) | 0.03 [‐0.51, 0.57] |
| 13 Overall general health (follow‐up values) Show forest plot | 9 | Std. Mean Difference (IV, Random, 95% CI) | Subtotals only | |
| Analysis 16.13 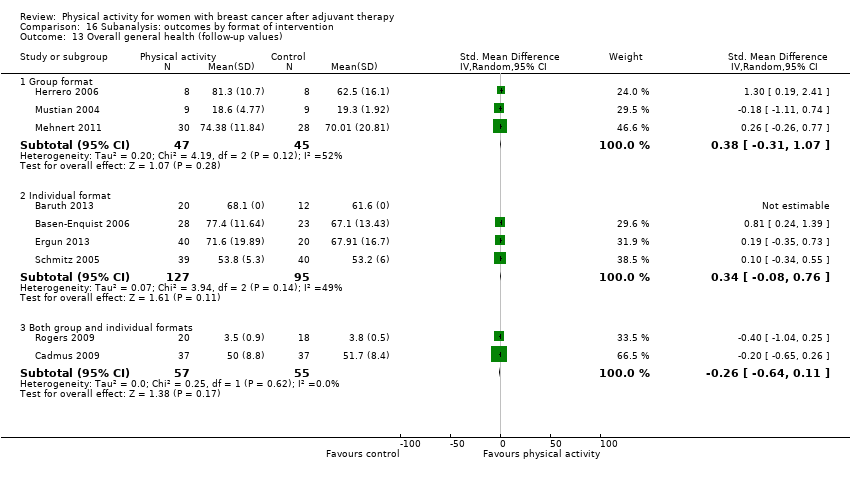 Comparison 16 Subanalysis: outcomes by format of intervention, Outcome 13 Overall general health (follow‐up values). | ||||
| 13.1 Group format | 3 | 92 | Std. Mean Difference (IV, Random, 95% CI) | 0.38 [‐0.31, 1.07] |
| 13.2 Individual format | 4 | 222 | Std. Mean Difference (IV, Random, 95% CI) | 0.34 [‐0.08, 0.76] |
| 13.3 Both group and individual formats | 2 | 112 | Std. Mean Difference (IV, Random, 95% CI) | ‐0.26 [‐0.64, 0.11] |
| 14 Overall general health (change values) Show forest plot | 9 | Std. Mean Difference (IV, Random, 95% CI) | Subtotals only | |
| Analysis 16.14 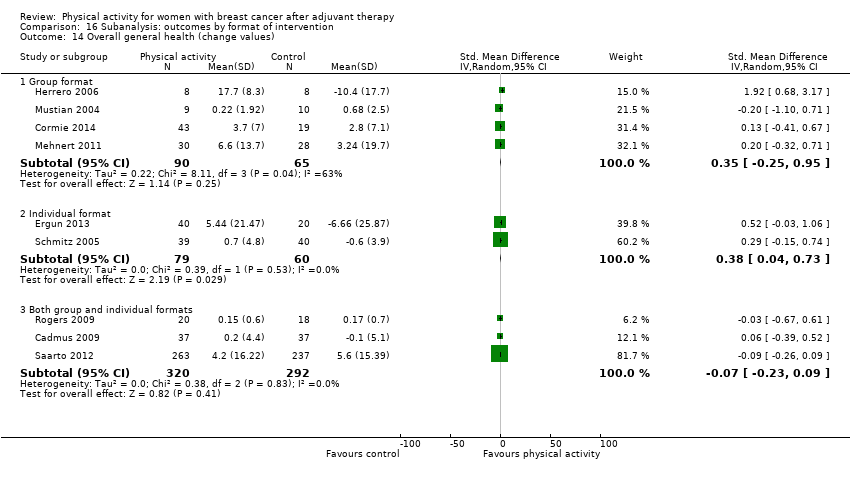 Comparison 16 Subanalysis: outcomes by format of intervention, Outcome 14 Overall general health (change values). | ||||
| 14.1 Group format | 4 | 155 | Std. Mean Difference (IV, Random, 95% CI) | 0.35 [‐0.25, 0.95] |
| 14.2 Individual format | 2 | 139 | Std. Mean Difference (IV, Random, 95% CI) | 0.38 [0.04, 0.73] |
| 14.3 Both group and individual formats | 3 | 612 | Std. Mean Difference (IV, Random, 95% CI) | ‐0.07 [‐0.23, 0.09] |
| 15 Overall sexual function (follow‐up values) Show forest plot | 5 | Std. Mean Difference (IV, Fixed, 95% CI) | Subtotals only | |
| Analysis 16.15 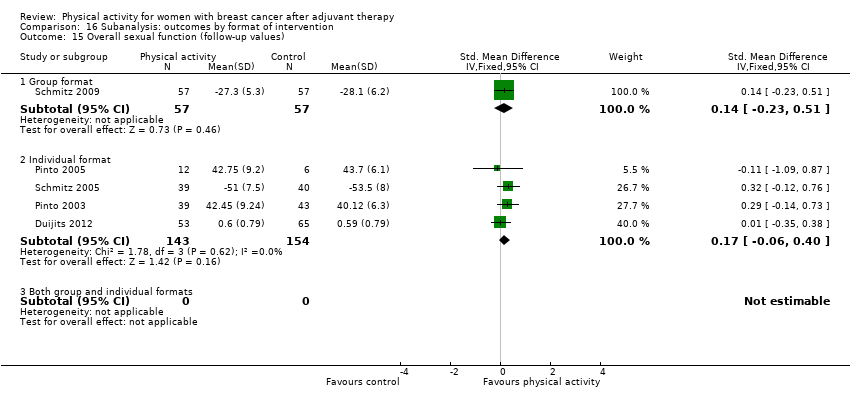 Comparison 16 Subanalysis: outcomes by format of intervention, Outcome 15 Overall sexual function (follow‐up values). | ||||
| 15.1 Group format | 1 | 114 | Std. Mean Difference (IV, Fixed, 95% CI) | 0.14 [‐0.23, 0.51] |
| 15.2 Individual format | 4 | 297 | Std. Mean Difference (IV, Fixed, 95% CI) | 0.17 [‐0.06, 0.40] |
| 15.3 Both group and individual formats | 0 | 0 | Std. Mean Difference (IV, Fixed, 95% CI) | 0.0 [0.0, 0.0] |
| 16 Overall sleep (follow‐up values) Show forest plot | 5 | Std. Mean Difference (IV, Fixed, 95% CI) | Subtotals only | |
| Analysis 16.16  Comparison 16 Subanalysis: outcomes by format of intervention, Outcome 16 Overall sleep (follow‐up values). | ||||
| 16.1 Group format | 2 | 88 | Std. Mean Difference (IV, Fixed, 95% CI) | ‐0.26 [‐0.68, 0.16] |
| 16.2 Individual format | 2 | 62 | Std. Mean Difference (IV, Fixed, 95% CI) | ‐0.07 [‐0.57, 0.43] |
| 16.3 Both group and individual formats | 1 | 38 | Std. Mean Difference (IV, Fixed, 95% CI) | 0.28 [‐0.36, 0.92] |
| 17 Overall anxiety (follow‐up values) Show forest plot | 6 | Std. Mean Difference (IV, Random, 95% CI) | Subtotals only | |
| Analysis 16.17  Comparison 16 Subanalysis: outcomes by format of intervention, Outcome 17 Overall anxiety (follow‐up values). | ||||
| 17.1 Group format | 3 | 177 | Std. Mean Difference (IV, Random, 95% CI) | ‐0.73 [‐1.03, ‐0.42] |
| 17.2 Individual format | 2 | 60 | Std. Mean Difference (IV, Random, 95% CI) | ‐0.13 [‐0.64, 0.39] |
| 17.3 Both group and individual formats | 1 | 74 | Std. Mean Difference (IV, Random, 95% CI) | ‐0.14 [‐0.60, 0.31] |
| 18 Overall anxiety (change values) Show forest plot | 4 | Std. Mean Difference (IV, Fixed, 95% CI) | Subtotals only | |
| Analysis 16.18 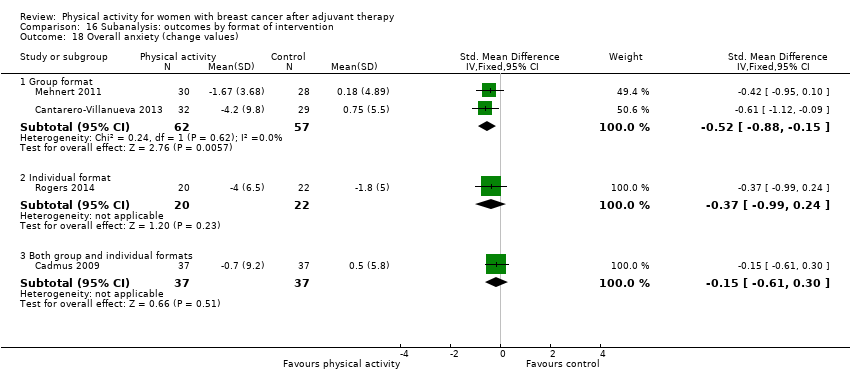 Comparison 16 Subanalysis: outcomes by format of intervention, Outcome 18 Overall anxiety (change values). | ||||
| 18.1 Group format | 2 | 119 | Std. Mean Difference (IV, Fixed, 95% CI) | ‐0.52 [‐0.88, ‐0.15] |
| 18.2 Individual format | 1 | 42 | Std. Mean Difference (IV, Fixed, 95% CI) | ‐0.37 [‐0.99, 0.24] |
| 18.3 Both group and individual formats | 1 | 74 | Std. Mean Difference (IV, Fixed, 95% CI) | ‐0.15 [‐0.61, 0.30] |
| 19 Overall depression (change values) Show forest plot | 7 | Std. Mean Difference (IV, Random, 95% CI) | Subtotals only | |
| Analysis 16.19  Comparison 16 Subanalysis: outcomes by format of intervention, Outcome 19 Overall depression (change values). | ||||
| 19.1 Group format | 2 | 119 | Std. Mean Difference (IV, Random, 95% CI) | ‐0.54 [‐0.91, ‐0.18] |
| 19.2 Individual format | 3 | 123 | Std. Mean Difference (IV, Random, 95% CI) | ‐0.51 [‐1.03, 0.01] |
| 19.3 Both group and individual formats | 2 | 574 | Std. Mean Difference (IV, Random, 95% CI) | 0.00 [‐0.21, 0.22] |
| 20 Overall depression (follow‐up values) Show forest plot | 11 | Std. Mean Difference (IV, Random, 95% CI) | Subtotals only | |
| Analysis 16.20 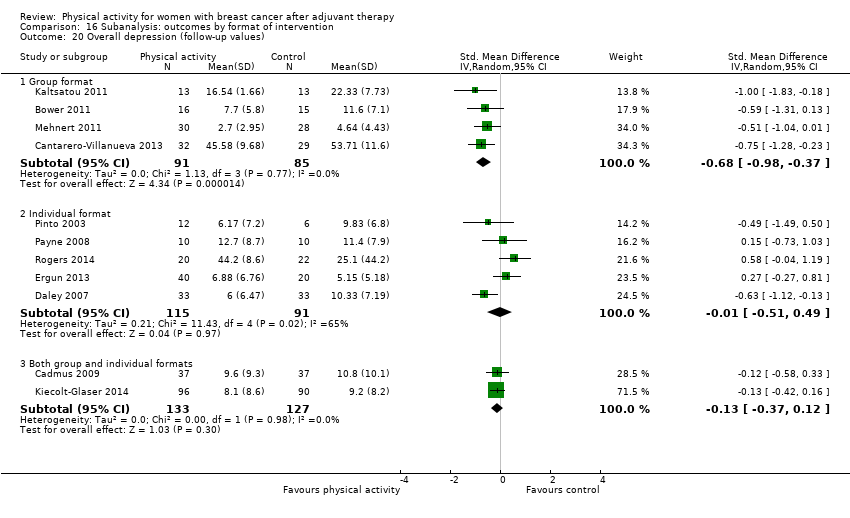 Comparison 16 Subanalysis: outcomes by format of intervention, Outcome 20 Overall depression (follow‐up values). | ||||
| 20.1 Group format | 4 | 176 | Std. Mean Difference (IV, Random, 95% CI) | ‐0.68 [‐0.98, ‐0.37] |
| 20.2 Individual format | 5 | 206 | Std. Mean Difference (IV, Random, 95% CI) | ‐0.01 [‐0.51, 0.49] |
| 20.3 Both group and individual formats | 2 | 260 | Std. Mean Difference (IV, Random, 95% CI) | ‐0.13 [‐0.37, 0.12] |
| 21 Overall fatigue (follow‐up values) Show forest plot | 24 | Std. Mean Difference (IV, Random, 95% CI) | Subtotals only | |
| Analysis 16.21 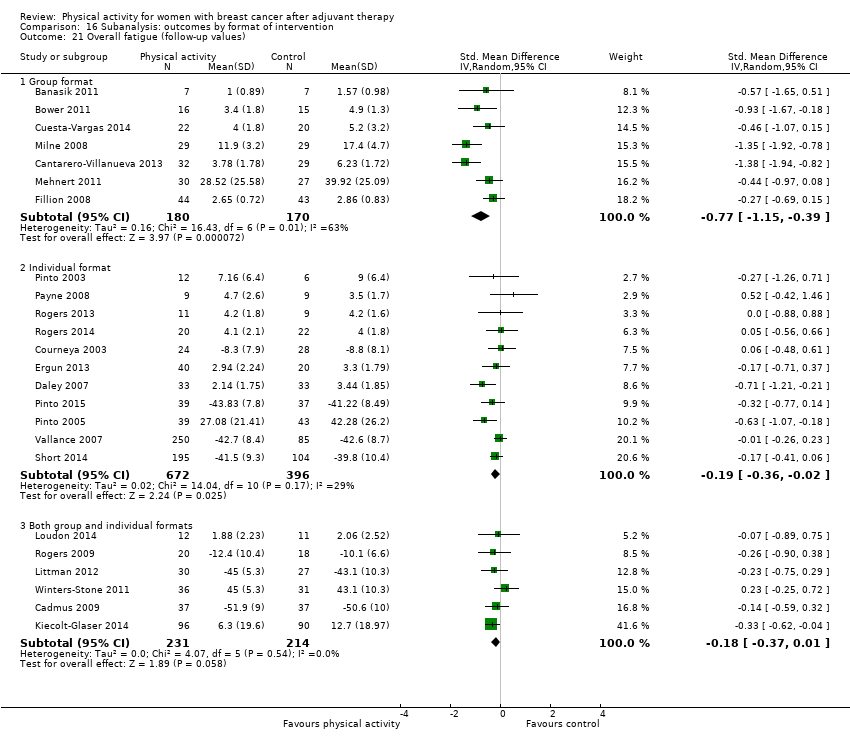 Comparison 16 Subanalysis: outcomes by format of intervention, Outcome 21 Overall fatigue (follow‐up values). | ||||
| 21.1 Group format | 7 | 350 | Std. Mean Difference (IV, Random, 95% CI) | ‐0.77 [‐1.15, ‐0.39] |
| 21.2 Individual format | 11 | 1068 | Std. Mean Difference (IV, Random, 95% CI) | ‐0.19 [‐0.36, ‐0.02] |
| 21.3 Both group and individual formats | 6 | 445 | Std. Mean Difference (IV, Random, 95% CI) | ‐0.18 [‐0.37, 0.01] |
| 22 Overall fatigue (change values) Show forest plot | 12 | Std. Mean Difference (IV, Random, 95% CI) | Subtotals only | |
| Analysis 16.22  Comparison 16 Subanalysis: outcomes by format of intervention, Outcome 22 Overall fatigue (change values). | ||||
| 22.1 Group format | 2 | 73 | Std. Mean Difference (IV, Random, 95% CI) | ‐0.10 [‐0.70, 0.50] |
| 22.2 Individual format | 7 | 637 | Std. Mean Difference (IV, Random, 95% CI) | ‐0.40 [‐0.98, 0.17] |
| 22.3 Both group and individual formats | 3 | 561 | Std. Mean Difference (IV, Random, 95% CI) | ‐0.02 [‐0.18, 0.15] |
| 23 Overall pain/disability (follow‐up values) Show forest plot | 8 | Std. Mean Difference (IV, Random, 95% CI) | Subtotals only | |
| Analysis 16.23  Comparison 16 Subanalysis: outcomes by format of intervention, Outcome 23 Overall pain/disability (follow‐up values). | ||||
| 23.1 Group format | 2 | 77 | Std. Mean Difference (IV, Random, 95% CI) | 0.18 [‐0.26, 0.63] |
| 23.2 Individual format | 3 | 261 | Std. Mean Difference (IV, Random, 95% CI) | 0.22 [‐0.22, 0.65] |
| 23.3 Both group and individual formats | 3 | 135 | Std. Mean Difference (IV, Random, 95% CI) | ‐0.16 [‐0.50, 0.18] |
| 24 Overall pain/disability (change values) Show forest plot | 3 | Std. Mean Difference (IV, Random, 95% CI) | Subtotals only | |
| Analysis 16.24 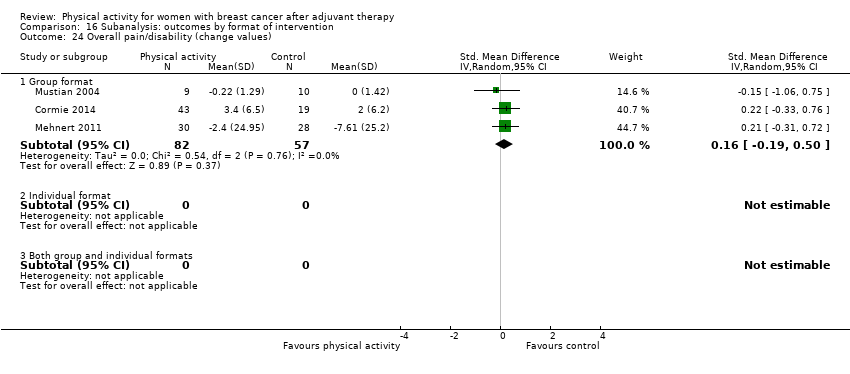 Comparison 16 Subanalysis: outcomes by format of intervention, Outcome 24 Overall pain/disability (change values). | ||||
| 24.1 Group format | 3 | 139 | Std. Mean Difference (IV, Random, 95% CI) | 0.16 [‐0.19, 0.50] |
| 24.2 Individual format | 0 | 0 | Std. Mean Difference (IV, Random, 95% CI) | 0.0 [0.0, 0.0] |
| 24.3 Both group and individual formats | 0 | 0 | Std. Mean Difference (IV, Random, 95% CI) | 0.0 [0.0, 0.0] |
| 25 Overall self‐esteem/body image (follow‐up values) Show forest plot | 10 | Std. Mean Difference (IV, Random, 95% CI) | Subtotals only | |
| Analysis 16.25 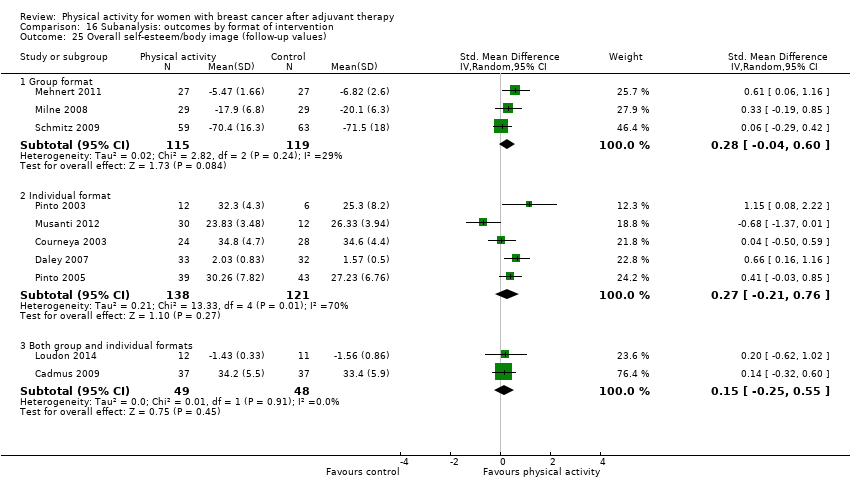 Comparison 16 Subanalysis: outcomes by format of intervention, Outcome 25 Overall self‐esteem/body image (follow‐up values). | ||||
| 25.1 Group format | 3 | 234 | Std. Mean Difference (IV, Random, 95% CI) | 0.28 [‐0.04, 0.60] |
| 25.2 Individual format | 5 | 259 | Std. Mean Difference (IV, Random, 95% CI) | 0.27 [‐0.21, 0.76] |
| 25.3 Both group and individual formats | 2 | 97 | Std. Mean Difference (IV, Random, 95% CI) | 0.15 [‐0.25, 0.55] |
| 26 Overall self‐esteem/body image (change values) Show forest plot | 9 | Std. Mean Difference (IV, Random, 95% CI) | Subtotals only | |
| Analysis 16.26  Comparison 16 Subanalysis: outcomes by format of intervention, Outcome 26 Overall self‐esteem/body image (change values). | ||||
| 26.1 Group format | 4 | 258 | Std. Mean Difference (IV, Random, 95% CI) | 0.59 [‐0.33, 1.51] |
| 26.2 Individual format | 3 | 160 | Std. Mean Difference (IV, Random, 95% CI) | 0.31 [‐0.19, 0.81] |
| 26.3 Both group and individual formats | 2 | 574 | Std. Mean Difference (IV, Random, 95% CI) | ‐0.05 [‐0.21, 0.12] |
| 27 Overall cardiorespiratory fitness (follow‐up values) Show forest plot | 21 | Std. Mean Difference (IV, Random, 95% CI) | Subtotals only | |
| Analysis 16.27 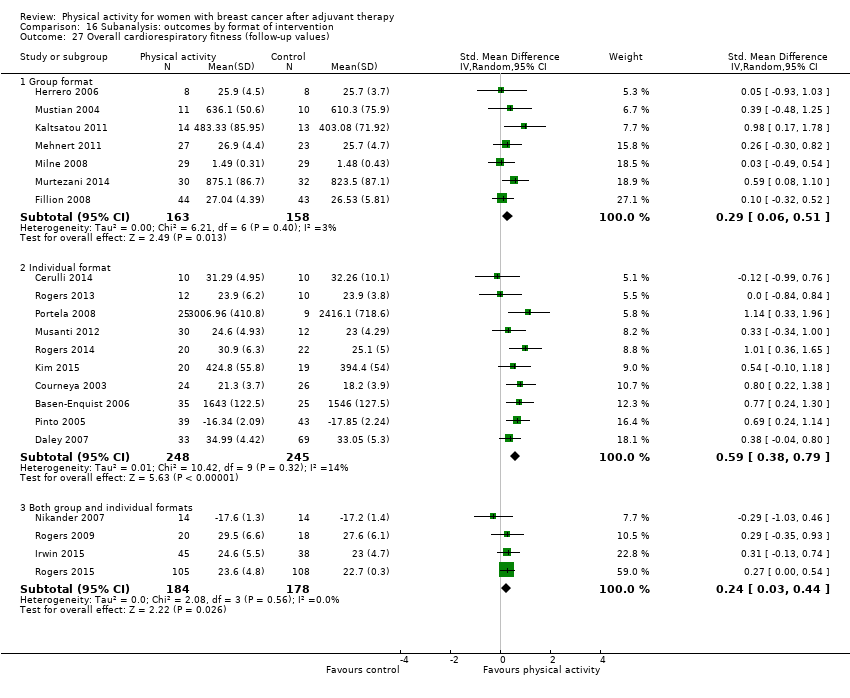 Comparison 16 Subanalysis: outcomes by format of intervention, Outcome 27 Overall cardiorespiratory fitness (follow‐up values). | ||||
| 27.1 Group format | 7 | 321 | Std. Mean Difference (IV, Random, 95% CI) | 0.29 [0.06, 0.51] |
| 27.2 Individual format | 10 | 493 | Std. Mean Difference (IV, Random, 95% CI) | 0.59 [0.38, 0.79] |
| 27.3 Both group and individual formats | 4 | 362 | Std. Mean Difference (IV, Random, 95% CI) | 0.24 [0.03, 0.44] |
| 28 Overall cardiorespiratory fitness (change values) Show forest plot | 6 | Std. Mean Difference (IV, Random, 95% CI) | Subtotals only | |
| Analysis 16.28  Comparison 16 Subanalysis: outcomes by format of intervention, Outcome 28 Overall cardiorespiratory fitness (change values). | ||||
| 28.1 Group format | 0 | 0 | Std. Mean Difference (IV, Random, 95% CI) | 0.0 [0.0, 0.0] |
| 28.2 Individual format | 4 | 216 | Std. Mean Difference (IV, Random, 95% CI) | 0.64 [0.08, 1.19] |
| 28.3 Both group and individual formats | 2 | 581 | Std. Mean Difference (IV, Random, 95% CI) | 0.44 [‐0.18, 1.05] |
| 29 Overall self‐reported physical activity (follow‐up values) Show forest plot | 17 | Std. Mean Difference (IV, Random, 95% CI) | Subtotals only | |
| Analysis 16.29  Comparison 16 Subanalysis: outcomes by format of intervention, Outcome 29 Overall self‐reported physical activity (follow‐up values). | ||||
| 29.1 Group format | 1 | 264 | Std. Mean Difference (IV, Random, 95% CI) | 0.13 [‐0.11, 0.37] |
| 29.2 Individual format | 8 | 989 | Std. Mean Difference (IV, Random, 95% CI) | 0.59 [0.28, 0.90] |
| 29.3 Both group and individual formats | 8 | 752 | Std. Mean Difference (IV, Random, 95% CI) | 0.55 [0.25, 0.84] |
| 30 Overall self‐reported physical activity (change values) Show forest plot | 8 | Std. Mean Difference (IV, Random, 95% CI) | Subtotals only | |
| Analysis 16.30 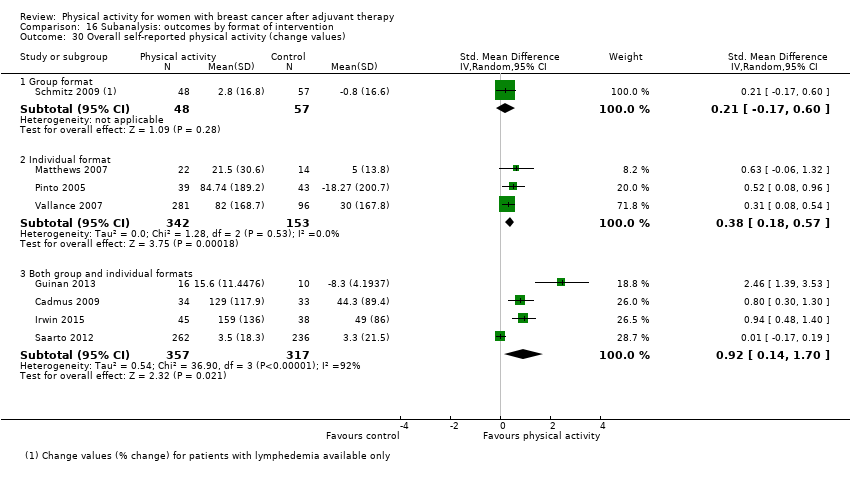 Comparison 16 Subanalysis: outcomes by format of intervention, Outcome 30 Overall self‐reported physical activity (change values). | ||||
| 30.1 Group format | 1 | 105 | Std. Mean Difference (IV, Random, 95% CI) | 0.21 [‐0.17, 0.60] |
| 30.2 Individual format | 3 | 495 | Std. Mean Difference (IV, Random, 95% CI) | 0.38 [0.18, 0.57] |
| 30.3 Both group and individual formats | 4 | 674 | Std. Mean Difference (IV, Random, 95% CI) | 0.92 [0.14, 1.70] |
| 31 Overall objective physical activity (follow‐up values) Show forest plot | 12 | Std. Mean Difference (IV, Random, 95% CI) | Subtotals only | |
| Analysis 16.31  Comparison 16 Subanalysis: outcomes by format of intervention, Outcome 31 Overall objective physical activity (follow‐up values). | ||||
| 31.1 Group format | 0 | 0 | Std. Mean Difference (IV, Random, 95% CI) | 0.0 [0.0, 0.0] |
| 31.2 Individual format | 8 | 957 | Std. Mean Difference (IV, Random, 95% CI) | 0.51 [0.18, 0.85] |
| 31.3 Both group and individual formats | 4 | 352 | Std. Mean Difference (IV, Random, 95% CI) | 0.34 [0.13, 0.55] |
| 32 Overall objective physical activity (change values) Show forest plot | 5 | Std. Mean Difference (IV, Random, 95% CI) | Subtotals only | |
| Analysis 16.32  Comparison 16 Subanalysis: outcomes by format of intervention, Outcome 32 Overall objective physical activity (change values). | ||||
| 32.1 Group format | 0 | 0 | Std. Mean Difference (IV, Random, 95% CI) | 0.0 [0.0, 0.0] |
| 32.2 Individual format | 3 | 416 | Std. Mean Difference (IV, Random, 95% CI) | 0.62 [‐0.23, 1.46] |
| 32.3 Both group and individual formats | 2 | 92 | Std. Mean Difference (IV, Random, 95% CI) | 0.83 [0.40, 1.27] |
| 33 Mass (follow‐up values) Show forest plot | 15 | Mean Difference (IV, Fixed, 95% CI) | Subtotals only | |
| Analysis 16.33  Comparison 16 Subanalysis: outcomes by format of intervention, Outcome 33 Mass (follow‐up values). | ||||
| 33.1 Group format | 4 | 363 | Mean Difference (IV, Fixed, 95% CI) | ‐1.10 [‐3.92, 1.72] |
| 33.2 Individual format | 5 | 331 | Mean Difference (IV, Fixed, 95% CI) | 0.16 [‐0.79, 1.10] |
| 33.3 Both group and individual formats | 6 | 487 | Mean Difference (IV, Fixed, 95% CI) | ‐0.00 [‐0.76, 0.76] |
| 34 Mass (change values) Show forest plot | 10 | Mean Difference (IV, Random, 95% CI) | Subtotals only | |
| Analysis 16.34 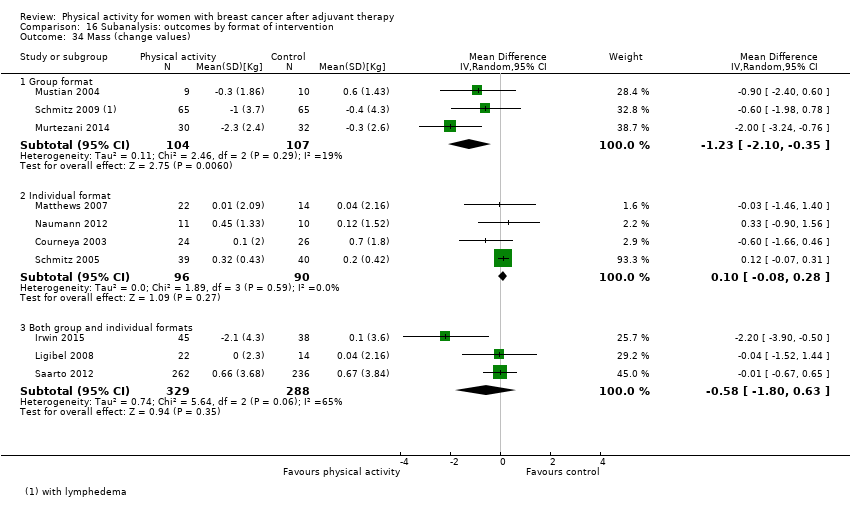 Comparison 16 Subanalysis: outcomes by format of intervention, Outcome 34 Mass (change values). | ||||
| 34.1 Group format | 3 | 211 | Mean Difference (IV, Random, 95% CI) | ‐1.23 [‐2.10, ‐0.35] |
| 34.2 Individual format | 4 | 186 | Mean Difference (IV, Random, 95% CI) | 0.10 [‐0.08, 0.28] |
| 34.3 Both group and individual formats | 3 | 617 | Mean Difference (IV, Random, 95% CI) | ‐0.58 [‐1.80, 0.63] |
| 35 BMI (follow‐up values) Show forest plot | 16 | Mean Difference (IV, Fixed, 95% CI) | Subtotals only | |
| Analysis 16.35  Comparison 16 Subanalysis: outcomes by format of intervention, Outcome 35 BMI (follow‐up values). | ||||
| 35.1 Group format | 3 | 347 | Mean Difference (IV, Fixed, 95% CI) | ‐0.71 [‐1.74, 0.32] |
| 35.2 Individual format | 7 | 647 | Mean Difference (IV, Fixed, 95% CI) | 0.13 [‐0.18, 0.44] |
| 35.3 Both group and individual formats | 6 | 458 | Mean Difference (IV, Fixed, 95% CI) | ‐0.03 [‐0.31, 0.26] |
| 36 BMI (change values) Show forest plot | 8 | Mean Difference (IV, Random, 95% CI) | Subtotals only | |
| Analysis 16.36 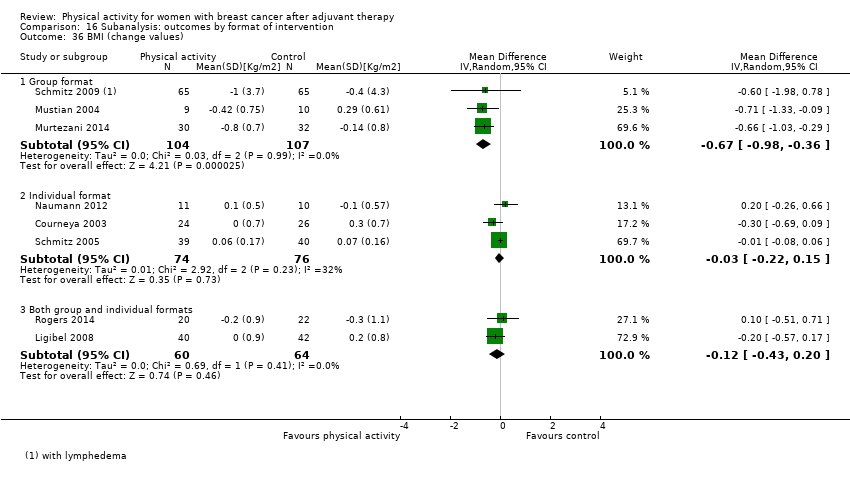 Comparison 16 Subanalysis: outcomes by format of intervention, Outcome 36 BMI (change values). | ||||
| 36.1 Group format | 3 | 211 | Mean Difference (IV, Random, 95% CI) | ‐0.67 [‐0.98, ‐0.36] |
| 36.2 Individual format | 3 | 150 | Mean Difference (IV, Random, 95% CI) | ‐0.03 [‐0.22, 0.15] |
| 36.3 Both group and individual formats | 2 | 124 | Mean Difference (IV, Random, 95% CI) | ‐0.12 [‐0.43, 0.20] |
| 37 Overall body fat (follow‐up values) Show forest plot | 18 | Std. Mean Difference (IV, Random, 95% CI) | Subtotals only | |
| Analysis 16.37 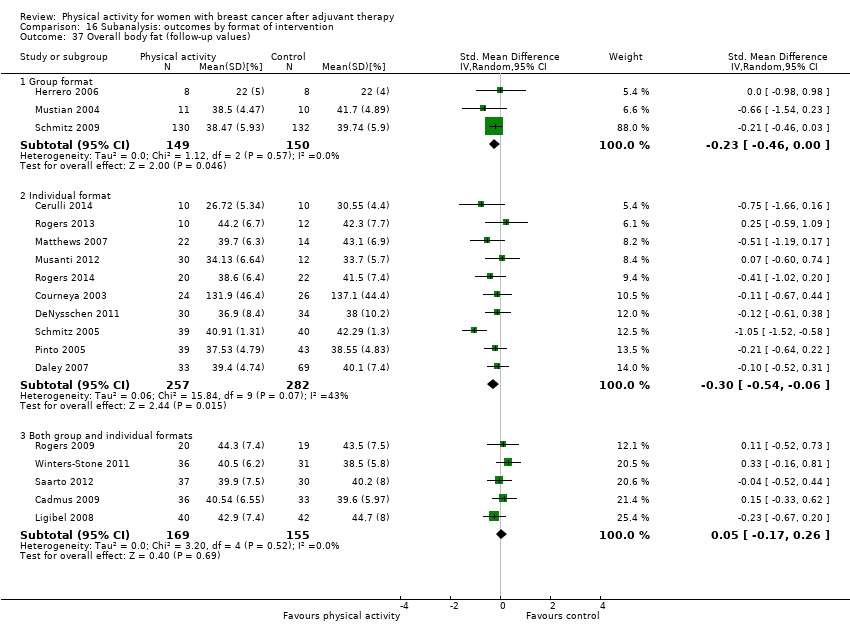 Comparison 16 Subanalysis: outcomes by format of intervention, Outcome 37 Overall body fat (follow‐up values). | ||||
| 37.1 Group format | 3 | 299 | Std. Mean Difference (IV, Random, 95% CI) | ‐0.23 [‐0.46, ‐0.00] |
| 37.2 Individual format | 10 | 539 | Std. Mean Difference (IV, Random, 95% CI) | ‐0.30 [‐0.54, ‐0.06] |
| 37.3 Both group and individual formats | 5 | 324 | Std. Mean Difference (IV, Random, 95% CI) | 0.05 [‐0.17, 0.26] |
| 38 Overall body fat (change values) Show forest plot | 9 | Std. Mean Difference (IV, Random, 95% CI) | Subtotals only | |
| Analysis 16.38  Comparison 16 Subanalysis: outcomes by format of intervention, Outcome 38 Overall body fat (change values). | ||||
| 38.1 Group format | 2 | 147 | Std. Mean Difference (IV, Random, 95% CI) | ‐0.06 [‐0.38, 0.26] |
| 38.2 Individual format | 6 | 270 | Std. Mean Difference (IV, Random, 95% CI) | ‐0.86 [‐1.74, 0.02] |
| 38.3 Both group and individual formats | 1 | 82 | Std. Mean Difference (IV, Random, 95% CI) | ‐0.29 [‐0.73, 0.14] |
| 39 Lower body strength (follow‐up values) Show forest plot | 9 | Std. Mean Difference (IV, Random, 95% CI) | Subtotals only | |
| Analysis 16.39  Comparison 16 Subanalysis: outcomes by format of intervention, Outcome 39 Lower body strength (follow‐up values). | ||||
| 39.1 Group format | 2 | 290 | Std. Mean Difference (IV, Random, 95% CI) | 0.69 [0.29, 1.10] |
| 39.2 Individual format | 3 | 85 | Std. Mean Difference (IV, Random, 95% CI) | 1.04 [0.08, 2.00] |
| 39.3 Both group and individual formats | 4 | 200 | Std. Mean Difference (IV, Random, 95% CI) | 0.13 [‐0.22, 0.47] |
| 40 Lower body strength (change values) Show forest plot | 5 | Std. Mean Difference (IV, Random, 95% CI) | Subtotals only | |
| Analysis 16.40  Comparison 16 Subanalysis: outcomes by format of intervention, Outcome 40 Lower body strength (change values). | ||||
| 40.1 Group format | 2 | 294 | Std. Mean Difference (IV, Random, 95% CI) | 0.92 [0.61, 1.22] |
| 40.2 Individual format | 3 | 289 | Std. Mean Difference (IV, Random, 95% CI) | 0.65 [0.09, 1.22] |
| 40.3 Both group and individual formats | 0 | 0 | Std. Mean Difference (IV, Random, 95% CI) | 0.0 [0.0, 0.0] |
| 41 Upper body strength (follow‐up values) Show forest plot | 12 | Std. Mean Difference (IV, Random, 95% CI) | Subtotals only | |
| Analysis 16.41  Comparison 16 Subanalysis: outcomes by format of intervention, Outcome 41 Upper body strength (follow‐up values). | ||||
| 41.1 Group format | 4 | 365 | Std. Mean Difference (IV, Random, 95% CI) | 0.53 [‐0.29, 1.35] |
| 41.2 Individual format | 4 | 141 | Std. Mean Difference (IV, Random, 95% CI) | 0.63 [‐0.06, 1.32] |
| 41.3 Both group and individual formats | 4 | 200 | Std. Mean Difference (IV, Random, 95% CI) | 0.29 [0.01, 0.57] |
| 42 Upper body strength (change values) Show forest plot | 7 | Std. Mean Difference (IV, Random, 95% CI) | Subtotals only | |
| Analysis 16.42 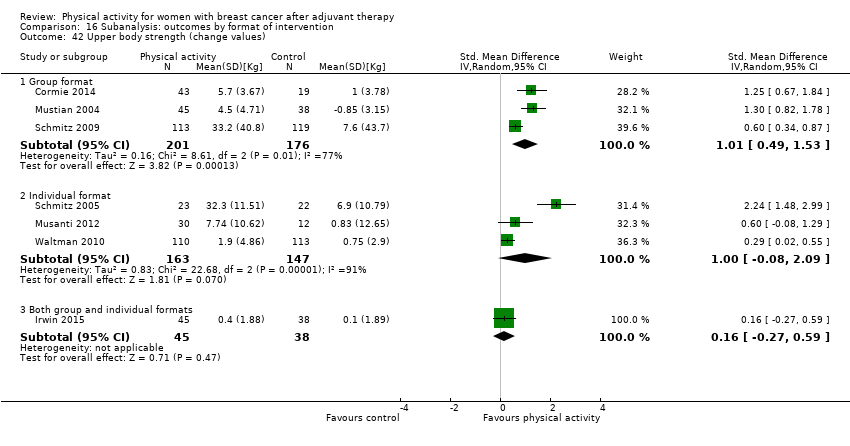 Comparison 16 Subanalysis: outcomes by format of intervention, Outcome 42 Upper body strength (change values). | ||||
| 42.1 Group format | 3 | 377 | Std. Mean Difference (IV, Random, 95% CI) | 1.01 [0.49, 1.53] |
| 42.2 Individual format | 3 | 310 | Std. Mean Difference (IV, Random, 95% CI) | 1.00 [‐0.08, 2.09] |
| 42.3 Both group and individual formats | 1 | 83 | Std. Mean Difference (IV, Random, 95% CI) | 0.16 [‐0.27, 0.59] |
| 43 Bone mineral density ‐ femoral neck (follow‐up and change values) Show forest plot | 4 | Std. Mean Difference (IV, Random, 95% CI) | Subtotals only | |
| Analysis 16.43 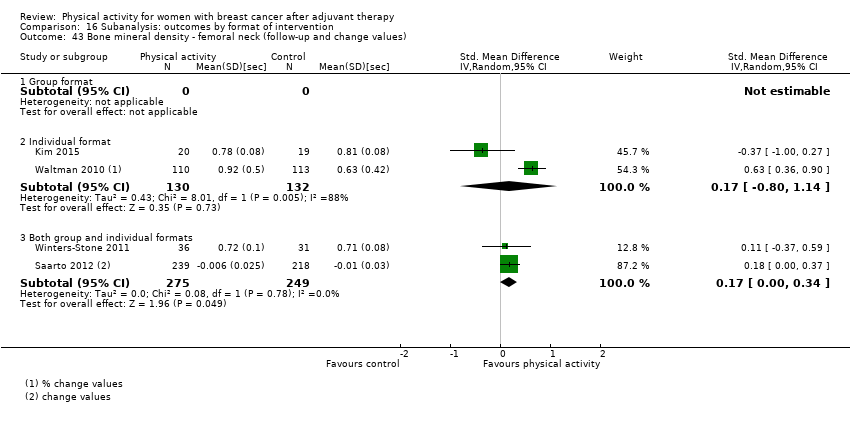 Comparison 16 Subanalysis: outcomes by format of intervention, Outcome 43 Bone mineral density ‐ femoral neck (follow‐up and change values). | ||||
| 43.1 Group format | 0 | 0 | Std. Mean Difference (IV, Random, 95% CI) | 0.0 [0.0, 0.0] |
| 43.2 Individual format | 2 | 262 | Std. Mean Difference (IV, Random, 95% CI) | 0.17 [‐0.80, 1.14] |
| 43.3 Both group and individual formats | 2 | 524 | Std. Mean Difference (IV, Random, 95% CI) | 0.17 [0.00, 0.34] |
| 44 Bone mineral density ‐ lumbar spine (follow‐up and change values) Show forest plot | 4 | Std. Mean Difference (IV, Random, 95% CI) | Subtotals only | |
| Analysis 16.44 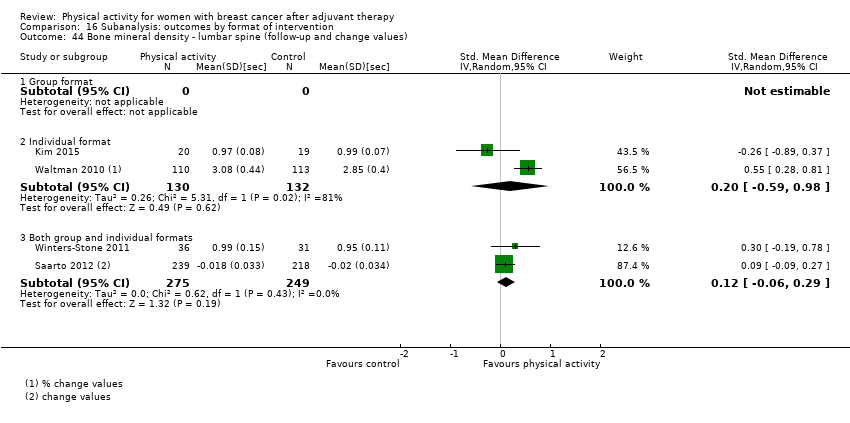 Comparison 16 Subanalysis: outcomes by format of intervention, Outcome 44 Bone mineral density ‐ lumbar spine (follow‐up and change values). | ||||
| 44.1 Group format | 0 | 0 | Std. Mean Difference (IV, Random, 95% CI) | 0.0 [0.0, 0.0] |
| 44.2 Individual format | 2 | 262 | Std. Mean Difference (IV, Random, 95% CI) | 0.20 [‐0.59, 0.98] |
| 44.3 Both group and individual formats | 2 | 524 | Std. Mean Difference (IV, Random, 95% CI) | 0.12 [‐0.06, 0.29] |
| 45 Bone mineral density ‐ total hip (follow‐up and change values) Show forest plot | 3 | Std. Mean Difference (IV, Random, 95% CI) | Subtotals only | |
| Analysis 16.45 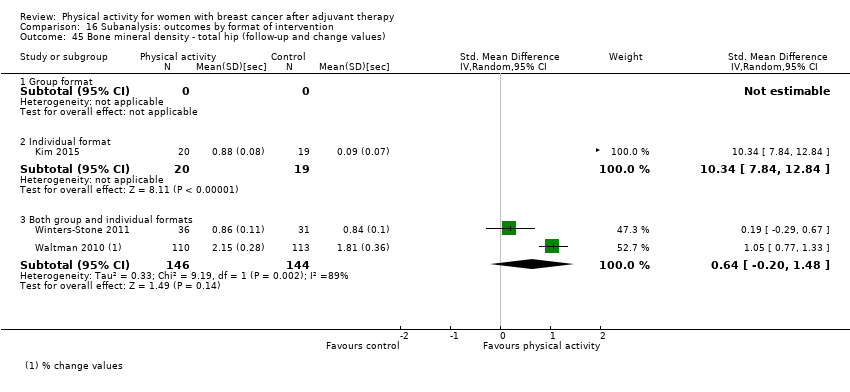 Comparison 16 Subanalysis: outcomes by format of intervention, Outcome 45 Bone mineral density ‐ total hip (follow‐up and change values). | ||||
| 45.1 Group format | 0 | 0 | Std. Mean Difference (IV, Random, 95% CI) | 0.0 [0.0, 0.0] |
| 45.2 Individual format | 1 | 39 | Std. Mean Difference (IV, Random, 95% CI) | 10.34 [7.84, 12.84] |
| 45.3 Both group and individual formats | 2 | 290 | Std. Mean Difference (IV, Random, 95% CI) | 0.64 [‐0.20, 1.48] |
| Outcome or subgroup title | No. of studies | No. of participants | Statistical method | Effect size |
| 1 Overall HRQoL (follow‐up values) Show forest plot | 22 | Std. Mean Difference (IV, Random, 95% CI) | Subtotals only | |
| Analysis 17.1  Comparison 17 Subanalysis: outcomes by setting of intervention, Outcome 1 Overall HRQoL (follow‐up values). | ||||
| 1.1 Home‐based | 5 | 792 | Std. Mean Difference (IV, Random, 95% CI) | 0.04 [‐0.11, 0.19] |
| 1.2 Facility‐based | 15 | 833 | Std. Mean Difference (IV, Random, 95% CI) | 0.55 [0.27, 0.83] |
| 1.3 Both home‐ and facility‐based | 4 | 227 | Std. Mean Difference (IV, Random, 95% CI) | 0.48 [0.04, 0.92] |
| 2 Overall HRQoL (change values) Show forest plot | 14 | Std. Mean Difference (IV, Random, 95% CI) | Subtotals only | |
| Analysis 17.2  Comparison 17 Subanalysis: outcomes by setting of intervention, Outcome 2 Overall HRQoL (change values). | ||||
| 2.1 Home‐based | 2 | 375 | Std. Mean Difference (IV, Random, 95% CI) | 0.27 [0.04, 0.50] |
| 2.2 Facility‐based | 10 | 492 | Std. Mean Difference (IV, Random, 95% CI) | 1.18 [0.53, 1.82] |
| 2.3 Both home‐ and facility‐based | 3 | 612 | Std. Mean Difference (IV, Random, 95% CI) | 0.06 [‐0.22, 0.33] |
| 3 Overall emotional function/mental health (follow‐up values) Show forest plot | 26 | Std. Mean Difference (IV, Random, 95% CI) | Subtotals only | |
| Analysis 17.3  Comparison 17 Subanalysis: outcomes by setting of intervention, Outcome 3 Overall emotional function/mental health (follow‐up values). | ||||
| 3.1 Home‐based | 5 | 670 | Std. Mean Difference (IV, Random, 95% CI) | 0.11 [‐0.06, 0.27] |
| 3.2 Facility‐based | 15 | 901 | Std. Mean Difference (IV, Random, 95% CI) | 0.31 [0.12, 0.50] |
| 3.3 Both home‐ and facility‐based | 6 | 531 | Std. Mean Difference (IV, Random, 95% CI) | 0.15 [‐0.04, 0.34] |
| 4 Overall emotional function/mental health (change values) Show forest plot | 15 | Std. Mean Difference (IV, Random, 95% CI) | Subtotals only | |
| Analysis 17.4  Comparison 17 Subanalysis: outcomes by setting of intervention, Outcome 4 Overall emotional function/mental health (change values). | ||||
| 4.1 Home‐based | 2 | 417 | Std. Mean Difference (IV, Random, 95% CI) | 0.16 [‐0.06, 0.37] |
| 4.2 Facility‐based | 10 | 550 | Std. Mean Difference (IV, Random, 95% CI) | 0.43 [0.04, 0.82] |
| 4.3 Both home‐ and facility‐based | 3 | 612 | Std. Mean Difference (IV, Random, 95% CI) | 0.09 [‐0.16, 0.34] |
| 5 Overall physical function (follow‐up values) Show forest plot | 25 | Std. Mean Difference (IV, Random, 95% CI) | Subtotals only | |
| Analysis 17.5  Comparison 17 Subanalysis: outcomes by setting of intervention, Outcome 5 Overall physical function (follow‐up values). | ||||
| 5.1 Home‐based | 5 | 720 | Std. Mean Difference (IV, Random, 95% CI) | 0.19 [0.03, 0.34] |
| 5.2 Facility‐based | 13 | 816 | Std. Mean Difference (IV, Random, 95% CI) | 0.43 [0.14, 0.73] |
| 5.3 Both home‐ and facility‐based | 7 | 592 | Std. Mean Difference (IV, Random, 95% CI) | 0.23 [‐0.02, 0.48] |
| 6 Overall physical function (change values) Show forest plot | 13 | Std. Mean Difference (IV, Random, 95% CI) | Subtotals only | |
| Analysis 17.6  Comparison 17 Subanalysis: outcomes by setting of intervention, Outcome 6 Overall physical function (change values). | ||||
| 6.1 Home‐based | 1 | 332 | Std. Mean Difference (IV, Random, 95% CI) | 0.26 [0.02, 0.51] |
| 6.2 Facility‐based | 9 | 489 | Std. Mean Difference (IV, Random, 95% CI) | 0.95 [0.31, 1.59] |
| 6.3 Both home‐ and facility‐based | 3 | 612 | Std. Mean Difference (IV, Random, 95% CI) | ‐0.08 [‐0.24, 0.08] |
| 7 Overall role function (follow‐up values) Show forest plot | 18 | Std. Mean Difference (IV, Random, 95% CI) | Subtotals only | |
| Analysis 17.7  Comparison 17 Subanalysis: outcomes by setting of intervention, Outcome 7 Overall role function (follow‐up values). | ||||
| 7.1 Home‐based | 2 | 386 | Std. Mean Difference (IV, Random, 95% CI) | 0.26 [‐0.14, 0.66] |
| 7.2 Facility‐based | 12 | 564 | Std. Mean Difference (IV, Random, 95% CI) | 0.33 [‐0.03, 0.69] |
| 7.3 Both home‐ and facility‐based | 4 | 420 | Std. Mean Difference (IV, Random, 95% CI) | 0.20 [‐0.14, 0.54] |
| 8 Overall role function (change values) Show forest plot | 12 | Std. Mean Difference (IV, Random, 95% CI) | Subtotals only | |
| Analysis 17.8 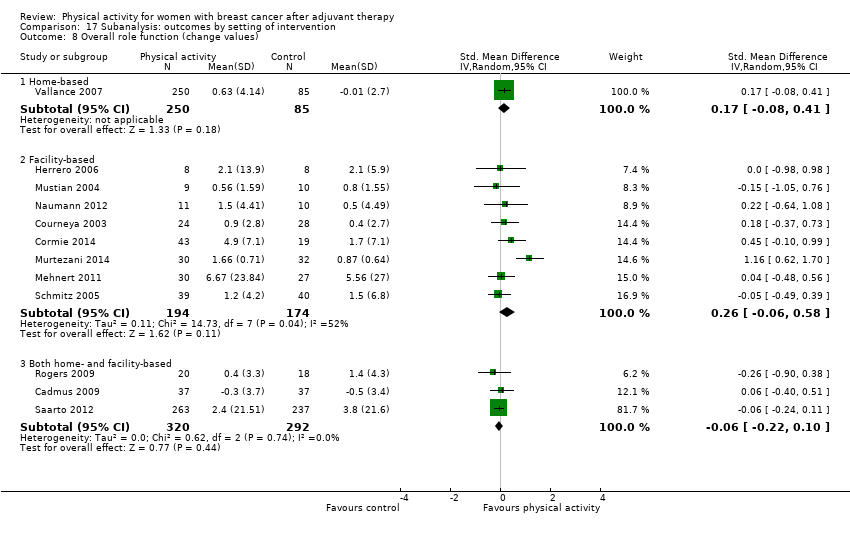 Comparison 17 Subanalysis: outcomes by setting of intervention, Outcome 8 Overall role function (change values). | ||||
| 8.1 Home‐based | 1 | 335 | Std. Mean Difference (IV, Random, 95% CI) | 0.17 [‐0.08, 0.41] |
| 8.2 Facility‐based | 8 | 368 | Std. Mean Difference (IV, Random, 95% CI) | 0.26 [‐0.06, 0.58] |
| 8.3 Both home‐ and facility‐based | 3 | 612 | Std. Mean Difference (IV, Random, 95% CI) | ‐0.06 [‐0.22, 0.10] |
| 9 Overall social well‐being/function (follow‐up values) Show forest plot | 18 | Std. Mean Difference (IV, Random, 95% CI) | Subtotals only | |
| Analysis 17.9  Comparison 17 Subanalysis: outcomes by setting of intervention, Outcome 9 Overall social well‐being/function (follow‐up values). | ||||
| 9.1 Home‐based | 2 | 386 | Std. Mean Difference (IV, Random, 95% CI) | ‐0.01 [‐0.23, 0.22] |
| 9.2 Facility‐based | 11 | 709 | Std. Mean Difference (IV, Random, 95% CI) | 0.22 [0.07, 0.37] |
| 9.3 Both home‐ and facility‐based | 5 | 462 | Std. Mean Difference (IV, Random, 95% CI) | 0.31 [0.03, 0.59] |
| 10 Overall social well‐being/function (change values) Show forest plot | 12 | Std. Mean Difference (IV, Random, 95% CI) | Subtotals only | |
| Analysis 17.10 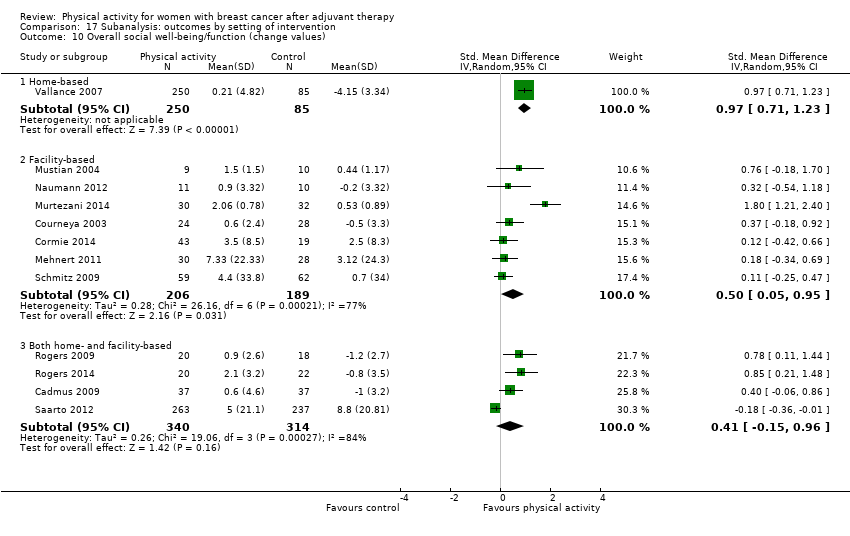 Comparison 17 Subanalysis: outcomes by setting of intervention, Outcome 10 Overall social well‐being/function (change values). | ||||
| 10.1 Home‐based | 1 | 335 | Std. Mean Difference (IV, Random, 95% CI) | 0.97 [0.71, 1.23] |
| 10.2 Facility‐based | 7 | 395 | Std. Mean Difference (IV, Random, 95% CI) | 0.50 [0.05, 0.95] |
| 10.3 Both home‐ and facility‐based | 4 | 654 | Std. Mean Difference (IV, Random, 95% CI) | 0.41 [‐0.15, 0.96] |
| 11 Overall cognitive function (follow‐up values) Show forest plot | 5 | Std. Mean Difference (IV, Random, 95% CI) | Subtotals only | |
| Analysis 17.11  Comparison 17 Subanalysis: outcomes by setting of intervention, Outcome 11 Overall cognitive function (follow‐up values). | ||||
| 11.1 Home‐based | 0 | 0 | Std. Mean Difference (IV, Random, 95% CI) | 0.0 [0.0, 0.0] |
| 11.2 Facility‐based | 3 | 134 | Std. Mean Difference (IV, Random, 95% CI) | 0.32 [‐0.02, 0.66] |
| 11.3 Both home‐ and facility‐based | 2 | 55 | Std. Mean Difference (IV, Random, 95% CI) | 0.65 [‐0.01, 1.31] |
| 12 Overall cognitive function (change values) Show forest plot | 5 | Std. Mean Difference (IV, Random, 95% CI) | Subtotals only | |
| Analysis 17.12 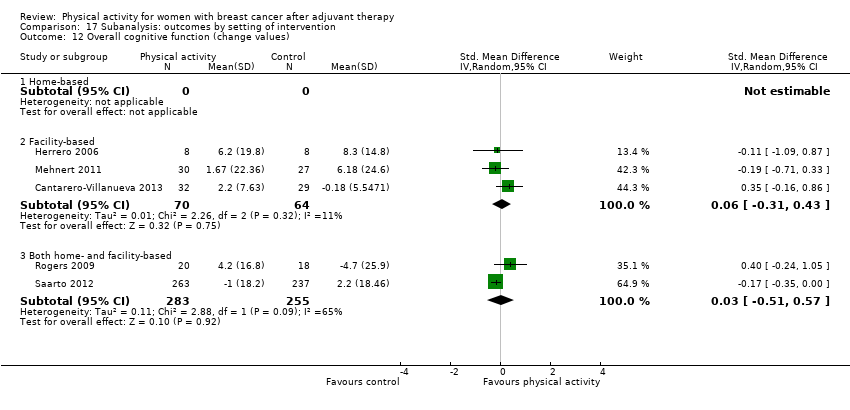 Comparison 17 Subanalysis: outcomes by setting of intervention, Outcome 12 Overall cognitive function (change values). | ||||
| 12.1 Home‐based | 0 | 0 | Std. Mean Difference (IV, Random, 95% CI) | 0.0 [0.0, 0.0] |
| 12.2 Facility‐based | 3 | 134 | Std. Mean Difference (IV, Random, 95% CI) | 0.06 [‐0.31, 0.43] |
| 12.3 Both home‐ and facility‐based | 2 | 538 | Std. Mean Difference (IV, Random, 95% CI) | 0.03 [‐0.51, 0.57] |
| 13 Overall general health (follow‐up values) Show forest plot | 9 | Std. Mean Difference (IV, Random, 95% CI) | Subtotals only | |
| Analysis 17.13  Comparison 17 Subanalysis: outcomes by setting of intervention, Outcome 13 Overall general health (follow‐up values). | ||||
| 13.1 Home‐based | 2 | 111 | Std. Mean Difference (IV, Random, 95% CI) | 0.43 [‐0.32, 1.17] |
| 13.2 Facility‐based | 6 | 273 | Std. Mean Difference (IV, Random, 95% CI) | 0.25 [0.01, 0.49] |
| 13.3 Both home‐ and facility‐based | 2 | 112 | Std. Mean Difference (IV, Random, 95% CI) | ‐0.26 [‐0.64, 0.11] |
| 14 Overall general health (change values) Show forest plot | 5 | Std. Mean Difference (IV, Random, 95% CI) | Subtotals only | |
| Analysis 17.14  Comparison 17 Subanalysis: outcomes by setting of intervention, Outcome 14 Overall general health (change values). | ||||
| 14.1 Home‐based | 1 | 40 | Std. Mean Difference (IV, Random, 95% CI) | 0.42 [‐0.21, 1.05] |
| 14.2 Facility‐based | 2 | 59 | Std. Mean Difference (IV, Random, 95% CI) | 0.27 [‐0.49, 1.03] |
| 14.3 Both home‐ and facility‐based | 3 | 612 | Std. Mean Difference (IV, Random, 95% CI) | ‐0.07 [‐0.23, 0.09] |
| 15 Overall sexual function (follow‐up values) Show forest plot | 5 | Std. Mean Difference (IV, Fixed, 95% CI) | Subtotals only | |
| Analysis 17.15  Comparison 17 Subanalysis: outcomes by setting of intervention, Outcome 15 Overall sexual function (follow‐up values). | ||||
| 15.1 Home‐based | 2 | 136 | Std. Mean Difference (IV, Fixed, 95% CI) | ‐0.00 [‐0.34, 0.34] |
| 15.2 Facility‐based | 2 | 193 | Std. Mean Difference (IV, Fixed, 95% CI) | 0.21 [‐0.07, 0.49] |
| 15.3 Both home‐ and facility‐based | 1 | 82 | Std. Mean Difference (IV, Fixed, 95% CI) | 0.29 [‐0.14, 0.73] |
| 16 Overall sexual function (change values) Show forest plot | 3 | Mean Difference (IV, Random, 95% CI) | Subtotals only | |
| Analysis 17.16 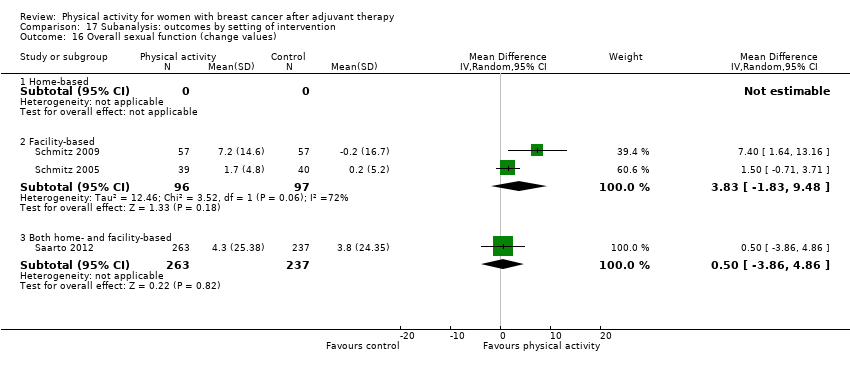 Comparison 17 Subanalysis: outcomes by setting of intervention, Outcome 16 Overall sexual function (change values). | ||||
| 16.1 Home‐based | 0 | 0 | Mean Difference (IV, Random, 95% CI) | 0.0 [0.0, 0.0] |
| 16.2 Facility‐based | 2 | 193 | Mean Difference (IV, Random, 95% CI) | 3.83 [‐1.83, 9.48] |
| 16.3 Both home‐ and facility‐based | 1 | 500 | Mean Difference (IV, Random, 95% CI) | 0.5 [‐3.86, 4.86] |
| 17 Overall sleep (follow‐up values) Show forest plot | 5 | Std. Mean Difference (IV, Fixed, 95% CI) | Subtotals only | |
| Analysis 17.17 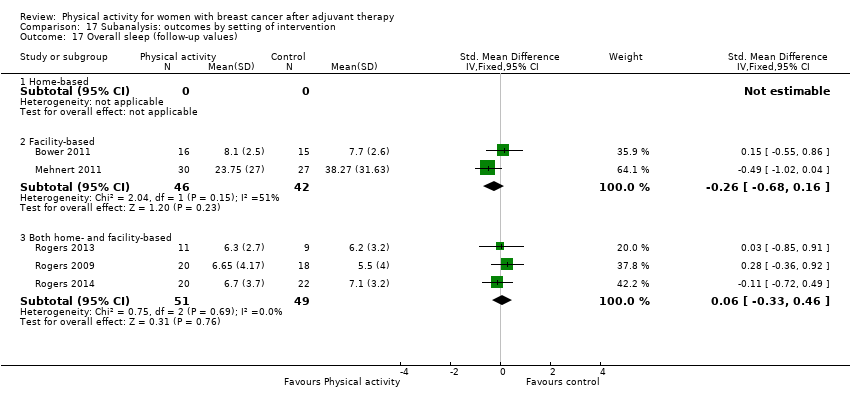 Comparison 17 Subanalysis: outcomes by setting of intervention, Outcome 17 Overall sleep (follow‐up values). | ||||
| 17.1 Home‐based | 0 | 0 | Std. Mean Difference (IV, Fixed, 95% CI) | 0.0 [0.0, 0.0] |
| 17.2 Facility‐based | 2 | 88 | Std. Mean Difference (IV, Fixed, 95% CI) | ‐0.26 [‐0.68, 0.16] |
| 17.3 Both home‐ and facility‐based | 3 | 100 | Std. Mean Difference (IV, Fixed, 95% CI) | 0.06 [‐0.33, 0.46] |
| 18 Overall sleep (change values) Show forest plot | 3 | Std. Mean Difference (IV, Random, 95% CI) | Subtotals only | |
| Analysis 17.18  Comparison 17 Subanalysis: outcomes by setting of intervention, Outcome 18 Overall sleep (change values). | ||||
| 18.1 Home‐based | 0 | 0 | Std. Mean Difference (IV, Random, 95% CI) | 0.0 [0.0, 0.0] |
| 18.2 Facility‐based | 1 | 56 | Std. Mean Difference (IV, Random, 95% CI) | 0.14 [‐0.38, 0.67] |
| 18.3 Both home‐ and facility‐based | 2 | 80 | Std. Mean Difference (IV, Random, 95% CI) | 0.14 [‐0.30, 0.58] |
| 19 Overall anxiety (follow‐up values) Show forest plot | 7 | Std. Mean Difference (IV, Random, 95% CI) | Subtotals only | |
| Analysis 17.19  Comparison 17 Subanalysis: outcomes by setting of intervention, Outcome 19 Overall anxiety (follow‐up values). | ||||
| 19.1 Home‐based | 0 | 0 | Std. Mean Difference (IV, Random, 95% CI) | 0.0 [0.0, 0.0] |
| 19.2 Facility‐based | 4 | 192 | Std. Mean Difference (IV, Random, 95% CI) | ‐0.87 [‐1.34, ‐0.41] |
| 19.3 Both home‐ and facility‐based | 3 | 134 | Std. Mean Difference (IV, Random, 95% CI) | ‐0.14 [‐0.48, 0.21] |
| 20 Overall anxiety (change values) Show forest plot | 4 | Std. Mean Difference (IV, Fixed, 95% CI) | Subtotals only | |
| Analysis 17.20  Comparison 17 Subanalysis: outcomes by setting of intervention, Outcome 20 Overall anxiety (change values). | ||||
| 20.1 Home‐based | 0 | 0 | Std. Mean Difference (IV, Fixed, 95% CI) | 0.0 [0.0, 0.0] |
| 20.2 Facility‐based | 2 | 119 | Std. Mean Difference (IV, Fixed, 95% CI) | ‐0.52 [‐0.88, ‐0.15] |
| 20.3 Both home‐ and facility‐based | 2 | 116 | Std. Mean Difference (IV, Fixed, 95% CI) | ‐0.23 [‐0.60, 0.13] |
| 21 Overall depression (follow‐up values) Show forest plot | 12 | Std. Mean Difference (IV, Random, 95% CI) | Subtotals only | |
| Analysis 17.21 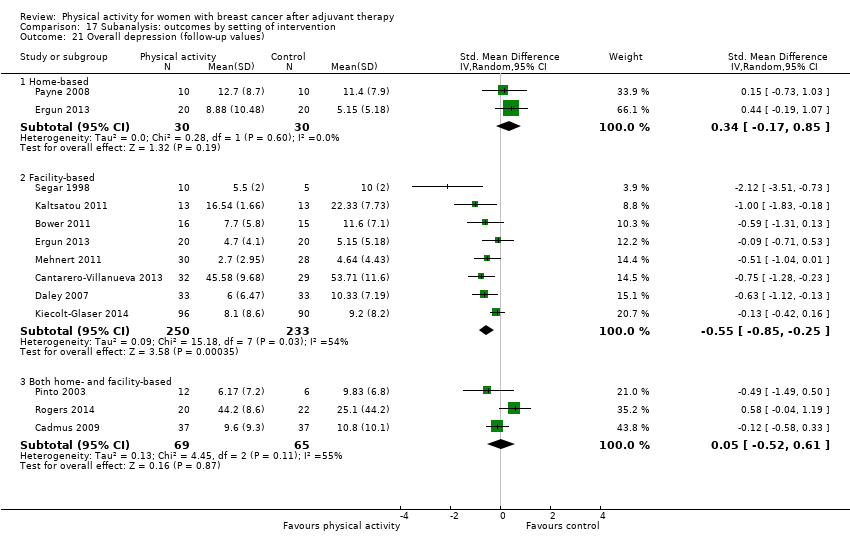 Comparison 17 Subanalysis: outcomes by setting of intervention, Outcome 21 Overall depression (follow‐up values). | ||||
| 21.1 Home‐based | 2 | 60 | Std. Mean Difference (IV, Random, 95% CI) | 0.34 [‐0.17, 0.85] |
| 21.2 Facility‐based | 8 | 483 | Std. Mean Difference (IV, Random, 95% CI) | ‐0.55 [‐0.85, ‐0.25] |
| 21.3 Both home‐ and facility‐based | 3 | 134 | Std. Mean Difference (IV, Random, 95% CI) | 0.05 [‐0.52, 0.61] |
| 22 Overall depression (change values) Show forest plot | 7 | Std. Mean Difference (IV, Random, 95% CI) | Subtotals only | |
| Analysis 17.22  Comparison 17 Subanalysis: outcomes by setting of intervention, Outcome 22 Overall depression (change values). | ||||
| 22.1 Home‐based | 1 | 40 | Std. Mean Difference (IV, Random, 95% CI) | ‐0.39 [‐1.02, 0.23] |
| 22.2 Facility‐based | 3 | 140 | Std. Mean Difference (IV, Random, 95% CI) | ‐0.63 [‐0.97, ‐0.29] |
| 22.3 Both home‐ and facility‐based | 3 | 616 | Std. Mean Difference (IV, Random, 95% CI) | ‐0.11 [‐0.41, 0.19] |
| 23 Overall fatigue (follow‐up values) Show forest plot | 25 | Std. Mean Difference (IV, Random, 95% CI) | Subtotals only | |
| Analysis 17.23 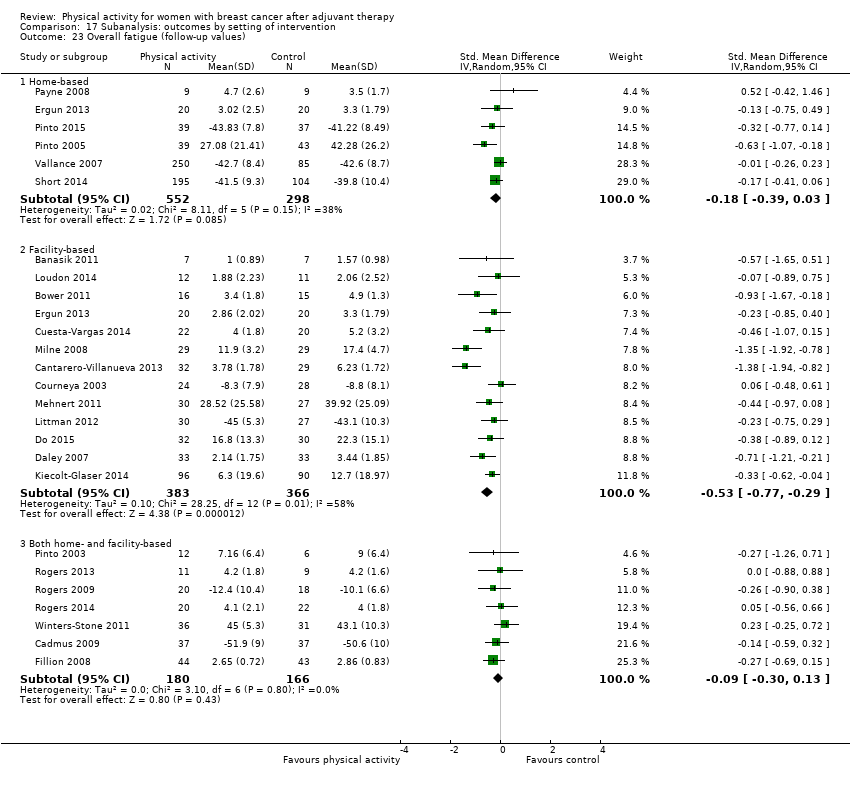 Comparison 17 Subanalysis: outcomes by setting of intervention, Outcome 23 Overall fatigue (follow‐up values). | ||||
| 23.1 Home‐based | 6 | 850 | Std. Mean Difference (IV, Random, 95% CI) | ‐0.18 [‐0.39, 0.03] |
| 23.2 Facility‐based | 13 | 749 | Std. Mean Difference (IV, Random, 95% CI) | ‐0.53 [‐0.77, ‐0.29] |
| 23.3 Both home‐ and facility‐based | 7 | 346 | Std. Mean Difference (IV, Random, 95% CI) | ‐0.09 [‐0.30, 0.13] |
| 24 Overall fatigue (change values) Show forest plot | 12 | Std. Mean Difference (IV, Random, 95% CI) | Subtotals only | |
| Analysis 17.24  Comparison 17 Subanalysis: outcomes by setting of intervention, Outcome 24 Overall fatigue (change values). | ||||
| 24.1 Home‐based | 2 | 417 | Std. Mean Difference (IV, Random, 95% CI) | ‐0.25 [‐1.10, 0.61] |
| 24.2 Facility‐based | 7 | 296 | Std. Mean Difference (IV, Random, 95% CI) | ‐0.43 [‐1.06, 0.20] |
| 24.3 Both home‐ and facility‐based | 3 | 558 | Std. Mean Difference (IV, Random, 95% CI) | ‐0.01 [‐0.17, 0.16] |
| 25 Overall pain/disability (follow‐up values) Show forest plot | 9 | Std. Mean Difference (IV, Random, 95% CI) | Subtotals only | |
| Analysis 17.25  Comparison 17 Subanalysis: outcomes by setting of intervention, Outcome 25 Overall pain/disability (follow‐up values). | ||||
| 25.1 Home‐based | 3 | 249 | Std. Mean Difference (IV, Random, 95% CI) | 0.24 [‐0.20, 0.68] |
| 25.2 Facility‐based | 5 | 183 | Std. Mean Difference (IV, Random, 95% CI) | 0.09 [‐0.20, 0.38] |
| 25.3 Both home‐ and facility‐based | 2 | 112 | Std. Mean Difference (IV, Random, 95% CI) | ‐0.12 [‐0.49, 0.25] |
| 26 Overall pain/disability (change values) Show forest plot | 5 | Std. Mean Difference (IV, Random, 95% CI) | Subtotals only | |
| Analysis 17.26  Comparison 17 Subanalysis: outcomes by setting of intervention, Outcome 26 Overall pain/disability (change values). | ||||
| 26.1 Home‐based | 0 | 0 | Std. Mean Difference (IV, Random, 95% CI) | 0.0 [0.0, 0.0] |
| 26.2 Facility‐based | 3 | 139 | Std. Mean Difference (IV, Random, 95% CI) | 0.16 [‐0.19, 0.50] |
| 26.3 Both home‐ and facility‐based | 2 | 157 | Std. Mean Difference (IV, Random, 95% CI) | ‐0.29 [‐0.61, 0.02] |
| 27 Overall self‐esteem/body image (follow‐up values) Show forest plot | 12 | Std. Mean Difference (IV, Random, 95% CI) | Subtotals only | |
| Analysis 17.27 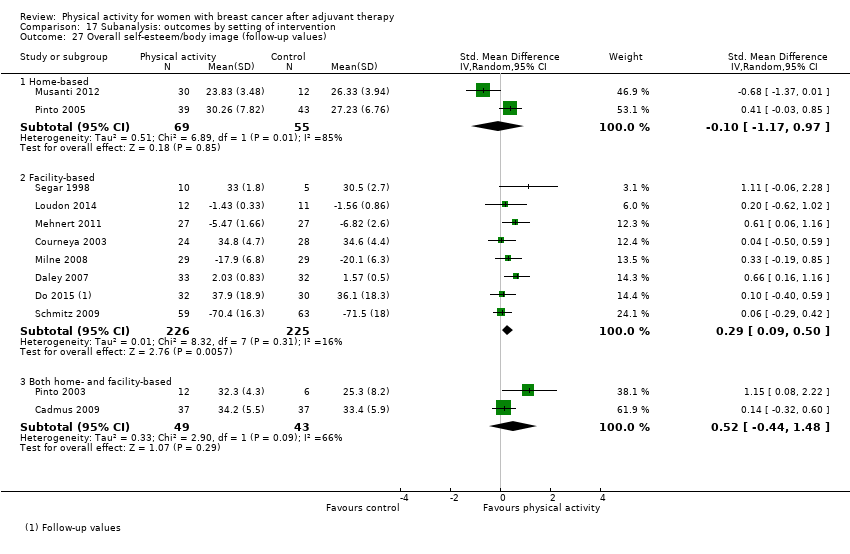 Comparison 17 Subanalysis: outcomes by setting of intervention, Outcome 27 Overall self‐esteem/body image (follow‐up values). | ||||
| 27.1 Home‐based | 2 | 124 | Std. Mean Difference (IV, Random, 95% CI) | ‐0.10 [‐1.17, 0.97] |
| 27.2 Facility‐based | 8 | 451 | Std. Mean Difference (IV, Random, 95% CI) | 0.29 [0.09, 0.50] |
| 27.3 Both home‐ and facility‐based | 2 | 92 | Std. Mean Difference (IV, Random, 95% CI) | 0.52 [‐0.44, 1.48] |
| 28 Overall self‐esteem/body image (change values) Show forest plot | 9 | Std. Mean Difference (IV, Random, 95% CI) | Subtotals only | |
| Analysis 17.28  Comparison 17 Subanalysis: outcomes by setting of intervention, Outcome 28 Overall self‐esteem/body image (change values). | ||||
| 28.1 Home‐based | 1 | 42 | Std. Mean Difference (IV, Random, 95% CI) | ‐0.22 [‐0.89, 0.45] |
| 28.2 Facility‐based | 6 | 376 | Std. Mean Difference (IV, Random, 95% CI) | 0.52 [‐0.09, 1.13] |
| 28.3 Both home‐ and facility‐based | 2 | 574 | Std. Mean Difference (IV, Random, 95% CI) | ‐0.05 [‐0.21, 0.12] |
| 29 Overall cardiorespiratory fitness (follow‐up values) Show forest plot | 23 | Std. Mean Difference (IV, Random, 95% CI) | Subtotals only | |
| Analysis 17.29  Comparison 17 Subanalysis: outcomes by setting of intervention, Outcome 29 Overall cardiorespiratory fitness (follow‐up values). | ||||
| 29.1 Home‐based | 5 | 245 | Std. Mean Difference (IV, Random, 95% CI) | 0.66 [0.40, 0.92] |
| 29.2 Facility‐based | 13 | 603 | Std. Mean Difference (IV, Random, 95% CI) | 0.45 [0.25, 0.66] |
| 29.3 Both home‐ and facility‐based | 6 | 426 | Std. Mean Difference (IV, Random, 95% CI) | 0.29 [0.03, 0.56] |
| 30 Overall cardiorespiratory fitness (change values) Show forest plot | 9 | Std. Mean Difference (IV, Random, 95% CI) | Subtotals only | |
| Analysis 17.30 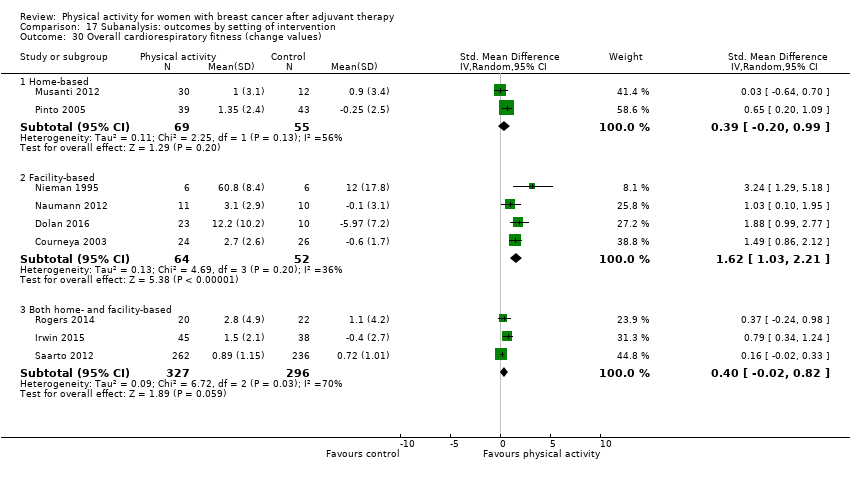 Comparison 17 Subanalysis: outcomes by setting of intervention, Outcome 30 Overall cardiorespiratory fitness (change values). | ||||
| 30.1 Home‐based | 2 | 124 | Std. Mean Difference (IV, Random, 95% CI) | 0.39 [‐0.20, 0.99] |
| 30.2 Facility‐based | 4 | 116 | Std. Mean Difference (IV, Random, 95% CI) | 1.62 [1.03, 2.21] |
| 30.3 Both home‐ and facility‐based | 3 | 623 | Std. Mean Difference (IV, Random, 95% CI) | 0.40 [‐0.02, 0.82] |
| 31 Overall self‐reported physical activity (follow‐up values) Show forest plot | 18 | Std. Mean Difference (IV, Random, 95% CI) | Subtotals only | |
| Analysis 17.31 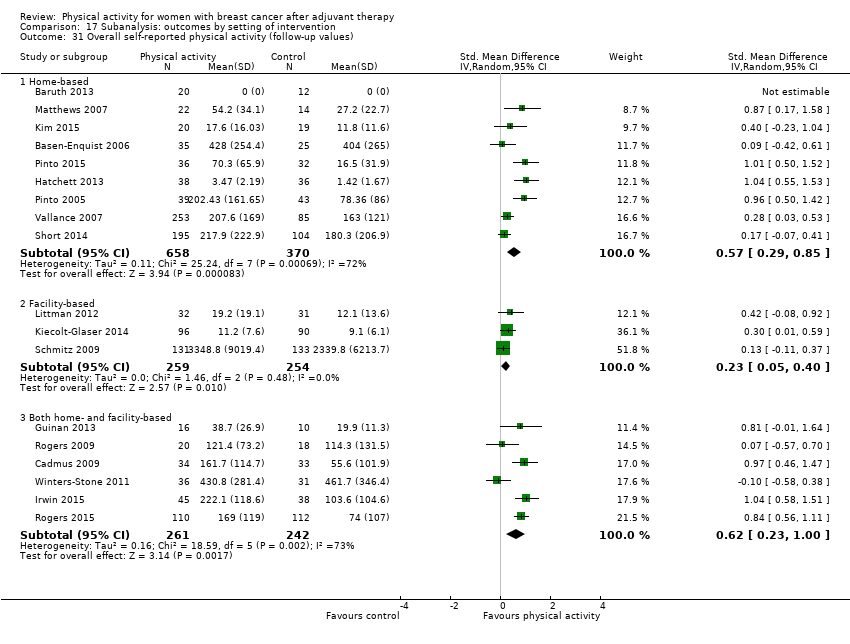 Comparison 17 Subanalysis: outcomes by setting of intervention, Outcome 31 Overall self‐reported physical activity (follow‐up values). | ||||
| 31.1 Home‐based | 9 | 1028 | Std. Mean Difference (IV, Random, 95% CI) | 0.57 [0.29, 0.85] |
| 31.2 Facility‐based | 3 | 513 | Std. Mean Difference (IV, Random, 95% CI) | 0.23 [0.05, 0.40] |
| 31.3 Both home‐ and facility‐based | 6 | 503 | Std. Mean Difference (IV, Random, 95% CI) | 0.62 [0.23, 1.00] |
| 32 Overall self‐reported physical activity (change values) Show forest plot | 8 | Std. Mean Difference (IV, Random, 95% CI) | Subtotals only | |
| Analysis 17.32 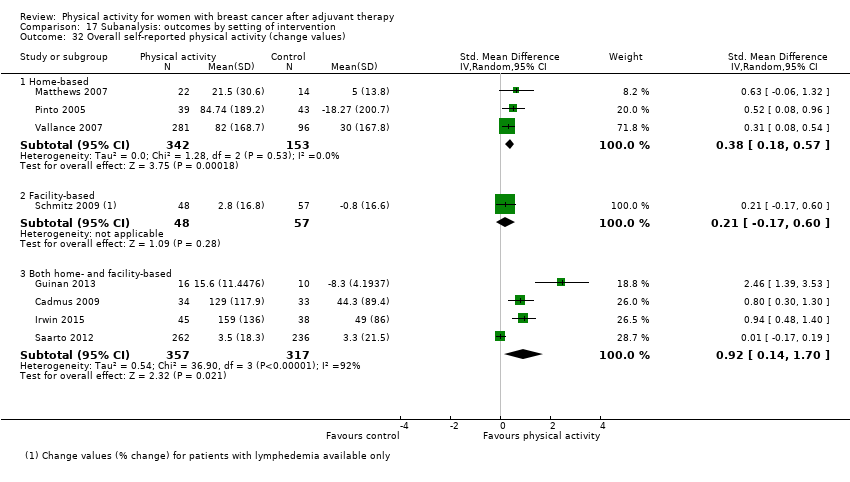 Comparison 17 Subanalysis: outcomes by setting of intervention, Outcome 32 Overall self‐reported physical activity (change values). | ||||
| 32.1 Home‐based | 3 | 495 | Std. Mean Difference (IV, Random, 95% CI) | 0.38 [0.18, 0.57] |
| 32.2 Facility‐based | 1 | 105 | Std. Mean Difference (IV, Random, 95% CI) | 0.21 [‐0.17, 0.60] |
| 32.3 Both home‐ and facility‐based | 4 | 674 | Std. Mean Difference (IV, Random, 95% CI) | 0.92 [0.14, 1.70] |
| 33 Overall objective physical activity (follow‐up values) Show forest plot | 11 | Std. Mean Difference (IV, Random, 95% CI) | Subtotals only | |
| Analysis 17.33 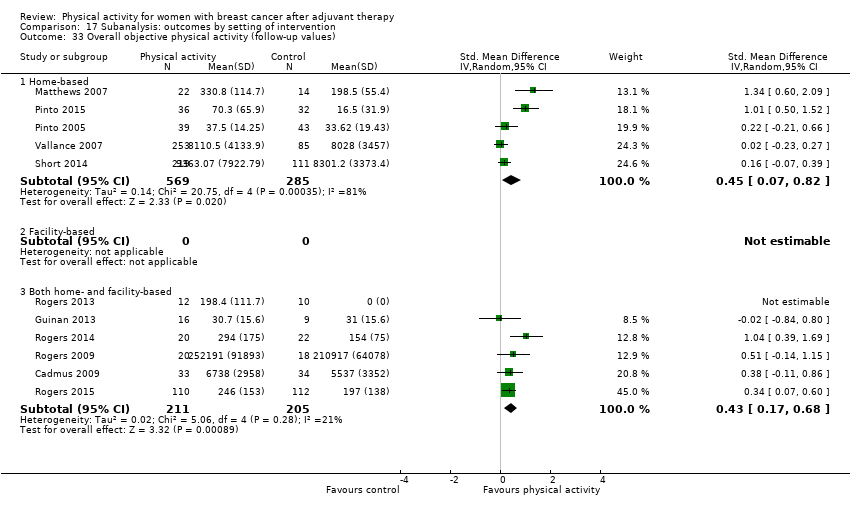 Comparison 17 Subanalysis: outcomes by setting of intervention, Outcome 33 Overall objective physical activity (follow‐up values). | ||||
| 33.1 Home‐based | 5 | 854 | Std. Mean Difference (IV, Random, 95% CI) | 0.45 [0.07, 0.82] |
| 33.2 Facility‐based | 0 | 0 | Std. Mean Difference (IV, Random, 95% CI) | 0.0 [0.0, 0.0] |
| 33.3 Both home‐ and facility‐based | 6 | 416 | Std. Mean Difference (IV, Random, 95% CI) | 0.43 [0.17, 0.68] |
| 34 Overall objective physical activity (change values) Show forest plot | 5 | Std. Mean Difference (IV, Random, 95% CI) | Subtotals only | |
| Analysis 17.34 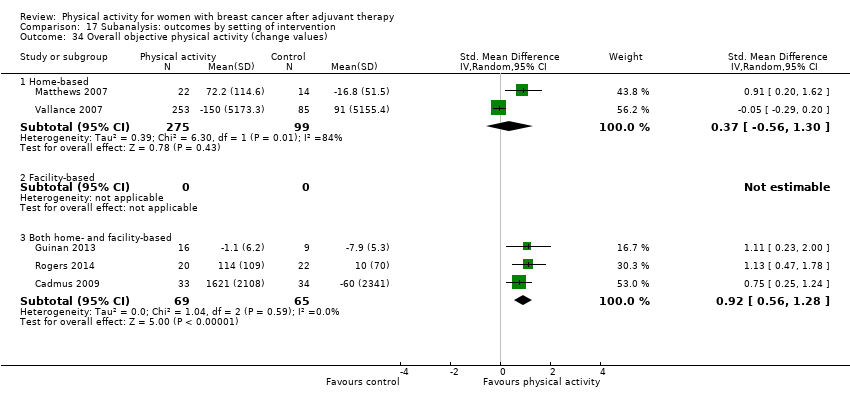 Comparison 17 Subanalysis: outcomes by setting of intervention, Outcome 34 Overall objective physical activity (change values). | ||||
| 34.1 Home‐based | 2 | 374 | Std. Mean Difference (IV, Random, 95% CI) | 0.37 [‐0.56, 1.30] |
| 34.2 Facility‐based | 0 | 0 | Std. Mean Difference (IV, Random, 95% CI) | 0.0 [0.0, 0.0] |
| 34.3 Both home‐ and facility‐based | 3 | 134 | Std. Mean Difference (IV, Random, 95% CI) | 0.92 [0.56, 1.28] |
| 35 Mass (follow‐up values) Show forest plot | 16 | Mean Difference (IV, Fixed, 95% CI) | Subtotals only | |
| Analysis 17.35 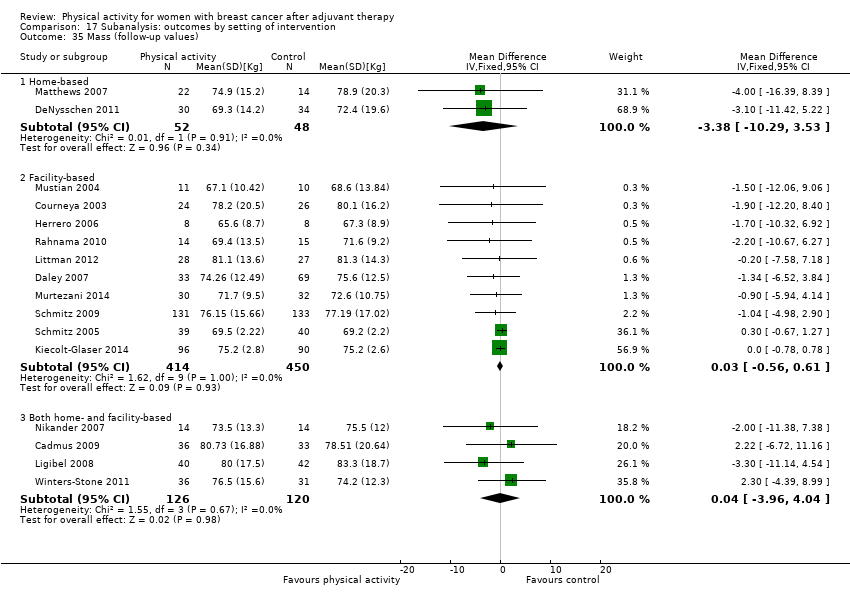 Comparison 17 Subanalysis: outcomes by setting of intervention, Outcome 35 Mass (follow‐up values). | ||||
| 35.1 Home‐based | 2 | 100 | Mean Difference (IV, Fixed, 95% CI) | ‐3.38 [‐10.29, 3.53] |
| 35.2 Facility‐based | 10 | 864 | Mean Difference (IV, Fixed, 95% CI) | 0.03 [‐0.56, 0.61] |
| 35.3 Both home‐ and facility‐based | 4 | 246 | Mean Difference (IV, Fixed, 95% CI) | 0.04 [‐3.96, 4.04] |
| 36 Mass (change values) Show forest plot | 11 | Mean Difference (IV, Random, 95% CI) | Subtotals only | |
| Analysis 17.36  Comparison 17 Subanalysis: outcomes by setting of intervention, Outcome 36 Mass (change values). | ||||
| 36.1 Home‐based | 1 | 36 | Mean Difference (IV, Random, 95% CI) | ‐0.03 [‐1.46, 1.40] |
| 36.2 Facility‐based | 7 | 394 | Mean Difference (IV, Random, 95% CI) | ‐0.61 [‐1.31, 0.08] |
| 36.3 Both home‐ and facility‐based | 3 | 617 | Mean Difference (IV, Random, 95% CI) | ‐0.58 [‐1.80, 0.63] |
| 37 BMI (follow‐up values) Show forest plot | 17 | Mean Difference (IV, Fixed, 95% CI) | Subtotals only | |
| Analysis 17.37  Comparison 17 Subanalysis: outcomes by setting of intervention, Outcome 37 BMI (follow‐up values). | ||||
| 37.1 Home‐based | 3 | 442 | Mean Difference (IV, Fixed, 95% CI) | ‐0.53 [‐1.64, 0.57] |
| 37.2 Facility‐based | 9 | 767 | Mean Difference (IV, Fixed, 95% CI) | 0.04 [‐0.17, 0.26] |
| 37.3 Both home‐ and facility‐based | 6 | 281 | Mean Difference (IV, Fixed, 95% CI) | ‐0.61 [‐2.14, 0.91] |
| 38 BMI (change values) Show forest plot | 8 | Mean Difference (IV, Random, 95% CI) | Subtotals only | |
| Analysis 17.38 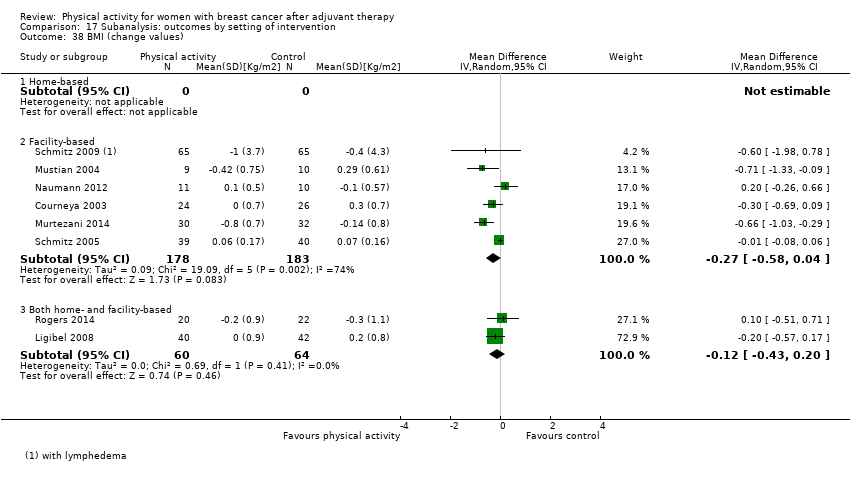 Comparison 17 Subanalysis: outcomes by setting of intervention, Outcome 38 BMI (change values). | ||||
| 38.1 Home‐based | 0 | 0 | Mean Difference (IV, Random, 95% CI) | 0.0 [0.0, 0.0] |
| 38.2 Facility‐based | 6 | 361 | Mean Difference (IV, Random, 95% CI) | ‐0.27 [‐0.58, 0.04] |
| 38.3 Both home‐ and facility‐based | 2 | 124 | Mean Difference (IV, Random, 95% CI) | ‐0.12 [‐0.43, 0.20] |
| 39 Overall body fat (follow‐up values) Show forest plot | 18 | Std. Mean Difference (IV, Random, 95% CI) | Subtotals only | |
| Analysis 17.39  Comparison 17 Subanalysis: outcomes by setting of intervention, Outcome 39 Overall body fat (follow‐up values). | ||||
| 39.1 Home‐based | 4 | 224 | Std. Mean Difference (IV, Random, 95% CI) | ‐0.18 [‐0.45, 0.09] |
| 39.2 Facility‐based | 7 | 550 | Std. Mean Difference (IV, Random, 95% CI) | ‐0.39 [‐0.69, ‐0.08] |
| 39.3 Both home‐ and facility‐based | 7 | 388 | Std. Mean Difference (IV, Random, 95% CI) | 0.01 [‐0.19, 0.21] |
| 40 Overall body fat (change values) Show forest plot | 9 | Std. Mean Difference (IV, Random, 95% CI) | Subtotals only | |
| Analysis 17.40 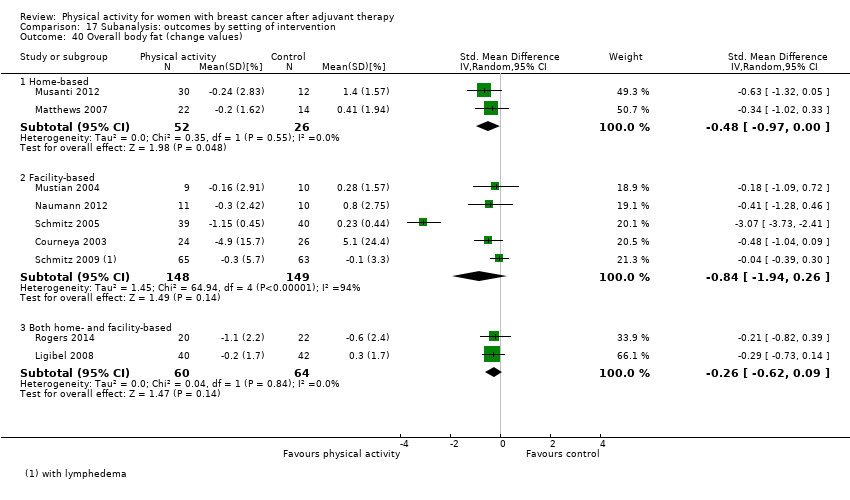 Comparison 17 Subanalysis: outcomes by setting of intervention, Outcome 40 Overall body fat (change values). | ||||
| 40.1 Home‐based | 2 | 78 | Std. Mean Difference (IV, Random, 95% CI) | ‐0.48 [‐0.97, ‐0.00] |
| 40.2 Facility‐based | 5 | 297 | Std. Mean Difference (IV, Random, 95% CI) | ‐0.84 [‐1.94, 0.26] |
| 40.3 Both home‐ and facility‐based | 2 | 124 | Std. Mean Difference (IV, Random, 95% CI) | ‐0.26 [‐0.62, 0.09] |
| 41 Lower body strength (follow‐up values) Show forest plot | 10 | Std. Mean Difference (IV, Random, 95% CI) | Subtotals only | |
| Analysis 17.41  Comparison 17 Subanalysis: outcomes by setting of intervention, Outcome 41 Lower body strength (follow‐up values). | ||||
| 41.1 Home‐based | 0 | 0 | Std. Mean Difference (IV, Random, 95% CI) | 0.0 [0.0, 0.0] |
| 41.2 Facility‐based | 5 | 417 | Std. Mean Difference (IV, Random, 95% CI) | 0.75 [0.24, 1.27] |
| 41.3 Both home‐ and facility‐based | 5 | 220 | Std. Mean Difference (IV, Random, 95% CI) | 0.12 [‐0.16, 0.40] |
| 42 Lower body strength (change values) Show forest plot | 8 | Std. Mean Difference (IV, Random, 95% CI) | Subtotals only | |
| Analysis 17.42 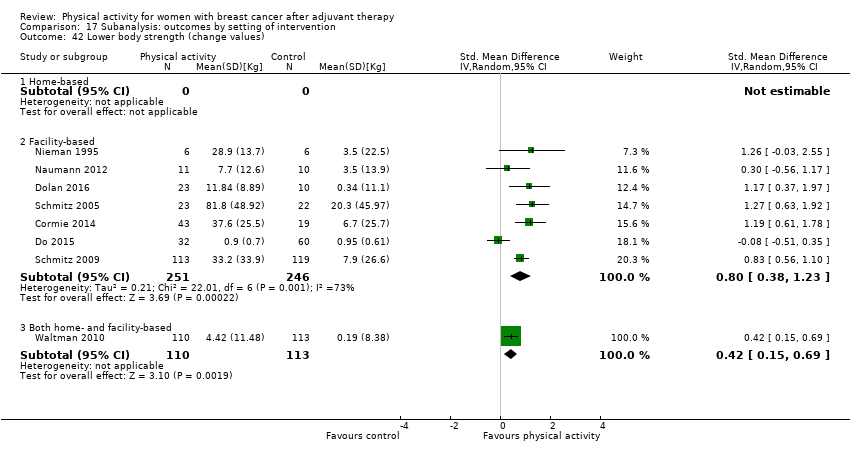 Comparison 17 Subanalysis: outcomes by setting of intervention, Outcome 42 Lower body strength (change values). | ||||
| 42.1 Home‐based | 0 | 0 | Std. Mean Difference (IV, Random, 95% CI) | 0.0 [0.0, 0.0] |
| 42.2 Facility‐based | 7 | 497 | Std. Mean Difference (IV, Random, 95% CI) | 0.80 [0.38, 1.23] |
| 42.3 Both home‐ and facility‐based | 1 | 223 | Std. Mean Difference (IV, Random, 95% CI) | 0.42 [0.15, 0.69] |
| 43 Upper body strength (follow‐up values) Show forest plot | 13 | Std. Mean Difference (IV, Random, 95% CI) | Subtotals only | |
| Analysis 17.43  Comparison 17 Subanalysis: outcomes by setting of intervention, Outcome 43 Upper body strength (follow‐up values). | ||||
| 43.1 Home‐based | 2 | 64 | Std. Mean Difference (IV, Random, 95% CI) | 0.58 [0.05, 1.12] |
| 43.2 Facility‐based | 8 | 513 | Std. Mean Difference (IV, Random, 95% CI) | 0.43 [‐0.12, 0.98] |
| 43.3 Both home‐ and facility‐based | 4 | 200 | Std. Mean Difference (IV, Random, 95% CI) | 0.29 [0.01, 0.57] |
| 44 Upper body strength (change values) Show forest plot | 8 | Std. Mean Difference (IV, Random, 95% CI) | Subtotals only | |
| Analysis 17.44  Comparison 17 Subanalysis: outcomes by setting of intervention, Outcome 44 Upper body strength (change values). | ||||
| 44.1 Home‐based | 0 | 0 | Std. Mean Difference (IV, Random, 95% CI) | 0.0 [0.0, 0.0] |
| 44.2 Facility‐based | 6 | 526 | Std. Mean Difference (IV, Random, 95% CI) | 0.92 [0.34, 1.50] |
| 44.3 Both home‐ and facility‐based | 2 | 306 | Std. Mean Difference (IV, Random, 95% CI) | 0.25 [0.03, 0.48] |
| 45 Bone mineral density ‐ femoral neck (follow‐up and change values) Show forest plot | 4 | Std. Mean Difference (IV, Random, 95% CI) | Subtotals only | |
| Analysis 17.45  Comparison 17 Subanalysis: outcomes by setting of intervention, Outcome 45 Bone mineral density ‐ femoral neck (follow‐up and change values). | ||||
| 45.1 Home‐based | 1 | 39 | Std. Mean Difference (IV, Random, 95% CI) | ‐0.37 [‐1.00, 0.27] |
| 45.2 Facility‐based | 0 | 0 | Std. Mean Difference (IV, Random, 95% CI) | 0.0 [0.0, 0.0] |
| 45.3 Both home‐ and facility‐based | 3 | 747 | Std. Mean Difference (IV, Random, 95% CI) | 0.32 [‐0.01, 0.65] |
| 46 Bone mineral density ‐ lumbar spine (follow‐up and change values) Show forest plot | 4 | Std. Mean Difference (IV, Random, 95% CI) | Subtotals only | |
| Analysis 17.46 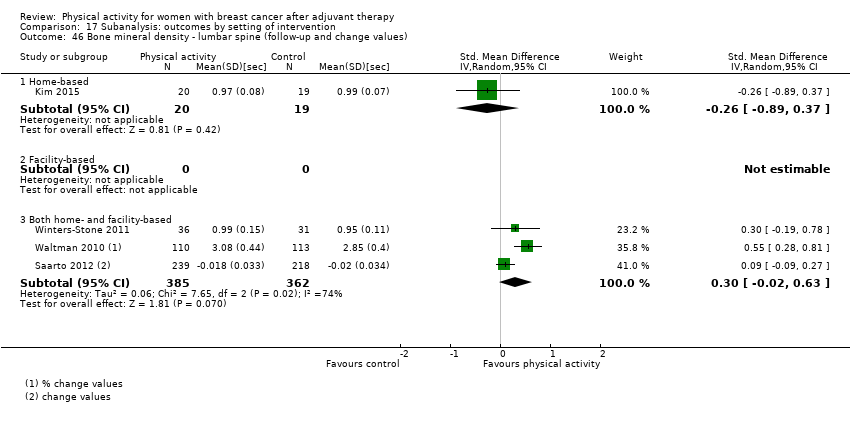 Comparison 17 Subanalysis: outcomes by setting of intervention, Outcome 46 Bone mineral density ‐ lumbar spine (follow‐up and change values). | ||||
| 46.1 Home‐based | 1 | 39 | Std. Mean Difference (IV, Random, 95% CI) | ‐0.26 [‐0.89, 0.37] |
| 46.2 Facility‐based | 0 | 0 | Std. Mean Difference (IV, Random, 95% CI) | 0.0 [0.0, 0.0] |
| 46.3 Both home‐ and facility‐based | 3 | 747 | Std. Mean Difference (IV, Random, 95% CI) | 0.30 [‐0.02, 0.63] |
| 47 Bone mineral density ‐ total hip (follow‐up and change values) Show forest plot | 3 | Std. Mean Difference (IV, Random, 95% CI) | Subtotals only | |
| Analysis 17.47  Comparison 17 Subanalysis: outcomes by setting of intervention, Outcome 47 Bone mineral density ‐ total hip (follow‐up and change values). | ||||
| 47.1 Home‐based | 1 | 39 | Std. Mean Difference (IV, Random, 95% CI) | 10.34 [7.84, 12.84] |
| 47.2 Facility‐based | 0 | 0 | Std. Mean Difference (IV, Random, 95% CI) | 0.0 [0.0, 0.0] |
| 47.3 Both home‐ and facility‐based | 2 | 290 | Std. Mean Difference (IV, Random, 95% CI) | 0.64 [‐0.20, 1.48] |
| Outcome or subgroup title | No. of studies | No. of participants | Statistical method | Effect size |
| 1 Overall HRQoL (follow‐up values) Show forest plot | 22 | Std. Mean Difference (IV, Random, 95% CI) | Subtotals only | |
| Analysis 18.1  Comparison 18 Sensitivity analysis: outcomes by risk of bias, Outcome 1 Overall HRQoL (follow‐up values). | ||||
| 1.1 Low risk of bias | 15 | 1521 | Std. Mean Difference (IV, Random, 95% CI) | 0.43 [0.19, 0.66] |
| 1.2 Unclear/high risk of bias | 7 | 475 | Std. Mean Difference (IV, Random, 95% CI) | 0.30 [0.06, 0.55] |
| 2 Overall HRQoL (change values) Show forest plot | 14 | Std. Mean Difference (IV, Random, 95% CI) | Subtotals only | |
| Analysis 18.2  Comparison 18 Sensitivity analysis: outcomes by risk of bias, Outcome 2 Overall HRQoL (change values). | ||||
| 2.1 Low risk of bias | 11 | 1360 | Std. Mean Difference (IV, Random, 95% CI) | 0.70 [0.28, 1.12] |
| 2.2 Unclear/high risk of bias | 3 | 99 | Std. Mean Difference (IV, Random, 95% CI) | 1.26 [‐0.11, 2.62] |
| 3 Overall emotional function/mental health (follow‐up values) Show forest plot | 26 | Std. Mean Difference (IV, Random, 95% CI) | Subtotals only | |
| Analysis 18.3 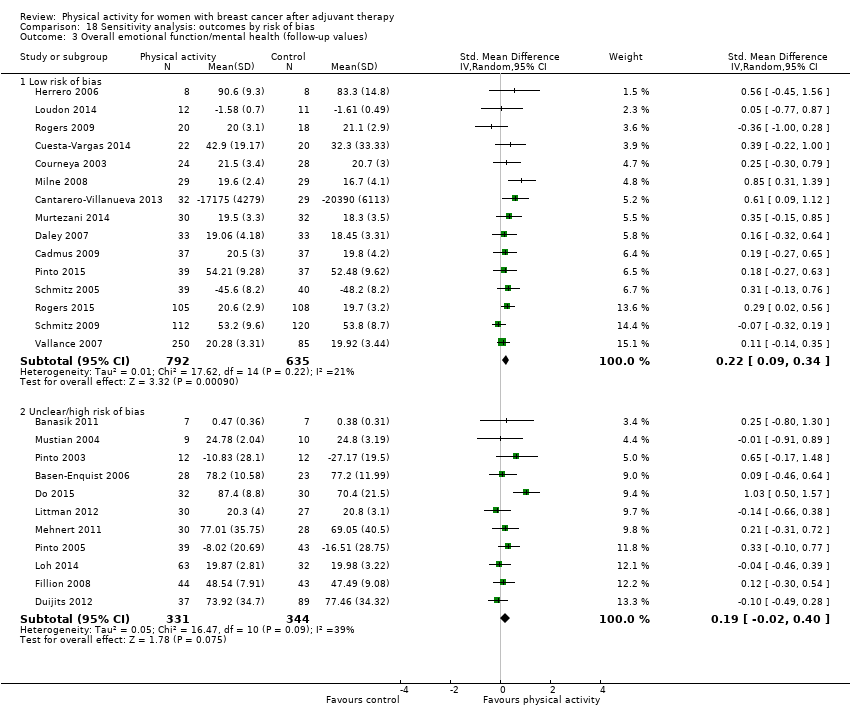 Comparison 18 Sensitivity analysis: outcomes by risk of bias, Outcome 3 Overall emotional function/mental health (follow‐up values). | ||||
| 3.1 Low risk of bias | 15 | 1427 | Std. Mean Difference (IV, Random, 95% CI) | 0.22 [0.09, 0.34] |
| 3.2 Unclear/high risk of bias | 11 | 675 | Std. Mean Difference (IV, Random, 95% CI) | 0.19 [‐0.02, 0.40] |
| 4 Overall emotional function/mental health (change values) Show forest plot | 15 | Std. Mean Difference (IV, Random, 95% CI) | Subtotals only | |
| Analysis 18.4  Comparison 18 Sensitivity analysis: outcomes by risk of bias, Outcome 4 Overall emotional function/mental health (change values). | ||||
| 4.1 Low risk of bias | 11 | 1399 | Std. Mean Difference (IV, Random, 95% CI) | 0.31 [0.04, 0.58] |
| 4.2 Unclear/high risk of bias | 4 | 180 | Std. Mean Difference (IV, Random, 95% CI) | 0.28 [‐0.08, 0.65] |
| 5 Overall physical function (follow‐up values) Show forest plot | 25 | Std. Mean Difference (IV, Random, 95% CI) | Subtotals only | |
| Analysis 18.5 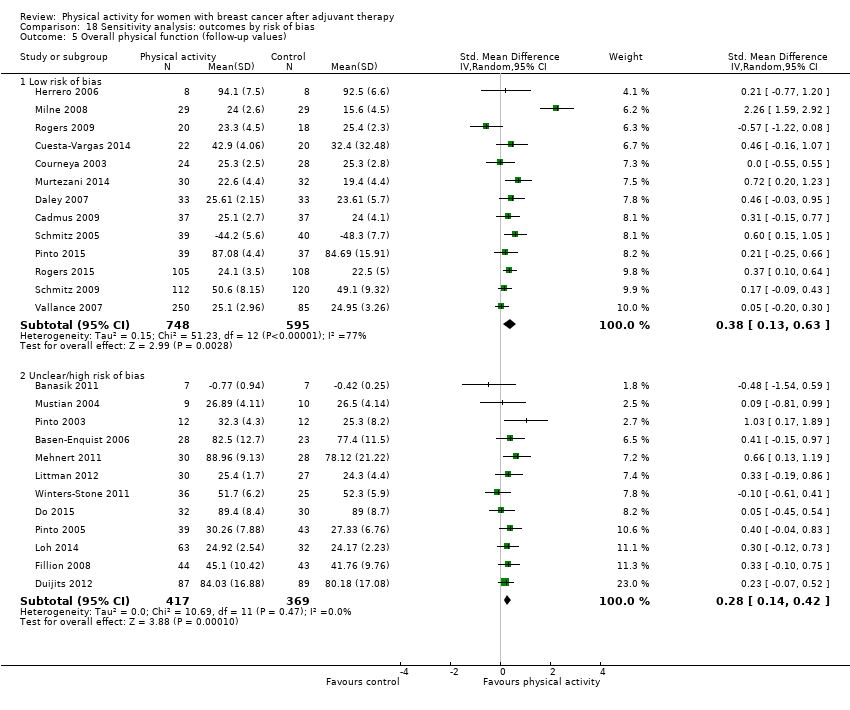 Comparison 18 Sensitivity analysis: outcomes by risk of bias, Outcome 5 Overall physical function (follow‐up values). | ||||
| 5.1 Low risk of bias | 13 | 1343 | Std. Mean Difference (IV, Random, 95% CI) | 0.38 [0.13, 0.63] |
| 5.2 Unclear/high risk of bias | 12 | 786 | Std. Mean Difference (IV, Random, 95% CI) | 0.28 [0.14, 0.42] |
| 6 Overall physical function (change values) Show forest plot | 13 | Std. Mean Difference (IV, Random, 95% CI) | Subtotals only | |
| Analysis 18.6 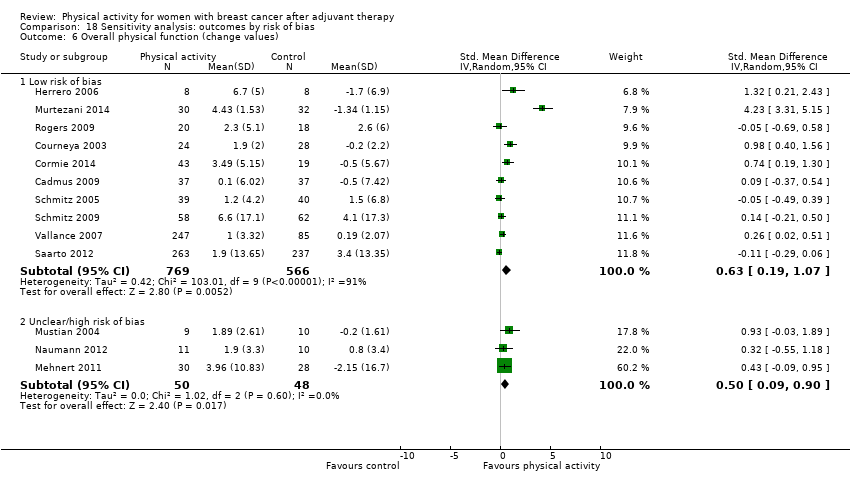 Comparison 18 Sensitivity analysis: outcomes by risk of bias, Outcome 6 Overall physical function (change values). | ||||
| 6.1 Low risk of bias | 10 | 1335 | Std. Mean Difference (IV, Random, 95% CI) | 0.63 [0.19, 1.07] |
| 6.2 Unclear/high risk of bias | 3 | 98 | Std. Mean Difference (IV, Random, 95% CI) | 0.50 [0.09, 0.90] |
| 7 Overall role function (follow‐up values) Show forest plot | 18 | Std. Mean Difference (IV, Random, 95% CI) | Subtotals only | |
| Analysis 18.7  Comparison 18 Sensitivity analysis: outcomes by risk of bias, Outcome 7 Overall role function (follow‐up values). | ||||
| 7.1 Low risk of bias | 12 | 1111 | Std. Mean Difference (IV, Random, 95% CI) | 0.32 [0.02, 0.61] |
| 7.2 Unclear/high risk of bias | 6 | 259 | Std. Mean Difference (IV, Random, 95% CI) | 0.24 [‐0.01, 0.48] |
| 8 Overall role function (change values) Show forest plot | 12 | Std. Mean Difference (IV, Random, 95% CI) | Subtotals only | |
| Analysis 18.8 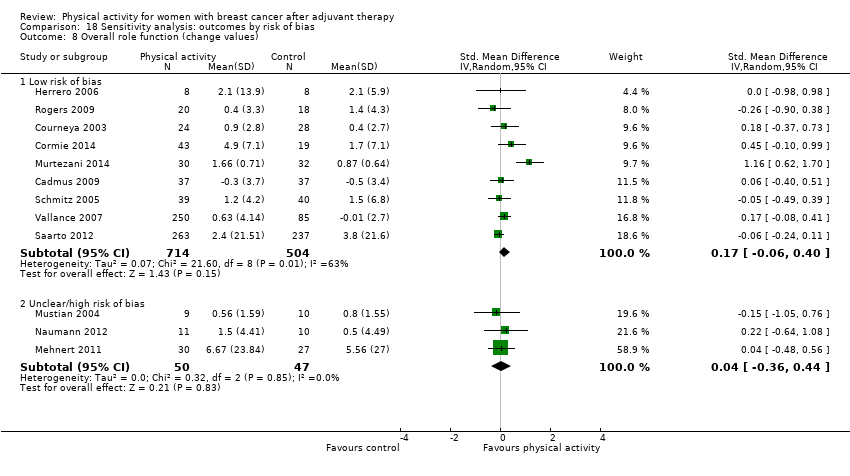 Comparison 18 Sensitivity analysis: outcomes by risk of bias, Outcome 8 Overall role function (change values). | ||||
| 8.1 Low risk of bias | 9 | 1218 | Std. Mean Difference (IV, Random, 95% CI) | 0.17 [‐0.06, 0.40] |
| 8.2 Unclear/high risk of bias | 3 | 97 | Std. Mean Difference (IV, Random, 95% CI) | 0.04 [‐0.36, 0.44] |
| 9 Overall social well‐being/function (follow‐up values) Show forest plot | 18 | Std. Mean Difference (IV, Random, 95% CI) | Subtotals only | |
| Analysis 18.9 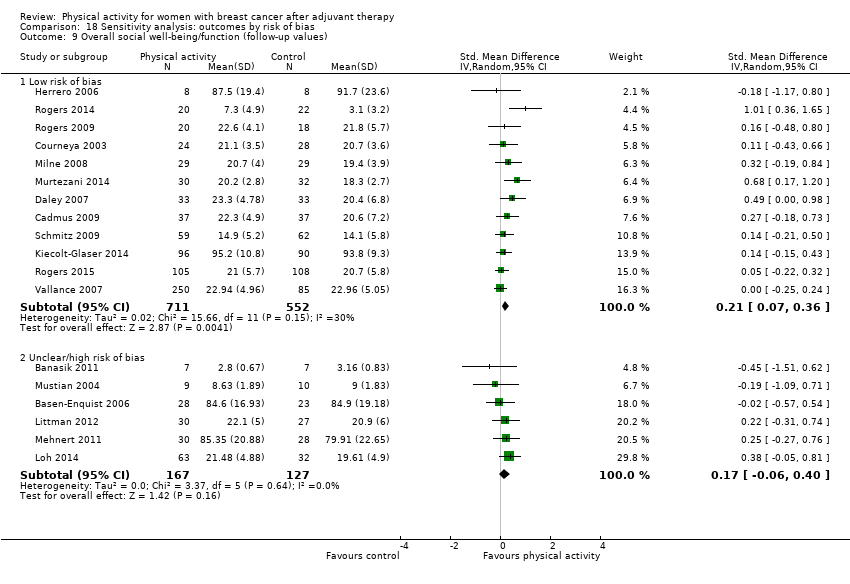 Comparison 18 Sensitivity analysis: outcomes by risk of bias, Outcome 9 Overall social well‐being/function (follow‐up values). | ||||
| 9.1 Low risk of bias | 12 | 1263 | Std. Mean Difference (IV, Random, 95% CI) | 0.21 [0.07, 0.36] |
| 9.2 Unclear/high risk of bias | 6 | 294 | Std. Mean Difference (IV, Random, 95% CI) | 0.17 [‐0.06, 0.40] |
| 10 Overall social well‐being/function (change values) Show forest plot | 12 | Std. Mean Difference (IV, Random, 95% CI) | Subtotals only | |
| Analysis 18.10 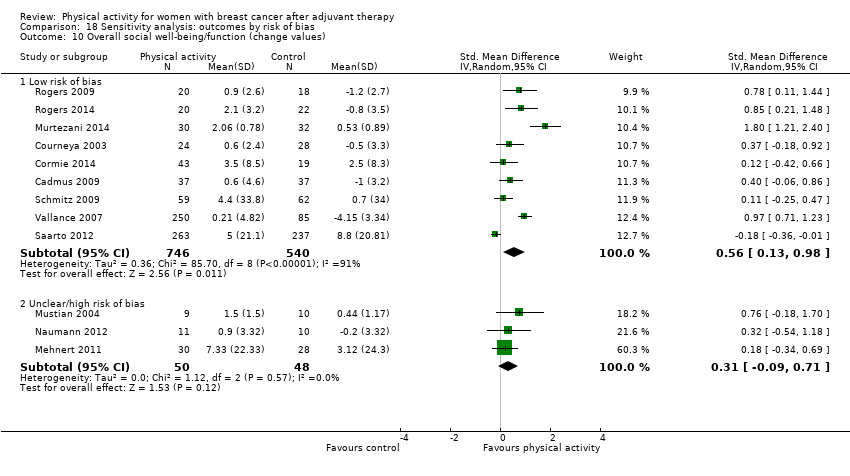 Comparison 18 Sensitivity analysis: outcomes by risk of bias, Outcome 10 Overall social well‐being/function (change values). | ||||
| 10.1 Low risk of bias | 9 | 1286 | Std. Mean Difference (IV, Random, 95% CI) | 0.56 [0.13, 0.98] |
| 10.2 Unclear/high risk of bias | 3 | 98 | Std. Mean Difference (IV, Random, 95% CI) | 0.31 [‐0.09, 0.71] |
| 11 Overall cognitive function (follow‐up values) Show forest plot | 5 | Std. Mean Difference (IV, Random, 95% CI) | Subtotals only | |
| Analysis 18.11  Comparison 18 Sensitivity analysis: outcomes by risk of bias, Outcome 11 Overall cognitive function (follow‐up values). | ||||
| 11.1 Low risk of bias | 3 | 114 | Std. Mean Difference (IV, Random, 95% CI) | 0.45 [0.07, 0.82] |
| 11.2 Unclear/high risk of bias | 2 | 75 | Std. Mean Difference (IV, Random, 95% CI) | 0.52 [‐0.44, 1.48] |
| 12 Overall cognitive function (change values) Show forest plot | 5 | Std. Mean Difference (IV, Random, 95% CI) | Subtotals only | |
| Analysis 18.12 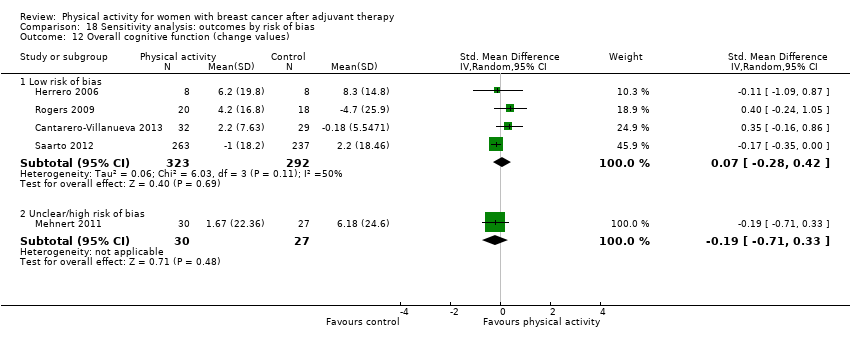 Comparison 18 Sensitivity analysis: outcomes by risk of bias, Outcome 12 Overall cognitive function (change values). | ||||
| 12.1 Low risk of bias | 4 | 615 | Std. Mean Difference (IV, Random, 95% CI) | 0.07 [‐0.28, 0.42] |
| 12.2 Unclear/high risk of bias | 1 | 57 | Std. Mean Difference (IV, Random, 95% CI) | ‐0.19 [‐0.71, 0.33] |
| 13 Overall general health (follow‐up values) Show forest plot | 9 | Std. Mean Difference (IV, Random, 95% CI) | Subtotals only | |
| Analysis 18.13  Comparison 18 Sensitivity analysis: outcomes by risk of bias, Outcome 13 Overall general health (follow‐up values). | ||||
| 13.1 Low risk of bias | 5 | 267 | Std. Mean Difference (IV, Random, 95% CI) | 0.06 [‐0.31, 0.43] |
| 13.2 Unclear/high risk of bias | 4 | 189 | Std. Mean Difference (IV, Random, 95% CI) | 0.36 [0.02, 0.70] |
| 14 Overall general health (change values) Show forest plot | 9 | Std. Mean Difference (IV, Random, 95% CI) | Subtotals only | |
| Analysis 18.14  Comparison 18 Sensitivity analysis: outcomes by risk of bias, Outcome 14 Overall general health (change values). | ||||
| 14.1 Low risk of bias | 7 | 829 | Std. Mean Difference (IV, Random, 95% CI) | 0.21 [‐0.08, 0.49] |
| 14.2 Unclear/high risk of bias | 2 | 77 | Std. Mean Difference (IV, Random, 95% CI) | 0.10 [‐0.35, 0.55] |
| 15 Overall sexual function (follow‐up values) Show forest plot | 5 | Std. Mean Difference (IV, Fixed, 95% CI) | Subtotals only | |
| Analysis 18.15 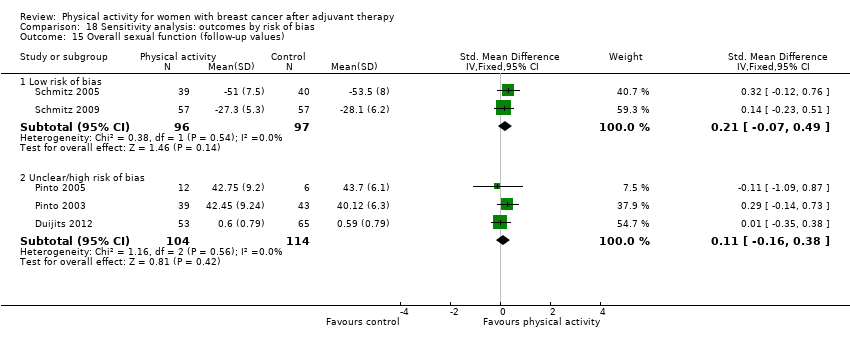 Comparison 18 Sensitivity analysis: outcomes by risk of bias, Outcome 15 Overall sexual function (follow‐up values). | ||||
| 15.1 Low risk of bias | 2 | 193 | Std. Mean Difference (IV, Fixed, 95% CI) | 0.21 [‐0.07, 0.49] |
| 15.2 Unclear/high risk of bias | 3 | 218 | Std. Mean Difference (IV, Fixed, 95% CI) | 0.11 [‐0.16, 0.38] |
| 16 Overall sexual function (change values) Show forest plot | 3 | Std. Mean Difference (IV, Random, 95% CI) | Subtotals only | |
| Analysis 18.16  Comparison 18 Sensitivity analysis: outcomes by risk of bias, Outcome 16 Overall sexual function (change values). | ||||
| 16.1 Low risk of bias | 3 | 693 | Std. Mean Difference (IV, Random, 95% CI) | 0.22 [‐0.08, 0.52] |
| 16.2 Unclear/high risk of bias | 0 | 0 | Std. Mean Difference (IV, Random, 95% CI) | 0.0 [0.0, 0.0] |
| 17 Overall sleep (follow‐up values) Show forest plot | 5 | Std. Mean Difference (IV, Fixed, 95% CI) | Subtotals only | |
| Analysis 18.17  Comparison 18 Sensitivity analysis: outcomes by risk of bias, Outcome 17 Overall sleep (follow‐up values). | ||||
| 17.1 Low risk of bias | 3 | 111 | Std. Mean Difference (IV, Fixed, 95% CI) | 0.09 [‐0.28, 0.47] |
| 17.2 Unclear/high risk of bias | 2 | 77 | Std. Mean Difference (IV, Fixed, 95% CI) | ‐0.35 [‐0.80, 0.10] |
| 18 Overall sleep (change values) Show forest plot | 3 | Std. Mean Difference (IV, Random, 95% CI) | Subtotals only | |
| Analysis 18.18  Comparison 18 Sensitivity analysis: outcomes by risk of bias, Outcome 18 Overall sleep (change values). | ||||
| 18.1 Low risk of bias | 2 | 80 | Std. Mean Difference (IV, Random, 95% CI) | 0.14 [‐0.30, 0.58] |
| 18.2 Unclear/high risk of bias | 1 | 56 | Std. Mean Difference (IV, Random, 95% CI) | 0.14 [‐0.38, 0.67] |
| 19 Overall anxiety (follow‐up values) Show forest plot | 7 | Std. Mean Difference (IV, Random, 95% CI) | Subtotals only | |
| Analysis 18.19  Comparison 18 Sensitivity analysis: outcomes by risk of bias, Outcome 19 Overall anxiety (follow‐up values). | ||||
| 19.1 Low risk of bias | 4 | 235 | Std. Mean Difference (IV, Random, 95% CI) | ‐0.46 [‐0.89, ‐0.03] |
| 19.2 Unclear/high risk of bias | 3 | 91 | Std. Mean Difference (IV, Random, 95% CI) | ‐0.95 [‐1.92, 0.02] |
| 20 Overall anxiety (change values) Show forest plot | 4 | Std. Mean Difference (IV, Fixed, 95% CI) | Subtotals only | |
| Analysis 18.20  Comparison 18 Sensitivity analysis: outcomes by risk of bias, Outcome 20 Overall anxiety (change values). | ||||
| 20.1 Low risk of bias | 3 | 177 | Std. Mean Difference (IV, Fixed, 95% CI) | ‐0.36 [‐0.66, ‐0.06] |
| 20.2 Unclear/high risk of bias | 1 | 58 | Std. Mean Difference (IV, Fixed, 95% CI) | ‐0.42 [‐0.95, 0.10] |
| 21 Overall self‐esteem/body image (follow‐up values) Show forest plot | 12 | Std. Mean Difference (IV, Random, 95% CI) | Subtotals only | |
| Analysis 18.21 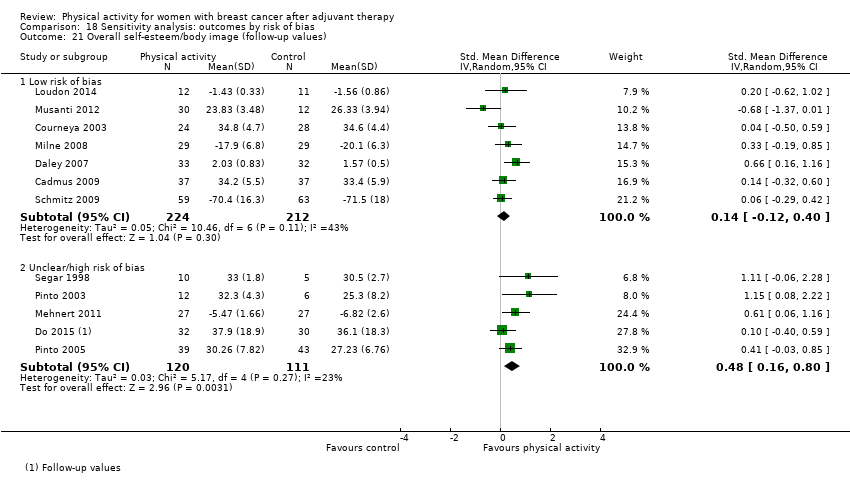 Comparison 18 Sensitivity analysis: outcomes by risk of bias, Outcome 21 Overall self‐esteem/body image (follow‐up values). | ||||
| 21.1 Low risk of bias | 7 | 436 | Std. Mean Difference (IV, Random, 95% CI) | 0.14 [‐0.12, 0.40] |
| 21.2 Unclear/high risk of bias | 5 | 231 | Std. Mean Difference (IV, Random, 95% CI) | 0.48 [0.16, 0.80] |
| 22 Overall self‐esteem/body image (change values) Show forest plot | 9 | Std. Mean Difference (IV, Random, 95% CI) | Subtotals only | |
| Analysis 18.22 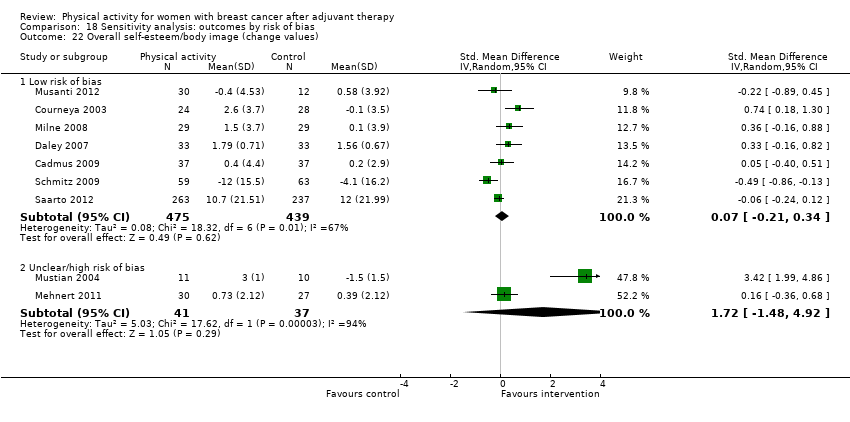 Comparison 18 Sensitivity analysis: outcomes by risk of bias, Outcome 22 Overall self‐esteem/body image (change values). | ||||
| 22.1 Low risk of bias | 7 | 914 | Std. Mean Difference (IV, Random, 95% CI) | 0.07 [‐0.21, 0.34] |
| 22.2 Unclear/high risk of bias | 2 | 78 | Std. Mean Difference (IV, Random, 95% CI) | 1.72 [‐1.48, 4.92] |
| 23 Overall depression (follow‐up values) Show forest plot | 12 | Std. Mean Difference (IV, Random, 95% CI) | Subtotals only | |
| Analysis 18.23  Comparison 18 Sensitivity analysis: outcomes by risk of bias, Outcome 23 Overall depression (follow‐up values). | ||||
| 23.1 Low risk of bias | 7 | 520 | Std. Mean Difference (IV, Random, 95% CI) | ‐0.20 [‐0.52, 0.12] |
| 23.2 Unclear/high risk of bias | 5 | 137 | Std. Mean Difference (IV, Random, 95% CI) | ‐0.67 [‐1.23, ‐0.11] |
| 24 Overall depression (change values) Show forest plot | 7 | Std. Mean Difference (IV, Random, 95% CI) | Subtotals only | |
| Analysis 18.24  Comparison 18 Sensitivity analysis: outcomes by risk of bias, Outcome 24 Overall depression (change values). | ||||
| 24.1 Low risk of bias | 5 | 737 | Std. Mean Difference (IV, Random, 95% CI) | ‐0.20 [‐0.47, 0.06] |
| 24.2 Unclear/high risk of bias | 2 | 79 | Std. Mean Difference (IV, Random, 95% CI) | ‐0.75 [‐1.39, ‐0.10] |
| 25 Overall fatigue (follow‐up values) Show forest plot | 25 | Std. Mean Difference (IV, Random, 95% CI) | Subtotals only | |
| Analysis 18.25  Comparison 18 Sensitivity analysis: outcomes by risk of bias, Outcome 25 Overall fatigue (follow‐up values). | ||||
| 25.1 Low risk of bias | 15 | 1443 | Std. Mean Difference (IV, Random, 95% CI) | ‐0.38 [‐0.59, ‐0.18] |
| 25.2 Unclear/high risk of bias | 10 | 482 | Std. Mean Difference (IV, Random, 95% CI) | ‐0.25 [‐0.45, ‐0.05] |
| 26 Overall fatigue (change values) Show forest plot | 13 | Std. Mean Difference (IV, Random, 95% CI) | Subtotals only | |
| Analysis 18.26  Comparison 18 Sensitivity analysis: outcomes by risk of bias, Outcome 26 Overall fatigue (change values). | ||||
| 26.1 Low risk of bias | 8 | 1091 | Std. Mean Difference (IV, Random, 95% CI) | ‐0.22 [‐0.61, 0.16] |
| 26.2 Unclear/high risk of bias | 5 | 198 | Std. Mean Difference (IV, Random, 95% CI) | ‐0.45 [‐0.95, 0.05] |
| 27 Overall pain/disability (follow‐up values) Show forest plot | 9 | Std. Mean Difference (IV, Random, 95% CI) | Subtotals only | |
| Analysis 18.27  Comparison 18 Sensitivity analysis: outcomes by risk of bias, Outcome 27 Overall pain/disability (follow‐up values). | ||||
| 27.1 Low risk of bias | 4 | 169 | Std. Mean Difference (IV, Random, 95% CI) | ‐0.13 [‐0.44, 0.18] |
| 27.2 Unclear/high risk of bias | 5 | 352 | Std. Mean Difference (IV, Random, 95% CI) | 0.25 [0.04, 0.46] |
| 28 Overall pain/disability (change values) Show forest plot | 6 | Std. Mean Difference (IV, Random, 95% CI) | Subtotals only | |
| Analysis 18.28  Comparison 18 Sensitivity analysis: outcomes by risk of bias, Outcome 28 Overall pain/disability (change values). | ||||
| 28.1 Low risk of bias | 2 | 136 | Std. Mean Difference (IV, Random, 95% CI) | ‐0.03 [‐0.45, 0.40] |
| 28.2 Unclear/high risk of bias | 4 | 196 | Std. Mean Difference (IV, Random, 95% CI) | ‐0.05 [‐0.36, 0.26] |
| 29 Overall cardiorespiratory fitness (follow‐up values) Show forest plot | 23 | Std. Mean Difference (IV, Random, 95% CI) | Subtotals only | |
| Analysis 18.29  Comparison 18 Sensitivity analysis: outcomes by risk of bias, Outcome 29 Overall cardiorespiratory fitness (follow‐up values). | ||||
| 29.1 Low risk of bias | 10 | 657 | Std. Mean Difference (IV, Random, 95% CI) | 0.44 [0.24, 0.65] |
| 29.2 Unclear/high risk of bias | 13 | 608 | Std. Mean Difference (IV, Random, 95% CI) | 0.44 [0.23, 0.65] |
| 30 Overall cardiorespiratory fitness (change values) Show forest plot | 9 | Std. Mean Difference (IV, Random, 95% CI) | Subtotals only | |
| Analysis 18.30 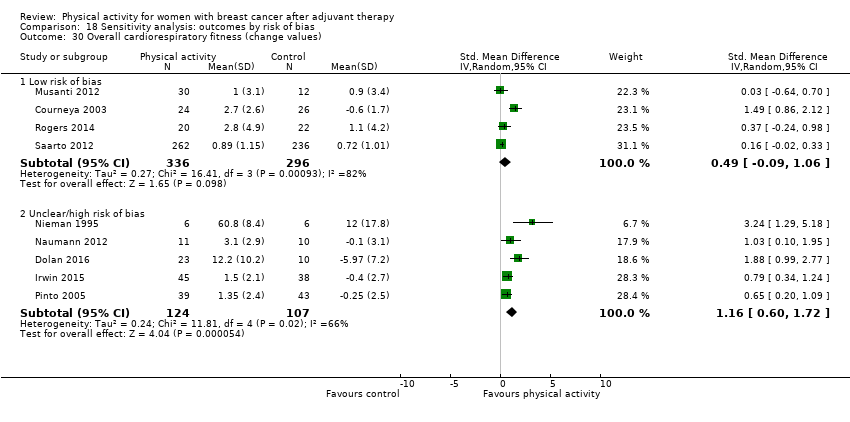 Comparison 18 Sensitivity analysis: outcomes by risk of bias, Outcome 30 Overall cardiorespiratory fitness (change values). | ||||
| 30.1 Low risk of bias | 4 | 632 | Std. Mean Difference (IV, Random, 95% CI) | 0.49 [‐0.09, 1.06] |
| 30.2 Unclear/high risk of bias | 5 | 231 | Std. Mean Difference (IV, Random, 95% CI) | 1.16 [0.60, 1.72] |
| 31 Overall self‐reported physical activity (follow‐up values) Show forest plot | 17 | Std. Mean Difference (IV, Random, 95% CI) | Subtotals only | |
| Analysis 18.31 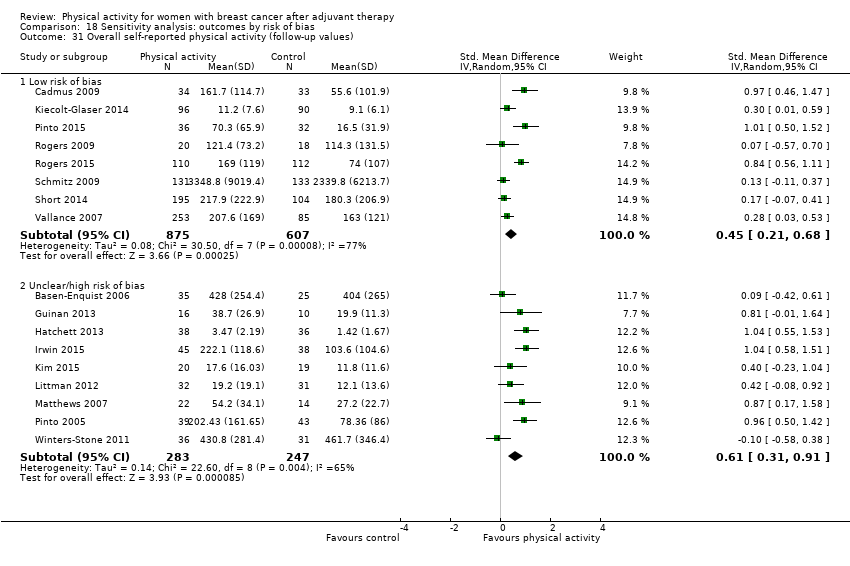 Comparison 18 Sensitivity analysis: outcomes by risk of bias, Outcome 31 Overall self‐reported physical activity (follow‐up values). | ||||
| 31.1 Low risk of bias | 8 | 1482 | Std. Mean Difference (IV, Random, 95% CI) | 0.45 [0.21, 0.68] |
| 31.2 Unclear/high risk of bias | 9 | 530 | Std. Mean Difference (IV, Random, 95% CI) | 0.61 [0.31, 0.91] |
| 32 Overall self‐reported physical activity (change values) Show forest plot | 8 | Std. Mean Difference (IV, Random, 95% CI) | Subtotals only | |
| Analysis 18.32 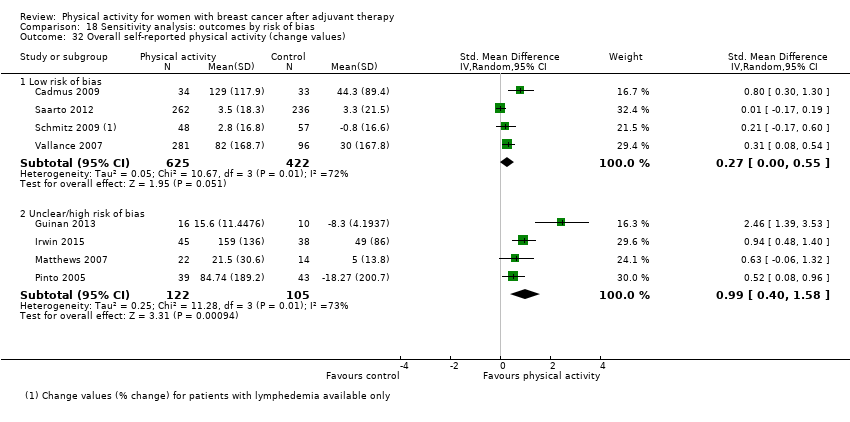 Comparison 18 Sensitivity analysis: outcomes by risk of bias, Outcome 32 Overall self‐reported physical activity (change values). | ||||
| 32.1 Low risk of bias | 4 | 1047 | Std. Mean Difference (IV, Random, 95% CI) | 0.27 [‐0.00, 0.55] |
| 32.2 Unclear/high risk of bias | 4 | 227 | Std. Mean Difference (IV, Random, 95% CI) | 0.99 [0.40, 1.58] |
| 33 Overall objective physical activity (follow‐up values) Show forest plot | 11 | Std. Mean Difference (IV, Random, 95% CI) | Subtotals only | |
| Analysis 18.33  Comparison 18 Sensitivity analysis: outcomes by risk of bias, Outcome 33 Overall objective physical activity (follow‐up values). | ||||
| 33.1 Low risk of bias | 7 | 1105 | Std. Mean Difference (IV, Random, 95% CI) | 0.41 [0.15, 0.66] |
| 33.2 Unclear/high risk of bias | 4 | 165 | Std. Mean Difference (IV, Random, 95% CI) | 0.50 [‐0.24, 1.25] |
| 34 Overall objective physical activity (change values) Show forest plot | 5 | Std. Mean Difference (IV, Random, 95% CI) | Subtotals only | |
| Analysis 18.34 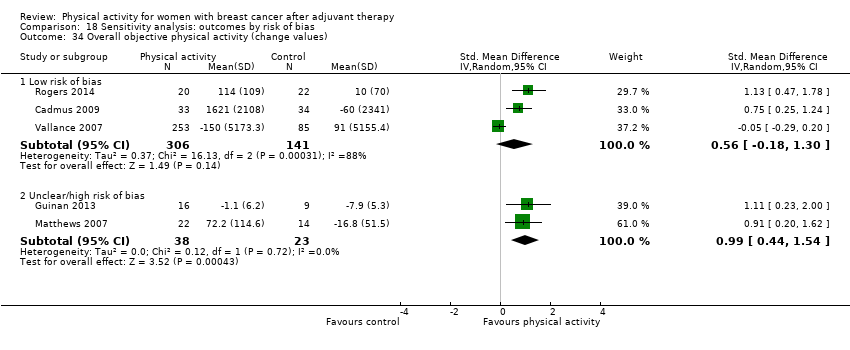 Comparison 18 Sensitivity analysis: outcomes by risk of bias, Outcome 34 Overall objective physical activity (change values). | ||||
| 34.1 Low risk of bias | 3 | 447 | Std. Mean Difference (IV, Random, 95% CI) | 0.56 [‐0.18, 1.30] |
| 34.2 Unclear/high risk of bias | 2 | 61 | Std. Mean Difference (IV, Random, 95% CI) | 0.99 [0.44, 1.54] |
| 35 Mass (follow‐up values) Show forest plot | 16 | Mean Difference (IV, Fixed, 95% CI) | Subtotals only | |
| Analysis 18.35  Comparison 18 Sensitivity analysis: outcomes by risk of bias, Outcome 35 Mass (follow‐up values). | ||||
| 35.1 Low risk of bias | 8 | 828 | Mean Difference (IV, Fixed, 95% CI) | 0.05 [‐0.54, 0.64] |
| 35.2 Unclear/high risk of bias | 8 | 382 | Mean Difference (IV, Fixed, 95% CI) | ‐1.28 [‐4.26, 1.70] |
| 36 Mass (change values) Show forest plot | 11 | Mean Difference (IV, Random, 95% CI) | Subtotals only | |
| Analysis 18.36  Comparison 18 Sensitivity analysis: outcomes by risk of bias, Outcome 36 Mass (change values). | ||||
| 36.1 Low risk of bias | 5 | 819 | Mean Difference (IV, Random, 95% CI) | ‐0.43 [‐1.05, 0.20] |
| 36.2 Unclear/high risk of bias | 6 | 228 | Mean Difference (IV, Random, 95% CI) | ‐0.62 [‐1.44, 0.19] |
| 37 BMI (follow‐up values) Show forest plot | 17 | Mean Difference (IV, Fixed, 95% CI) | Subtotals only | |
| Analysis 18.37  Comparison 18 Sensitivity analysis: outcomes by risk of bias, Outcome 37 BMI (follow‐up values). | ||||
| 37.1 Low risk of bias | 10 | 1162 | Mean Difference (IV, Fixed, 95% CI) | 0.05 [‐0.16, 0.26] |
| 37.2 Unclear/high risk of bias | 7 | 319 | Mean Difference (IV, Fixed, 95% CI) | ‐1.07 [‐2.29, 0.14] |
| 38 BMI (change values) Show forest plot | 8 | Mean Difference (IV, Random, 95% CI) | Subtotals only | |
| Analysis 18.38  Comparison 18 Sensitivity analysis: outcomes by risk of bias, Outcome 38 BMI (change values). | ||||
| 38.1 Low risk of bias | 5 | 363 | Mean Difference (IV, Random, 95% CI) | ‐0.24 [‐0.56, 0.08] |
| 38.2 Unclear/high risk of bias | 3 | 122 | Mean Difference (IV, Random, 95% CI) | ‐0.20 [‐0.65, 0.25] |
| 39 Overall body fat (follow‐up values) Show forest plot | 18 | Std. Mean Difference (IV, Random, 95% CI) | Subtotals only | |
| Analysis 18.39  Comparison 18 Sensitivity analysis: outcomes by risk of bias, Outcome 39 Overall body fat (follow‐up values). | ||||
| 39.1 Low risk of bias | 10 | 768 | Std. Mean Difference (IV, Random, 95% CI) | ‐0.19 [‐0.41, 0.03] |
| 39.2 Unclear/high risk of bias | 8 | 394 | Std. Mean Difference (IV, Random, 95% CI) | ‐0.17 [‐0.40, 0.07] |
| 40 Overall body fat (change values) Show forest plot | 9 | Std. Mean Difference (IV, Random, 95% CI) | Subtotals only | |
| Analysis 18.40  Comparison 18 Sensitivity analysis: outcomes by risk of bias, Outcome 40 Overall body fat (change values). | ||||
| 40.1 Low risk of bias | 5 | 341 | Std. Mean Difference (IV, Random, 95% CI) | ‐0.87 [‐1.86, 0.12] |
| 40.2 Unclear/high risk of bias | 4 | 158 | Std. Mean Difference (IV, Random, 95% CI) | ‐0.30 [‐0.62, 0.01] |
| 41 Lower body strength (follow‐up values) Show forest plot | 10 | Std. Mean Difference (IV, Random, 95% CI) | Subtotals only | |
| Analysis 18.41 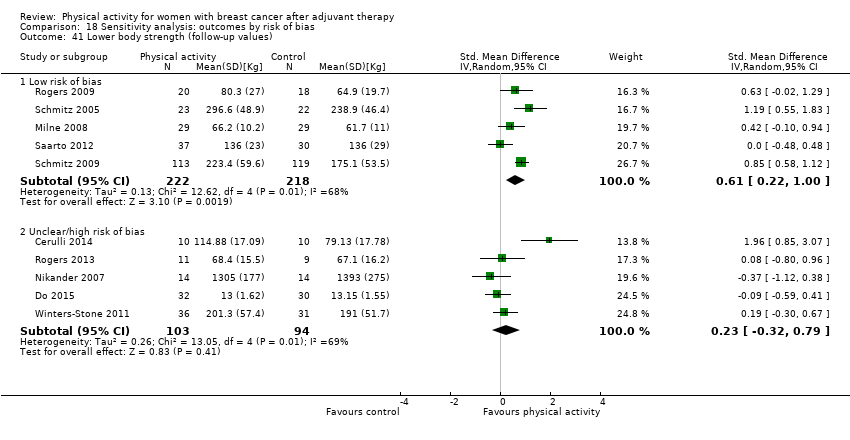 Comparison 18 Sensitivity analysis: outcomes by risk of bias, Outcome 41 Lower body strength (follow‐up values). | ||||
| 41.1 Low risk of bias | 5 | 440 | Std. Mean Difference (IV, Random, 95% CI) | 0.61 [0.22, 1.00] |
| 41.2 Unclear/high risk of bias | 5 | 197 | Std. Mean Difference (IV, Random, 95% CI) | 0.23 [‐0.32, 0.79] |
| 42 Lower body strength (change values) Show forest plot | 8 | Std. Mean Difference (IV, Random, 95% CI) | Subtotals only | |
| Analysis 18.42 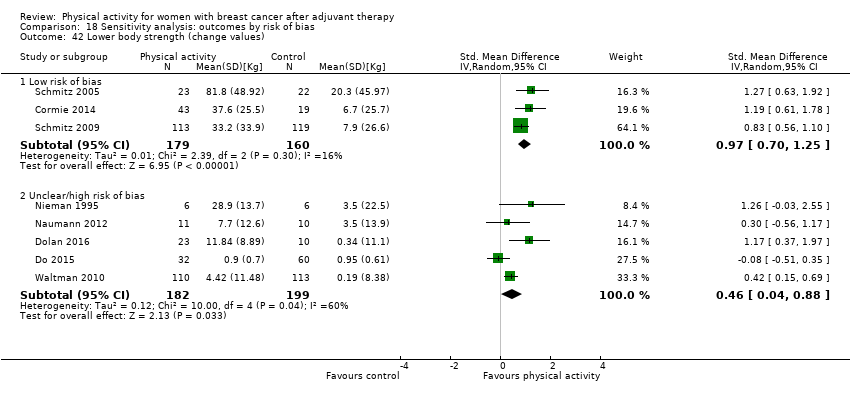 Comparison 18 Sensitivity analysis: outcomes by risk of bias, Outcome 42 Lower body strength (change values). | ||||
| 42.1 Low risk of bias | 3 | 339 | Std. Mean Difference (IV, Random, 95% CI) | 0.97 [0.70, 1.25] |
| 42.2 Unclear/high risk of bias | 5 | 381 | Std. Mean Difference (IV, Random, 95% CI) | 0.46 [0.04, 0.88] |
| 43 Upper body strength (follow‐up values) Show forest plot | 13 | Std. Mean Difference (IV, Random, 95% CI) | Subtotals only | |
| Analysis 18.43 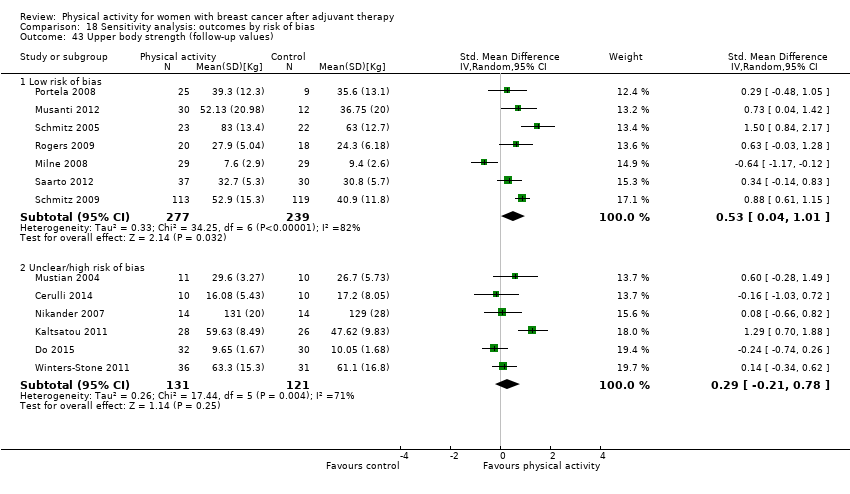 Comparison 18 Sensitivity analysis: outcomes by risk of bias, Outcome 43 Upper body strength (follow‐up values). | ||||
| 43.1 Low risk of bias | 7 | 516 | Std. Mean Difference (IV, Random, 95% CI) | 0.53 [0.04, 1.01] |
| 43.2 Unclear/high risk of bias | 6 | 252 | Std. Mean Difference (IV, Random, 95% CI) | 0.29 [‐0.21, 0.78] |
| 44 Upper body strength (change values) Show forest plot | 9 | Std. Mean Difference (IV, Random, 95% CI) | Subtotals only | |
| Analysis 18.44 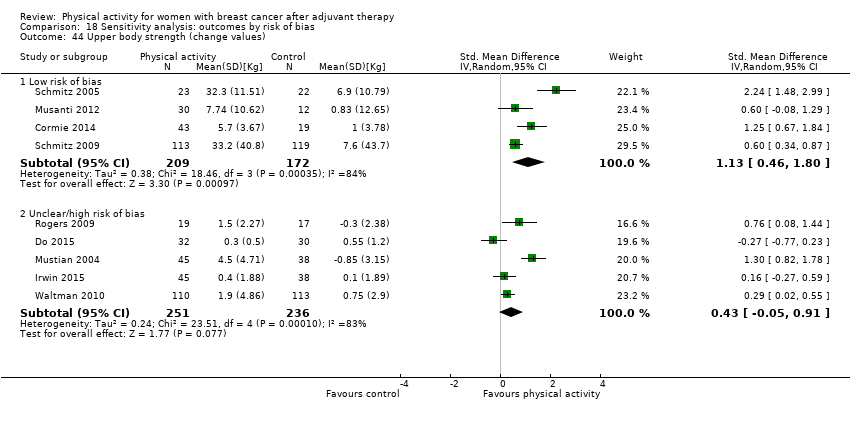 Comparison 18 Sensitivity analysis: outcomes by risk of bias, Outcome 44 Upper body strength (change values). | ||||
| 44.1 Low risk of bias | 4 | 381 | Std. Mean Difference (IV, Random, 95% CI) | 1.13 [0.46, 1.80] |
| 44.2 Unclear/high risk of bias | 5 | 487 | Std. Mean Difference (IV, Random, 95% CI) | 0.43 [‐0.05, 0.91] |
| 45 Bone mineral density ‐ femoral neck (follow‐up and change values) Show forest plot | 4 | Std. Mean Difference (IV, Random, 95% CI) | Subtotals only | |
| Analysis 18.45  Comparison 18 Sensitivity analysis: outcomes by risk of bias, Outcome 45 Bone mineral density ‐ femoral neck (follow‐up and change values). | ||||
| 45.1 Low risk of bias | 1 | 457 | Std. Mean Difference (IV, Random, 95% CI) | 0.18 [‐0.00, 0.37] |
| 45.2 Unclear/high risk of bias | 3 | 329 | Std. Mean Difference (IV, Random, 95% CI) | 0.18 [‐0.39, 0.75] |
| 46 Bone mineral density ‐ lumbar spine (follow‐up and change values) Show forest plot | 4 | Std. Mean Difference (IV, Random, 95% CI) | Subtotals only | |
| Analysis 18.46 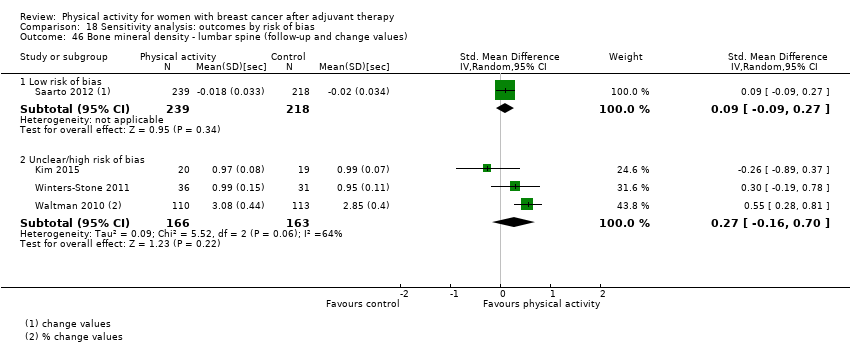 Comparison 18 Sensitivity analysis: outcomes by risk of bias, Outcome 46 Bone mineral density ‐ lumbar spine (follow‐up and change values). | ||||
| 46.1 Low risk of bias | 1 | 457 | Std. Mean Difference (IV, Random, 95% CI) | 0.09 [‐0.09, 0.27] |
| 46.2 Unclear/high risk of bias | 3 | 329 | Std. Mean Difference (IV, Random, 95% CI) | 0.27 [‐0.16, 0.70] |

Study flow diagram.
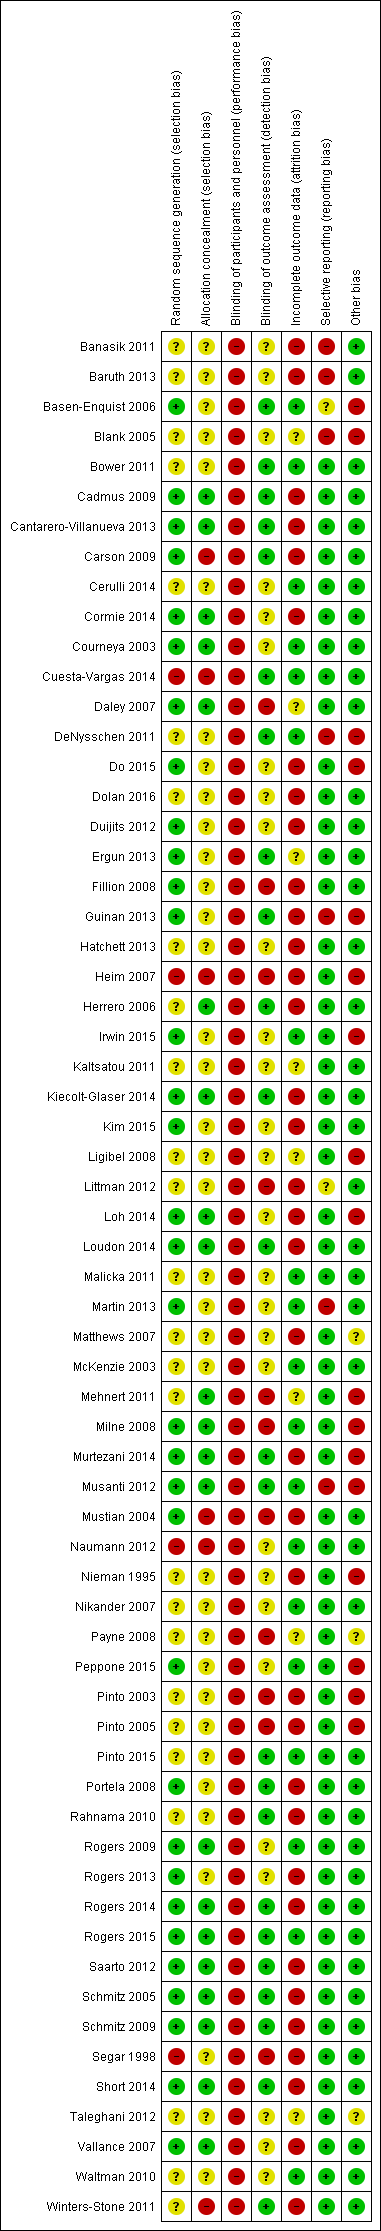
Risk of bias summary: review authors' judgements about each risk of bias item for each included study.
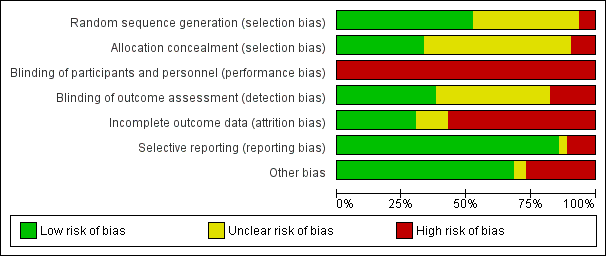
Risk of bias graph: review authors' judgements about each risk of bias item presented as percentages across all included studies.

Forest plot of comparison: 1 Comparison: HRQoL outcomes, all physical activity vs control, outcome: 1.1 Overall HRQoL (follow‐up values).

Forest plot of comparison: 1 Comparison: HRQoL outcomes, all physical activity vs control, outcome: 1.2 Overall HRQoL (change values).
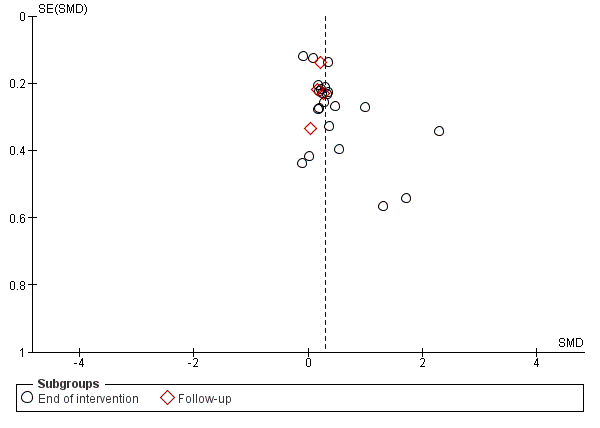
Funnel plot of comparison: 1 Comparison: HRQoL outcomes, all physical activity vs control, outcome: 1.1 Overall HRQoL (follow‐up values).

Comparison 1 Comparison: HRQoL outcomes, all physical activity vs control, Outcome 1 Overall HRQoL (follow‐up values).
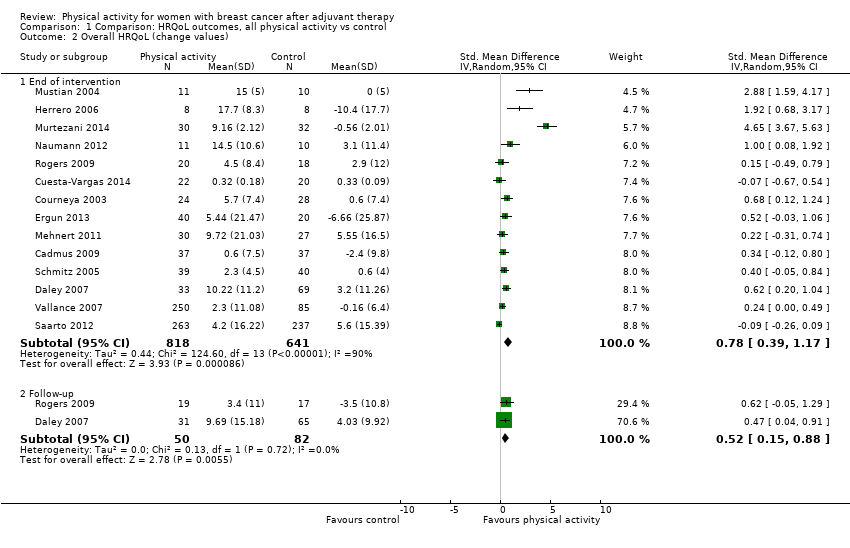
Comparison 1 Comparison: HRQoL outcomes, all physical activity vs control, Outcome 2 Overall HRQoL (change values).

Comparison 1 Comparison: HRQoL outcomes, all physical activity vs control, Outcome 3 FACT‐G (follow‐up values).
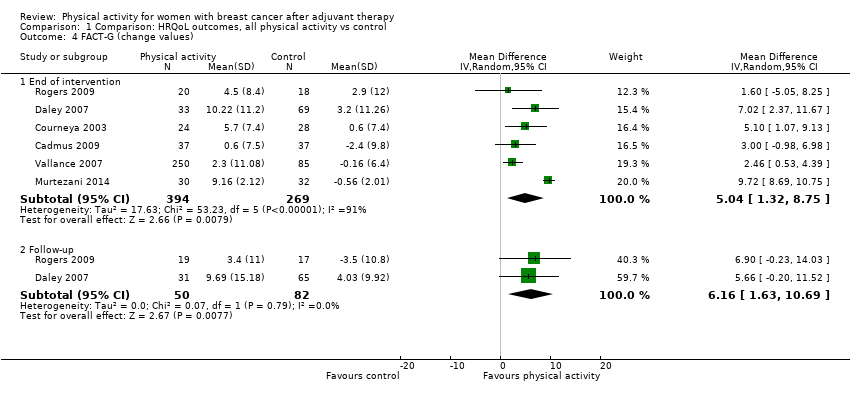
Comparison 1 Comparison: HRQoL outcomes, all physical activity vs control, Outcome 4 FACT‐G (change values).

Comparison 1 Comparison: HRQoL outcomes, all physical activity vs control, Outcome 5 FACT‐B (follow‐up values).
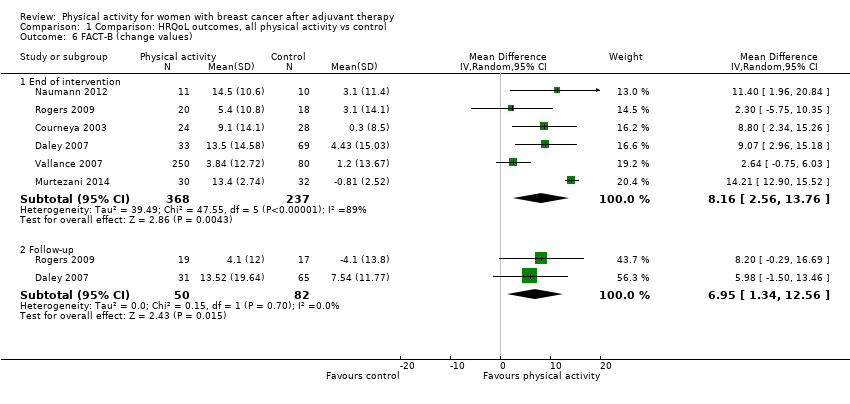
Comparison 1 Comparison: HRQoL outcomes, all physical activity vs control, Outcome 6 FACT‐B (change values).

Comparison 1 Comparison: HRQoL outcomes, all physical activity vs control, Outcome 7 FACT Breast Cancer Subscale (follow‐up values).
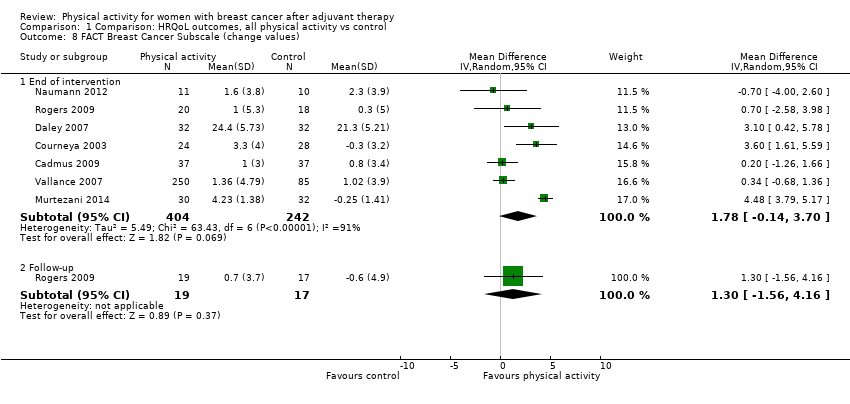
Comparison 1 Comparison: HRQoL outcomes, all physical activity vs control, Outcome 8 FACT Breast Cancer Subscale (change values).
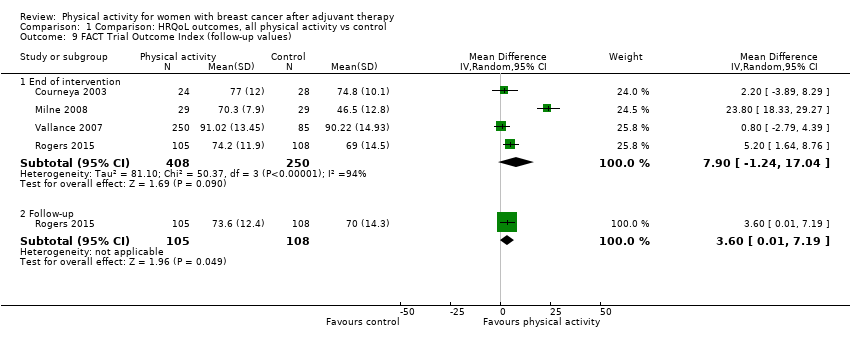
Comparison 1 Comparison: HRQoL outcomes, all physical activity vs control, Outcome 9 FACT Trial Outcome Index (follow‐up values).

Comparison 1 Comparison: HRQoL outcomes, all physical activity vs control, Outcome 10 EORTC QLQ‐C30 Global Health (follow‐up values).

Comparison 1 Comparison: HRQoL outcomes, all physical activity vs control, Outcome 11 EORTC QLQ‐C30 Global Health (change values).
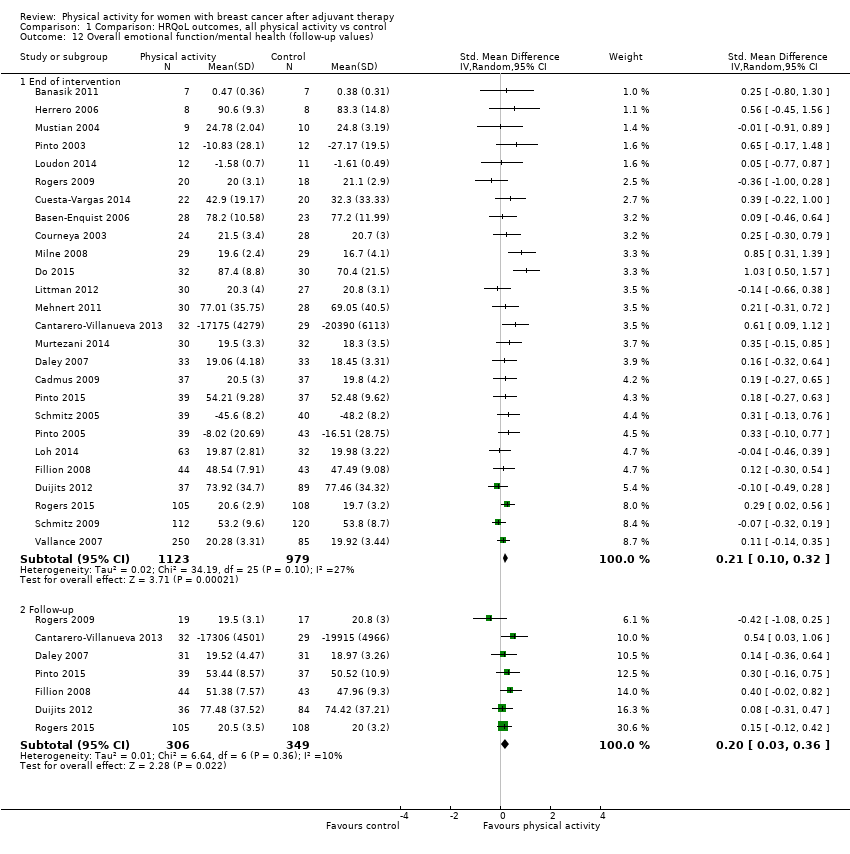
Comparison 1 Comparison: HRQoL outcomes, all physical activity vs control, Outcome 12 Overall emotional function/mental health (follow‐up values).

Comparison 1 Comparison: HRQoL outcomes, all physical activity vs control, Outcome 13 Overall emotional function/mental health (change values).

Comparison 1 Comparison: HRQoL outcomes, all physical activity vs control, Outcome 14 FACT Emotional well‐being (follow‐up values).

Comparison 1 Comparison: HRQoL outcomes, all physical activity vs control, Outcome 15 FACT Emotional well‐being (change values).
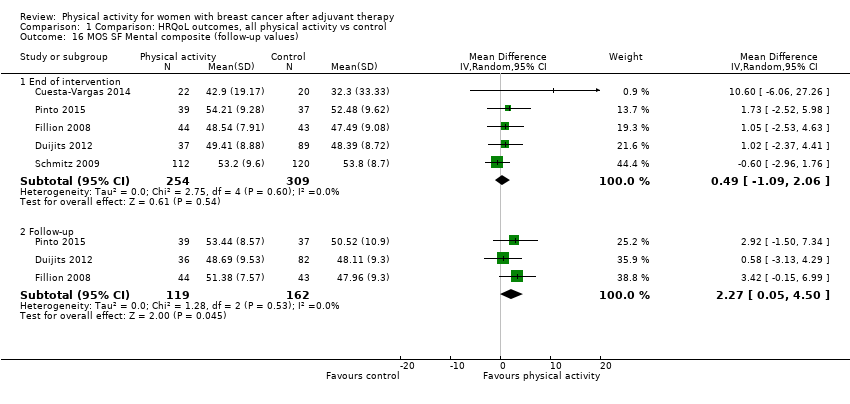
Comparison 1 Comparison: HRQoL outcomes, all physical activity vs control, Outcome 16 MOS SF Mental composite (follow‐up values).

Comparison 1 Comparison: HRQoL outcomes, all physical activity vs control, Outcome 17 MOS SF Mental composite (change values).

Comparison 1 Comparison: HRQoL outcomes, all physical activity vs control, Outcome 18 MOS SF Mental health (follow‐up values).

Comparison 1 Comparison: HRQoL outcomes, all physical activity vs control, Outcome 19 MOS SF Mental health (change values).

Comparison 1 Comparison: HRQoL outcomes, all physical activity vs control, Outcome 20 MOS SF Emotional role (follow‐up values).

Comparison 1 Comparison: HRQoL outcomes, all physical activity vs control, Outcome 21 MOS SF Emotional role (change values).

Comparison 1 Comparison: HRQoL outcomes, all physical activity vs control, Outcome 22 EORTC QLQ‐C30 Emotional function (follow‐up values).

Comparison 1 Comparison: HRQoL outcomes, all physical activity vs control, Outcome 23 EORTC QLQ‐C30 Emotional function (change values).
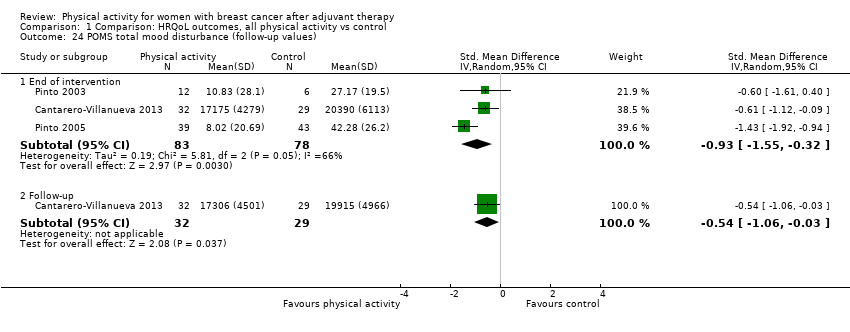
Comparison 1 Comparison: HRQoL outcomes, all physical activity vs control, Outcome 24 POMS total mood disturbance (follow‐up values).
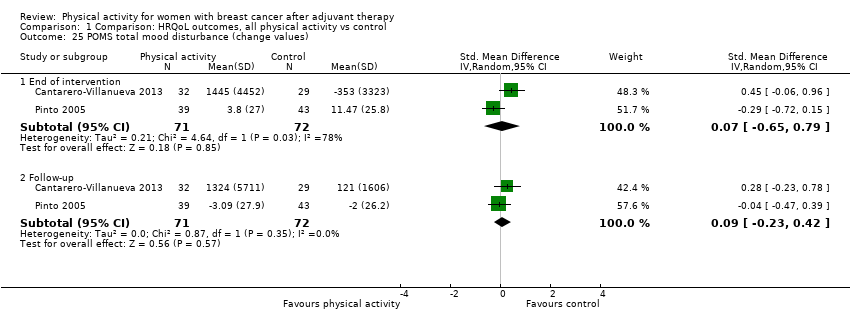
Comparison 1 Comparison: HRQoL outcomes, all physical activity vs control, Outcome 25 POMS total mood disturbance (change values).

Comparison 1 Comparison: HRQoL outcomes, all physical activity vs control, Outcome 26 POMS anger subscale (follow‐up values).
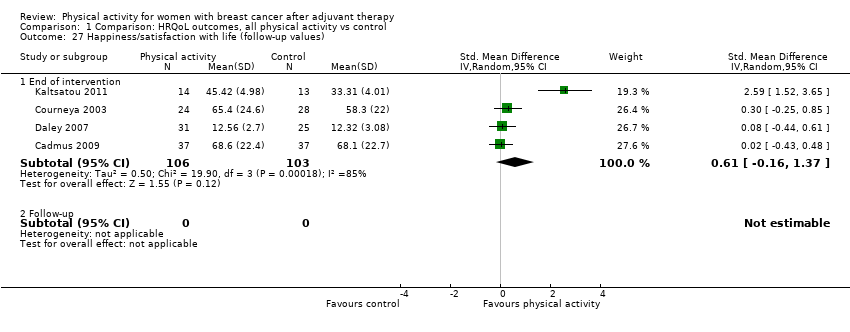
Comparison 1 Comparison: HRQoL outcomes, all physical activity vs control, Outcome 27 Happiness/satisfaction with life (follow‐up values).

Comparison 1 Comparison: HRQoL outcomes, all physical activity vs control, Outcome 28 Happiness/satisfaction with life (change values).
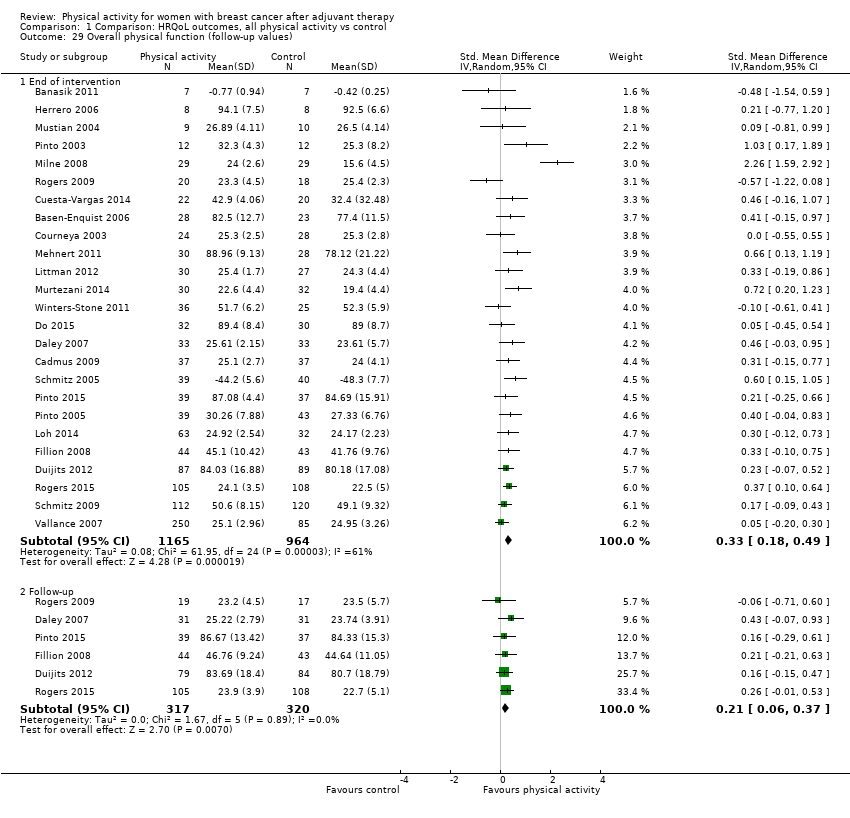
Comparison 1 Comparison: HRQoL outcomes, all physical activity vs control, Outcome 29 Overall physical function (follow‐up values).
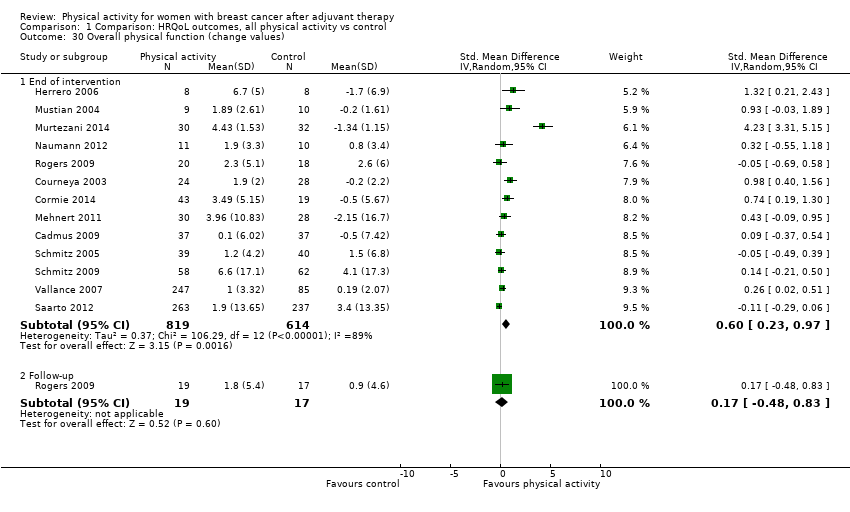
Comparison 1 Comparison: HRQoL outcomes, all physical activity vs control, Outcome 30 Overall physical function (change values).

Comparison 1 Comparison: HRQoL outcomes, all physical activity vs control, Outcome 31 FACT Physical well‐being (follow‐up values).

Comparison 1 Comparison: HRQoL outcomes, all physical activity vs control, Outcome 32 FACT Physical well‐being (change values).
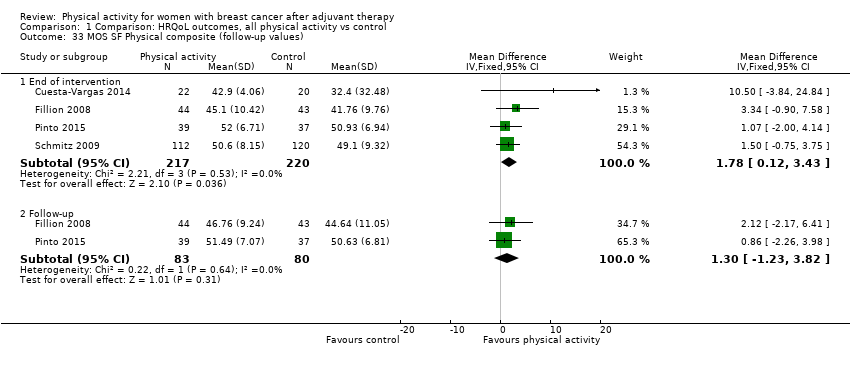
Comparison 1 Comparison: HRQoL outcomes, all physical activity vs control, Outcome 33 MOS SF Physical composite (follow‐up values).

Comparison 1 Comparison: HRQoL outcomes, all physical activity vs control, Outcome 34 MOS SF Physical composite (change values).
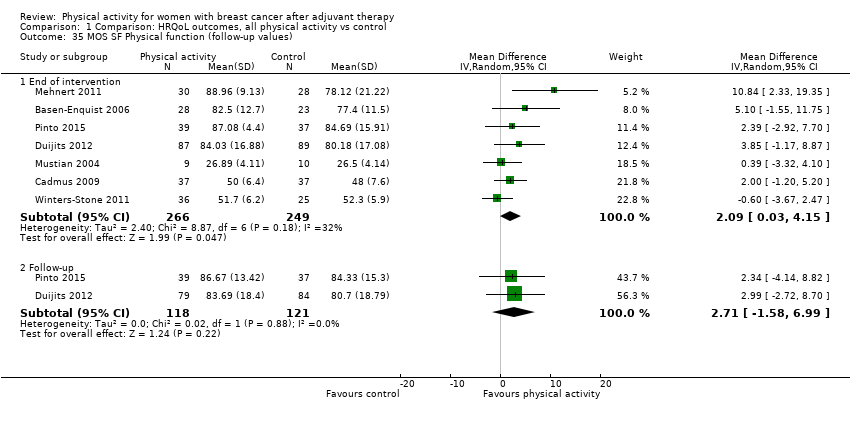
Comparison 1 Comparison: HRQoL outcomes, all physical activity vs control, Outcome 35 MOS SF Physical function (follow‐up values).

Comparison 1 Comparison: HRQoL outcomes, all physical activity vs control, Outcome 36 MOS SF Physical function (change values).
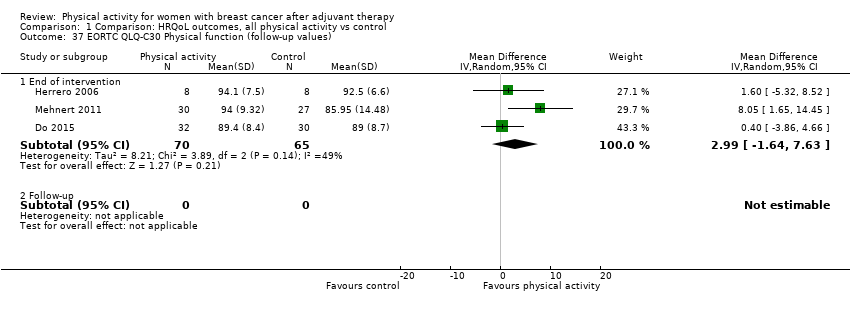
Comparison 1 Comparison: HRQoL outcomes, all physical activity vs control, Outcome 37 EORTC QLQ‐C30 Physical function (follow‐up values).
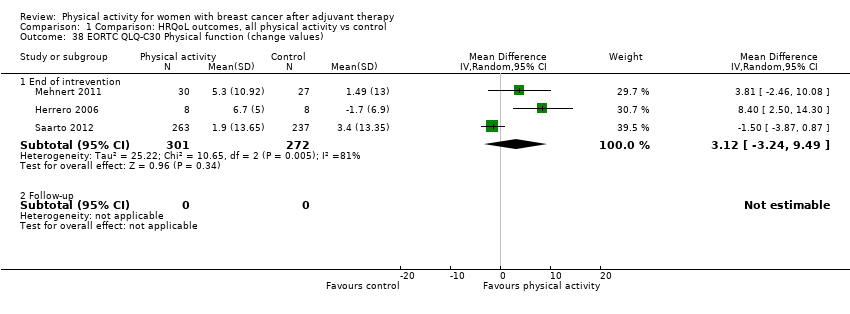
Comparison 1 Comparison: HRQoL outcomes, all physical activity vs control, Outcome 38 EORTC QLQ‐C30 Physical function (change values).

Comparison 1 Comparison: HRQoL outcomes, all physical activity vs control, Outcome 39 Body Esteem Scale ‐ Physical condition (follow‐up values).
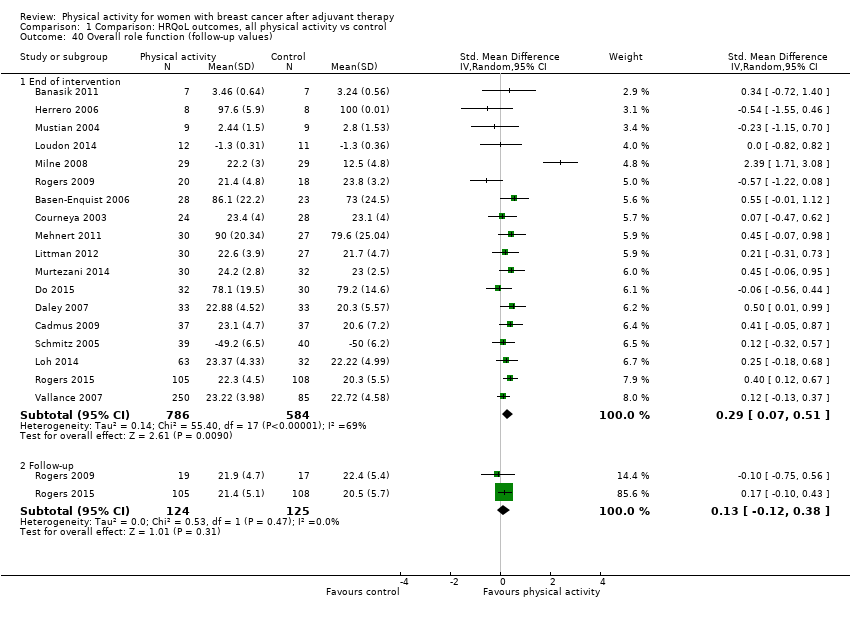
Comparison 1 Comparison: HRQoL outcomes, all physical activity vs control, Outcome 40 Overall role function (follow‐up values).

Comparison 1 Comparison: HRQoL outcomes, all physical activity vs control, Outcome 41 Overall role function (change values).

Comparison 1 Comparison: HRQoL outcomes, all physical activity vs control, Outcome 42 FACT Functional well‐being (follow‐up values).

Comparison 1 Comparison: HRQoL outcomes, all physical activity vs control, Outcome 43 FACT Functional well‐being (change values).
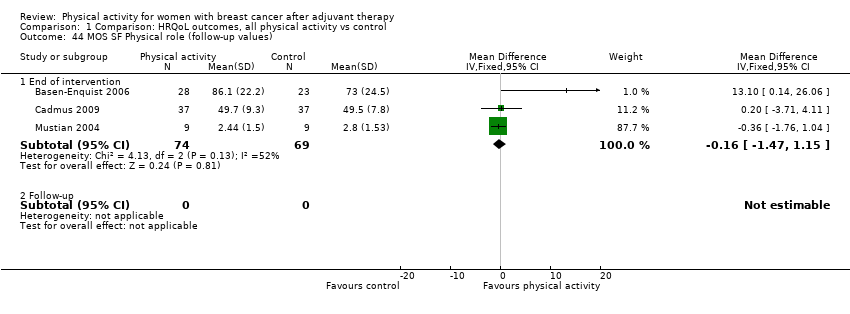
Comparison 1 Comparison: HRQoL outcomes, all physical activity vs control, Outcome 44 MOS SF Physical role (follow‐up values).
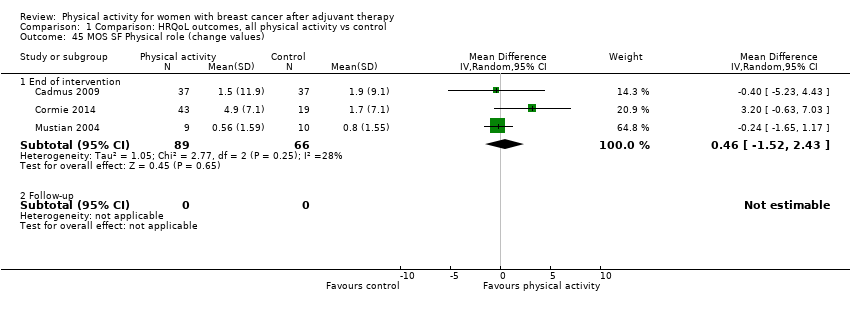
Comparison 1 Comparison: HRQoL outcomes, all physical activity vs control, Outcome 45 MOS SF Physical role (change values).

Comparison 1 Comparison: HRQoL outcomes, all physical activity vs control, Outcome 46 EORTC QLQ‐C30 Role function (follow‐up values).
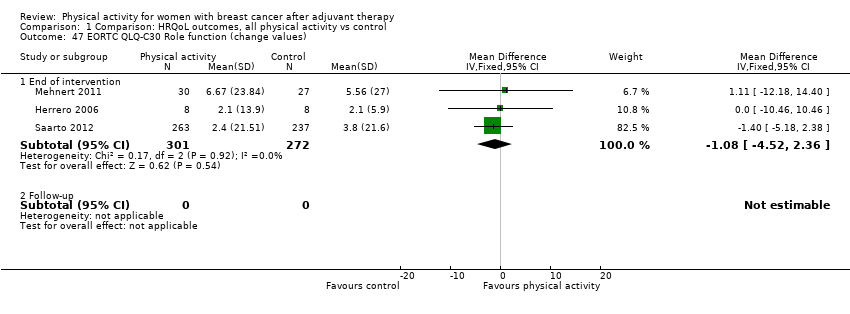
Comparison 1 Comparison: HRQoL outcomes, all physical activity vs control, Outcome 47 EORTC QLQ‐C30 Role function (change values).

Comparison 1 Comparison: HRQoL outcomes, all physical activity vs control, Outcome 48 Overall social well‐being/function (follow‐up values).

Comparison 1 Comparison: HRQoL outcomes, all physical activity vs control, Outcome 49 Overall social well‐being/function (change values).

Comparison 1 Comparison: HRQoL outcomes, all physical activity vs control, Outcome 50 FACT Social well‐being (follow‐up values).

Comparison 1 Comparison: HRQoL outcomes, all physical activity vs control, Outcome 51 FACT Social well‐being (change values).

Comparison 1 Comparison: HRQoL outcomes, all physical activity vs control, Outcome 52 MOS SF Social functioning (follow‐up values).

Comparison 1 Comparison: HRQoL outcomes, all physical activity vs control, Outcome 53 MOS SF Social functioning (change values).

Comparison 1 Comparison: HRQoL outcomes, all physical activity vs control, Outcome 54 EORTC QLQ‐C30 Social function (follow‐up values).

Comparison 1 Comparison: HRQoL outcomes, all physical activity vs control, Outcome 55 EORTC QLQ‐C30 Social function (change values).
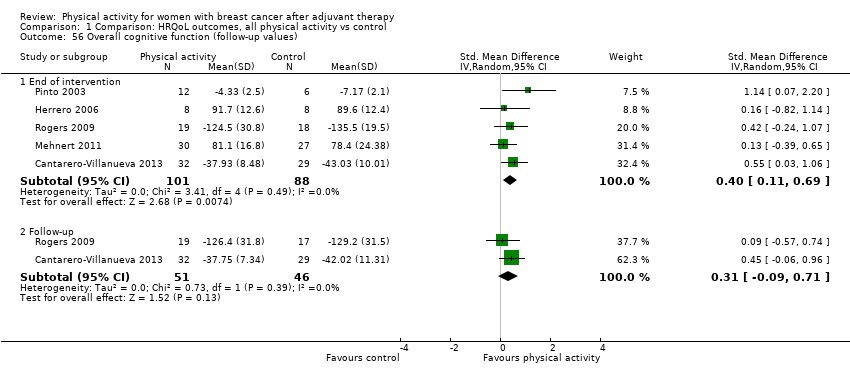
Comparison 1 Comparison: HRQoL outcomes, all physical activity vs control, Outcome 56 Overall cognitive function (follow‐up values).

Comparison 1 Comparison: HRQoL outcomes, all physical activity vs control, Outcome 57 Overall cognitive function (change values).

Comparison 1 Comparison: HRQoL outcomes, all physical activity vs control, Outcome 58 EORTC QLQ‐C30 Cognitive function (follow‐up values).

Comparison 1 Comparison: HRQoL outcomes, all physical activity vs control, Outcome 59 EORTC QLQ‐C30 Cognitive function (change values).
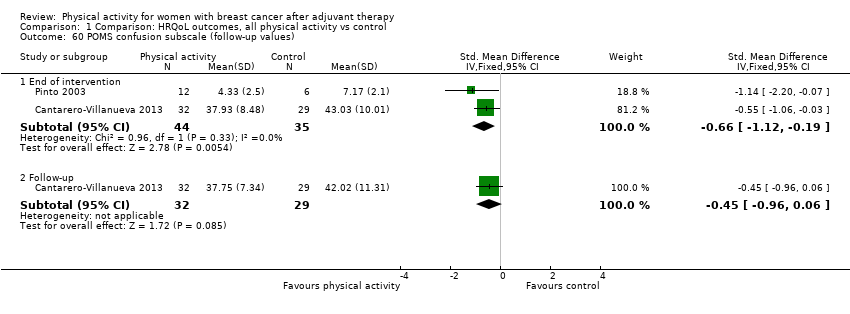
Comparison 1 Comparison: HRQoL outcomes, all physical activity vs control, Outcome 60 POMS confusion subscale (follow‐up values).

Comparison 1 Comparison: HRQoL outcomes, all physical activity vs control, Outcome 61 Overall general health (follow‐up values).

Comparison 1 Comparison: HRQoL outcomes, all physical activity vs control, Outcome 62 Overall general health (change values).

Comparison 1 Comparison: HRQoL outcomes, all physical activity vs control, Outcome 63 MOS SF General health (follow‐up values).

Comparison 1 Comparison: HRQoL outcomes, all physical activity vs control, Outcome 64 MOS SF General health (change values).

Comparison 1 Comparison: HRQoL outcomes, all physical activity vs control, Outcome 65 Overall sexual function (follow‐up values).
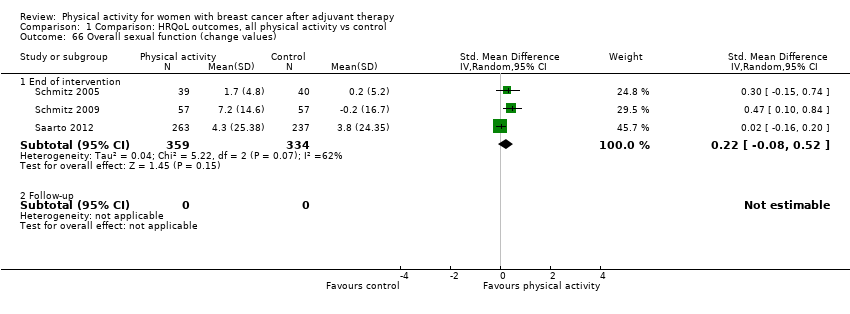
Comparison 1 Comparison: HRQoL outcomes, all physical activity vs control, Outcome 66 Overall sexual function (change values).

Comparison 1 Comparison: HRQoL outcomes, all physical activity vs control, Outcome 67 Body Esteem Scale ‐ sexual attractiveness (follow‐up values).

Comparison 1 Comparison: HRQoL outcomes, all physical activity vs control, Outcome 68 Overall sleep (follow‐up values).
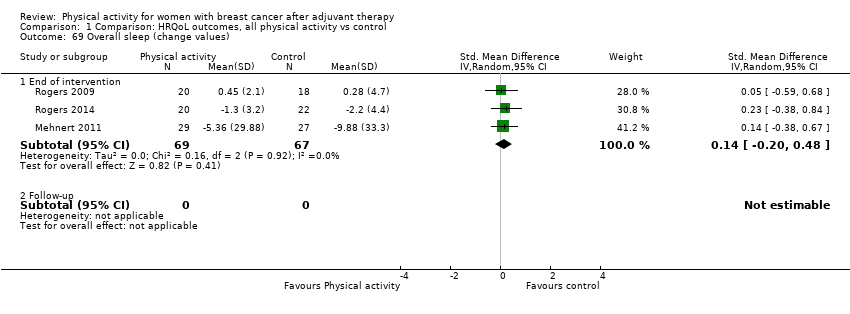
Comparison 1 Comparison: HRQoL outcomes, all physical activity vs control, Outcome 69 Overall sleep (change values).

Comparison 1 Comparison: HRQoL outcomes, all physical activity vs control, Outcome 70 PSQI Global sleep score (follow‐up values).
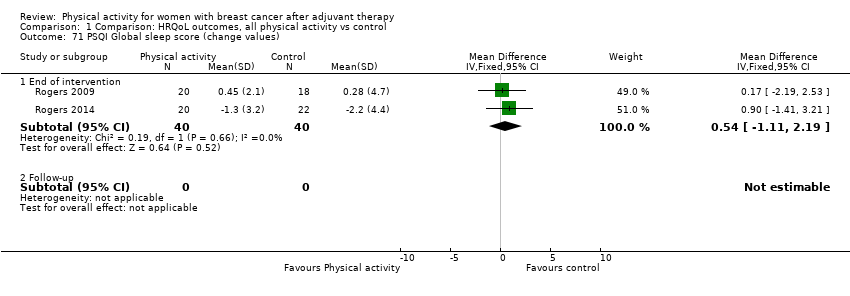
Comparison 1 Comparison: HRQoL outcomes, all physical activity vs control, Outcome 71 PSQI Global sleep score (change values).

Comparison 1 Comparison: HRQoL outcomes, all physical activity vs control, Outcome 72 PSQI sleep quality (follow‐up values).

Comparison 1 Comparison: HRQoL outcomes, all physical activity vs control, Outcome 73 PSQI sleep efficiency (follow‐up values).

Comparison 1 Comparison: HRQoL outcomes, all physical activity vs control, Outcome 74 PSQI sleep latency (follow‐up values).

Comparison 1 Comparison: HRQoL outcomes, all physical activity vs control, Outcome 75 PSQI sleep duration (follow‐up values).
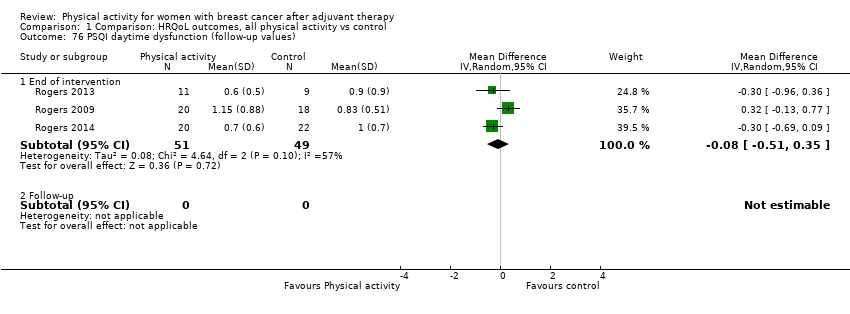
Comparison 1 Comparison: HRQoL outcomes, all physical activity vs control, Outcome 76 PSQI daytime dysfunction (follow‐up values).

Comparison 1 Comparison: HRQoL outcomes, all physical activity vs control, Outcome 77 PSQI medication use (follow‐up values).

Comparison 1 Comparison: HRQoL outcomes, all physical activity vs control, Outcome 78 Accelerator‐derived sleep efficiency (follow‐up values).

Comparison 1 Comparison: HRQoL outcomes, all physical activity vs control, Outcome 79 Accelerator‐derived sleep latency (follow‐up values).

Comparison 2 Comparison: anxiety, all physical activity vs control, Outcome 1 Overall anxiety (follow‐up values).

Comparison 2 Comparison: anxiety, all physical activity vs control, Outcome 2 Overall anxiety (change values).

Comparison 2 Comparison: anxiety, all physical activity vs control, Outcome 3 POMS tension ‐ anxiety (follow‐up values).

Comparison 2 Comparison: anxiety, all physical activity vs control, Outcome 4 State Trait Anxiety Inventory (follow‐up values).

Comparison 2 Comparison: anxiety, all physical activity vs control, Outcome 5 Cohen's Perceived Stress Scale.

Comparison 3 Comparison: depression, all physical activity vs control, Outcome 1 Overall depression (follow‐up values).

Comparison 3 Comparison: depression, all physical activity vs control, Outcome 2 Overall depression (change values).

Comparison 3 Comparison: depression, all physical activity vs control, Outcome 3 Beck Depression Inventory‐II (follow‐up values).

Comparison 3 Comparison: depression, all physical activity vs control, Outcome 4 Beck Depression Inventory‐II (change values).

Comparison 3 Comparison: depression, all physical activity vs control, Outcome 5 CES‐Depression scale (follow‐up values).

Comparison 3 Comparison: depression, all physical activity vs control, Outcome 6 POMS depression subscale (follow‐up values).

Comparison 3 Comparison: depression, all physical activity vs control, Outcome 7 POMS tension subscale (follow‐up values).
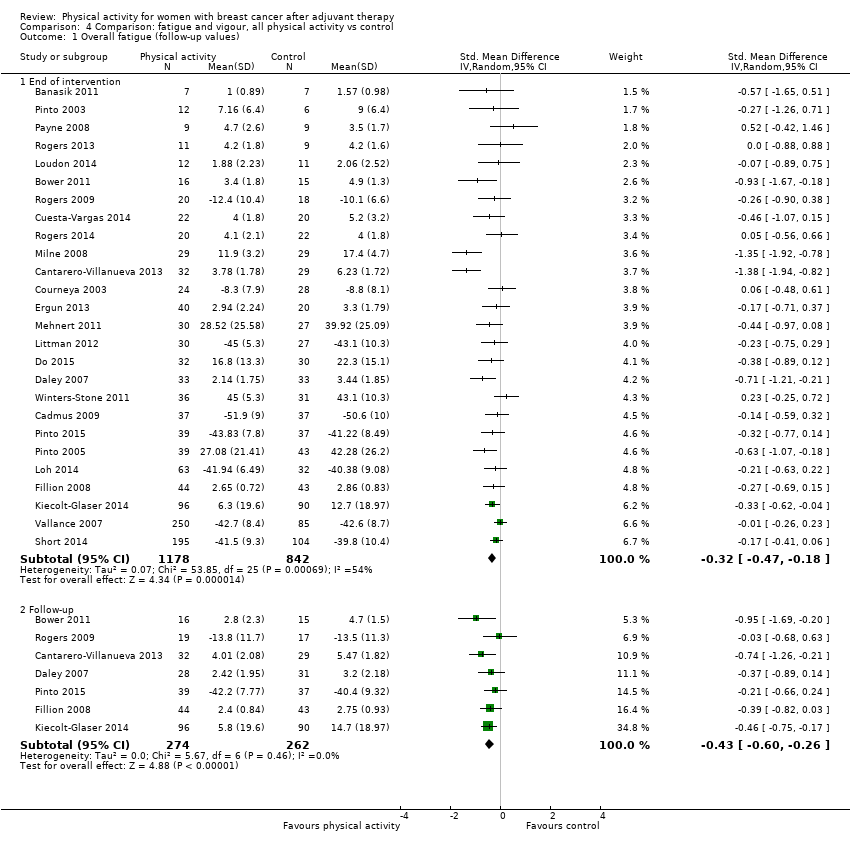
Comparison 4 Comparison: fatigue and vigour, all physical activity vs control, Outcome 1 Overall fatigue (follow‐up values).

Comparison 4 Comparison: fatigue and vigour, all physical activity vs control, Outcome 2 Overall fatigue (change values).
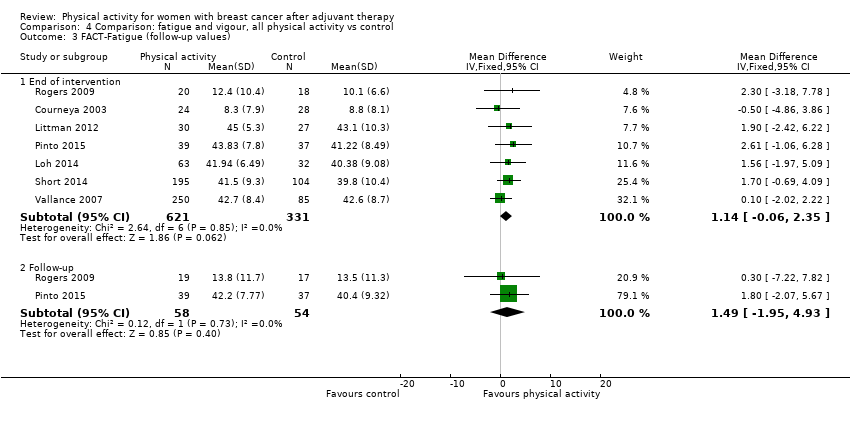
Comparison 4 Comparison: fatigue and vigour, all physical activity vs control, Outcome 3 FACT‐Fatigue (follow‐up values).

Comparison 4 Comparison: fatigue and vigour, all physical activity vs control, Outcome 4 FACT‐Fatigue (change values).

Comparison 4 Comparison: fatigue and vigour, all physical activity vs control, Outcome 5 EORTC QLQ‐C30 Fatigue scale (follow‐up values).

Comparison 4 Comparison: fatigue and vigour, all physical activity vs control, Outcome 6 EORTC QLQ‐C30 Fatigue scale (change values).
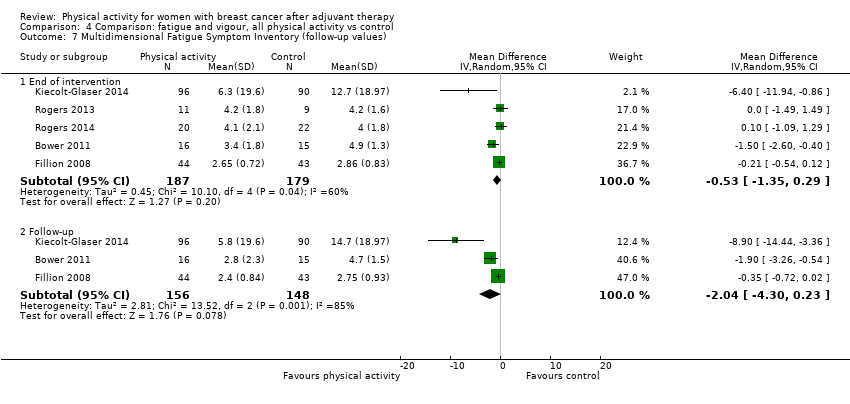
Comparison 4 Comparison: fatigue and vigour, all physical activity vs control, Outcome 7 Multidimensional Fatigue Symptom Inventory (follow‐up values).
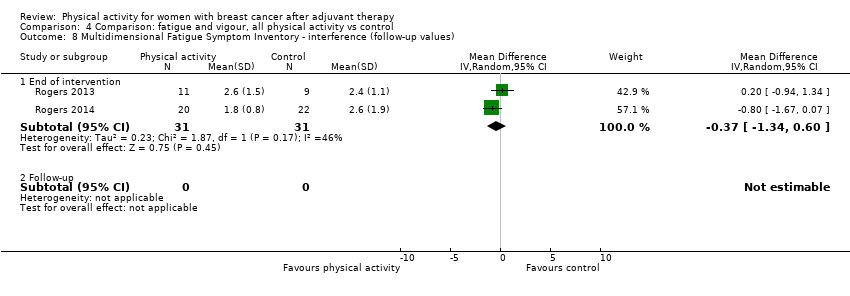
Comparison 4 Comparison: fatigue and vigour, all physical activity vs control, Outcome 8 Multidimensional Fatigue Symptom Inventory ‐ interference (follow‐up values).
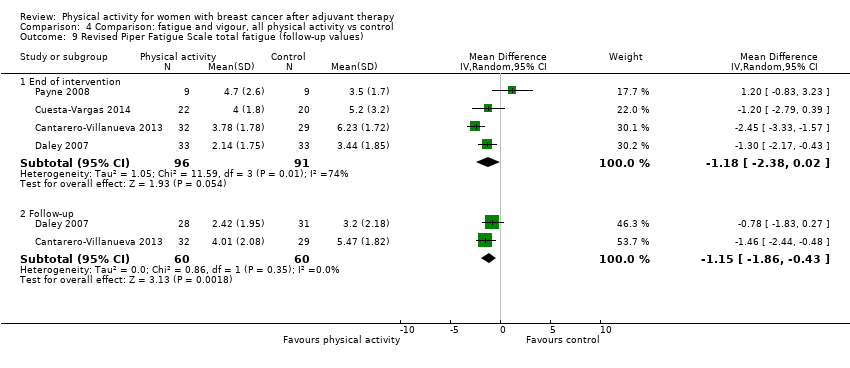
Comparison 4 Comparison: fatigue and vigour, all physical activity vs control, Outcome 9 Revised Piper Fatigue Scale total fatigue (follow‐up values).

Comparison 4 Comparison: fatigue and vigour, all physical activity vs control, Outcome 10 Revised Piper Fatigue Scale total fatigue (change values).

Comparison 4 Comparison: fatigue and vigour, all physical activity vs control, Outcome 11 Revised Piper Fatigue Scale behavioural/severity (follow‐up values).
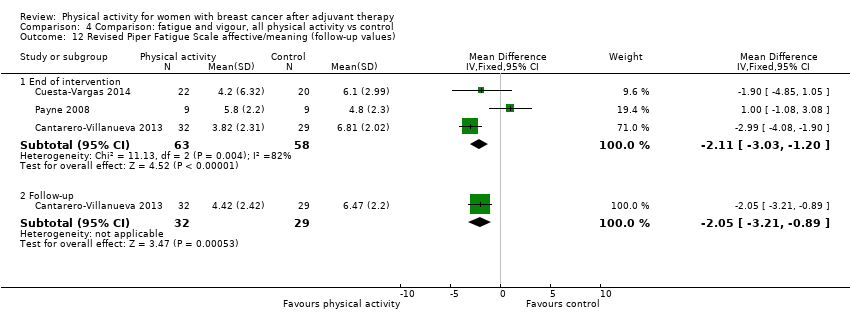
Comparison 4 Comparison: fatigue and vigour, all physical activity vs control, Outcome 12 Revised Piper Fatigue Scale affective/meaning (follow‐up values).
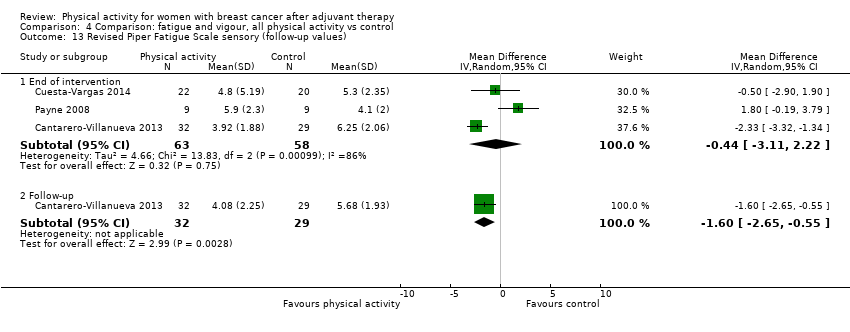
Comparison 4 Comparison: fatigue and vigour, all physical activity vs control, Outcome 13 Revised Piper Fatigue Scale sensory (follow‐up values).
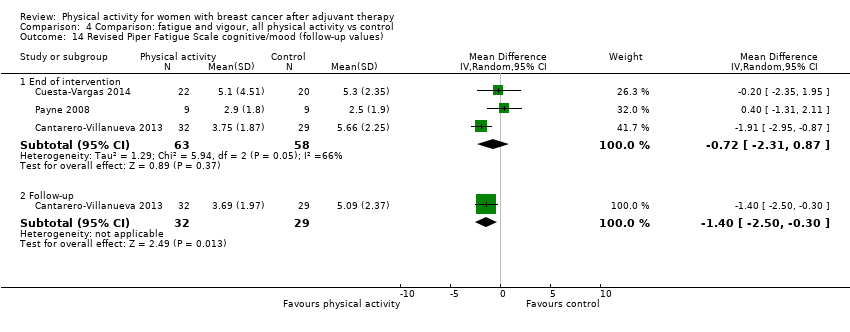
Comparison 4 Comparison: fatigue and vigour, all physical activity vs control, Outcome 14 Revised Piper Fatigue Scale cognitive/mood (follow‐up values).

Comparison 4 Comparison: fatigue and vigour, all physical activity vs control, Outcome 15 Schwartz Cancer Fatigue Scale (follow‐up values).

Comparison 4 Comparison: fatigue and vigour, all physical activity vs control, Outcome 16 POMS fatigue scale (follow‐up values).
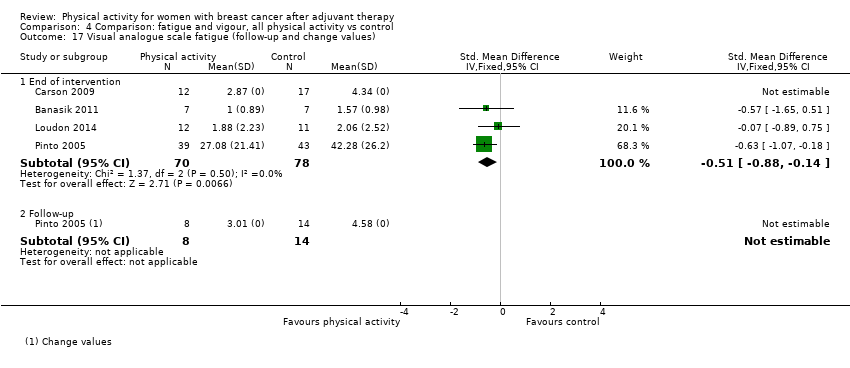
Comparison 4 Comparison: fatigue and vigour, all physical activity vs control, Outcome 17 Visual analogue scale fatigue (follow‐up and change values).
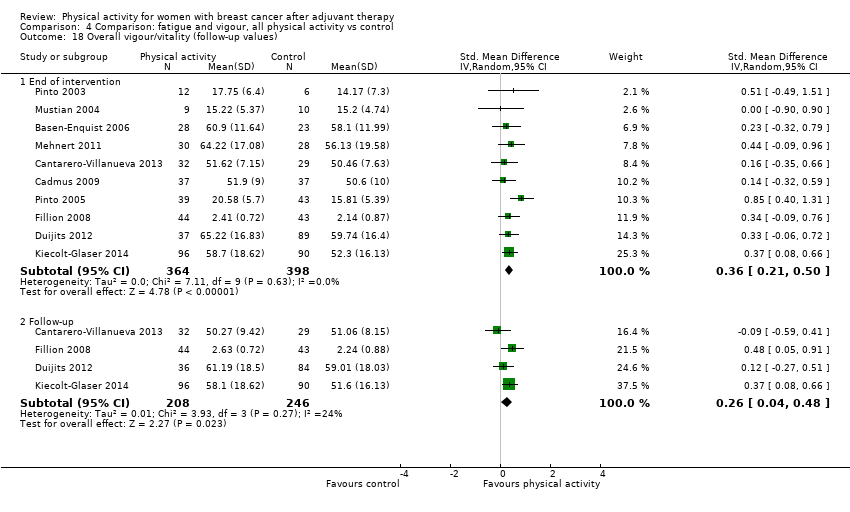
Comparison 4 Comparison: fatigue and vigour, all physical activity vs control, Outcome 18 Overall vigour/vitality (follow‐up values).

Comparison 4 Comparison: fatigue and vigour, all physical activity vs control, Outcome 19 Overall vigour/vitality (change values).

Comparison 4 Comparison: fatigue and vigour, all physical activity vs control, Outcome 20 MOS SF vitality (follow‐up values).
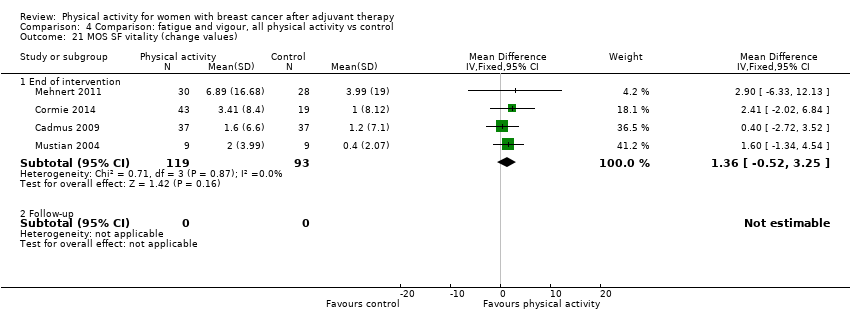
Comparison 4 Comparison: fatigue and vigour, all physical activity vs control, Outcome 21 MOS SF vitality (change values).
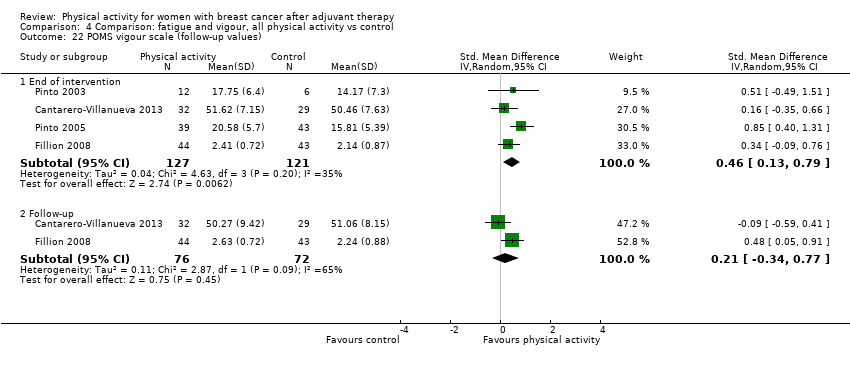
Comparison 4 Comparison: fatigue and vigour, all physical activity vs control, Outcome 22 POMS vigour scale (follow‐up values).

Comparison 4 Comparison: fatigue and vigour, all physical activity vs control, Outcome 23 POMS vigour scale (change values).

Comparison 5 Comparison: pain/disability, all physical activity vs control, Outcome 1 Overall pain/disability (follow‐up values).
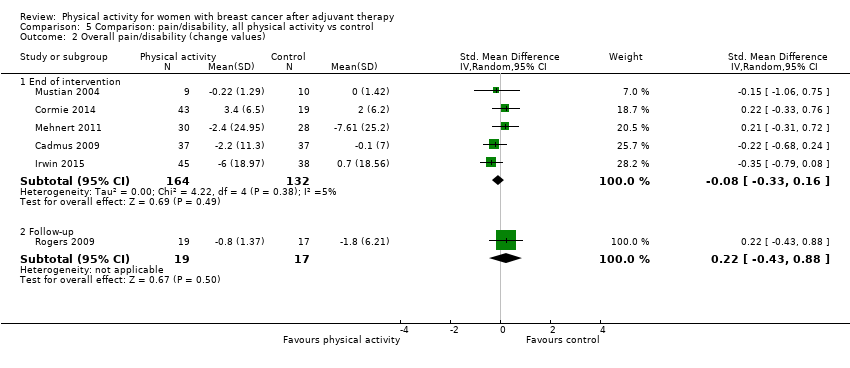
Comparison 5 Comparison: pain/disability, all physical activity vs control, Outcome 2 Overall pain/disability (change values).

Comparison 5 Comparison: pain/disability, all physical activity vs control, Outcome 3 Brief Pain Inventory severity score (change values).

Comparison 5 Comparison: pain/disability, all physical activity vs control, Outcome 4 Brief Pain Inventory interference score (change values).

Comparison 5 Comparison: pain/disability, all physical activity vs control, Outcome 5 DASH (follow‐up and change values).

Comparison 5 Comparison: pain/disability, all physical activity vs control, Outcome 6 EORTC QLQ‐C30 Pain scale (follow‐up and change values).

Comparison 5 Comparison: pain/disability, all physical activity vs control, Outcome 7 MOS SF Pain (follow‐up values).

Comparison 5 Comparison: pain/disability, all physical activity vs control, Outcome 8 MOS SF Pain (change values).
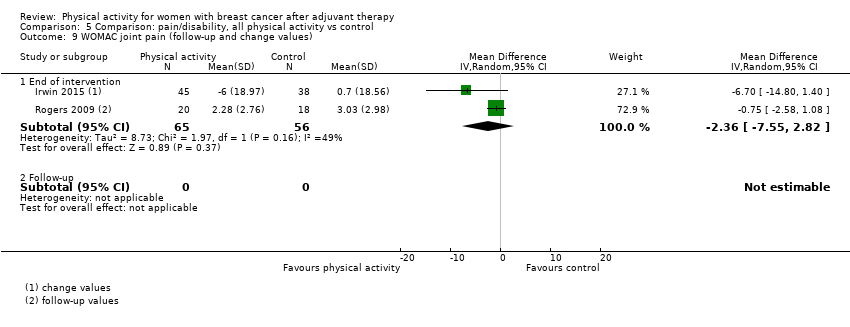
Comparison 5 Comparison: pain/disability, all physical activity vs control, Outcome 9 WOMAC joint pain (follow‐up and change values).

Comparison 5 Comparison: pain/disability, all physical activity vs control, Outcome 10 WOMAC physical dysfunction (follow‐up and change values).

Comparison 5 Comparison: pain/disability, all physical activity vs control, Outcome 11 WOMAC total score (follow‐up and change values).

Comparison 6 Comparison: self‐esteem, all physical activity vs control, Outcome 1 Overall self‐esteem/body image (follow‐up values).

Comparison 6 Comparison: self‐esteem, all physical activity vs control, Outcome 2 Overall self‐esteem/body image (change values).
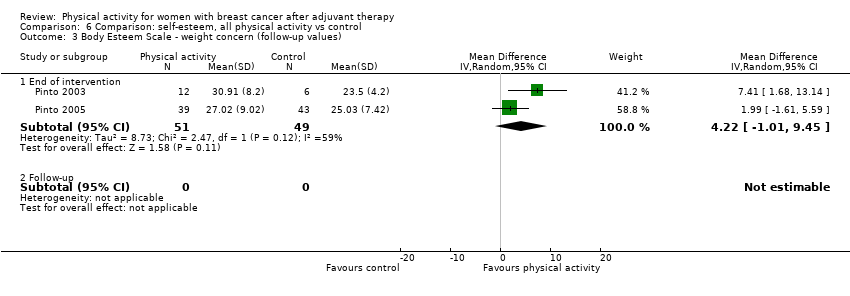
Comparison 6 Comparison: self‐esteem, all physical activity vs control, Outcome 3 Body Esteem Scale ‐ weight concern (follow‐up values).

Comparison 6 Comparison: self‐esteem, all physical activity vs control, Outcome 4 Physical self‐perception profile ‐ attractiveness of body (follow‐up values).

Comparison 6 Comparison: self‐esteem, all physical activity vs control, Outcome 5 Physical self‐perception profile ‐ attractiveness of body (change values).

Comparison 6 Comparison: self‐esteem, all physical activity vs control, Outcome 6 Rosenberg Self‐Esteem Scale (follow‐up values).
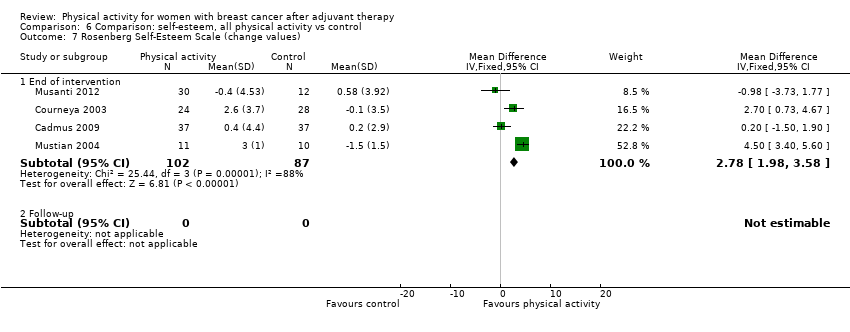
Comparison 6 Comparison: self‐esteem, all physical activity vs control, Outcome 7 Rosenberg Self‐Esteem Scale (change values).
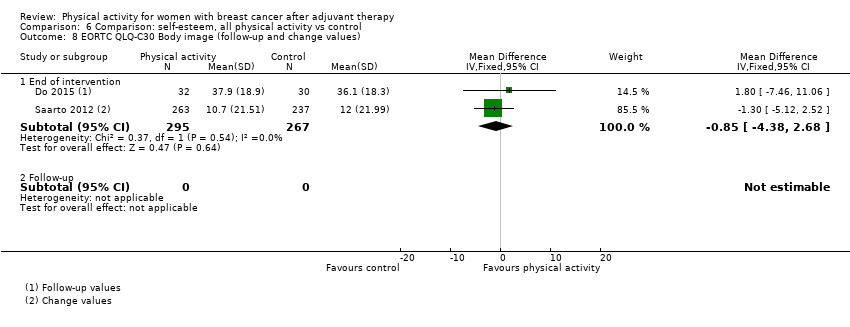
Comparison 6 Comparison: self‐esteem, all physical activity vs control, Outcome 8 EORTC QLQ‐C30 Body image (follow‐up and change values).

Comparison 7 Comparison: cardiorespiratory fitness, all physical activity vs control, Outcome 1 Overall cardiorespiratory fitness (follow‐up values).

Comparison 7 Comparison: cardiorespiratory fitness, all physical activity vs control, Outcome 2 Overall cardiorespiratory fitness (change values).

Comparison 7 Comparison: cardiorespiratory fitness, all physical activity vs control, Outcome 3 Directly assessed VO₂max/peak (follow‐up values).
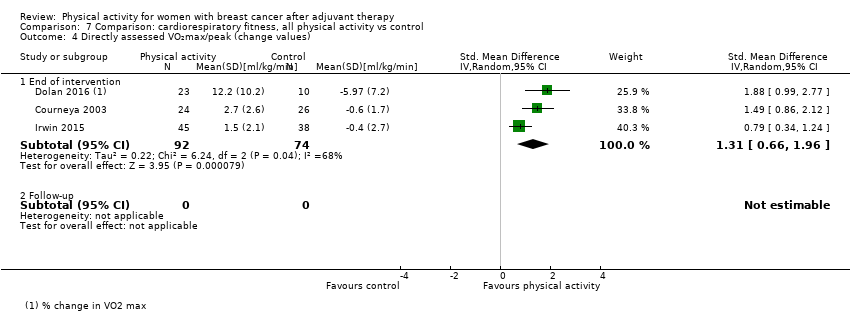
Comparison 7 Comparison: cardiorespiratory fitness, all physical activity vs control, Outcome 4 Directly assessed VO₂max/peak (change values).
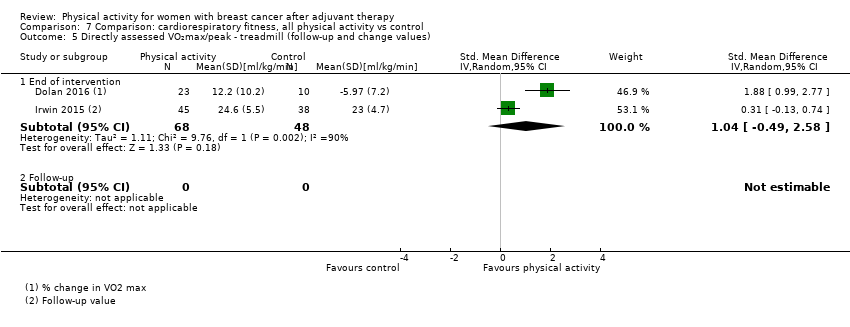
Comparison 7 Comparison: cardiorespiratory fitness, all physical activity vs control, Outcome 5 Directly assessed VO₂max/peak ‐ treadmill (follow‐up and change values).

Comparison 7 Comparison: cardiorespiratory fitness, all physical activity vs control, Outcome 6 Directly assessed VO₂max/peak ‐ cycle ergometer (follow‐up values).

Comparison 7 Comparison: cardiorespiratory fitness, all physical activity vs control, Outcome 7 Peak Power Output ‐ cycle ergometer test (follow‐up values).
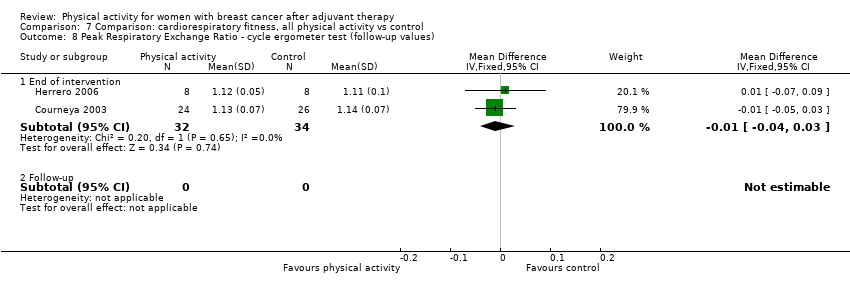
Comparison 7 Comparison: cardiorespiratory fitness, all physical activity vs control, Outcome 8 Peak Respiratory Exchange Ratio ‐ cycle ergometer test (follow‐up values).

Comparison 7 Comparison: cardiorespiratory fitness, all physical activity vs control, Outcome 9 Peak Heart Rate ‐ cycle ergometer test (follow‐up values).

Comparison 7 Comparison: cardiorespiratory fitness, all physical activity vs control, Outcome 10 Ebbeling single‐stage treadmill test (follow‐up and change values).
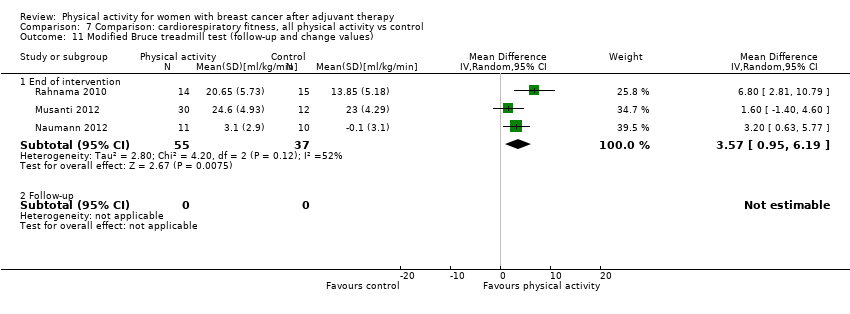
Comparison 7 Comparison: cardiorespiratory fitness, all physical activity vs control, Outcome 11 Modified Bruce treadmill test (follow‐up and change values).

Comparison 7 Comparison: cardiorespiratory fitness, all physical activity vs control, Outcome 12 Naughton submaximal treadmill test (follow‐up and change values).

Comparison 7 Comparison: cardiorespiratory fitness, all physical activity vs control, Outcome 13 Cardiorespiratory fitness walk tests (follow‐up values).

Comparison 7 Comparison: cardiorespiratory fitness, all physical activity vs control, Outcome 14 Cardiorespiratory fitness walk tests (change values).

Comparison 7 Comparison: cardiorespiratory fitness, all physical activity vs control, Outcome 15 6‐Minute walk test (follow‐up and change values).

Comparison 7 Comparison: cardiorespiratory fitness, all physical activity vs control, Outcome 16 12‐Minute walk test (follow‐up values).

Comparison 7 Comparison: cardiorespiratory fitness, all physical activity vs control, Outcome 17 2‐Kilometer walk test (follow‐up and change values).

Comparison 7 Comparison: cardiorespiratory fitness, all physical activity vs control, Outcome 18 Resting Heart Rate (follow‐up values).

Comparison 7 Comparison: cardiorespiratory fitness, all physical activity vs control, Outcome 19 Resting Heart Rate (change values).

Comparison 7 Comparison: cardiorespiratory fitness, all physical activity vs control, Outcome 20 Resting Systolic Blood Pressure (follow‐up values).

Comparison 7 Comparison: cardiorespiratory fitness, all physical activity vs control, Outcome 21 Resting Systolic Blood Pressure (change values).

Comparison 7 Comparison: cardiorespiratory fitness, all physical activity vs control, Outcome 22 Resting Diastolic Blood Pressure (follow‐up values).

Comparison 7 Comparison: cardiorespiratory fitness, all physical activity vs control, Outcome 23 Resting Diastolic Blood Pressure (change values).
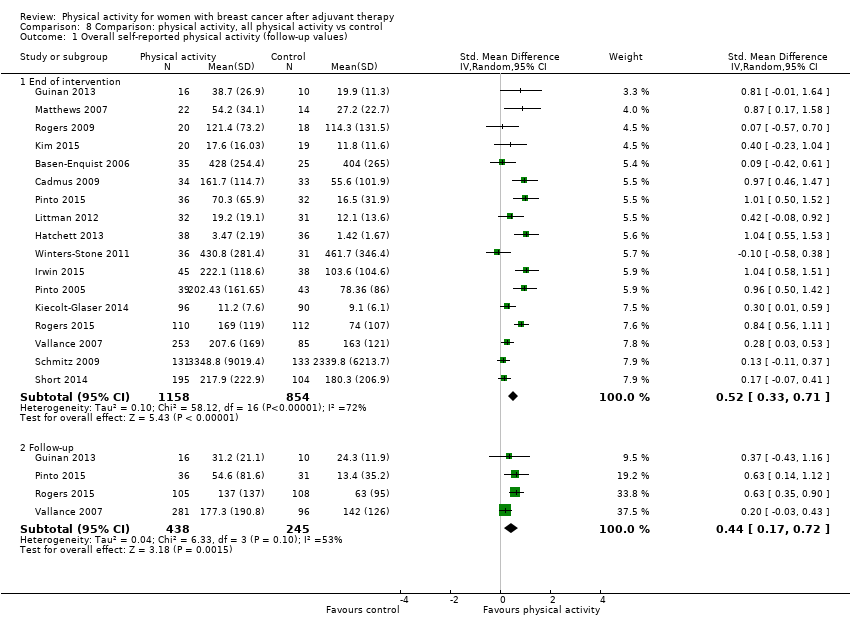
Comparison 8 Comparison: physical activity, all physical activity vs control, Outcome 1 Overall self‐reported physical activity (follow‐up values).

Comparison 8 Comparison: physical activity, all physical activity vs control, Outcome 2 Overall self‐reported physical activity (change values).

Comparison 8 Comparison: physical activity, all physical activity vs control, Outcome 3 Self‐reported total physical activity (follow‐up values).
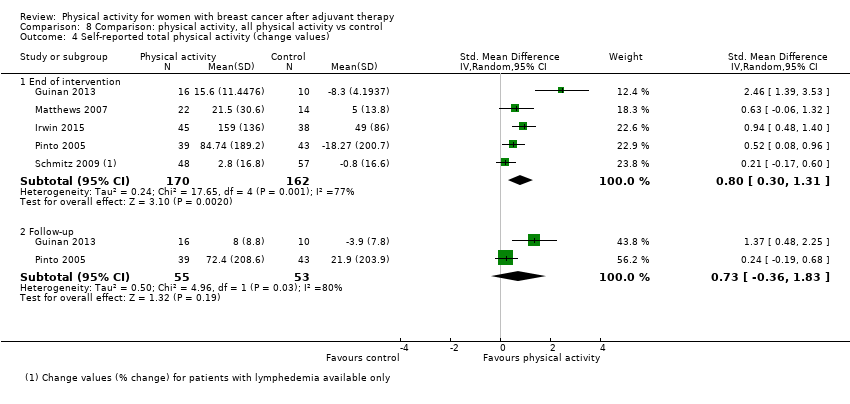
Comparison 8 Comparison: physical activity, all physical activity vs control, Outcome 4 Self‐reported total physical activity (change values).

Comparison 8 Comparison: physical activity, all physical activity vs control, Outcome 5 Self‐reported moderate physical activity (follow‐up values).
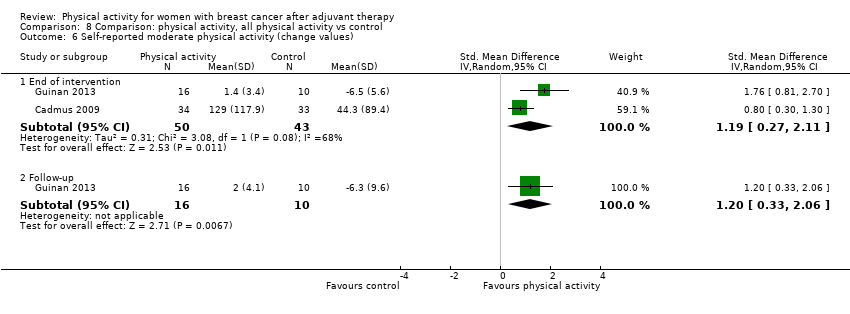
Comparison 8 Comparison: physical activity, all physical activity vs control, Outcome 6 Self‐reported moderate physical activity (change values).

Comparison 8 Comparison: physical activity, all physical activity vs control, Outcome 7 Self‐reported moderate‐vigorous physical activity (follow‐up values).

Comparison 8 Comparison: physical activity, all physical activity vs control, Outcome 8 Self‐reported moderate‐vigorous physical activity (change values).

Comparison 8 Comparison: physical activity, all physical activity vs control, Outcome 9 Self‐reported vigorous physical activity (follow‐up values).
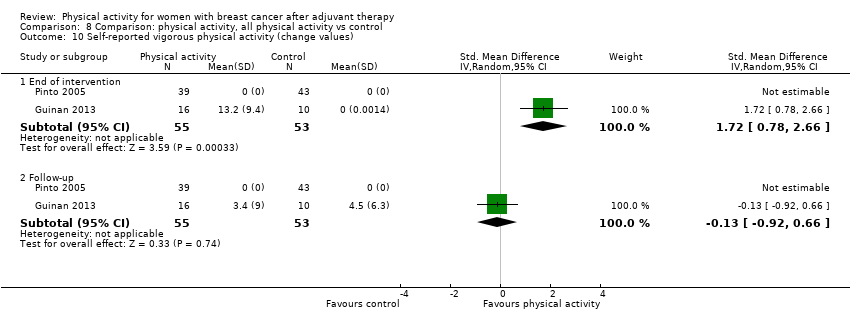
Comparison 8 Comparison: physical activity, all physical activity vs control, Outcome 10 Self‐reported vigorous physical activity (change values).

Comparison 8 Comparison: physical activity, all physical activity vs control, Outcome 11 Self‐reported walking (follow‐up values).
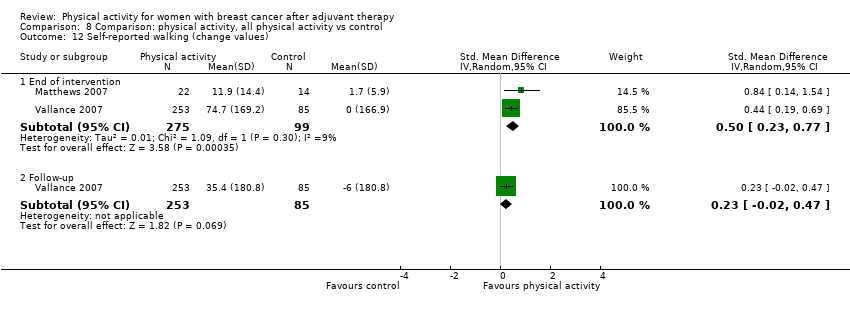
Comparison 8 Comparison: physical activity, all physical activity vs control, Outcome 12 Self‐reported walking (change values).

Comparison 8 Comparison: physical activity, all physical activity vs control, Outcome 13 7‐Day PAR self‐reported moderate physical activity (follow‐up values).

Comparison 8 Comparison: physical activity, all physical activity vs control, Outcome 14 7‐day PAR self‐reported moderate‐vigorous physical activity (follow‐up values).

Comparison 8 Comparison: physical activity, all physical activity vs control, Outcome 15 Godin LSI self‐reported moderate‐vigorous physical activity (follow‐up values).

Comparison 8 Comparison: physical activity, all physical activity vs control, Outcome 16 Meeting recommended physical activity guidelines (follow‐up values).

Comparison 8 Comparison: physical activity, all physical activity vs control, Outcome 17 Overall objective physical activity (follow‐up values).

Comparison 8 Comparison: physical activity, all physical activity vs control, Outcome 18 Overall objective physical activity (change values).

Comparison 8 Comparison: physical activity, all physical activity vs control, Outcome 19 Objective moderate‐vigorous physical activity (follow‐up values).
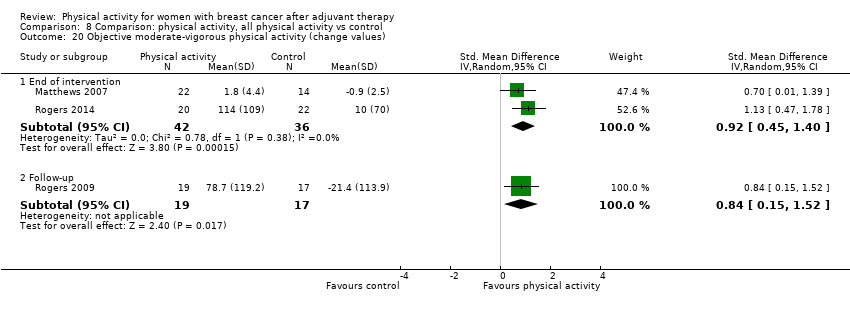
Comparison 8 Comparison: physical activity, all physical activity vs control, Outcome 20 Objective moderate‐vigorous physical activity (change values).
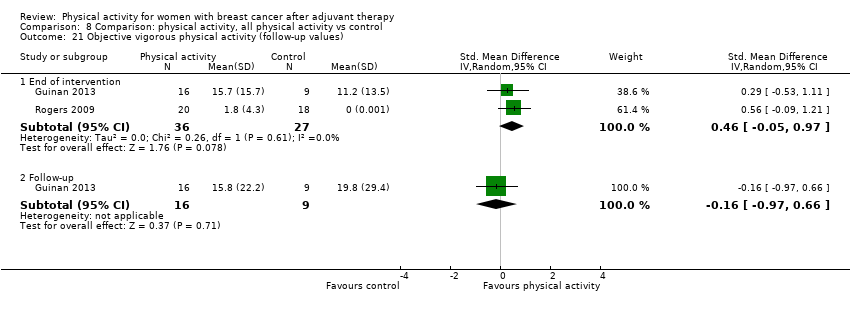
Comparison 8 Comparison: physical activity, all physical activity vs control, Outcome 21 Objective vigorous physical activity (follow‐up values).
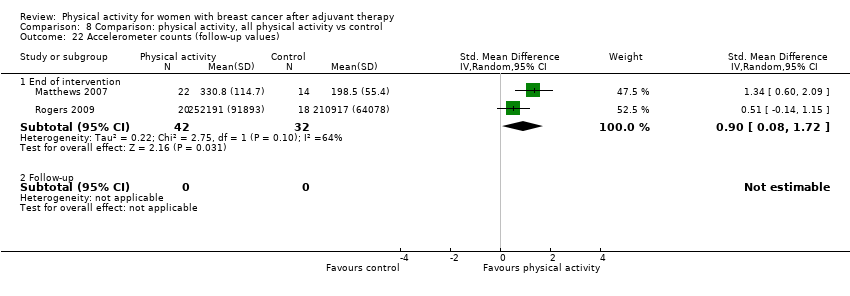
Comparison 8 Comparison: physical activity, all physical activity vs control, Outcome 22 Accelerometer counts (follow‐up values).

Comparison 8 Comparison: physical activity, all physical activity vs control, Outcome 23 Pedometer/accelerometer steps/d (follow‐up values).
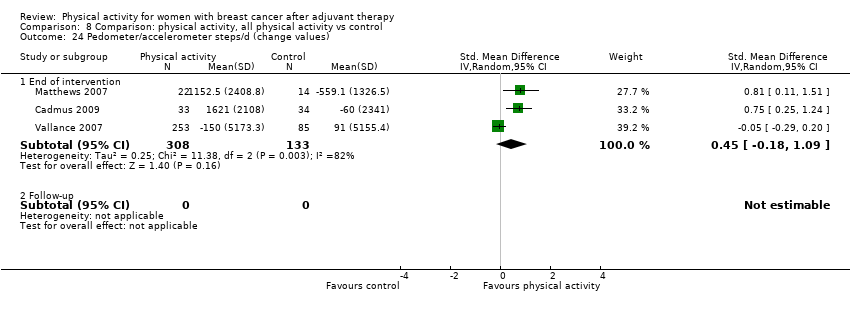
Comparison 8 Comparison: physical activity, all physical activity vs control, Outcome 24 Pedometer/accelerometer steps/d (change values).

Comparison 8 Comparison: physical activity, all physical activity vs control, Outcome 25 Overall sedentary behaviour (follow‐up values).

Comparison 8 Comparison: physical activity, all physical activity vs control, Outcome 26 Objective sedentary behaviour (follow‐up values).

Comparison 8 Comparison: physical activity, all physical activity vs control, Outcome 27 Objective sedentary behaviour (change values).

Comparison 9 Comparison: anthropometric outcomes, all physical activity vs control, Outcome 1 Mass (follow‐up values).

Comparison 9 Comparison: anthropometric outcomes, all physical activity vs control, Outcome 2 Mass (change values).
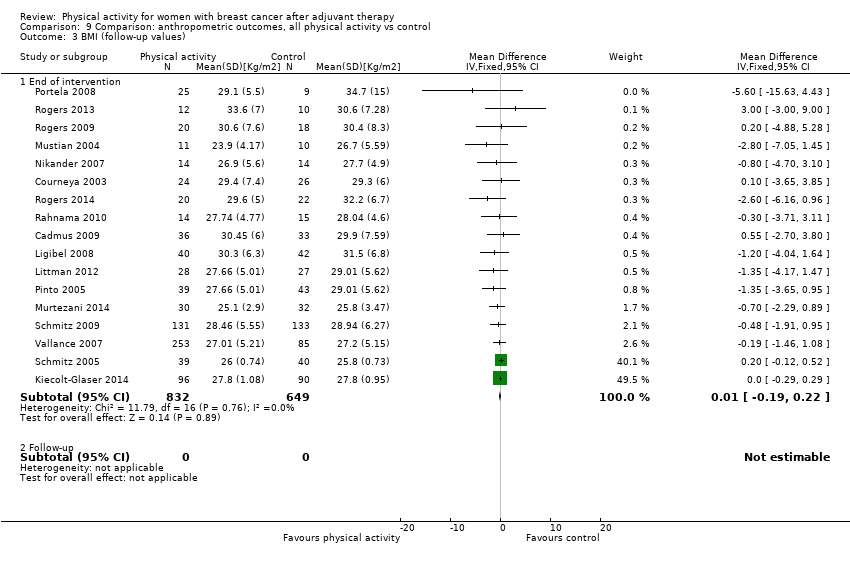
Comparison 9 Comparison: anthropometric outcomes, all physical activity vs control, Outcome 3 BMI (follow‐up values).

Comparison 9 Comparison: anthropometric outcomes, all physical activity vs control, Outcome 4 BMI (change values).

Comparison 9 Comparison: anthropometric outcomes, all physical activity vs control, Outcome 5 Overall body fat (follow‐up values).

Comparison 9 Comparison: anthropometric outcomes, all physical activity vs control, Outcome 6 Overall body fat (change values).

Comparison 9 Comparison: anthropometric outcomes, all physical activity vs control, Outcome 7 Percentage body fat ‐ DEXA (follow‐up values).

Comparison 9 Comparison: anthropometric outcomes, all physical activity vs control, Outcome 8 Percentage body fat ‐ DEXA (change values).

Comparison 9 Comparison: anthropometric outcomes, all physical activity vs control, Outcome 9 Percentage body fat ‐ BIA (follow‐up values).
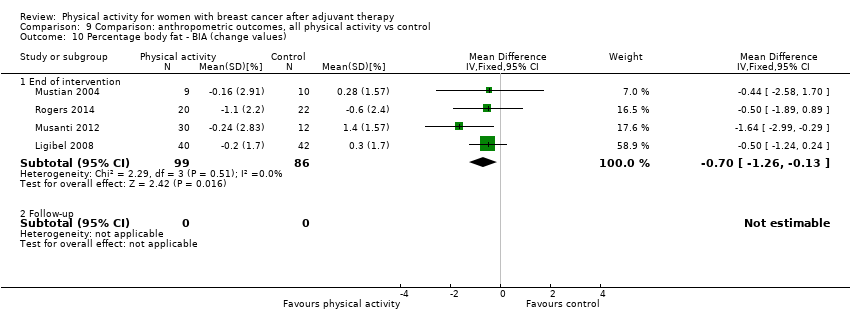
Comparison 9 Comparison: anthropometric outcomes, all physical activity vs control, Outcome 10 Percentage body fat ‐ BIA (change values).

Comparison 9 Comparison: anthropometric outcomes, all physical activity vs control, Outcome 11 Percentage body fat ‐ SKF (follow‐up values).

Comparison 9 Comparison: anthropometric outcomes, all physical activity vs control, Outcome 12 Fat mass (follow‐up values).
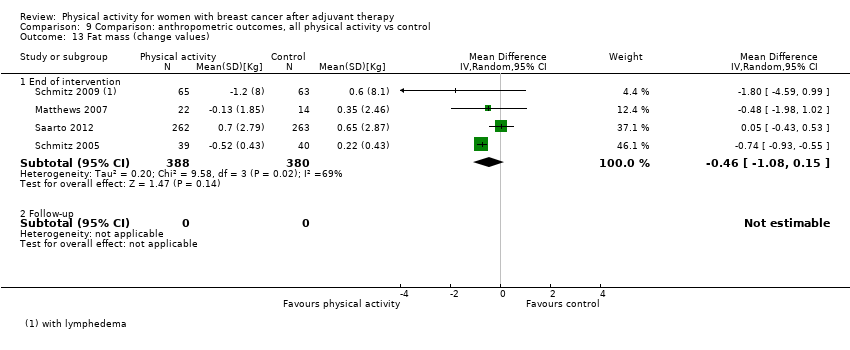
Comparison 9 Comparison: anthropometric outcomes, all physical activity vs control, Outcome 13 Fat mass (change values).

Comparison 9 Comparison: anthropometric outcomes, all physical activity vs control, Outcome 14 Fat mass ‐ DEXA (follow‐up values).

Comparison 9 Comparison: anthropometric outcomes, all physical activity vs control, Outcome 15 Fat mass ‐ DEXA (change values).

Comparison 9 Comparison: anthropometric outcomes, all physical activity vs control, Outcome 16 Lean mass (follow‐up values).

Comparison 9 Comparison: anthropometric outcomes, all physical activity vs control, Outcome 17 Lean mass (change values).

Comparison 9 Comparison: anthropometric outcomes, all physical activity vs control, Outcome 18 Lean mass ‐ DEXA (follow‐up values).
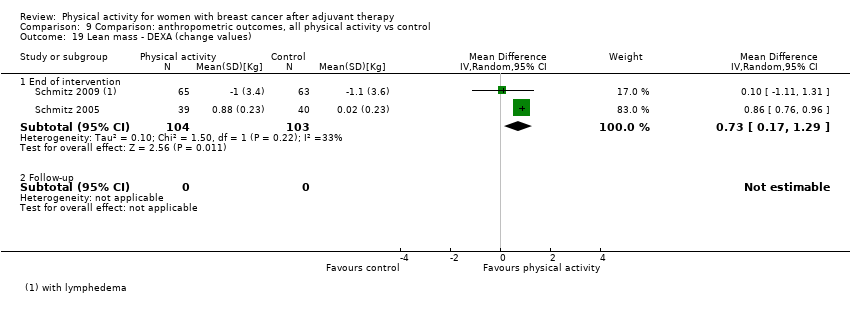
Comparison 9 Comparison: anthropometric outcomes, all physical activity vs control, Outcome 19 Lean mass ‐ DEXA (change values).

Comparison 9 Comparison: anthropometric outcomes, all physical activity vs control, Outcome 20 Waist‐to‐hip ratio (follow‐up values).

Comparison 9 Comparison: anthropometric outcomes, all physical activity vs control, Outcome 21 Waist‐to‐hip ratio (change values).

Comparison 9 Comparison: anthropometric outcomes, all physical activity vs control, Outcome 22 Waist circumference (follow‐up values).

Comparison 9 Comparison: anthropometric outcomes, all physical activity vs control, Outcome 23 Waist circumference (change values).

Comparison 9 Comparison: anthropometric outcomes, all physical activity vs control, Outcome 24 Hip circumference (follow‐up values).
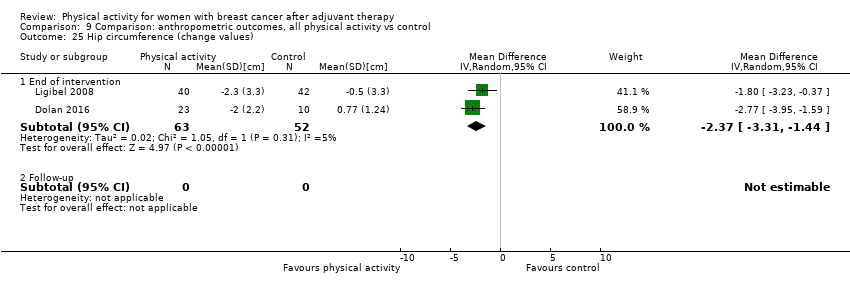
Comparison 9 Comparison: anthropometric outcomes, all physical activity vs control, Outcome 25 Hip circumference (change values).

Comparison 10 Comparison: muscular strength, all physical activity vs control, Outcome 1 Lower body strength (follow‐up values).

Comparison 10 Comparison: muscular strength, all physical activity vs control, Outcome 2 Lower body strength (change values).
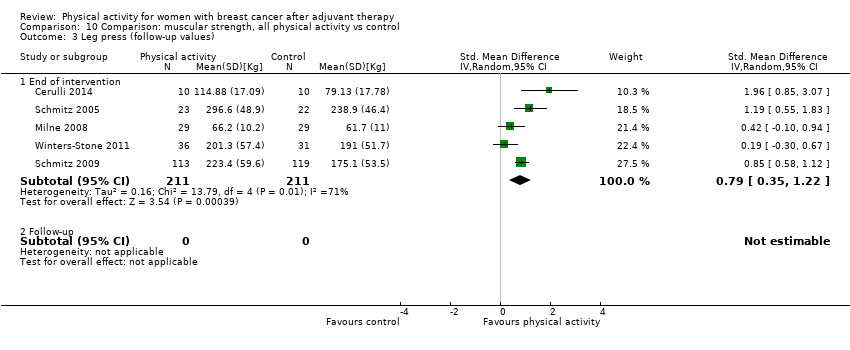
Comparison 10 Comparison: muscular strength, all physical activity vs control, Outcome 3 Leg press (follow‐up values).

Comparison 10 Comparison: muscular strength, all physical activity vs control, Outcome 4 Leg press (change values).

Comparison 10 Comparison: muscular strength, all physical activity vs control, Outcome 5 Back & leg strength (follow‐up values).

Comparison 10 Comparison: muscular strength, all physical activity vs control, Outcome 6 Leg extension (follow‐up values).
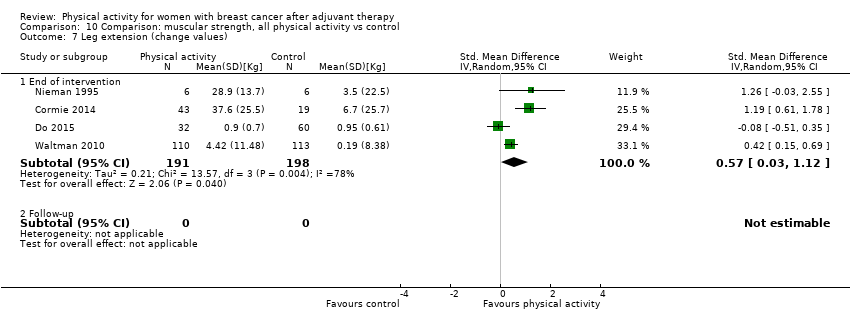
Comparison 10 Comparison: muscular strength, all physical activity vs control, Outcome 7 Leg extension (change values).

Comparison 10 Comparison: muscular strength, all physical activity vs control, Outcome 8 Hip extension (follow‐up values).

Comparison 10 Comparison: muscular strength, all physical activity vs control, Outcome 9 Hip flexion (follow‐up values).
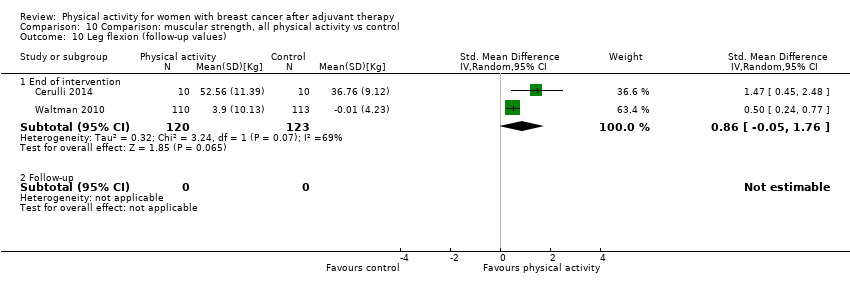
Comparison 10 Comparison: muscular strength, all physical activity vs control, Outcome 10 Leg flexion (follow‐up values).
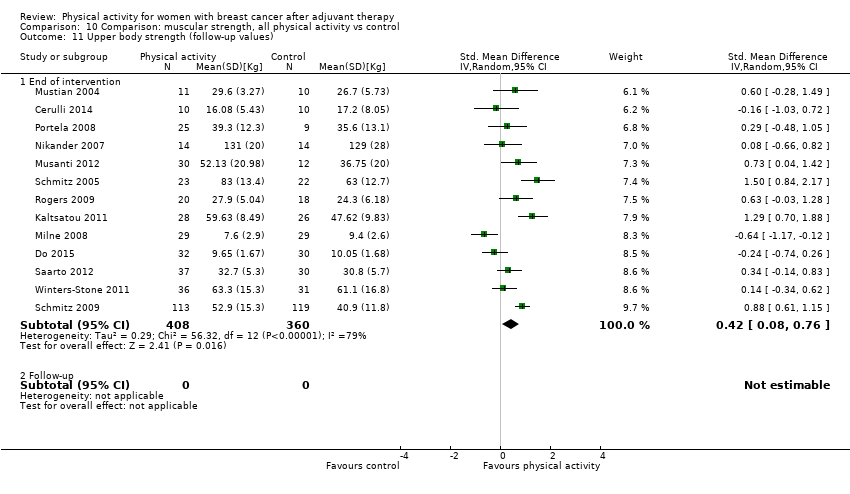
Comparison 10 Comparison: muscular strength, all physical activity vs control, Outcome 11 Upper body strength (follow‐up values).
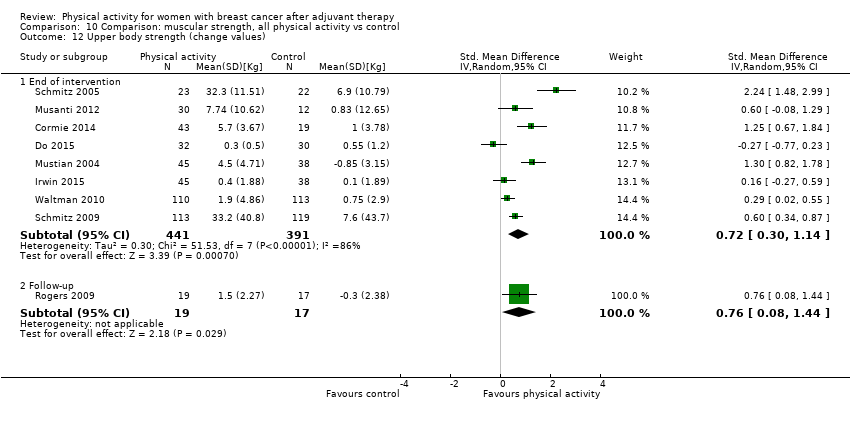
Comparison 10 Comparison: muscular strength, all physical activity vs control, Outcome 12 Upper body strength (change values).
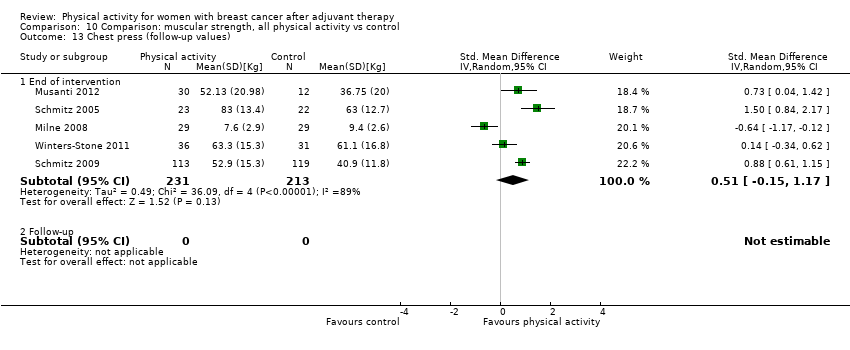
Comparison 10 Comparison: muscular strength, all physical activity vs control, Outcome 13 Chest press (follow‐up values).

Comparison 10 Comparison: muscular strength, all physical activity vs control, Outcome 14 Chest press (change values).

Comparison 10 Comparison: muscular strength, all physical activity vs control, Outcome 15 Grip strength (follow‐up).

Comparison 10 Comparison: muscular strength, all physical activity vs control, Outcome 16 Grip strength (change values).

Comparison 10 Comparison: muscular strength, all physical activity vs control, Outcome 17 Grip strength right hand (follow‐up).

Comparison 10 Comparison: muscular strength, all physical activity vs control, Outcome 18 Grip strength left hand (follow‐up).

Comparison 10 Comparison: muscular strength, all physical activity vs control, Outcome 19 Elbow flexion (follow‐up values).
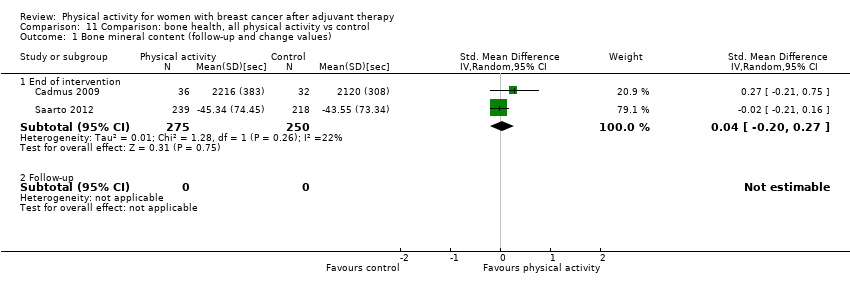
Comparison 11 Comparison: bone health, all physical activity vs control, Outcome 1 Bone mineral content (follow‐up and change values).
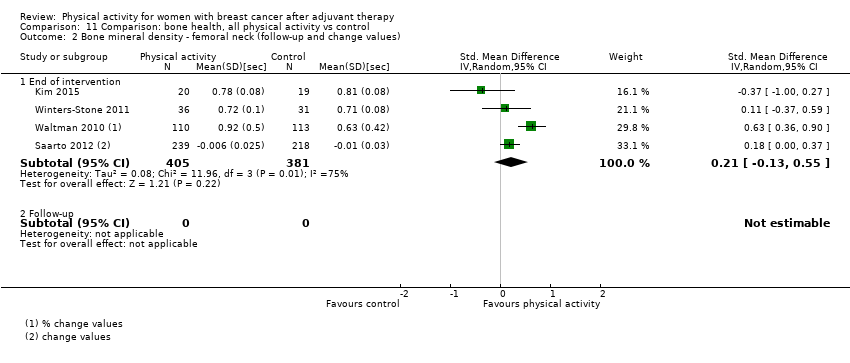
Comparison 11 Comparison: bone health, all physical activity vs control, Outcome 2 Bone mineral density ‐ femoral neck (follow‐up and change values).
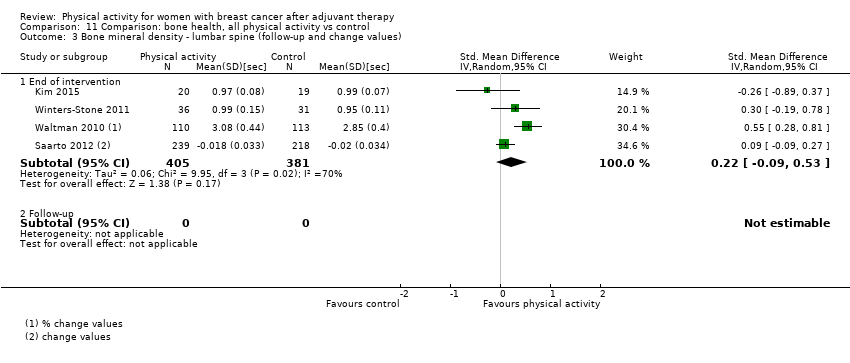
Comparison 11 Comparison: bone health, all physical activity vs control, Outcome 3 Bone mineral density ‐ lumbar spine (follow‐up and change values).

Comparison 11 Comparison: bone health, all physical activity vs control, Outcome 4 Bone mineral density ‐ total hip (follow‐up and change values).
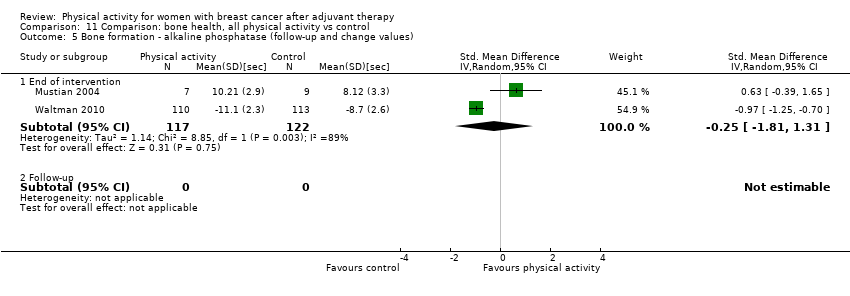
Comparison 11 Comparison: bone health, all physical activity vs control, Outcome 5 Bone formation ‐ alkaline phosphatase (follow‐up and change values).

Comparison 11 Comparison: bone health, all physical activity vs control, Outcome 6 Bone resorption ‐ serum NTx (follow‐up and change values).
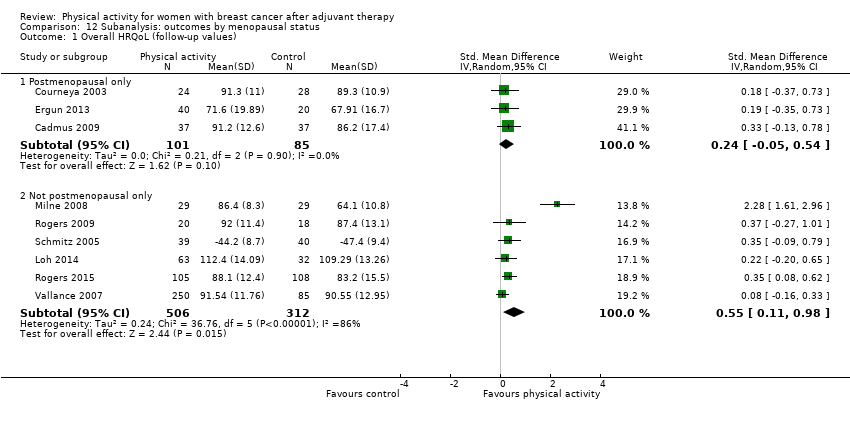
Comparison 12 Subanalysis: outcomes by menopausal status, Outcome 1 Overall HRQoL (follow‐up values).

Comparison 12 Subanalysis: outcomes by menopausal status, Outcome 2 Overall HRQoL (change values).

Comparison 12 Subanalysis: outcomes by menopausal status, Outcome 3 Overall emotional function/mental health (follow‐up values).

Comparison 12 Subanalysis: outcomes by menopausal status, Outcome 4 Overall emotional function/mental health (change values).
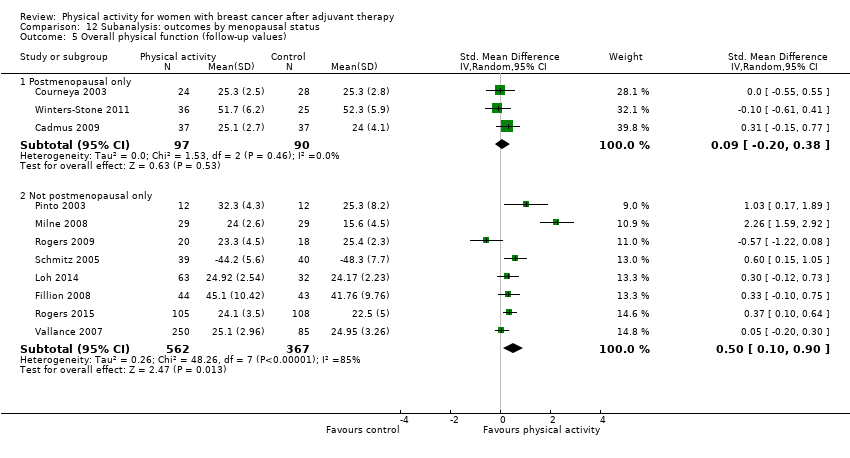
Comparison 12 Subanalysis: outcomes by menopausal status, Outcome 5 Overall physical function (follow‐up values).

Comparison 12 Subanalysis: outcomes by menopausal status, Outcome 6 Overall physical function (change values).

Comparison 12 Subanalysis: outcomes by menopausal status, Outcome 7 Overall role function (follow‐up values).

Comparison 12 Subanalysis: outcomes by menopausal status, Outcome 8 Overall role function (change values).

Comparison 12 Subanalysis: outcomes by menopausal status, Outcome 9 Overall social well‐being/function (follow‐up values).

Comparison 12 Subanalysis: outcomes by menopausal status, Outcome 10 Overall social well‐being/function (change values).

Comparison 12 Subanalysis: outcomes by menopausal status, Outcome 11 Overall cognitive function (follow‐up values).
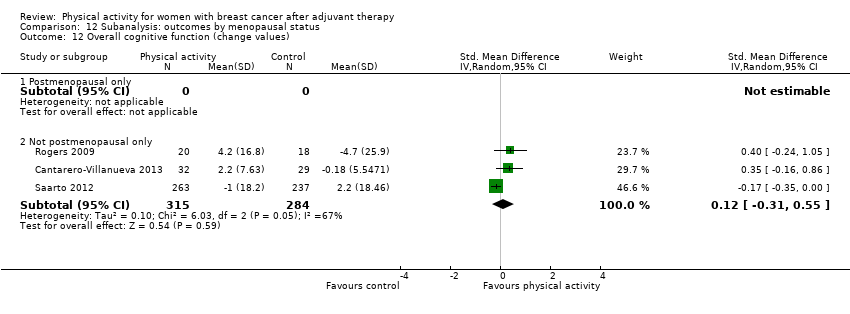
Comparison 12 Subanalysis: outcomes by menopausal status, Outcome 12 Overall cognitive function (change values).
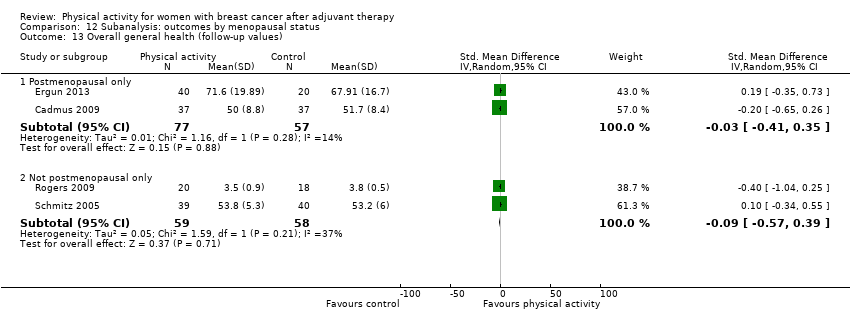
Comparison 12 Subanalysis: outcomes by menopausal status, Outcome 13 Overall general health (follow‐up values).

Comparison 12 Subanalysis: outcomes by menopausal status, Outcome 14 Overall general health (change values).

Comparison 12 Subanalysis: outcomes by menopausal status, Outcome 15 Overall sexual function (follow‐up values).

Comparison 12 Subanalysis: outcomes by menopausal status, Outcome 16 Overall sexual function (change values).

Comparison 12 Subanalysis: outcomes by menopausal status, Outcome 17 Overall sleep (follow‐up values).

Comparison 12 Subanalysis: outcomes by menopausal status, Outcome 18 Overall sleep (change values).
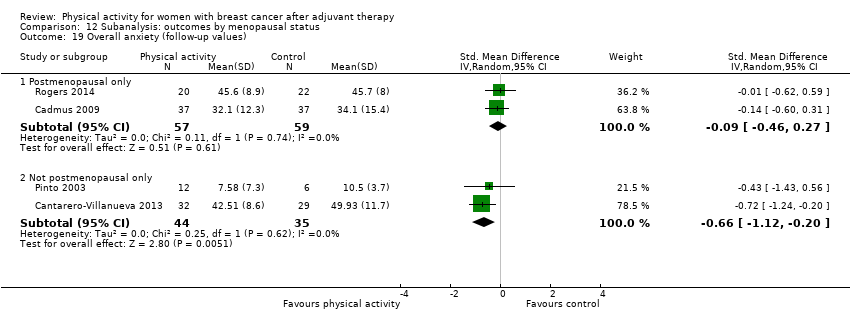
Comparison 12 Subanalysis: outcomes by menopausal status, Outcome 19 Overall anxiety (follow‐up values).

Comparison 12 Subanalysis: outcomes by menopausal status, Outcome 20 Overall anxiety (change values).
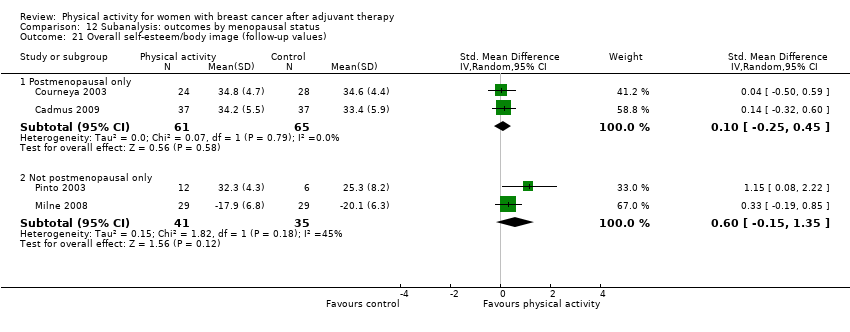
Comparison 12 Subanalysis: outcomes by menopausal status, Outcome 21 Overall self‐esteem/body image (follow‐up values).
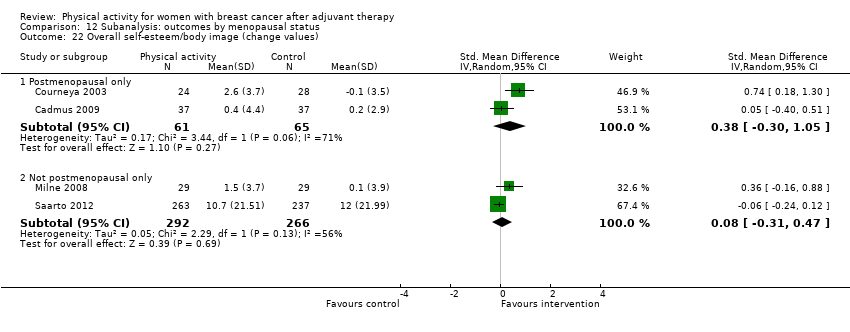
Comparison 12 Subanalysis: outcomes by menopausal status, Outcome 22 Overall self‐esteem/body image (change values).

Comparison 12 Subanalysis: outcomes by menopausal status, Outcome 23 Overall depression (follow‐up values).
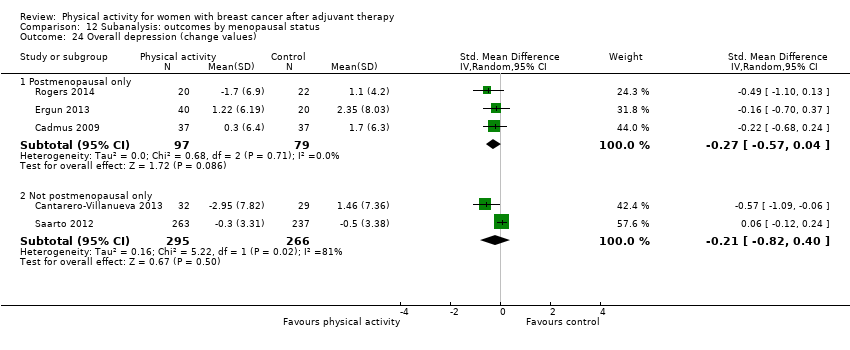
Comparison 12 Subanalysis: outcomes by menopausal status, Outcome 24 Overall depression (change values).
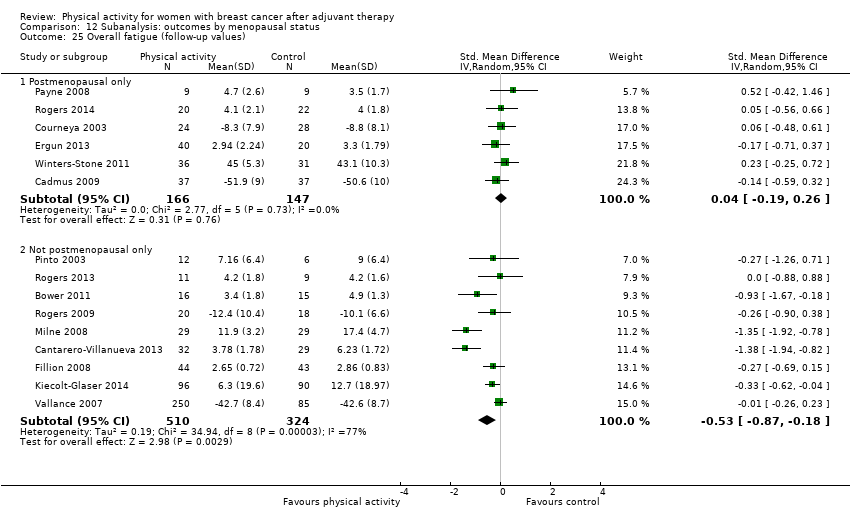
Comparison 12 Subanalysis: outcomes by menopausal status, Outcome 25 Overall fatigue (follow‐up values).

Comparison 12 Subanalysis: outcomes by menopausal status, Outcome 26 Overall fatigue (change values).

Comparison 12 Subanalysis: outcomes by menopausal status, Outcome 27 Overall pain/disability (follow‐up values).

Comparison 12 Subanalysis: outcomes by menopausal status, Outcome 28 Overall pain/disability (change values).

Comparison 12 Subanalysis: outcomes by menopausal status, Outcome 29 Overall cardiorespiratory fitness (follow‐up values).
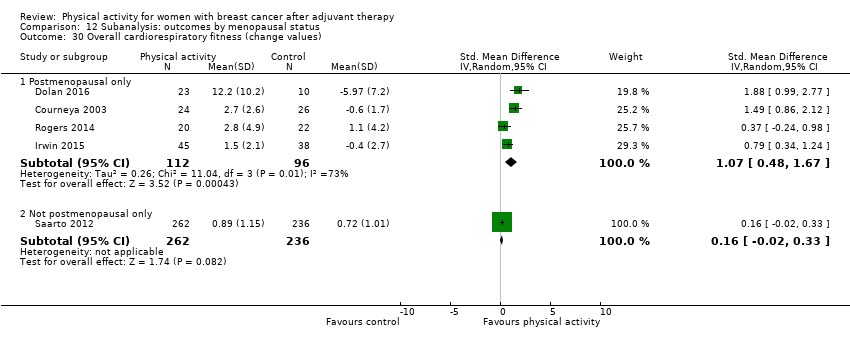
Comparison 12 Subanalysis: outcomes by menopausal status, Outcome 30 Overall cardiorespiratory fitness (change values).

Comparison 12 Subanalysis: outcomes by menopausal status, Outcome 31 Overall self‐reported physical activity (follow‐up values).

Comparison 12 Subanalysis: outcomes by menopausal status, Outcome 32 Overall self‐reported physical activity (change values).
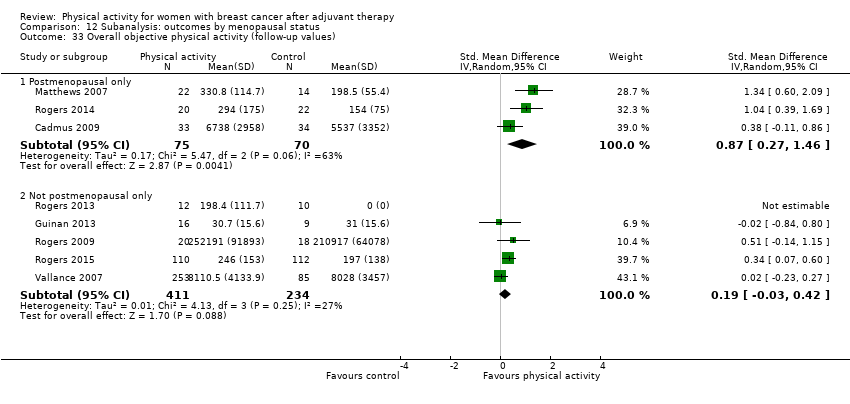
Comparison 12 Subanalysis: outcomes by menopausal status, Outcome 33 Overall objective physical activity (follow‐up values).
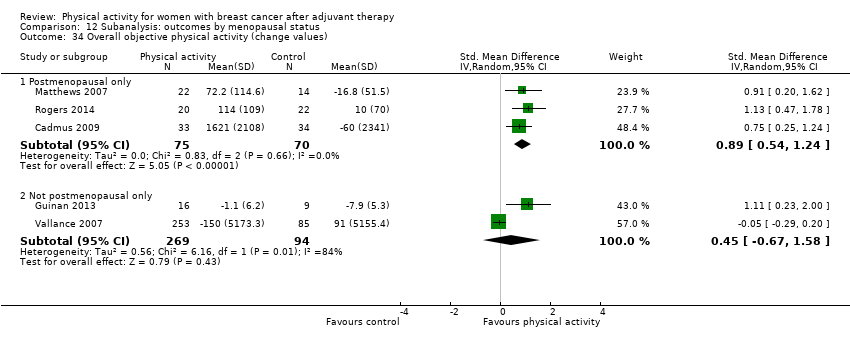
Comparison 12 Subanalysis: outcomes by menopausal status, Outcome 34 Overall objective physical activity (change values).

Comparison 12 Subanalysis: outcomes by menopausal status, Outcome 35 Mass (follow‐up values).

Comparison 12 Subanalysis: outcomes by menopausal status, Outcome 36 Mass (change values).
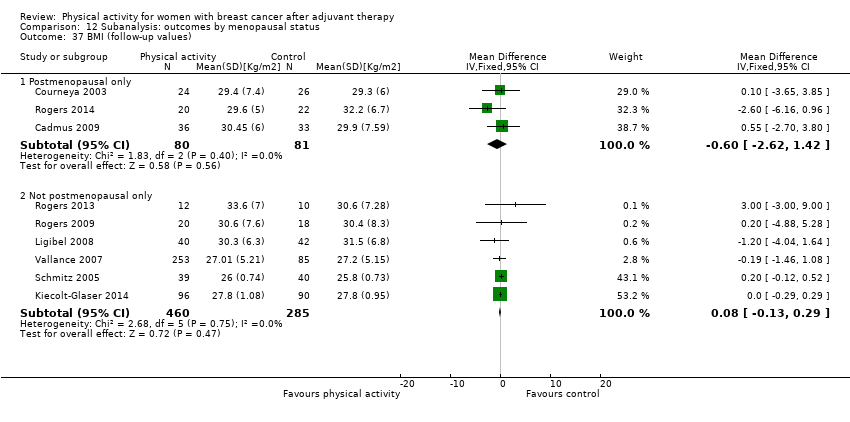
Comparison 12 Subanalysis: outcomes by menopausal status, Outcome 37 BMI (follow‐up values).

Comparison 12 Subanalysis: outcomes by menopausal status, Outcome 38 BMI (change values).

Comparison 12 Subanalysis: outcomes by menopausal status, Outcome 39 Overall body fat (follow‐up values).

Comparison 12 Subanalysis: outcomes by menopausal status, Outcome 40 Overall body fat (change values).

Comparison 12 Subanalysis: outcomes by menopausal status, Outcome 41 Lower body strength (follow‐up values).

Comparison 12 Subanalysis: outcomes by menopausal status, Outcome 42 Lower body strength (change values).

Comparison 12 Subanalysis: outcomes by menopausal status, Outcome 43 Upper body strength (follow‐up values).
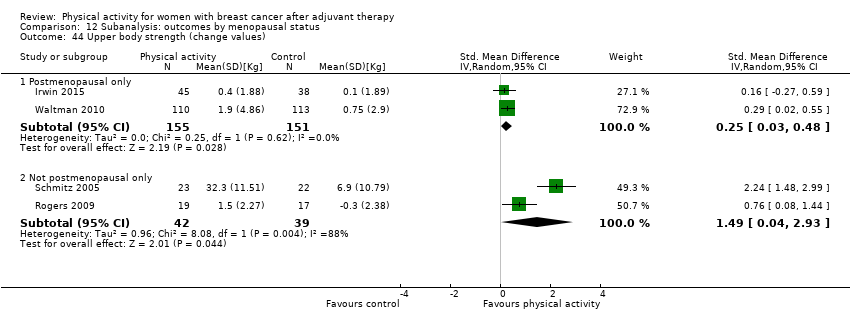
Comparison 12 Subanalysis: outcomes by menopausal status, Outcome 44 Upper body strength (change values).

Comparison 12 Subanalysis: outcomes by menopausal status, Outcome 45 Bone mineral density ‐ femoral neck (follow‐up and change values).

Comparison 12 Subanalysis: outcomes by menopausal status, Outcome 46 Bone mineral density ‐ lumbar spine (follow‐up and change values).

Comparison 13 Subanalysis: outcomes by mode of physical activity intervention, Outcome 1 Overall HRQoL (follow‐up values).
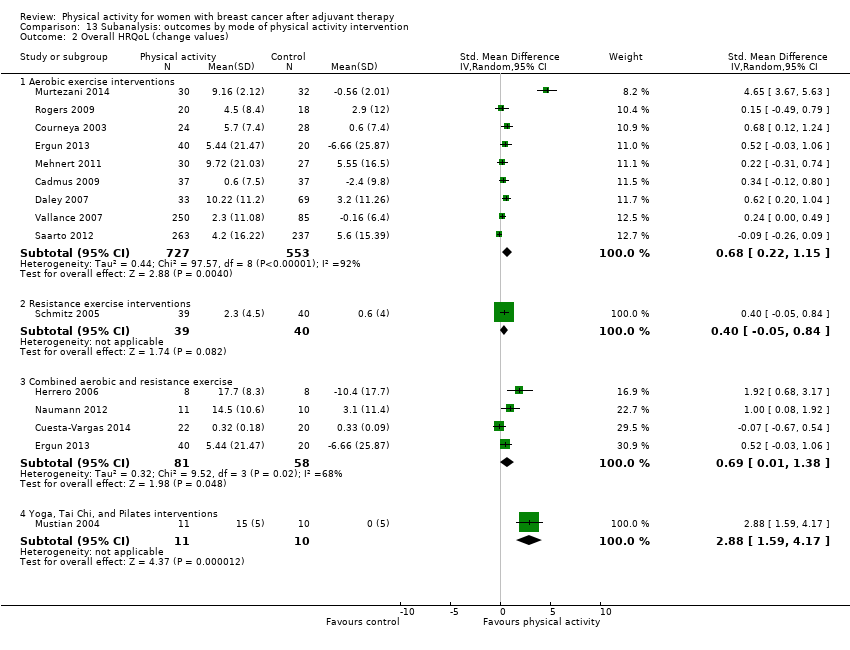
Comparison 13 Subanalysis: outcomes by mode of physical activity intervention, Outcome 2 Overall HRQoL (change values).

Comparison 13 Subanalysis: outcomes by mode of physical activity intervention, Outcome 3 Overall emotional function/mental health (follow‐up values).

Comparison 13 Subanalysis: outcomes by mode of physical activity intervention, Outcome 4 Overall emotional function/mental health (change values).

Comparison 13 Subanalysis: outcomes by mode of physical activity intervention, Outcome 5 Overall physical function (follow‐up values).

Comparison 13 Subanalysis: outcomes by mode of physical activity intervention, Outcome 6 Overall physical function (change values).
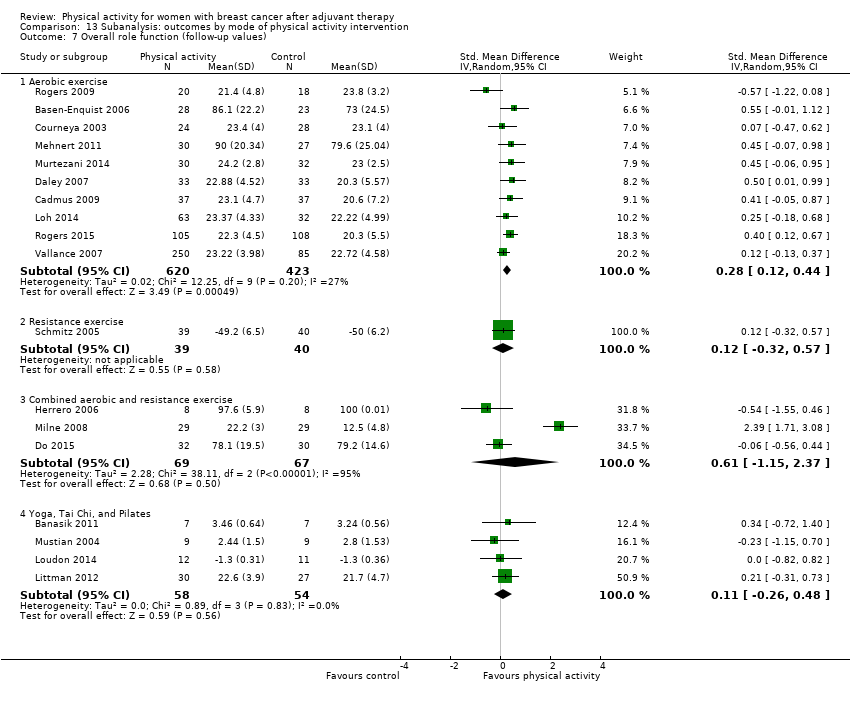
Comparison 13 Subanalysis: outcomes by mode of physical activity intervention, Outcome 7 Overall role function (follow‐up values).
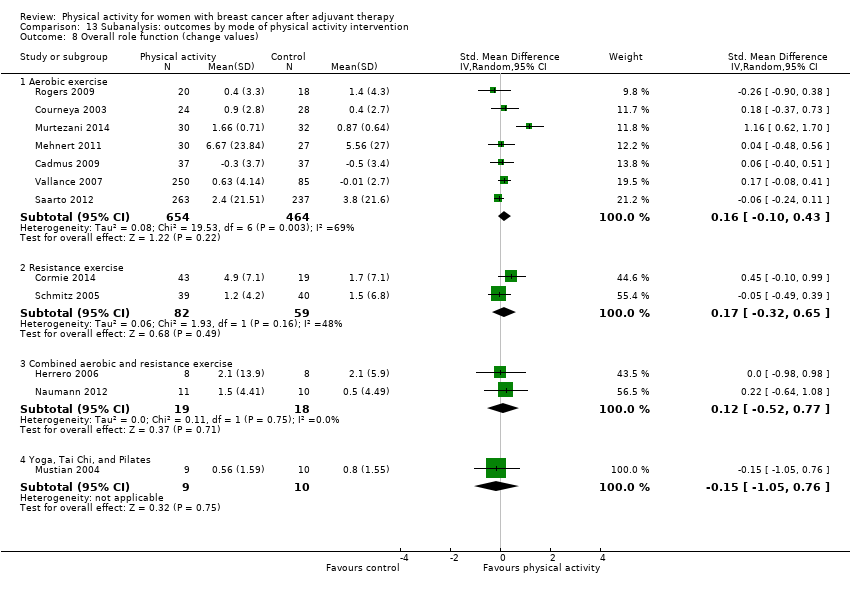
Comparison 13 Subanalysis: outcomes by mode of physical activity intervention, Outcome 8 Overall role function (change values).

Comparison 13 Subanalysis: outcomes by mode of physical activity intervention, Outcome 9 Overall social well‐being/function (follow‐up values).

Comparison 13 Subanalysis: outcomes by mode of physical activity intervention, Outcome 10 Overall social well‐being/function (change values).

Comparison 13 Subanalysis: outcomes by mode of physical activity intervention, Outcome 11 Overall cognitive function (follow‐up values).

Comparison 13 Subanalysis: outcomes by mode of physical activity intervention, Outcome 12 Overall cognitive function (change values).
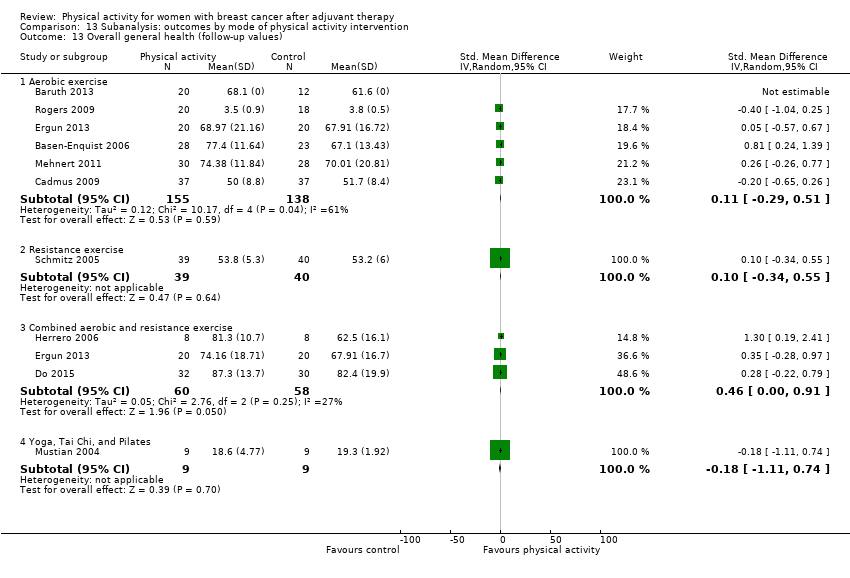
Comparison 13 Subanalysis: outcomes by mode of physical activity intervention, Outcome 13 Overall general health (follow‐up values).

Comparison 13 Subanalysis: outcomes by mode of physical activity intervention, Outcome 14 Overall general health (change values).

Comparison 13 Subanalysis: outcomes by mode of physical activity intervention, Outcome 15 Overall sexual function (follow‐up values).
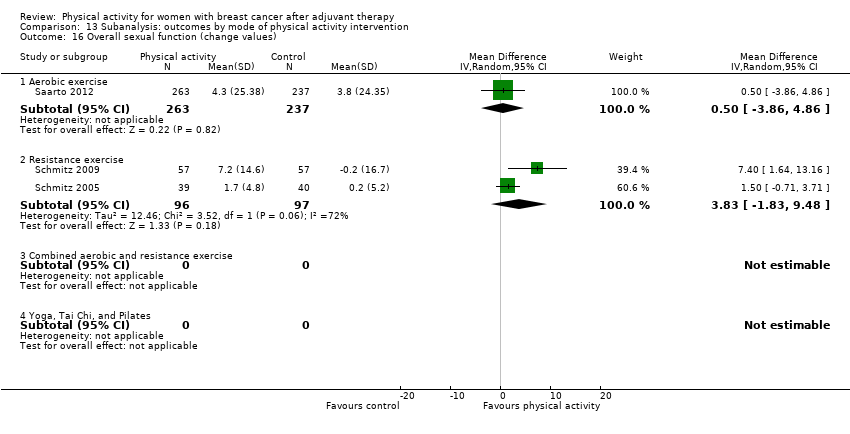
Comparison 13 Subanalysis: outcomes by mode of physical activity intervention, Outcome 16 Overall sexual function (change values).
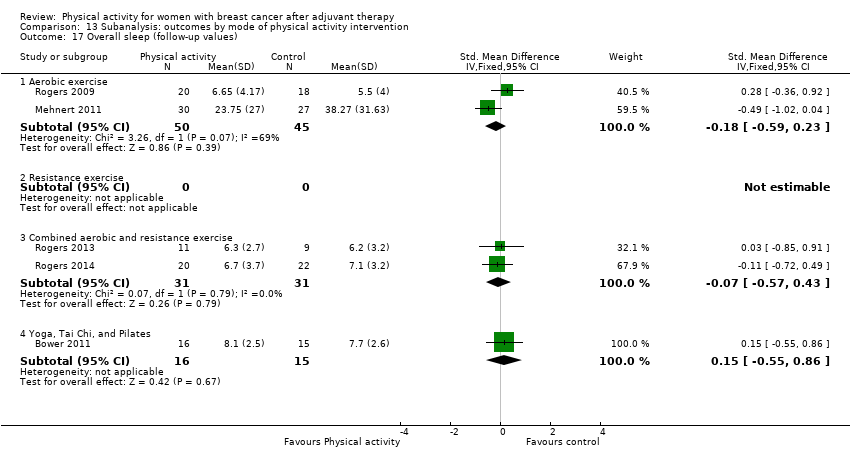
Comparison 13 Subanalysis: outcomes by mode of physical activity intervention, Outcome 17 Overall sleep (follow‐up values).

Comparison 13 Subanalysis: outcomes by mode of physical activity intervention, Outcome 18 Overall sleep (change values).

Comparison 13 Subanalysis: outcomes by mode of physical activity intervention, Outcome 19 Overall anxiety (follow‐up values).

Comparison 13 Subanalysis: outcomes by mode of physical activity intervention, Outcome 20 Overall anxiety (change values).
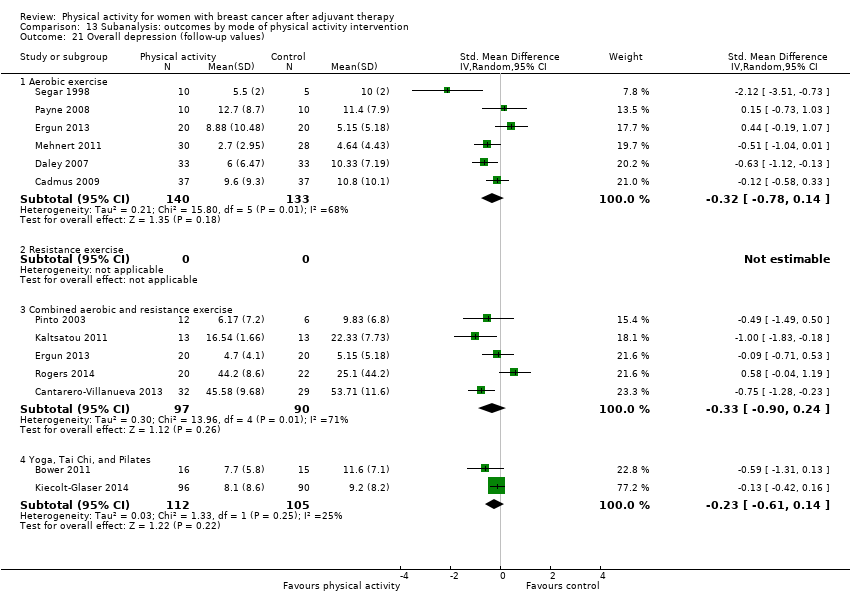
Comparison 13 Subanalysis: outcomes by mode of physical activity intervention, Outcome 21 Overall depression (follow‐up values).

Comparison 13 Subanalysis: outcomes by mode of physical activity intervention, Outcome 22 Overall depression (change values).

Comparison 13 Subanalysis: outcomes by mode of physical activity intervention, Outcome 23 Overall fatigue (follow‐up values).

Comparison 13 Subanalysis: outcomes by mode of physical activity intervention, Outcome 24 Overall fatigue (change values).

Comparison 13 Subanalysis: outcomes by mode of physical activity intervention, Outcome 25 Overall pain/disability (follow‐up values).
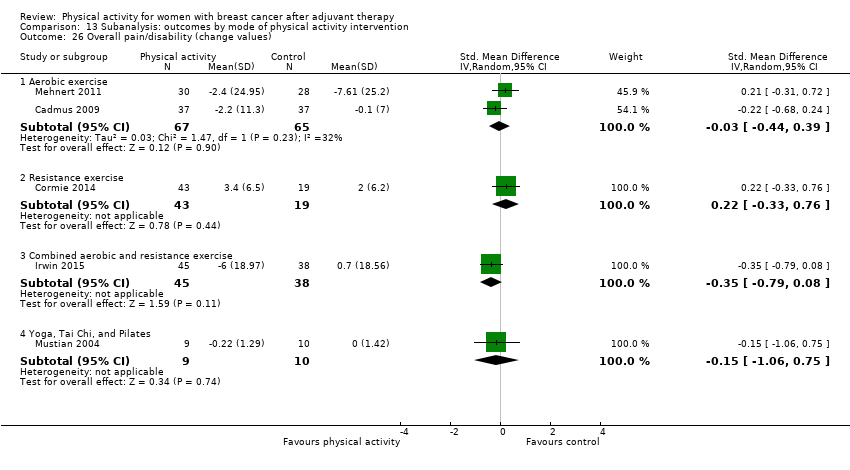
Comparison 13 Subanalysis: outcomes by mode of physical activity intervention, Outcome 26 Overall pain/disability (change values).

Comparison 13 Subanalysis: outcomes by mode of physical activity intervention, Outcome 27 Overall self‐esteem/body image (follow‐up values).
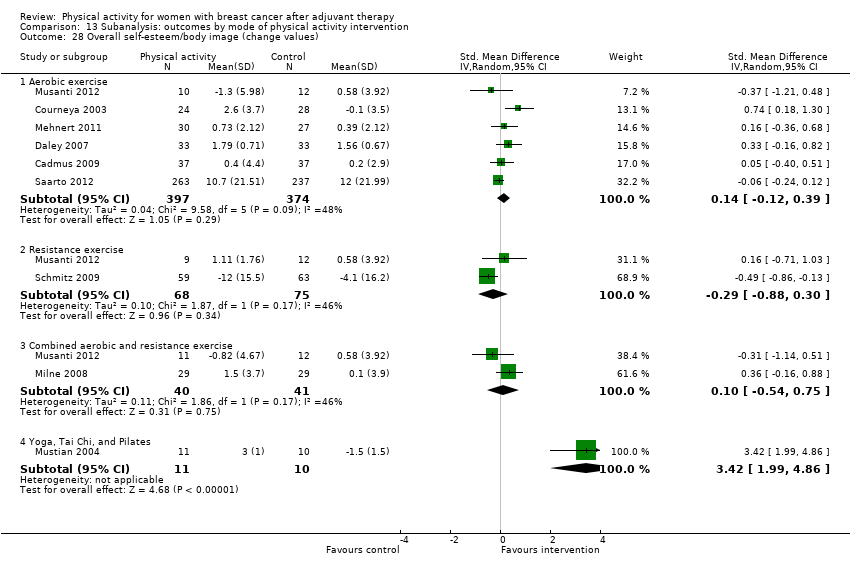
Comparison 13 Subanalysis: outcomes by mode of physical activity intervention, Outcome 28 Overall self‐esteem/body image (change values).

Comparison 13 Subanalysis: outcomes by mode of physical activity intervention, Outcome 29 Overall cardiorespiratory fitness (follow‐up values).

Comparison 13 Subanalysis: outcomes by mode of physical activity intervention, Outcome 30 Overall cardiorespiratory fitness (change values).
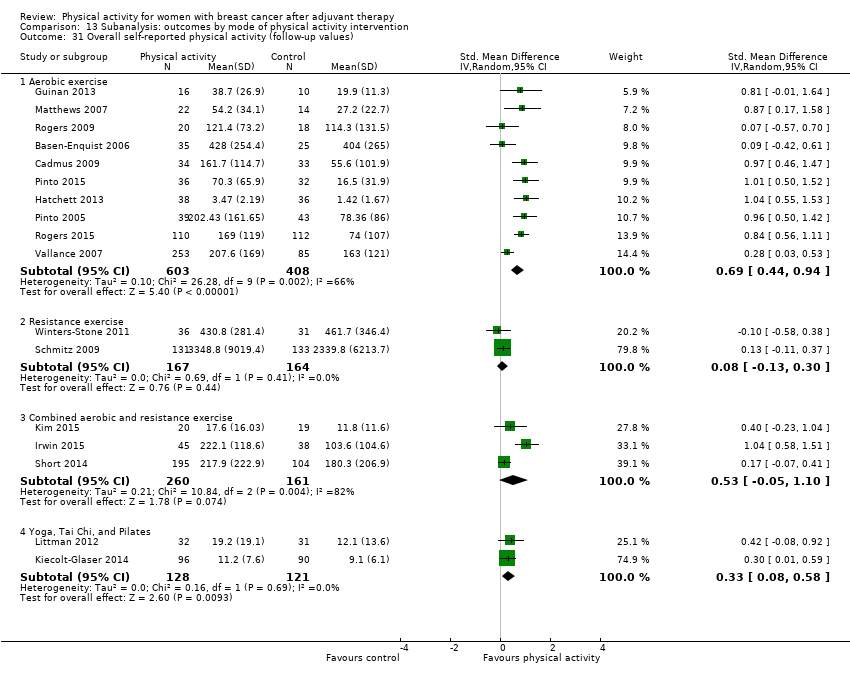
Comparison 13 Subanalysis: outcomes by mode of physical activity intervention, Outcome 31 Overall self‐reported physical activity (follow‐up values).

Comparison 13 Subanalysis: outcomes by mode of physical activity intervention, Outcome 32 Overall self‐reported physical activity (change values).
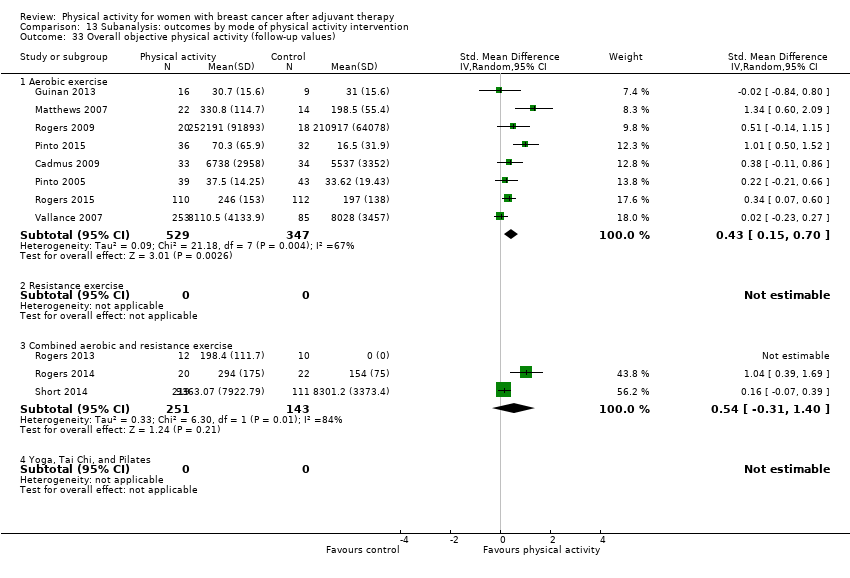
Comparison 13 Subanalysis: outcomes by mode of physical activity intervention, Outcome 33 Overall objective physical activity (follow‐up values).

Comparison 13 Subanalysis: outcomes by mode of physical activity intervention, Outcome 34 Overall objective physical activity (change values).
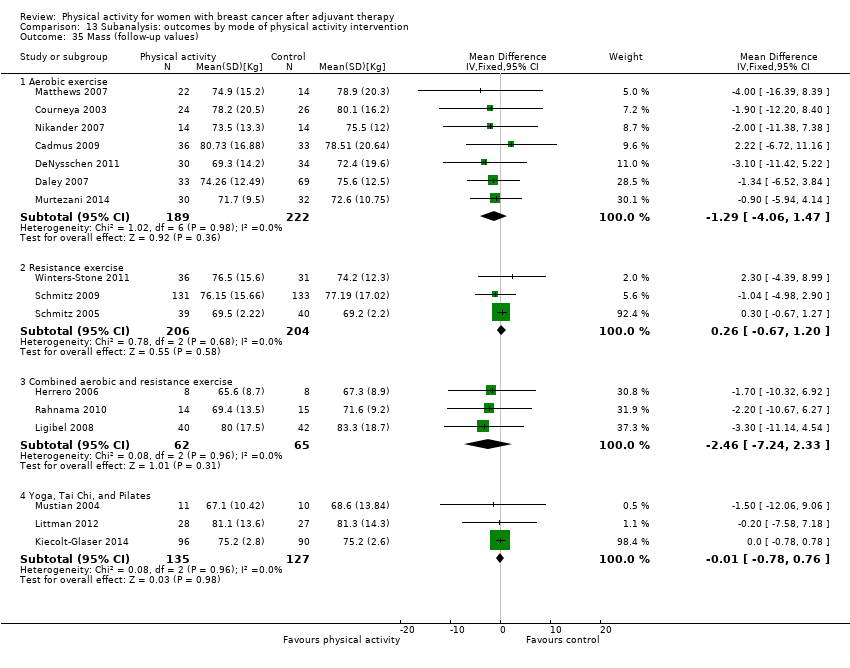
Comparison 13 Subanalysis: outcomes by mode of physical activity intervention, Outcome 35 Mass (follow‐up values).
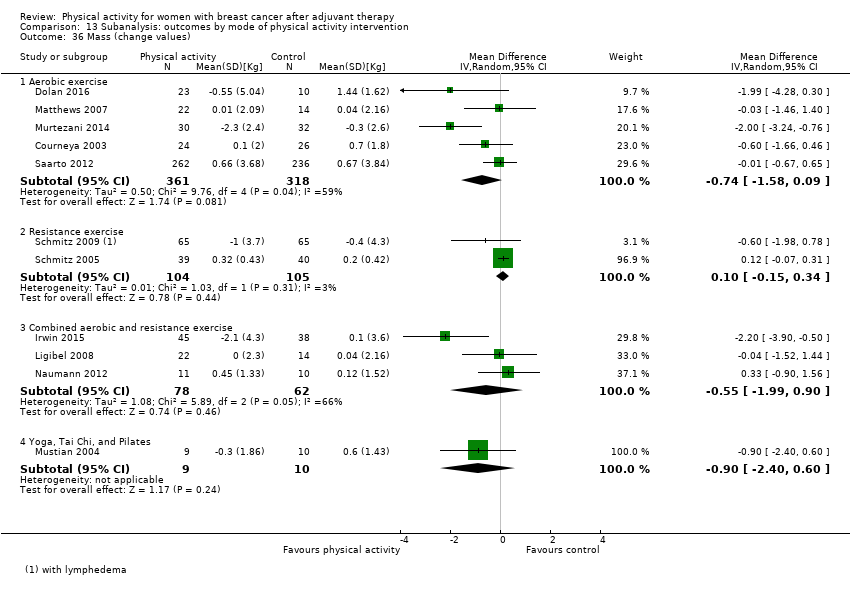
Comparison 13 Subanalysis: outcomes by mode of physical activity intervention, Outcome 36 Mass (change values).

Comparison 13 Subanalysis: outcomes by mode of physical activity intervention, Outcome 37 BMI (follow‐up values).

Comparison 13 Subanalysis: outcomes by mode of physical activity intervention, Outcome 38 BMI (change values).

Comparison 13 Subanalysis: outcomes by mode of physical activity intervention, Outcome 39 Overall body fat (follow‐up values).

Comparison 13 Subanalysis: outcomes by mode of physical activity intervention, Outcome 40 Overall body fat (change values).

Comparison 13 Subanalysis: outcomes by mode of physical activity intervention, Outcome 41 Lower body strength (follow‐up values).

Comparison 13 Subanalysis: outcomes by mode of physical activity intervention, Outcome 42 Lower body strength (change values).
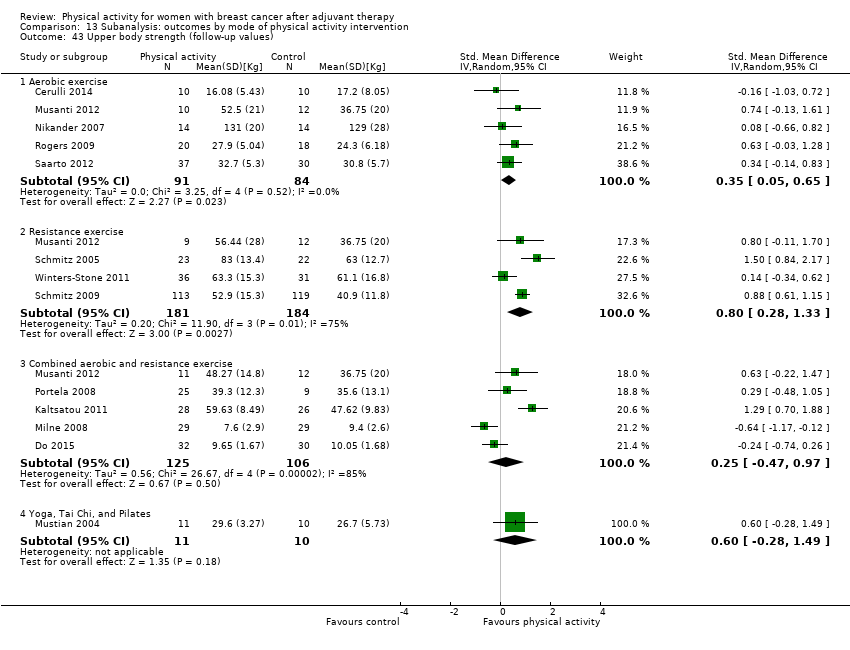
Comparison 13 Subanalysis: outcomes by mode of physical activity intervention, Outcome 43 Upper body strength (follow‐up values).

Comparison 13 Subanalysis: outcomes by mode of physical activity intervention, Outcome 44 Upper body strength (change values).
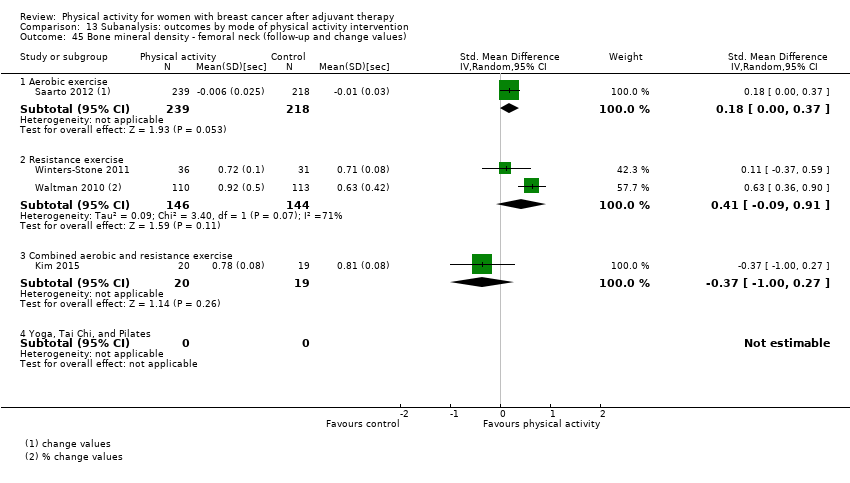
Comparison 13 Subanalysis: outcomes by mode of physical activity intervention, Outcome 45 Bone mineral density ‐ femoral neck (follow‐up and change values).

Comparison 13 Subanalysis: outcomes by mode of physical activity intervention, Outcome 46 Bone mineral density ‐ lumbar spine (follow‐up and change values).

Comparison 13 Subanalysis: outcomes by mode of physical activity intervention, Outcome 47 Bone mineral density ‐ total hip (follow‐up and change values).
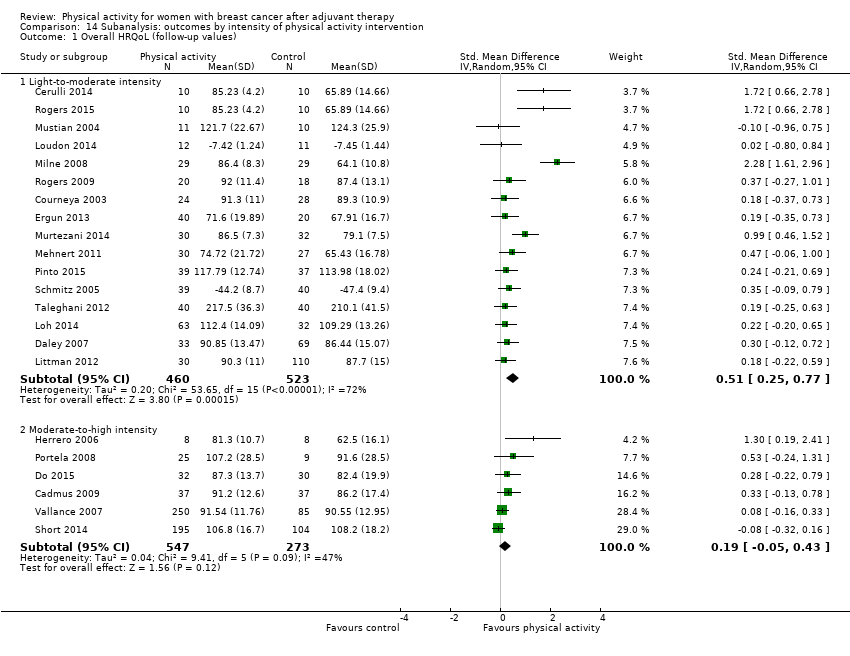
Comparison 14 Subanalysis: outcomes by intensity of physical activity intervention, Outcome 1 Overall HRQoL (follow‐up values).
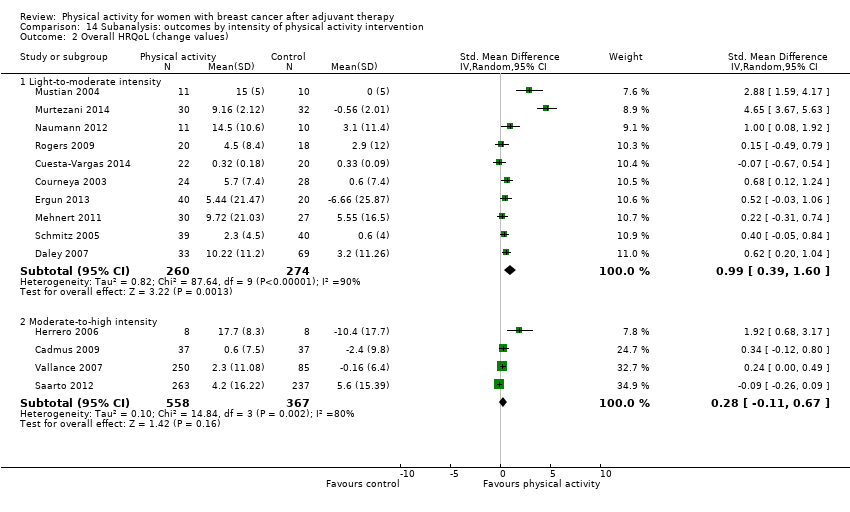
Comparison 14 Subanalysis: outcomes by intensity of physical activity intervention, Outcome 2 Overall HRQoL (change values).

Comparison 14 Subanalysis: outcomes by intensity of physical activity intervention, Outcome 3 Overall emotional function/mental health (follow‐up values).

Comparison 14 Subanalysis: outcomes by intensity of physical activity intervention, Outcome 4 Overall emotional function/mental health (change values).

Comparison 14 Subanalysis: outcomes by intensity of physical activity intervention, Outcome 5 Overall physical function (follow‐up values).

Comparison 14 Subanalysis: outcomes by intensity of physical activity intervention, Outcome 6 Overall physical function (change values).

Comparison 14 Subanalysis: outcomes by intensity of physical activity intervention, Outcome 7 Overall role function (follow‐up values).

Comparison 14 Subanalysis: outcomes by intensity of physical activity intervention, Outcome 8 Overall role function (change values).

Comparison 14 Subanalysis: outcomes by intensity of physical activity intervention, Outcome 9 Overall social well‐being/function (follow‐up values).
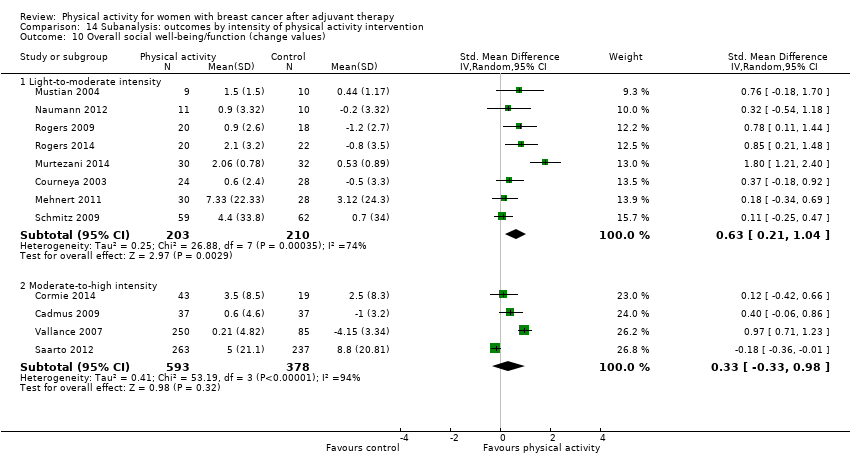
Comparison 14 Subanalysis: outcomes by intensity of physical activity intervention, Outcome 10 Overall social well‐being/function (change values).

Comparison 14 Subanalysis: outcomes by intensity of physical activity intervention, Outcome 11 Overall cognitive function (follow‐up values).
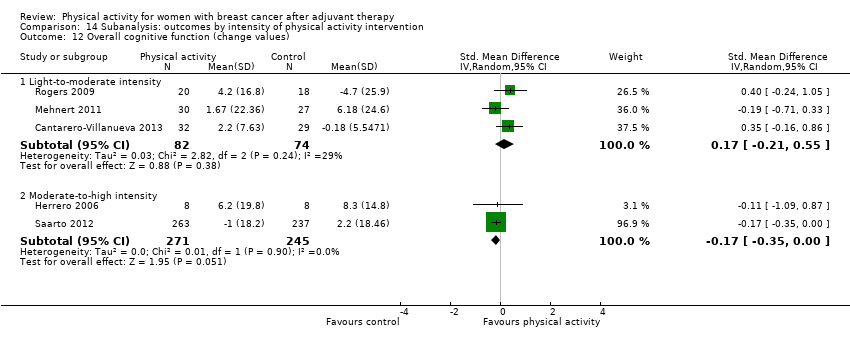
Comparison 14 Subanalysis: outcomes by intensity of physical activity intervention, Outcome 12 Overall cognitive function (change values).

Comparison 14 Subanalysis: outcomes by intensity of physical activity intervention, Outcome 13 Overall general health (follow‐up values).
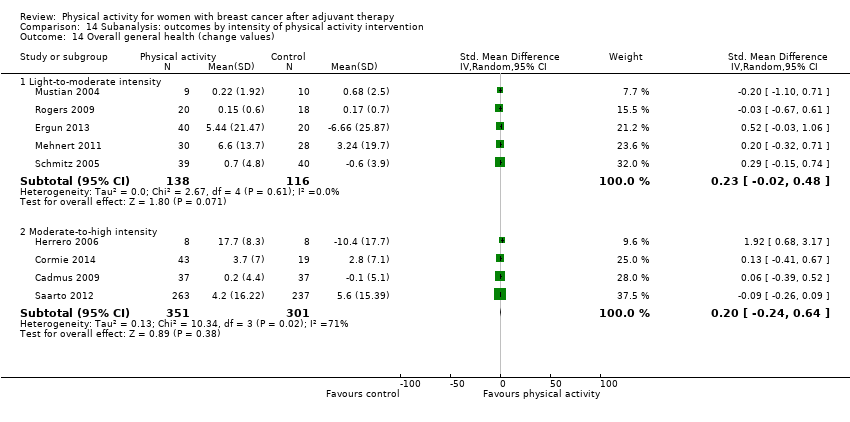
Comparison 14 Subanalysis: outcomes by intensity of physical activity intervention, Outcome 14 Overall general health (change values).
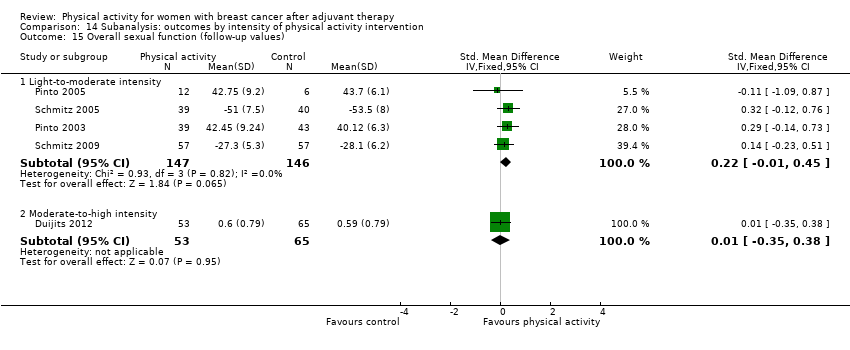
Comparison 14 Subanalysis: outcomes by intensity of physical activity intervention, Outcome 15 Overall sexual function (follow‐up values).

Comparison 14 Subanalysis: outcomes by intensity of physical activity intervention, Outcome 16 Overall sexual function (change values).
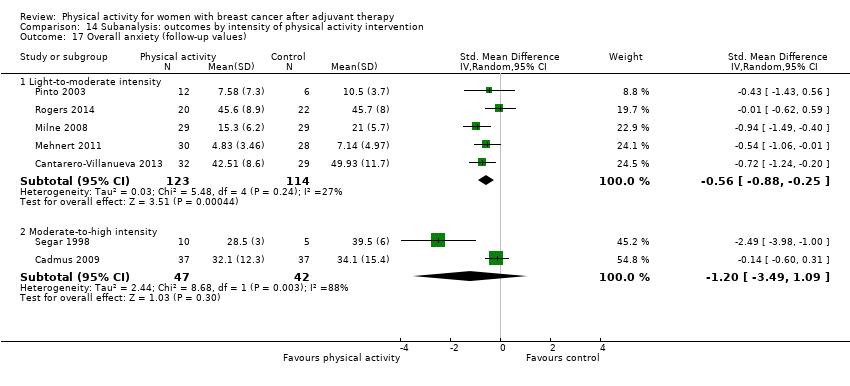
Comparison 14 Subanalysis: outcomes by intensity of physical activity intervention, Outcome 17 Overall anxiety (follow‐up values).
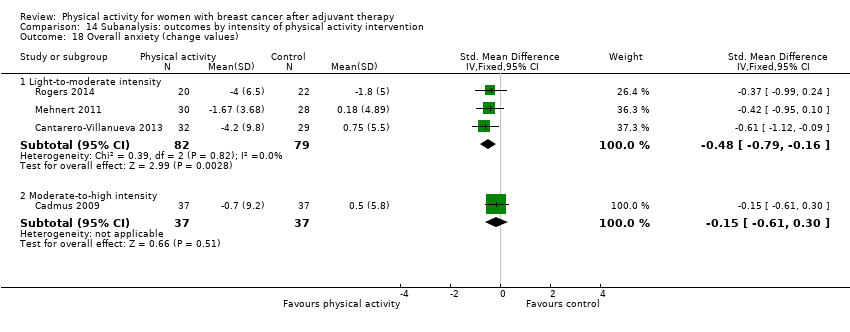
Comparison 14 Subanalysis: outcomes by intensity of physical activity intervention, Outcome 18 Overall anxiety (change values).

Comparison 14 Subanalysis: outcomes by intensity of physical activity intervention, Outcome 19 Overall depression (follow‐up values).

Comparison 14 Subanalysis: outcomes by intensity of physical activity intervention, Outcome 20 Overall depression (change values).

Comparison 14 Subanalysis: outcomes by intensity of physical activity intervention, Outcome 21 Overall fatigue (follow‐up values).

Comparison 14 Subanalysis: outcomes by intensity of physical activity intervention, Outcome 22 Overall fatigue (change values).

Comparison 14 Subanalysis: outcomes by intensity of physical activity intervention, Outcome 23 Overall pain/disability (follow‐up values).

Comparison 14 Subanalysis: outcomes by intensity of physical activity intervention, Outcome 24 Overall pain/disability (change values).

Comparison 14 Subanalysis: outcomes by intensity of physical activity intervention, Outcome 25 Overall self‐esteem/body image (follow‐up values).

Comparison 14 Subanalysis: outcomes by intensity of physical activity intervention, Outcome 26 Overall self‐esteem/body image (change values).
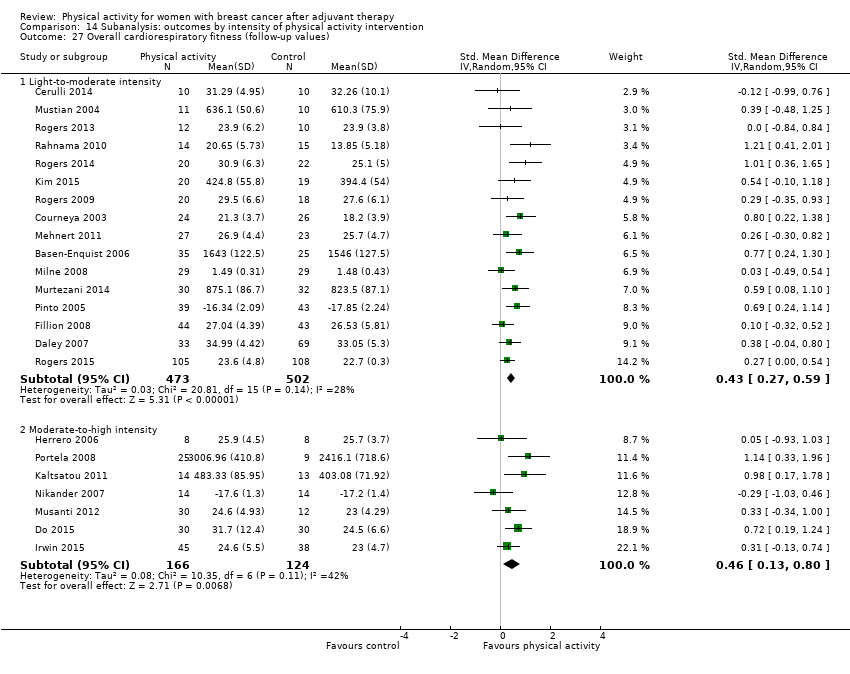
Comparison 14 Subanalysis: outcomes by intensity of physical activity intervention, Outcome 27 Overall cardiorespiratory fitness (follow‐up values).

Comparison 14 Subanalysis: outcomes by intensity of physical activity intervention, Outcome 28 Overall cardiorespiratory fitness (change values).
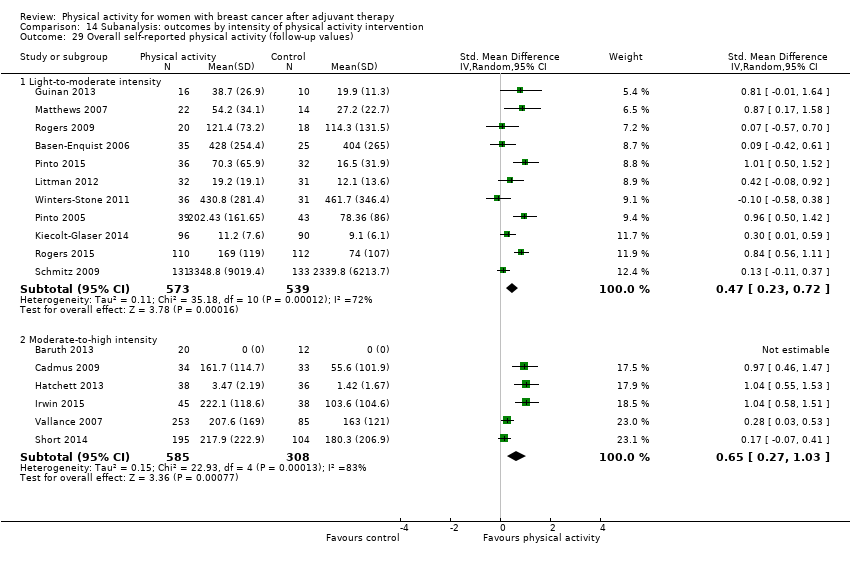
Comparison 14 Subanalysis: outcomes by intensity of physical activity intervention, Outcome 29 Overall self‐reported physical activity (follow‐up values).

Comparison 14 Subanalysis: outcomes by intensity of physical activity intervention, Outcome 30 Overall self‐reported physical activity (change values).
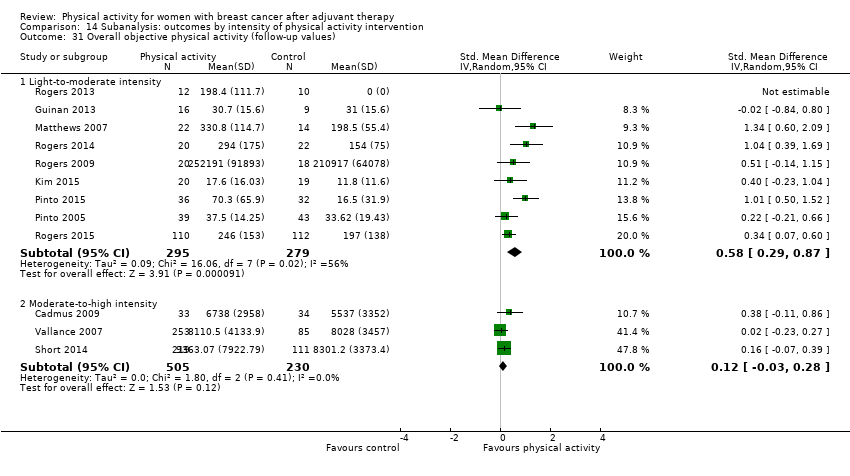
Comparison 14 Subanalysis: outcomes by intensity of physical activity intervention, Outcome 31 Overall objective physical activity (follow‐up values).

Comparison 14 Subanalysis: outcomes by intensity of physical activity intervention, Outcome 32 Overall objective physical activity (change values).

Comparison 14 Subanalysis: outcomes by intensity of physical activity intervention, Outcome 33 Mass (follow‐up values).

Comparison 14 Subanalysis: outcomes by intensity of physical activity intervention, Outcome 34 Mass (change values).

Comparison 14 Subanalysis: outcomes by intensity of physical activity intervention, Outcome 35 BMI (follow‐up values).

Comparison 14 Subanalysis: outcomes by intensity of physical activity intervention, Outcome 36 BMI (change values).

Comparison 14 Subanalysis: outcomes by intensity of physical activity intervention, Outcome 37 Overall body fat (follow‐up values).

Comparison 14 Subanalysis: outcomes by intensity of physical activity intervention, Outcome 38 Overall body fat (change values).

Comparison 14 Subanalysis: outcomes by intensity of physical activity intervention, Outcome 39 Lower body strength (follow‐up values).

Comparison 14 Subanalysis: outcomes by intensity of physical activity intervention, Outcome 40 Lower body strength (change values).

Comparison 14 Subanalysis: outcomes by intensity of physical activity intervention, Outcome 41 Upper body strength (follow‐up values).
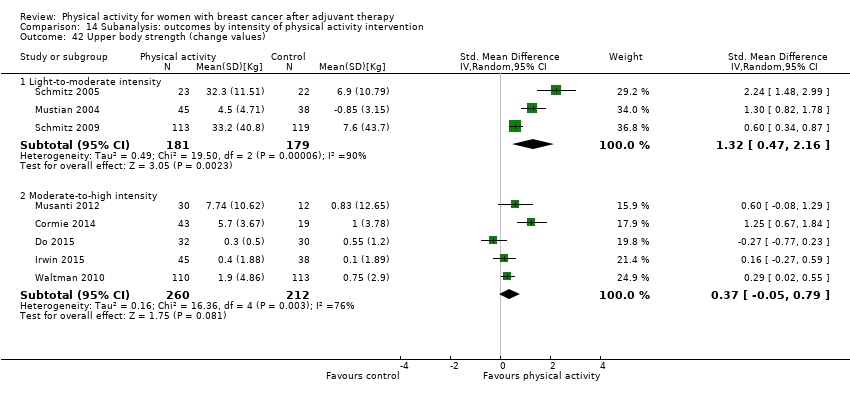
Comparison 14 Subanalysis: outcomes by intensity of physical activity intervention, Outcome 42 Upper body strength (change values).
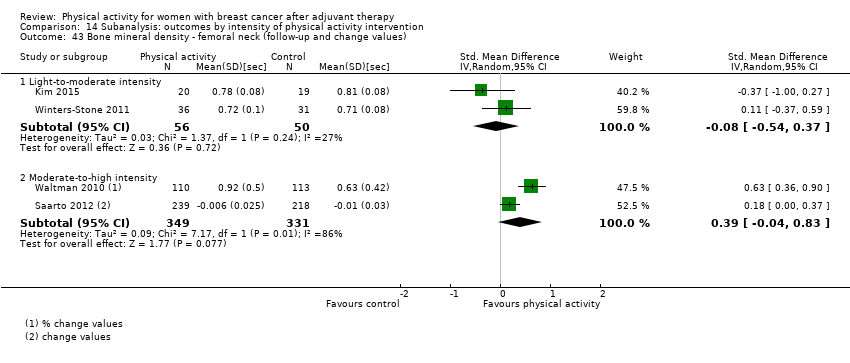
Comparison 14 Subanalysis: outcomes by intensity of physical activity intervention, Outcome 43 Bone mineral density ‐ femoral neck (follow‐up and change values).
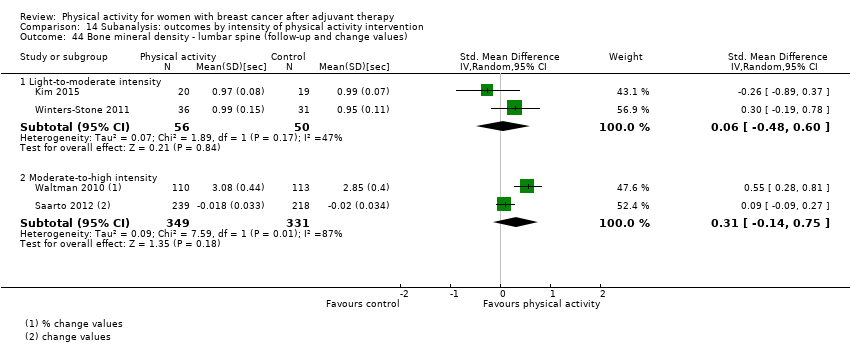
Comparison 14 Subanalysis: outcomes by intensity of physical activity intervention, Outcome 44 Bone mineral density ‐ lumbar spine (follow‐up and change values).

Comparison 14 Subanalysis: outcomes by intensity of physical activity intervention, Outcome 45 Bone mineral density ‐ total hip (follow‐up and change values).

Comparison 15 Subanalysis: outcomes by duration of physical activity intervention, Outcome 1 Overall HRQoL (follow‐up values).

Comparison 15 Subanalysis: outcomes by duration of physical activity intervention, Outcome 2 Overall HRQoL (change values).

Comparison 15 Subanalysis: outcomes by duration of physical activity intervention, Outcome 3 Overall emotional function/mental health (follow‐up values).
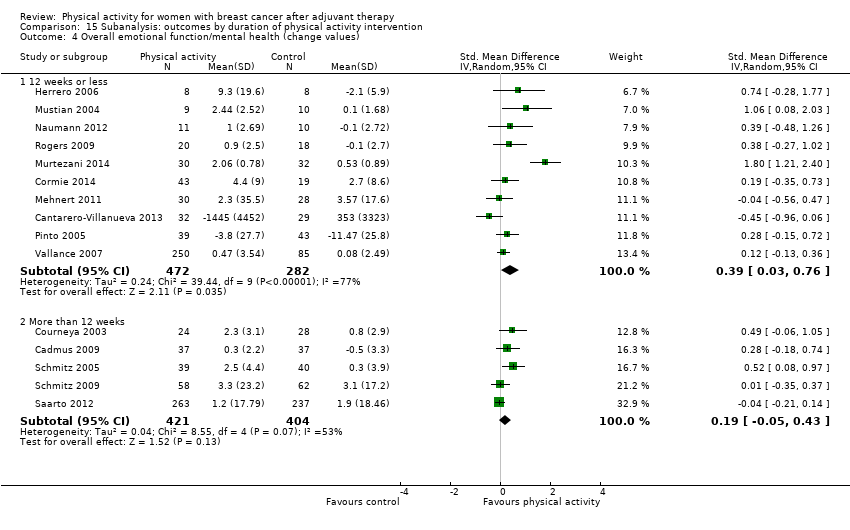
Comparison 15 Subanalysis: outcomes by duration of physical activity intervention, Outcome 4 Overall emotional function/mental health (change values).
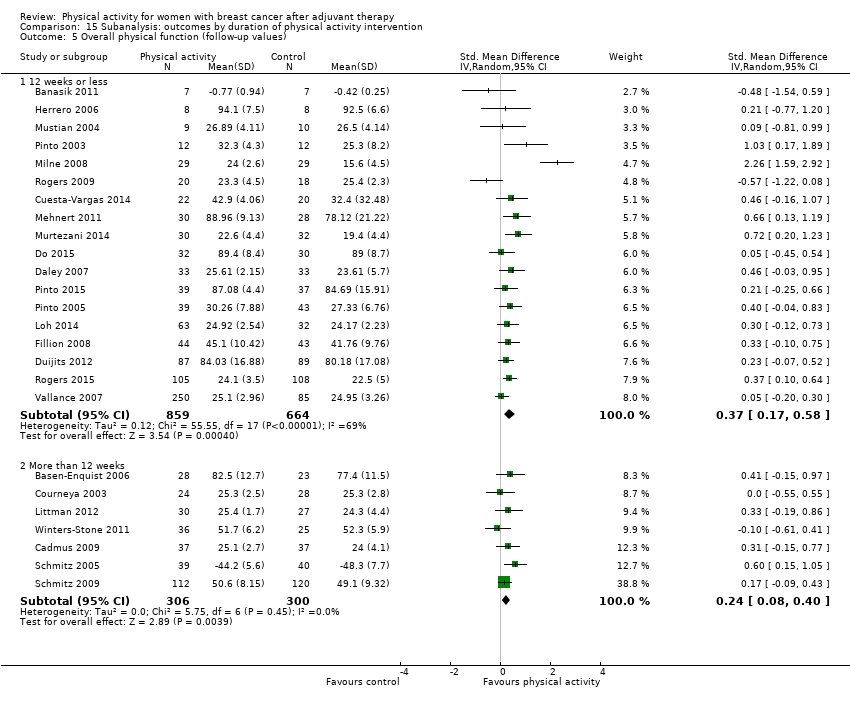
Comparison 15 Subanalysis: outcomes by duration of physical activity intervention, Outcome 5 Overall physical function (follow‐up values).

Comparison 15 Subanalysis: outcomes by duration of physical activity intervention, Outcome 6 Overall physical function (change values).

Comparison 15 Subanalysis: outcomes by duration of physical activity intervention, Outcome 7 Overall role function (follow‐up values).

Comparison 15 Subanalysis: outcomes by duration of physical activity intervention, Outcome 8 Overall role function (change values).

Comparison 15 Subanalysis: outcomes by duration of physical activity intervention, Outcome 9 Overall social well‐being/function (follow‐up values).

Comparison 15 Subanalysis: outcomes by duration of physical activity intervention, Outcome 10 Overall social well‐being/function (change values).

Comparison 15 Subanalysis: outcomes by duration of physical activity intervention, Outcome 11 Overall cognitive function (follow‐up values).

Comparison 15 Subanalysis: outcomes by duration of physical activity intervention, Outcome 12 Overall cognitive function (change values).

Comparison 15 Subanalysis: outcomes by duration of physical activity intervention, Outcome 13 Overall general health (follow‐up values).

Comparison 15 Subanalysis: outcomes by duration of physical activity intervention, Outcome 14 Overall general health (change values).

Comparison 15 Subanalysis: outcomes by duration of physical activity intervention, Outcome 15 Overall sexual function (follow‐up values).
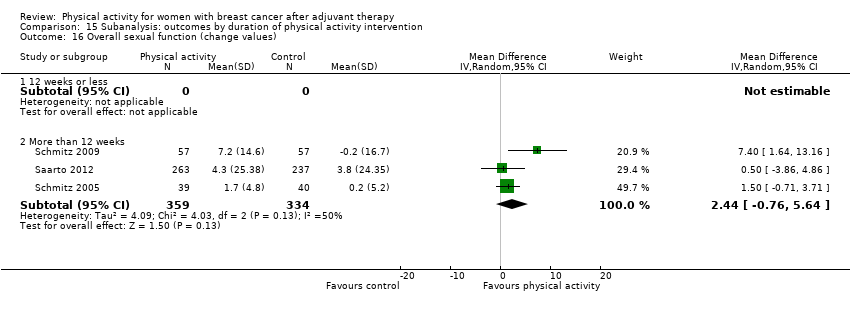
Comparison 15 Subanalysis: outcomes by duration of physical activity intervention, Outcome 16 Overall sexual function (change values).
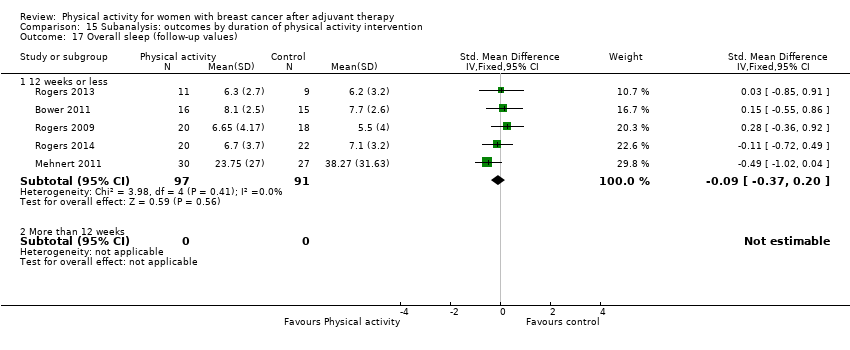
Comparison 15 Subanalysis: outcomes by duration of physical activity intervention, Outcome 17 Overall sleep (follow‐up values).
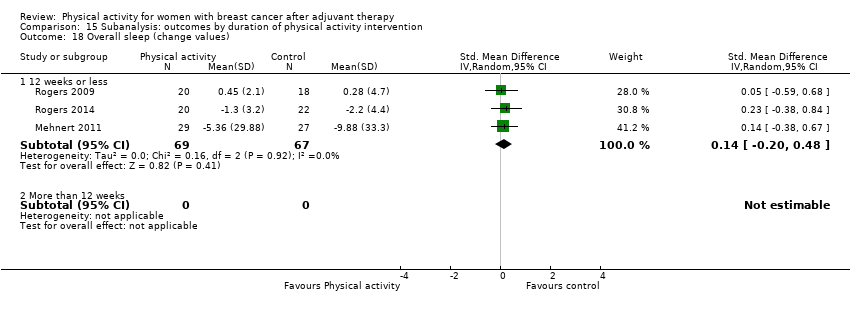
Comparison 15 Subanalysis: outcomes by duration of physical activity intervention, Outcome 18 Overall sleep (change values).
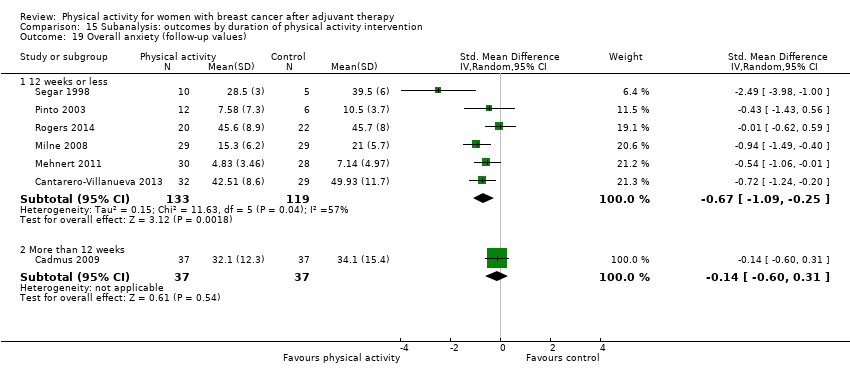
Comparison 15 Subanalysis: outcomes by duration of physical activity intervention, Outcome 19 Overall anxiety (follow‐up values).
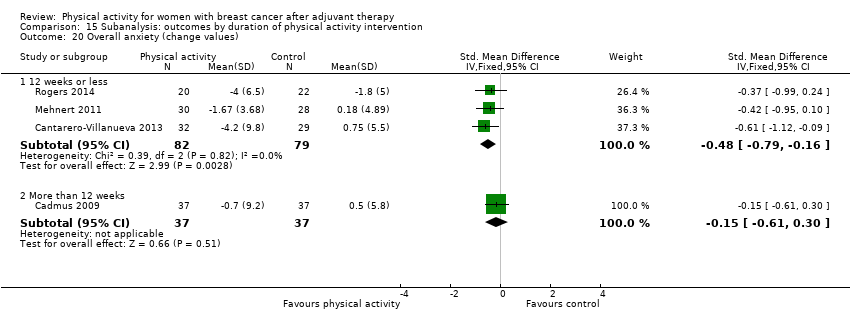
Comparison 15 Subanalysis: outcomes by duration of physical activity intervention, Outcome 20 Overall anxiety (change values).

Comparison 15 Subanalysis: outcomes by duration of physical activity intervention, Outcome 21 Overall depression (follow‐up values).

Comparison 15 Subanalysis: outcomes by duration of physical activity intervention, Outcome 22 Overall depression (change values).
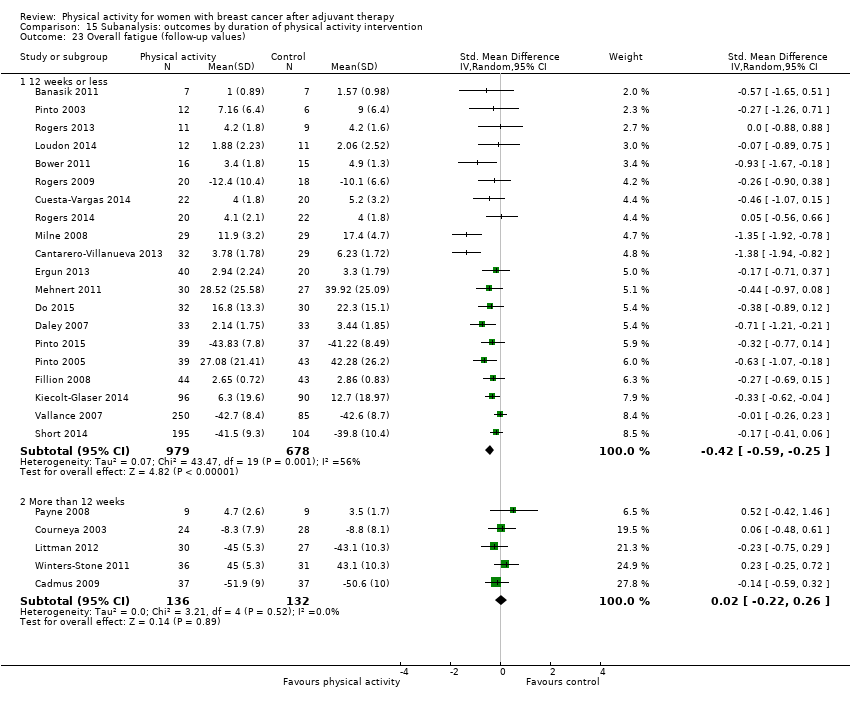
Comparison 15 Subanalysis: outcomes by duration of physical activity intervention, Outcome 23 Overall fatigue (follow‐up values).

Comparison 15 Subanalysis: outcomes by duration of physical activity intervention, Outcome 24 Overall fatigue (change values).

Comparison 15 Subanalysis: outcomes by duration of physical activity intervention, Outcome 25 Overall pain/disability (follow‐up values).

Comparison 15 Subanalysis: outcomes by duration of physical activity intervention, Outcome 26 Overall pain/disability (change values).

Comparison 15 Subanalysis: outcomes by duration of physical activity intervention, Outcome 27 Overall self‐esteem/body image (follow‐up values).

Comparison 15 Subanalysis: outcomes by duration of physical activity intervention, Outcome 28 Overall self‐esteem/body image (change values).

Comparison 15 Subanalysis: outcomes by duration of physical activity intervention, Outcome 29 Overall cardiorespiratory fitness (follow‐up values).
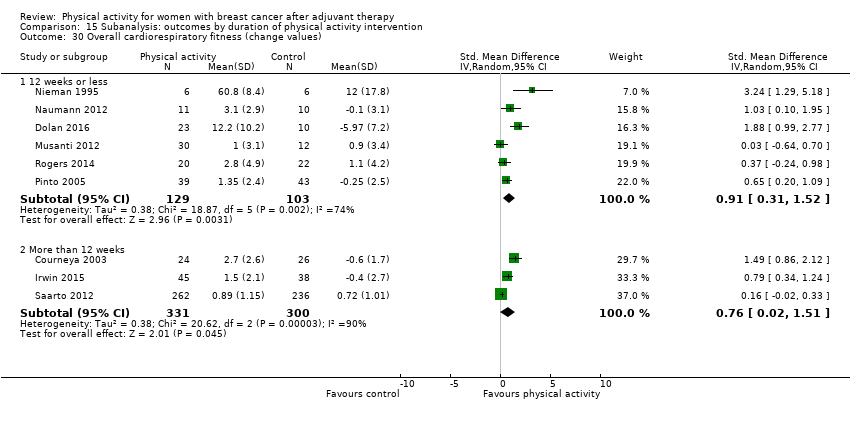
Comparison 15 Subanalysis: outcomes by duration of physical activity intervention, Outcome 30 Overall cardiorespiratory fitness (change values).
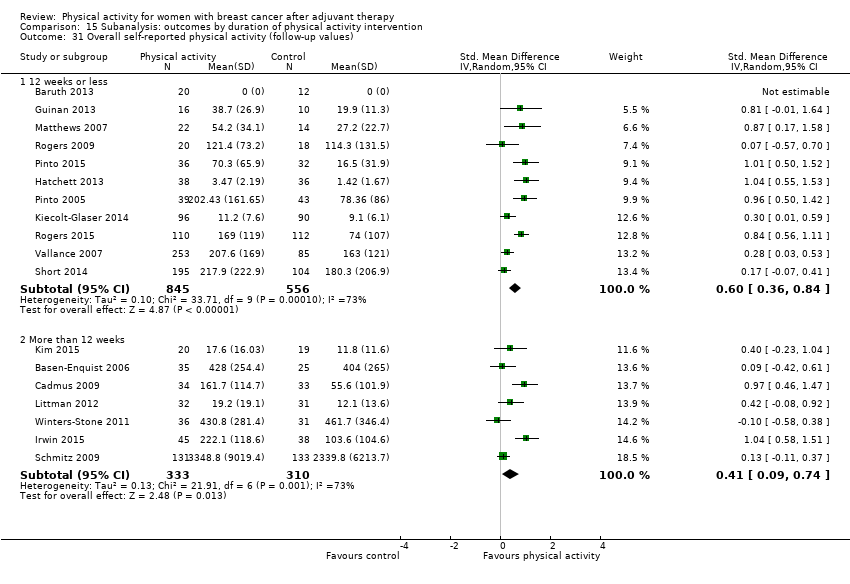
Comparison 15 Subanalysis: outcomes by duration of physical activity intervention, Outcome 31 Overall self‐reported physical activity (follow‐up values).

Comparison 15 Subanalysis: outcomes by duration of physical activity intervention, Outcome 32 Overall self‐reported physical activity (change values).
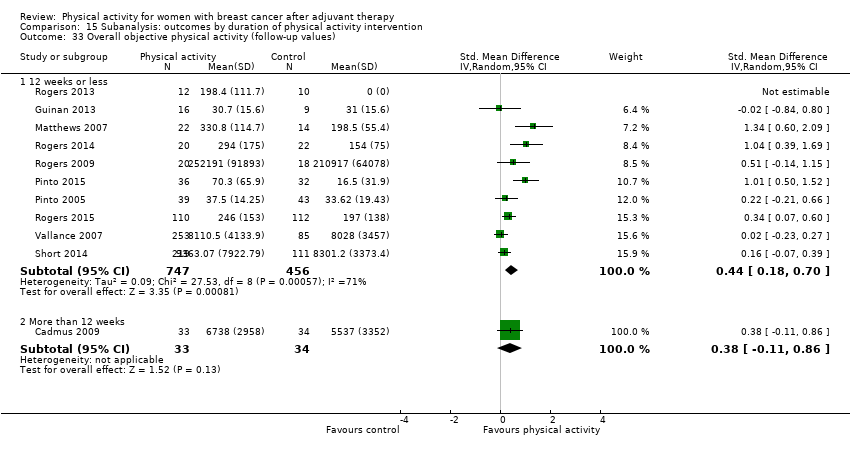
Comparison 15 Subanalysis: outcomes by duration of physical activity intervention, Outcome 33 Overall objective physical activity (follow‐up values).
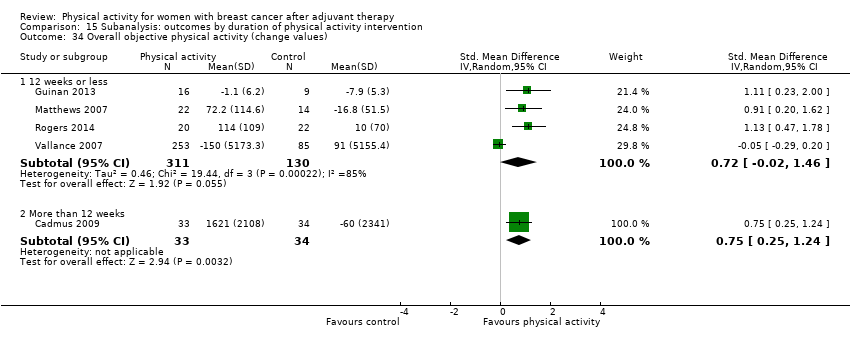
Comparison 15 Subanalysis: outcomes by duration of physical activity intervention, Outcome 34 Overall objective physical activity (change values).
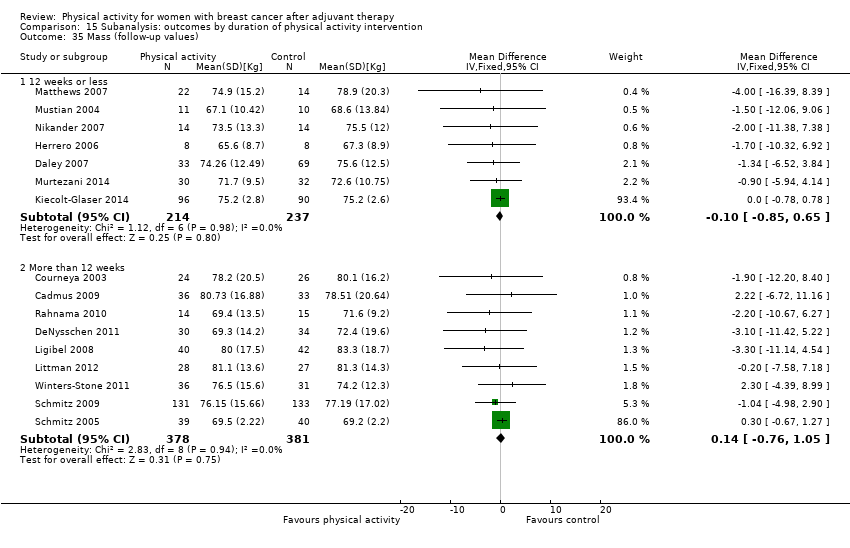
Comparison 15 Subanalysis: outcomes by duration of physical activity intervention, Outcome 35 Mass (follow‐up values).

Comparison 15 Subanalysis: outcomes by duration of physical activity intervention, Outcome 36 Mass (change values).

Comparison 15 Subanalysis: outcomes by duration of physical activity intervention, Outcome 37 BMI (follow‐up values).
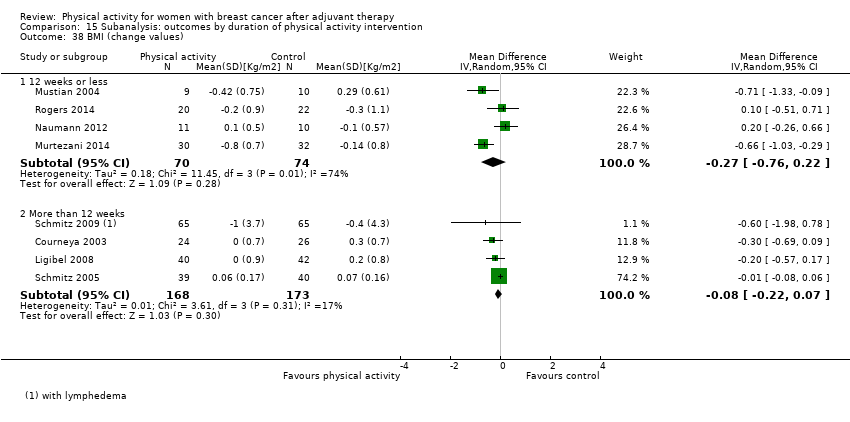
Comparison 15 Subanalysis: outcomes by duration of physical activity intervention, Outcome 38 BMI (change values).
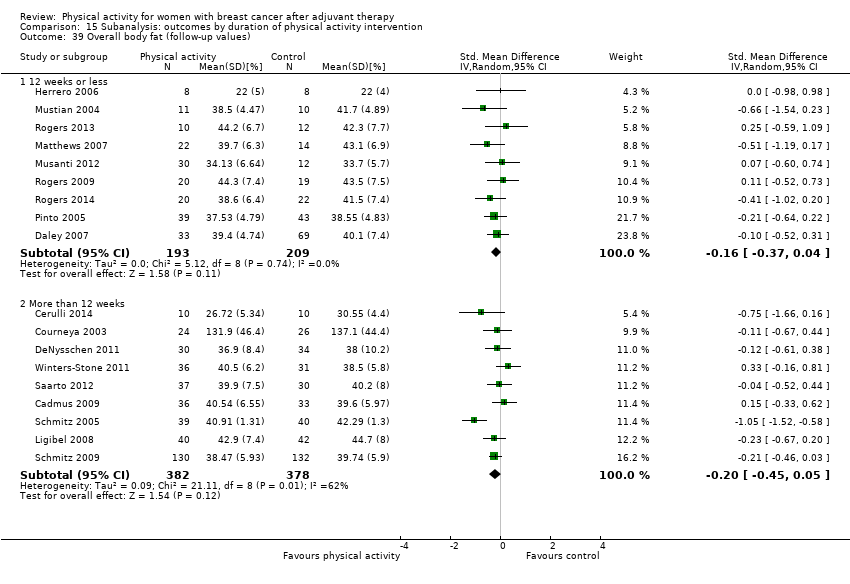
Comparison 15 Subanalysis: outcomes by duration of physical activity intervention, Outcome 39 Overall body fat (follow‐up values).

Comparison 15 Subanalysis: outcomes by duration of physical activity intervention, Outcome 40 Overall body fat (change values).
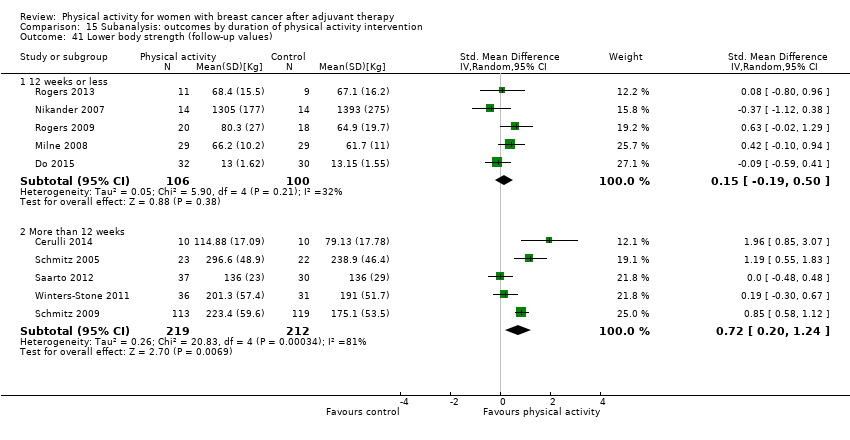
Comparison 15 Subanalysis: outcomes by duration of physical activity intervention, Outcome 41 Lower body strength (follow‐up values).

Comparison 15 Subanalysis: outcomes by duration of physical activity intervention, Outcome 42 Lower body strength (change values).

Comparison 15 Subanalysis: outcomes by duration of physical activity intervention, Outcome 43 Upper body strength (follow‐up values).
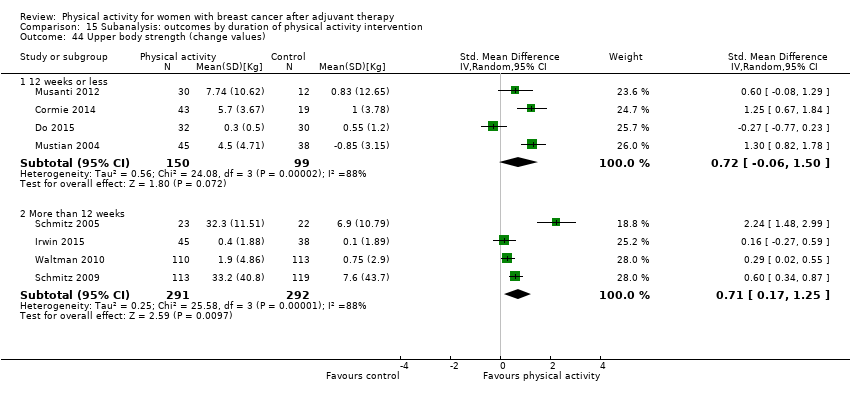
Comparison 15 Subanalysis: outcomes by duration of physical activity intervention, Outcome 44 Upper body strength (change values).

Comparison 16 Subanalysis: outcomes by format of intervention, Outcome 1 Overall HRQoL (follow‐up values).

Comparison 16 Subanalysis: outcomes by format of intervention, Outcome 2 Overall HRQoL (change values).

Comparison 16 Subanalysis: outcomes by format of intervention, Outcome 3 Overall emotional function/mental health (follow‐up values).

Comparison 16 Subanalysis: outcomes by format of intervention, Outcome 4 Overall emotional function/mental health (change values).
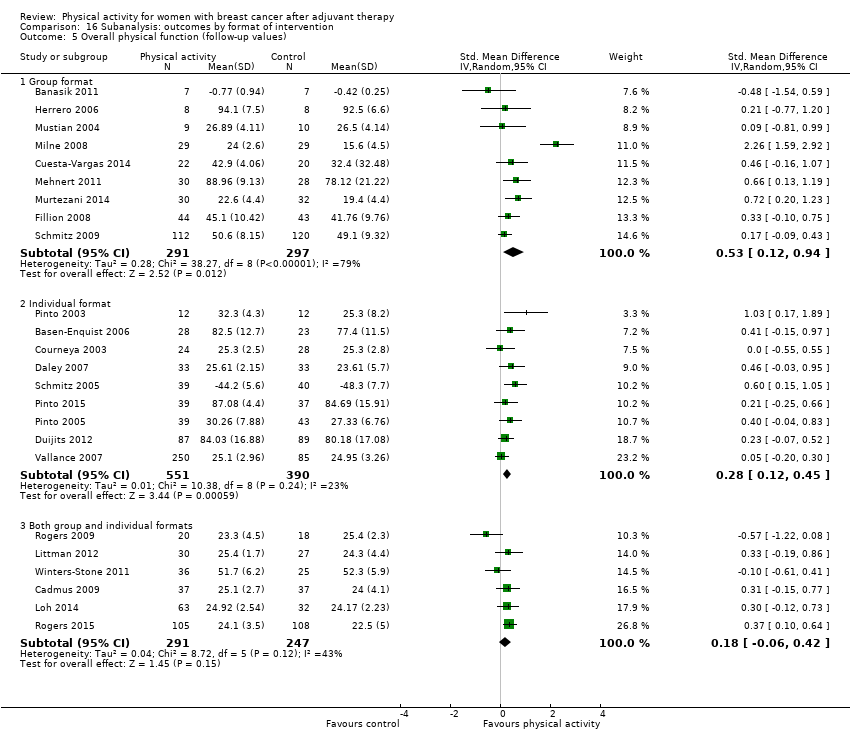
Comparison 16 Subanalysis: outcomes by format of intervention, Outcome 5 Overall physical function (follow‐up values).

Comparison 16 Subanalysis: outcomes by format of intervention, Outcome 6 Overall physical function (change values).
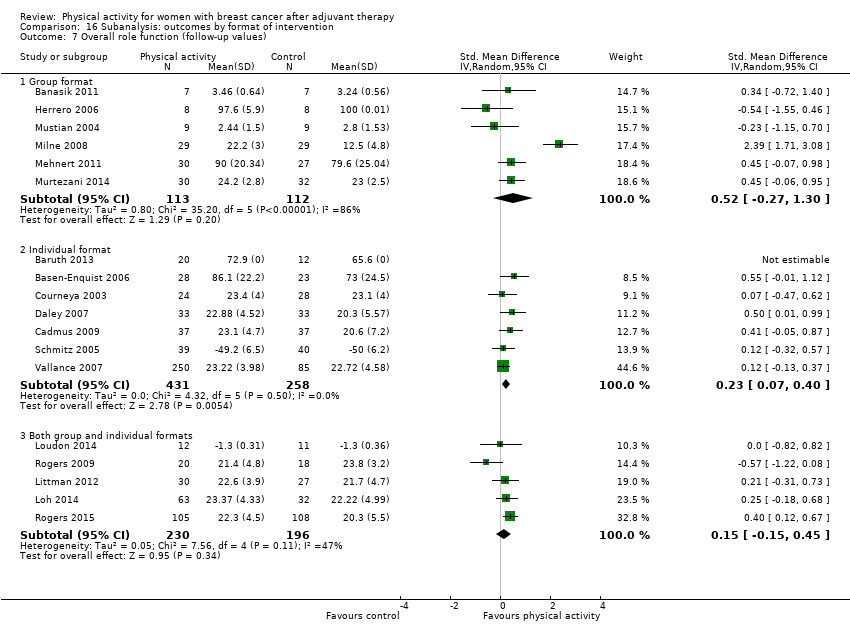
Comparison 16 Subanalysis: outcomes by format of intervention, Outcome 7 Overall role function (follow‐up values).

Comparison 16 Subanalysis: outcomes by format of intervention, Outcome 8 Overall role function (change values).
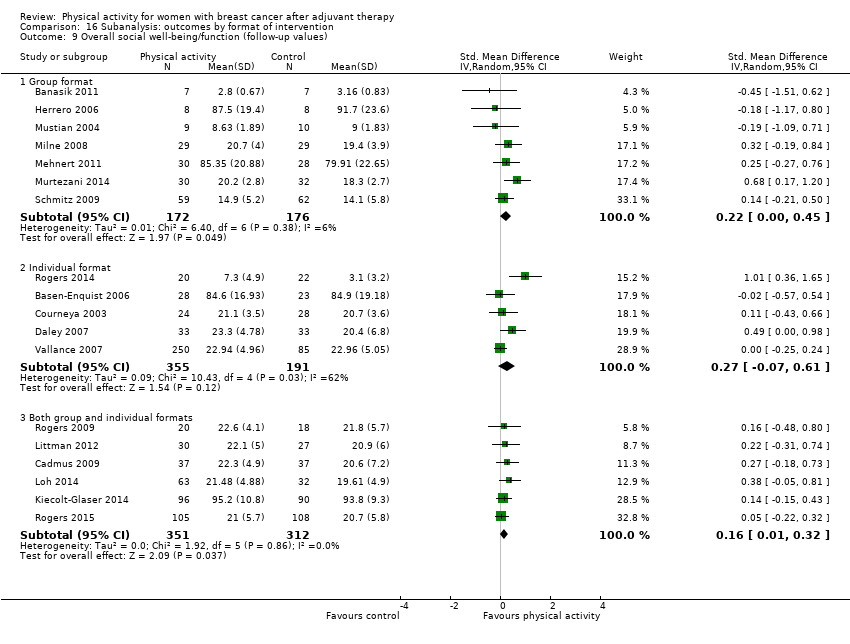
Comparison 16 Subanalysis: outcomes by format of intervention, Outcome 9 Overall social well‐being/function (follow‐up values).

Comparison 16 Subanalysis: outcomes by format of intervention, Outcome 10 Overall social well‐being/function (change values).

Comparison 16 Subanalysis: outcomes by format of intervention, Outcome 11 Overall cognitive function (follow‐up values).

Comparison 16 Subanalysis: outcomes by format of intervention, Outcome 12 Overall cognitive function (change values).

Comparison 16 Subanalysis: outcomes by format of intervention, Outcome 13 Overall general health (follow‐up values).

Comparison 16 Subanalysis: outcomes by format of intervention, Outcome 14 Overall general health (change values).

Comparison 16 Subanalysis: outcomes by format of intervention, Outcome 15 Overall sexual function (follow‐up values).

Comparison 16 Subanalysis: outcomes by format of intervention, Outcome 16 Overall sleep (follow‐up values).
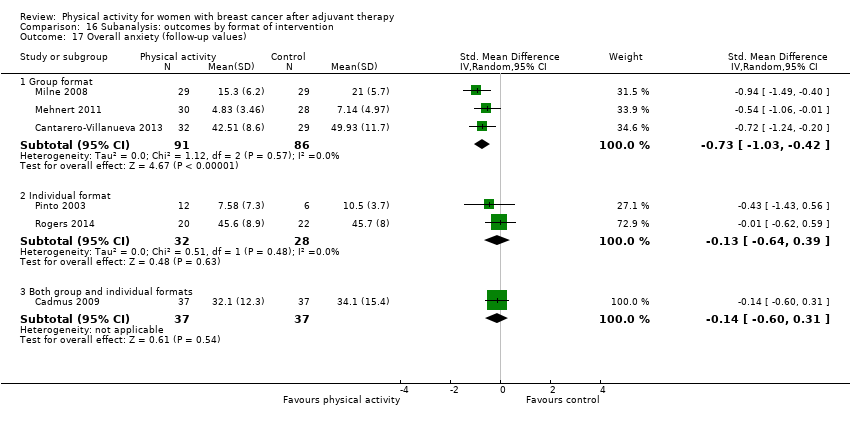
Comparison 16 Subanalysis: outcomes by format of intervention, Outcome 17 Overall anxiety (follow‐up values).

Comparison 16 Subanalysis: outcomes by format of intervention, Outcome 18 Overall anxiety (change values).

Comparison 16 Subanalysis: outcomes by format of intervention, Outcome 19 Overall depression (change values).

Comparison 16 Subanalysis: outcomes by format of intervention, Outcome 20 Overall depression (follow‐up values).

Comparison 16 Subanalysis: outcomes by format of intervention, Outcome 21 Overall fatigue (follow‐up values).
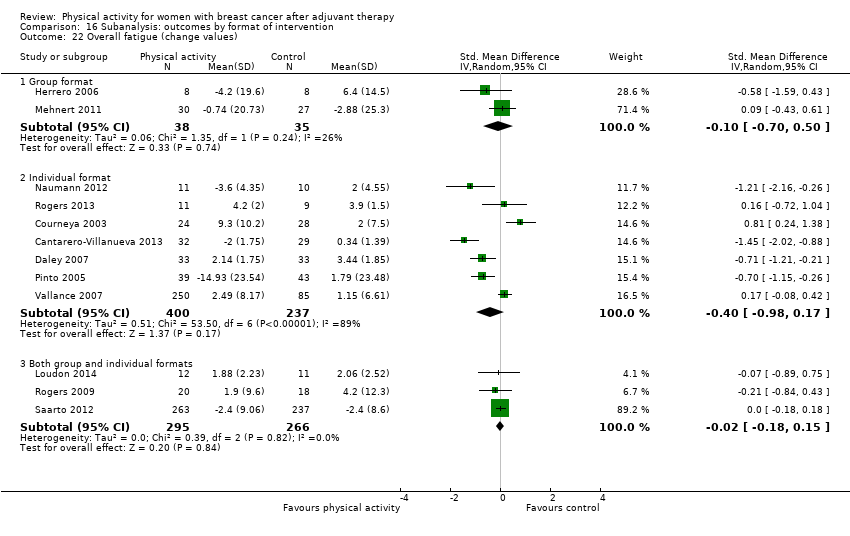
Comparison 16 Subanalysis: outcomes by format of intervention, Outcome 22 Overall fatigue (change values).
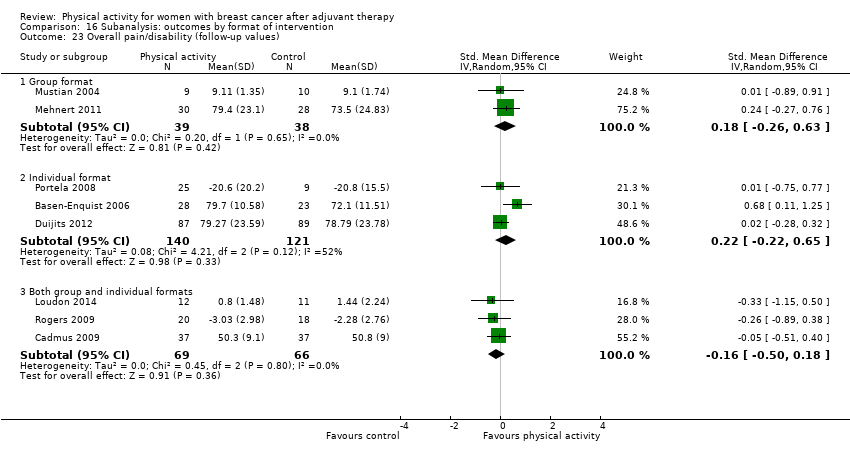
Comparison 16 Subanalysis: outcomes by format of intervention, Outcome 23 Overall pain/disability (follow‐up values).
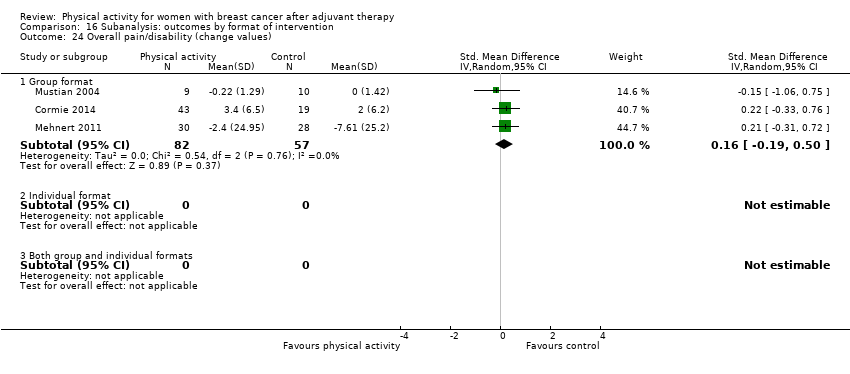
Comparison 16 Subanalysis: outcomes by format of intervention, Outcome 24 Overall pain/disability (change values).

Comparison 16 Subanalysis: outcomes by format of intervention, Outcome 25 Overall self‐esteem/body image (follow‐up values).
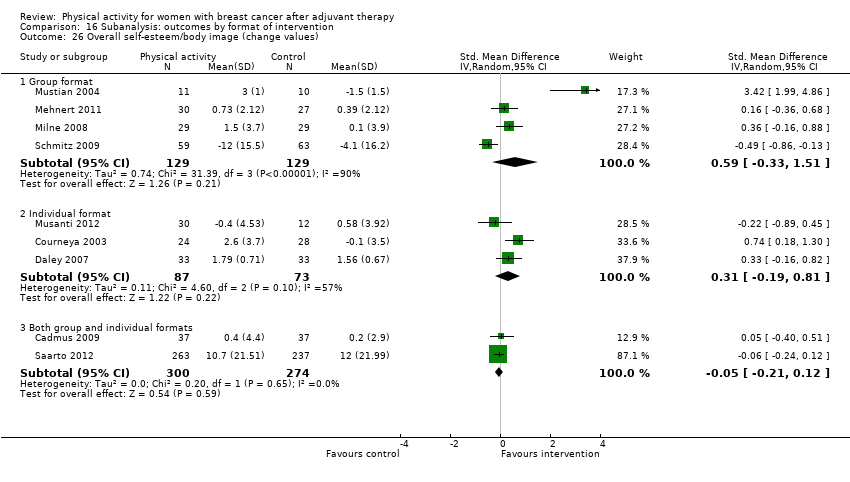
Comparison 16 Subanalysis: outcomes by format of intervention, Outcome 26 Overall self‐esteem/body image (change values).

Comparison 16 Subanalysis: outcomes by format of intervention, Outcome 27 Overall cardiorespiratory fitness (follow‐up values).
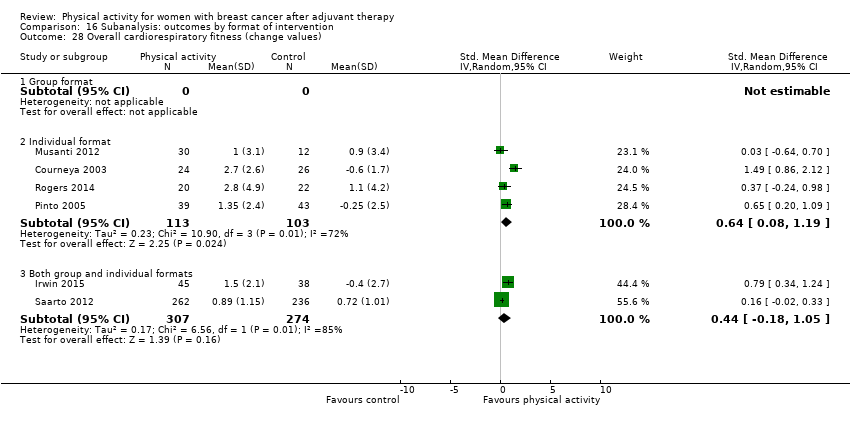
Comparison 16 Subanalysis: outcomes by format of intervention, Outcome 28 Overall cardiorespiratory fitness (change values).
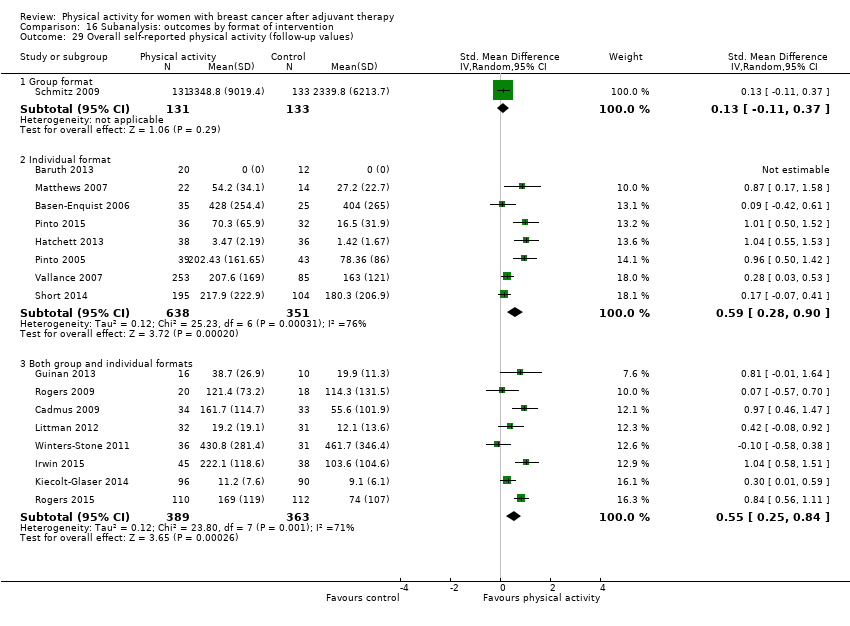
Comparison 16 Subanalysis: outcomes by format of intervention, Outcome 29 Overall self‐reported physical activity (follow‐up values).

Comparison 16 Subanalysis: outcomes by format of intervention, Outcome 30 Overall self‐reported physical activity (change values).
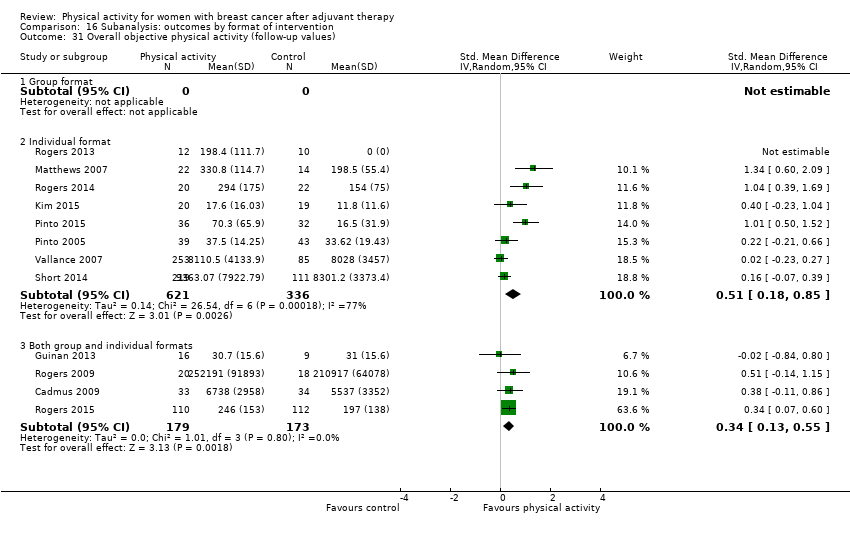
Comparison 16 Subanalysis: outcomes by format of intervention, Outcome 31 Overall objective physical activity (follow‐up values).
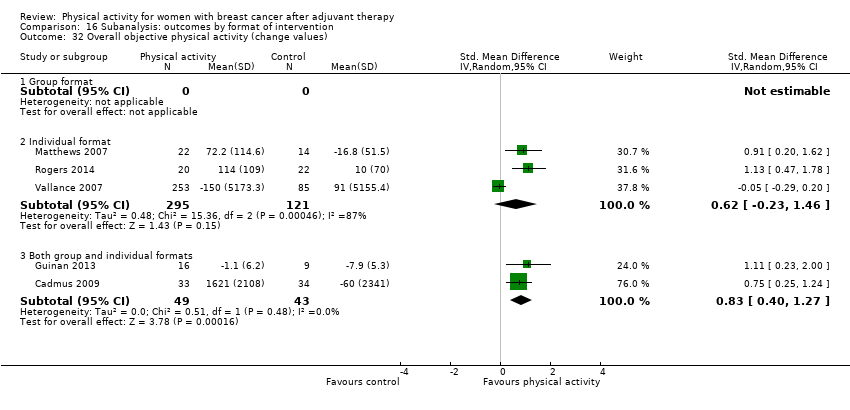
Comparison 16 Subanalysis: outcomes by format of intervention, Outcome 32 Overall objective physical activity (change values).
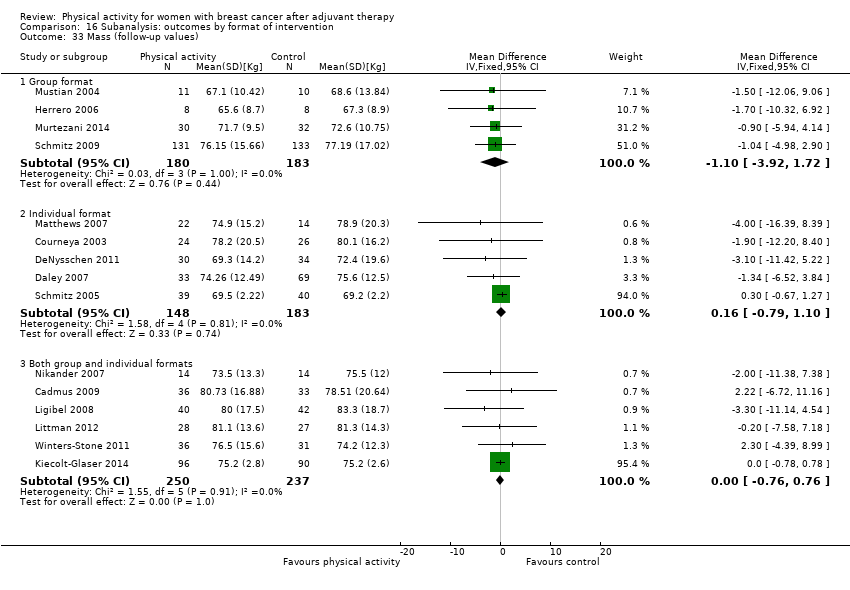
Comparison 16 Subanalysis: outcomes by format of intervention, Outcome 33 Mass (follow‐up values).

Comparison 16 Subanalysis: outcomes by format of intervention, Outcome 34 Mass (change values).

Comparison 16 Subanalysis: outcomes by format of intervention, Outcome 35 BMI (follow‐up values).

Comparison 16 Subanalysis: outcomes by format of intervention, Outcome 36 BMI (change values).

Comparison 16 Subanalysis: outcomes by format of intervention, Outcome 37 Overall body fat (follow‐up values).
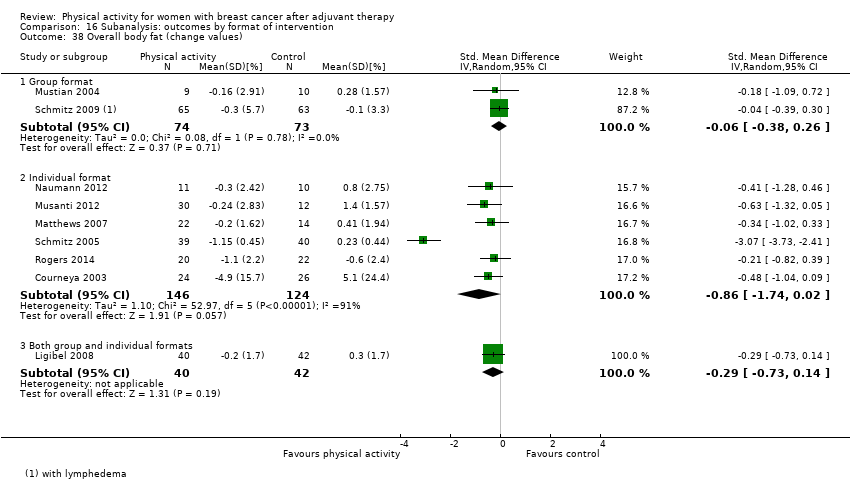
Comparison 16 Subanalysis: outcomes by format of intervention, Outcome 38 Overall body fat (change values).
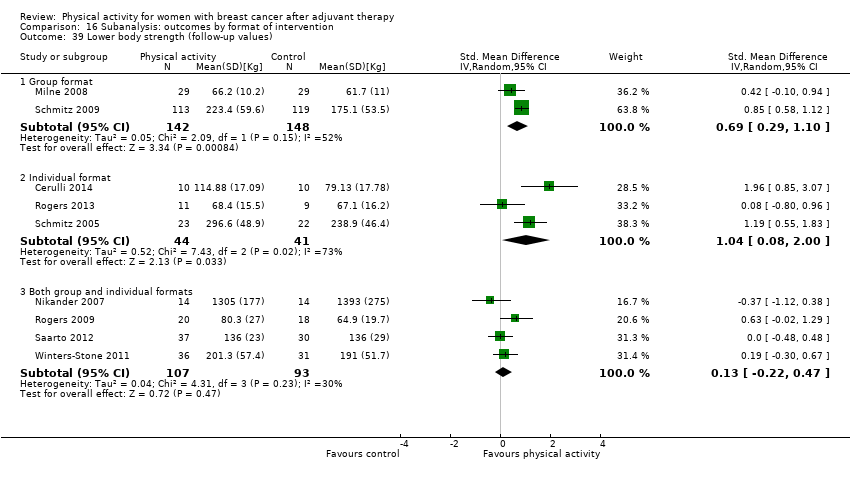
Comparison 16 Subanalysis: outcomes by format of intervention, Outcome 39 Lower body strength (follow‐up values).

Comparison 16 Subanalysis: outcomes by format of intervention, Outcome 40 Lower body strength (change values).
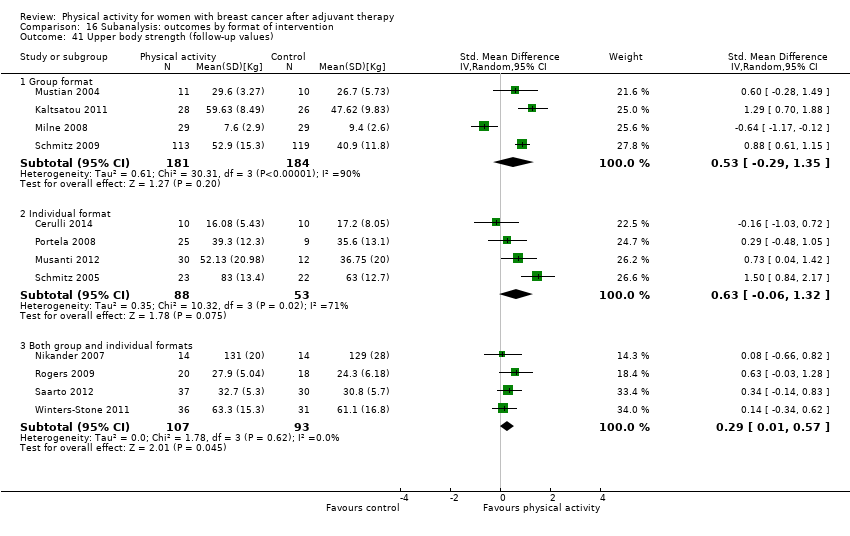
Comparison 16 Subanalysis: outcomes by format of intervention, Outcome 41 Upper body strength (follow‐up values).

Comparison 16 Subanalysis: outcomes by format of intervention, Outcome 42 Upper body strength (change values).

Comparison 16 Subanalysis: outcomes by format of intervention, Outcome 43 Bone mineral density ‐ femoral neck (follow‐up and change values).

Comparison 16 Subanalysis: outcomes by format of intervention, Outcome 44 Bone mineral density ‐ lumbar spine (follow‐up and change values).

Comparison 16 Subanalysis: outcomes by format of intervention, Outcome 45 Bone mineral density ‐ total hip (follow‐up and change values).

Comparison 17 Subanalysis: outcomes by setting of intervention, Outcome 1 Overall HRQoL (follow‐up values).

Comparison 17 Subanalysis: outcomes by setting of intervention, Outcome 2 Overall HRQoL (change values).
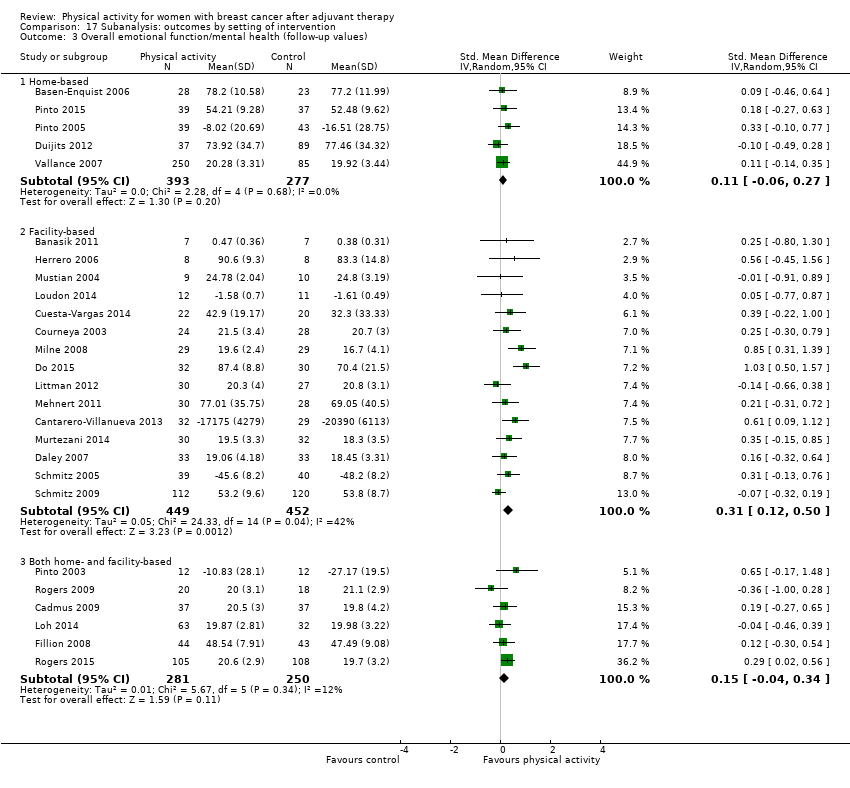
Comparison 17 Subanalysis: outcomes by setting of intervention, Outcome 3 Overall emotional function/mental health (follow‐up values).
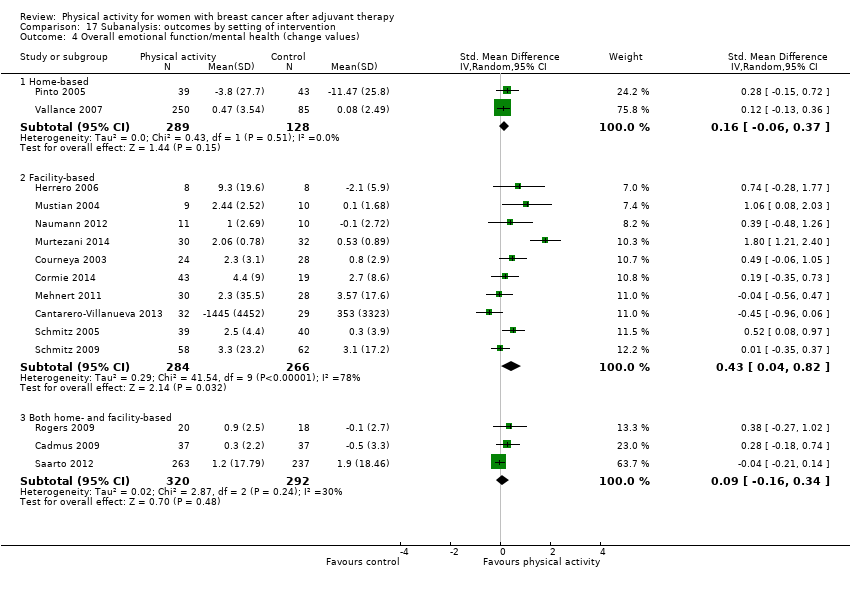
Comparison 17 Subanalysis: outcomes by setting of intervention, Outcome 4 Overall emotional function/mental health (change values).
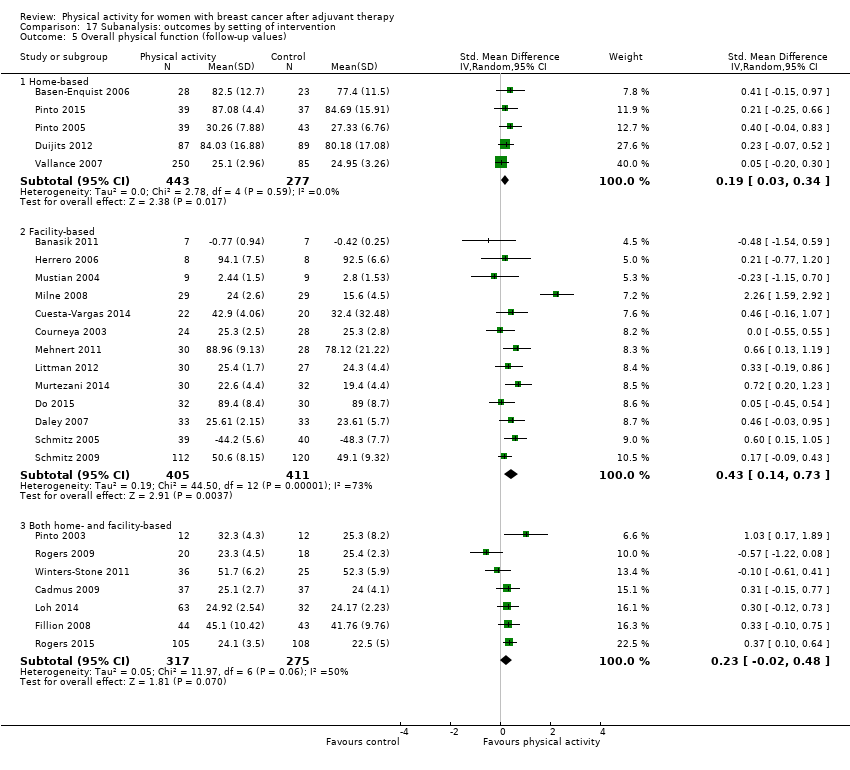
Comparison 17 Subanalysis: outcomes by setting of intervention, Outcome 5 Overall physical function (follow‐up values).

Comparison 17 Subanalysis: outcomes by setting of intervention, Outcome 6 Overall physical function (change values).

Comparison 17 Subanalysis: outcomes by setting of intervention, Outcome 7 Overall role function (follow‐up values).

Comparison 17 Subanalysis: outcomes by setting of intervention, Outcome 8 Overall role function (change values).
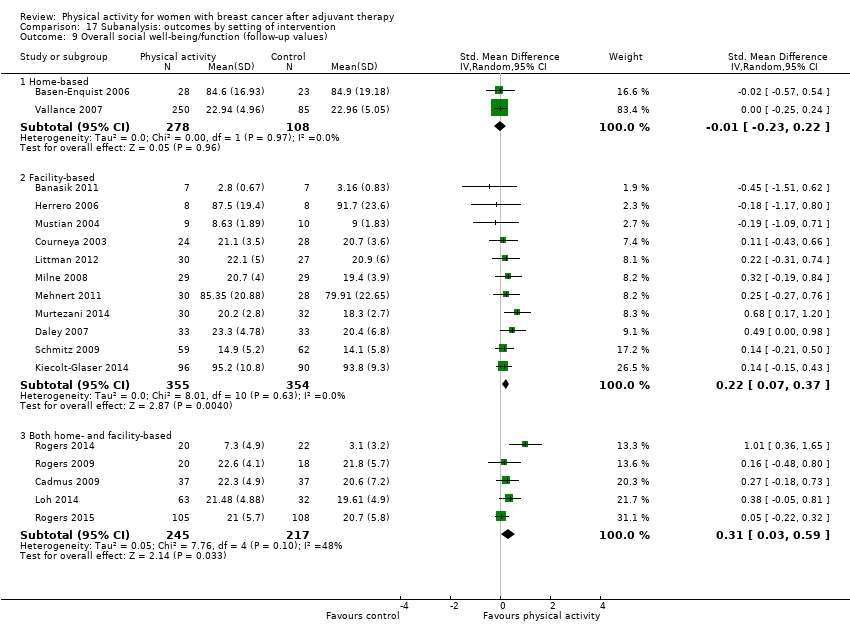
Comparison 17 Subanalysis: outcomes by setting of intervention, Outcome 9 Overall social well‐being/function (follow‐up values).

Comparison 17 Subanalysis: outcomes by setting of intervention, Outcome 10 Overall social well‐being/function (change values).

Comparison 17 Subanalysis: outcomes by setting of intervention, Outcome 11 Overall cognitive function (follow‐up values).

Comparison 17 Subanalysis: outcomes by setting of intervention, Outcome 12 Overall cognitive function (change values).
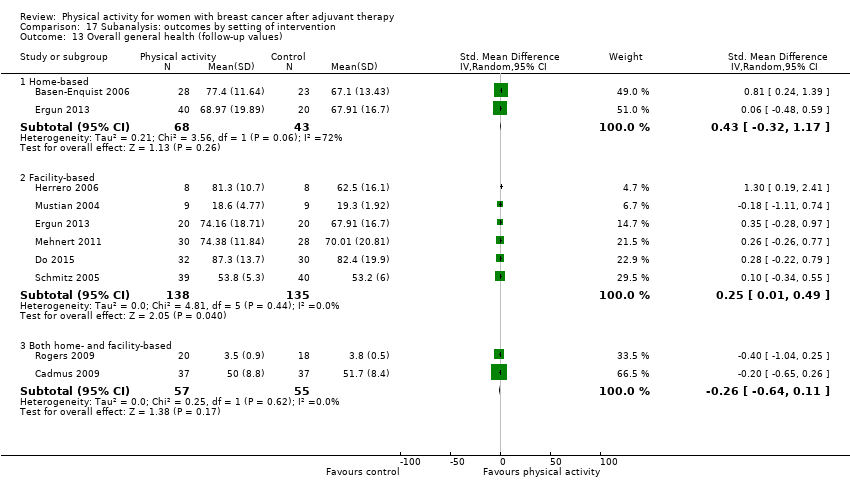
Comparison 17 Subanalysis: outcomes by setting of intervention, Outcome 13 Overall general health (follow‐up values).

Comparison 17 Subanalysis: outcomes by setting of intervention, Outcome 14 Overall general health (change values).

Comparison 17 Subanalysis: outcomes by setting of intervention, Outcome 15 Overall sexual function (follow‐up values).

Comparison 17 Subanalysis: outcomes by setting of intervention, Outcome 16 Overall sexual function (change values).

Comparison 17 Subanalysis: outcomes by setting of intervention, Outcome 17 Overall sleep (follow‐up values).
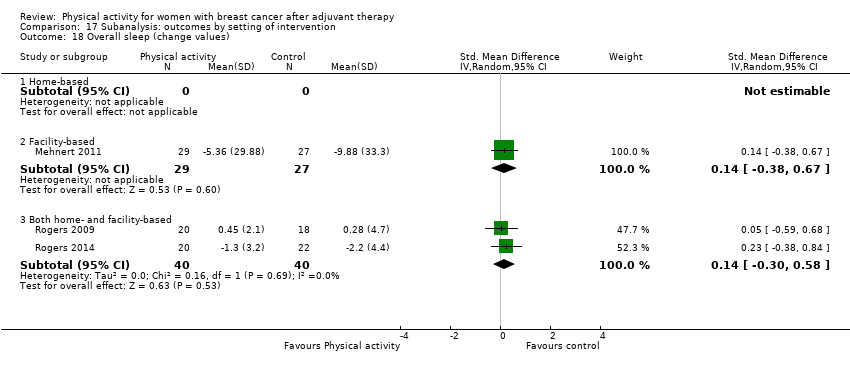
Comparison 17 Subanalysis: outcomes by setting of intervention, Outcome 18 Overall sleep (change values).
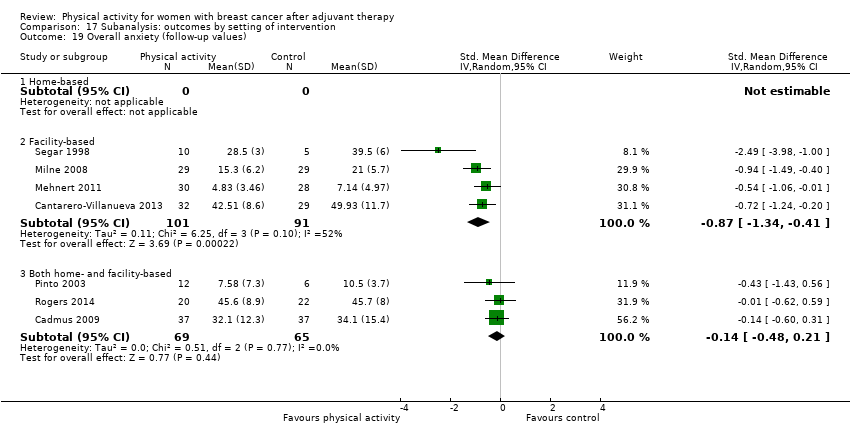
Comparison 17 Subanalysis: outcomes by setting of intervention, Outcome 19 Overall anxiety (follow‐up values).
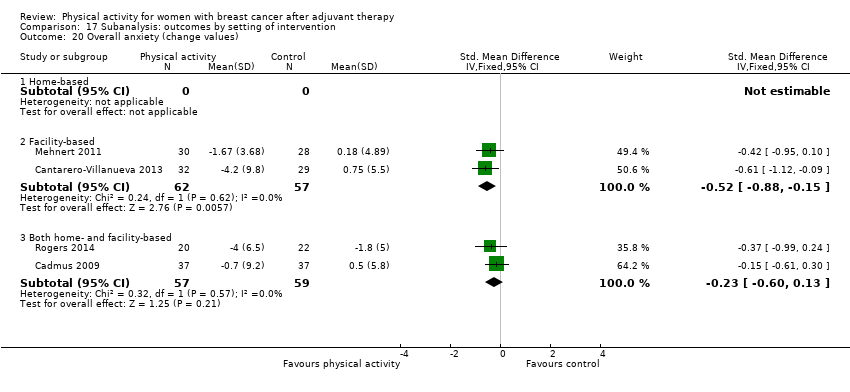
Comparison 17 Subanalysis: outcomes by setting of intervention, Outcome 20 Overall anxiety (change values).

Comparison 17 Subanalysis: outcomes by setting of intervention, Outcome 21 Overall depression (follow‐up values).
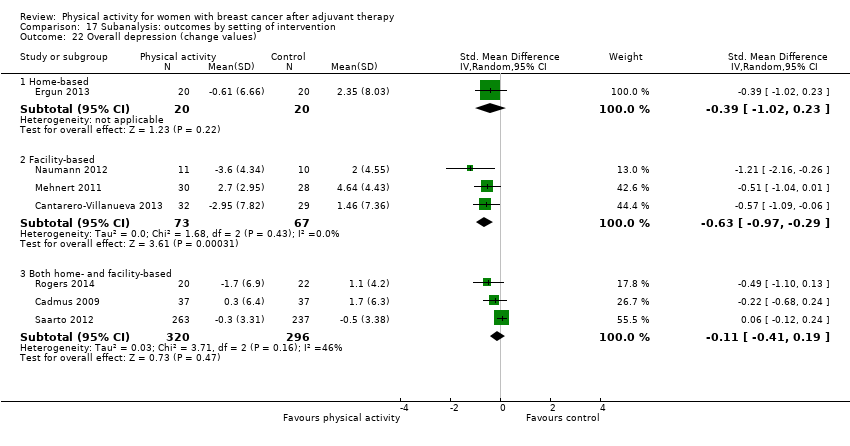
Comparison 17 Subanalysis: outcomes by setting of intervention, Outcome 22 Overall depression (change values).

Comparison 17 Subanalysis: outcomes by setting of intervention, Outcome 23 Overall fatigue (follow‐up values).

Comparison 17 Subanalysis: outcomes by setting of intervention, Outcome 24 Overall fatigue (change values).
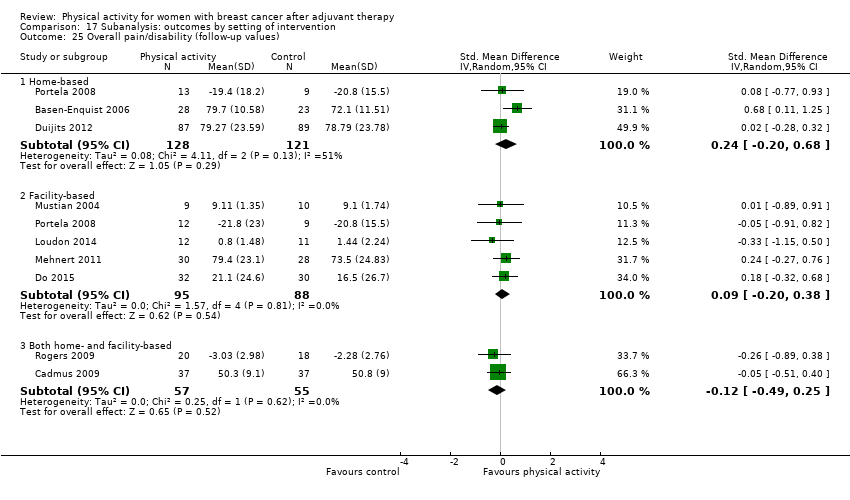
Comparison 17 Subanalysis: outcomes by setting of intervention, Outcome 25 Overall pain/disability (follow‐up values).
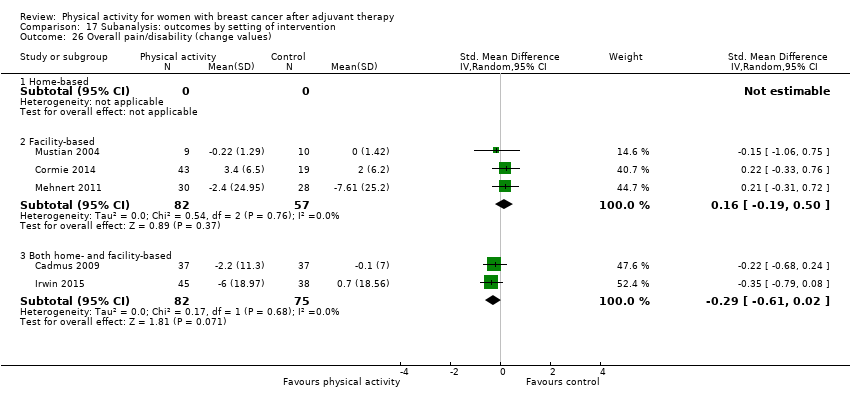
Comparison 17 Subanalysis: outcomes by setting of intervention, Outcome 26 Overall pain/disability (change values).

Comparison 17 Subanalysis: outcomes by setting of intervention, Outcome 27 Overall self‐esteem/body image (follow‐up values).
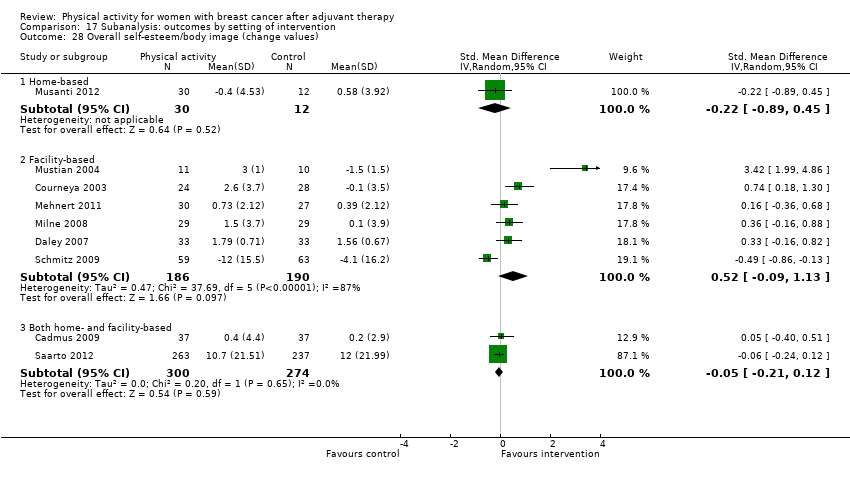
Comparison 17 Subanalysis: outcomes by setting of intervention, Outcome 28 Overall self‐esteem/body image (change values).

Comparison 17 Subanalysis: outcomes by setting of intervention, Outcome 29 Overall cardiorespiratory fitness (follow‐up values).

Comparison 17 Subanalysis: outcomes by setting of intervention, Outcome 30 Overall cardiorespiratory fitness (change values).

Comparison 17 Subanalysis: outcomes by setting of intervention, Outcome 31 Overall self‐reported physical activity (follow‐up values).

Comparison 17 Subanalysis: outcomes by setting of intervention, Outcome 32 Overall self‐reported physical activity (change values).

Comparison 17 Subanalysis: outcomes by setting of intervention, Outcome 33 Overall objective physical activity (follow‐up values).

Comparison 17 Subanalysis: outcomes by setting of intervention, Outcome 34 Overall objective physical activity (change values).

Comparison 17 Subanalysis: outcomes by setting of intervention, Outcome 35 Mass (follow‐up values).

Comparison 17 Subanalysis: outcomes by setting of intervention, Outcome 36 Mass (change values).
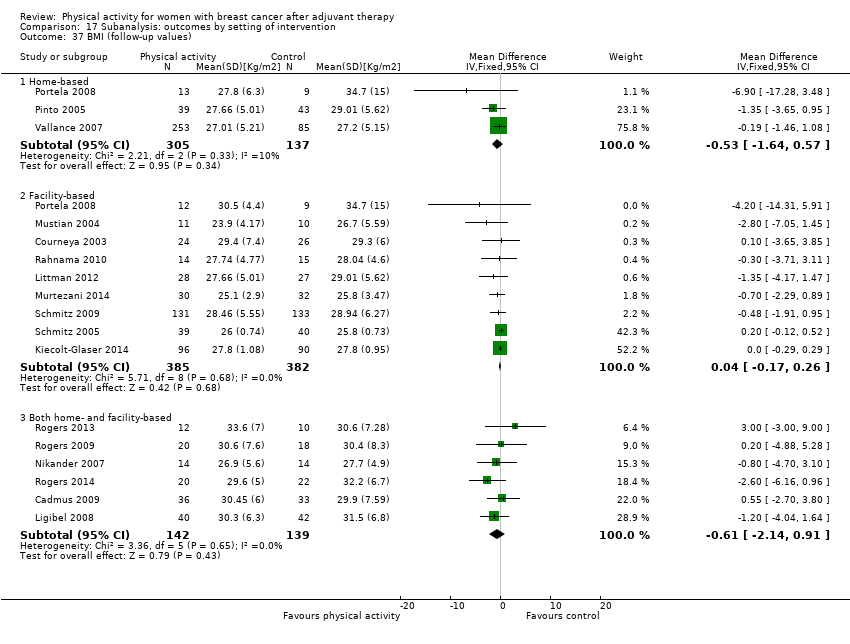
Comparison 17 Subanalysis: outcomes by setting of intervention, Outcome 37 BMI (follow‐up values).

Comparison 17 Subanalysis: outcomes by setting of intervention, Outcome 38 BMI (change values).
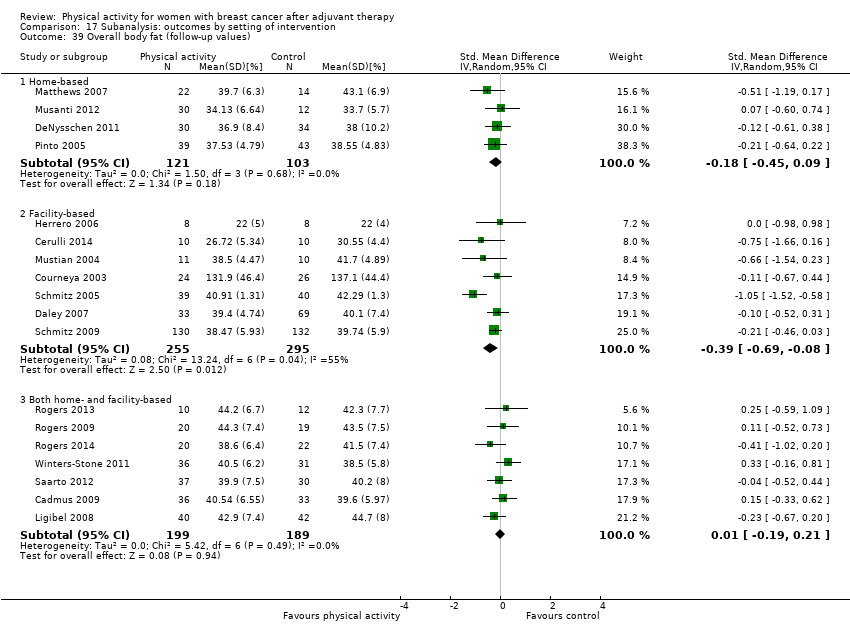
Comparison 17 Subanalysis: outcomes by setting of intervention, Outcome 39 Overall body fat (follow‐up values).

Comparison 17 Subanalysis: outcomes by setting of intervention, Outcome 40 Overall body fat (change values).
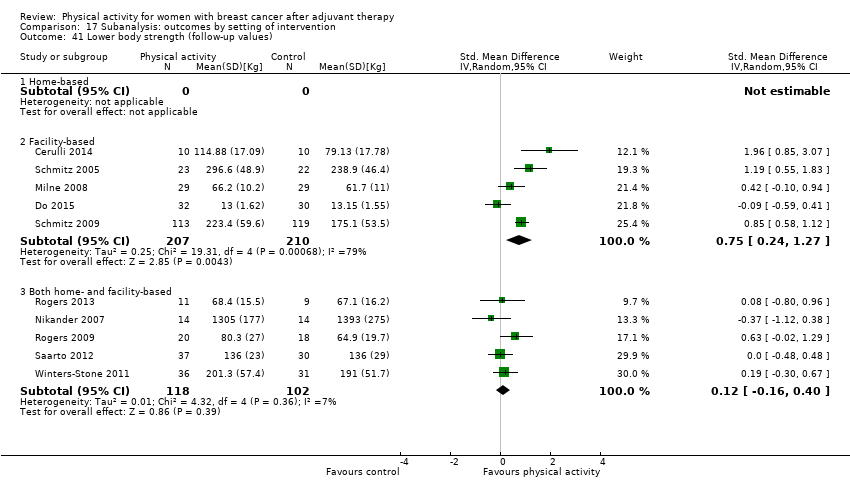
Comparison 17 Subanalysis: outcomes by setting of intervention, Outcome 41 Lower body strength (follow‐up values).

Comparison 17 Subanalysis: outcomes by setting of intervention, Outcome 42 Lower body strength (change values).

Comparison 17 Subanalysis: outcomes by setting of intervention, Outcome 43 Upper body strength (follow‐up values).
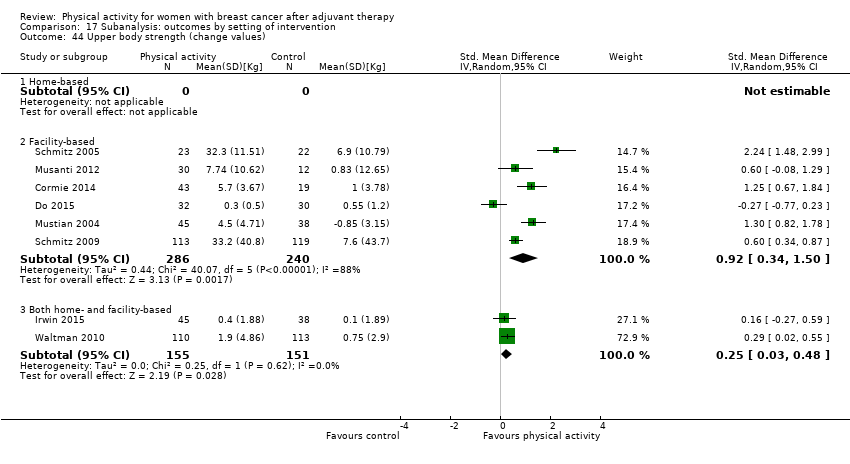
Comparison 17 Subanalysis: outcomes by setting of intervention, Outcome 44 Upper body strength (change values).

Comparison 17 Subanalysis: outcomes by setting of intervention, Outcome 45 Bone mineral density ‐ femoral neck (follow‐up and change values).

Comparison 17 Subanalysis: outcomes by setting of intervention, Outcome 46 Bone mineral density ‐ lumbar spine (follow‐up and change values).
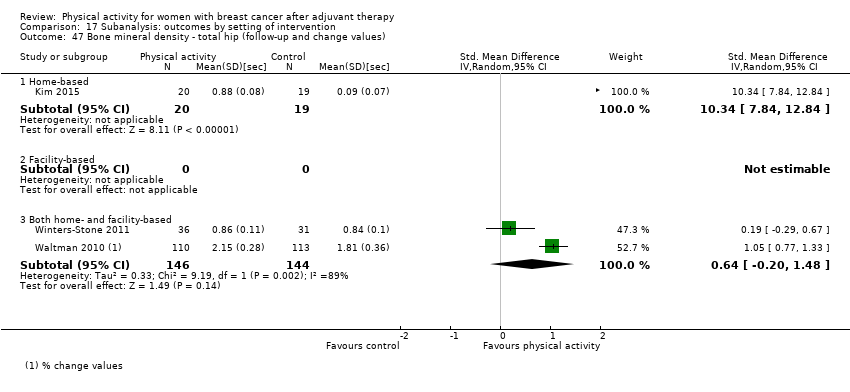
Comparison 17 Subanalysis: outcomes by setting of intervention, Outcome 47 Bone mineral density ‐ total hip (follow‐up and change values).
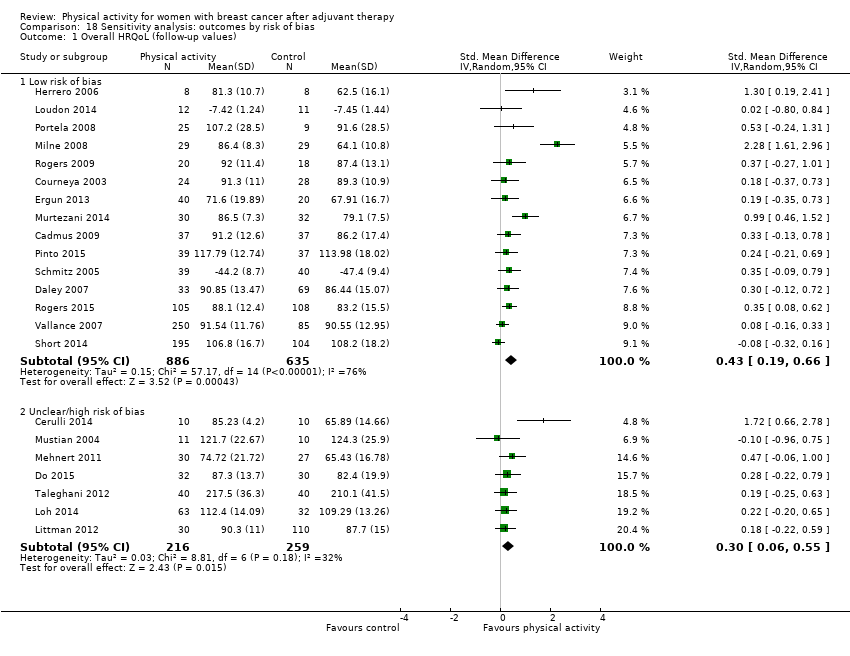
Comparison 18 Sensitivity analysis: outcomes by risk of bias, Outcome 1 Overall HRQoL (follow‐up values).
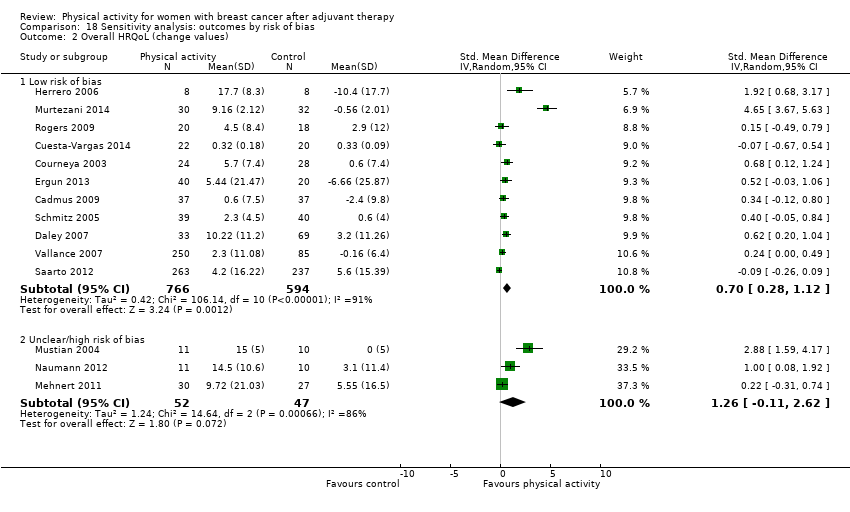
Comparison 18 Sensitivity analysis: outcomes by risk of bias, Outcome 2 Overall HRQoL (change values).

Comparison 18 Sensitivity analysis: outcomes by risk of bias, Outcome 3 Overall emotional function/mental health (follow‐up values).

Comparison 18 Sensitivity analysis: outcomes by risk of bias, Outcome 4 Overall emotional function/mental health (change values).

Comparison 18 Sensitivity analysis: outcomes by risk of bias, Outcome 5 Overall physical function (follow‐up values).

Comparison 18 Sensitivity analysis: outcomes by risk of bias, Outcome 6 Overall physical function (change values).
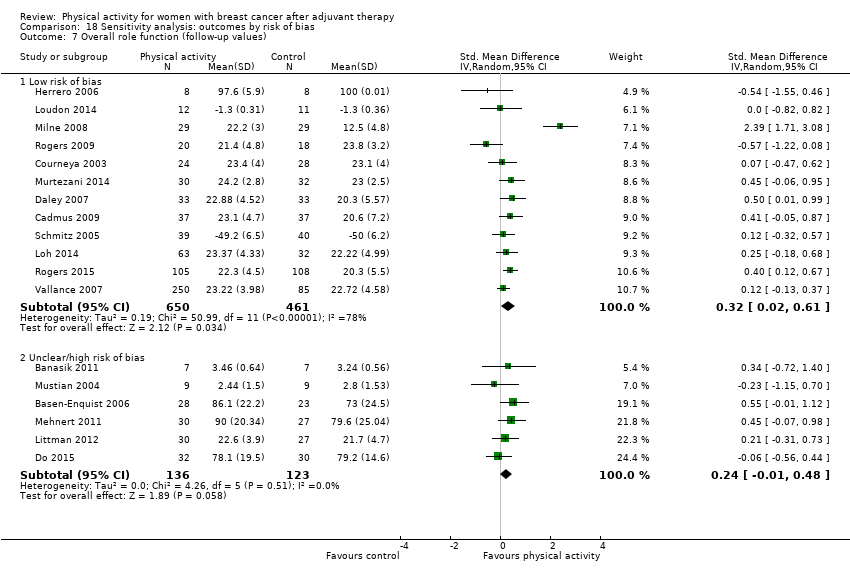
Comparison 18 Sensitivity analysis: outcomes by risk of bias, Outcome 7 Overall role function (follow‐up values).

Comparison 18 Sensitivity analysis: outcomes by risk of bias, Outcome 8 Overall role function (change values).

Comparison 18 Sensitivity analysis: outcomes by risk of bias, Outcome 9 Overall social well‐being/function (follow‐up values).

Comparison 18 Sensitivity analysis: outcomes by risk of bias, Outcome 10 Overall social well‐being/function (change values).

Comparison 18 Sensitivity analysis: outcomes by risk of bias, Outcome 11 Overall cognitive function (follow‐up values).

Comparison 18 Sensitivity analysis: outcomes by risk of bias, Outcome 12 Overall cognitive function (change values).

Comparison 18 Sensitivity analysis: outcomes by risk of bias, Outcome 13 Overall general health (follow‐up values).

Comparison 18 Sensitivity analysis: outcomes by risk of bias, Outcome 14 Overall general health (change values).

Comparison 18 Sensitivity analysis: outcomes by risk of bias, Outcome 15 Overall sexual function (follow‐up values).

Comparison 18 Sensitivity analysis: outcomes by risk of bias, Outcome 16 Overall sexual function (change values).

Comparison 18 Sensitivity analysis: outcomes by risk of bias, Outcome 17 Overall sleep (follow‐up values).
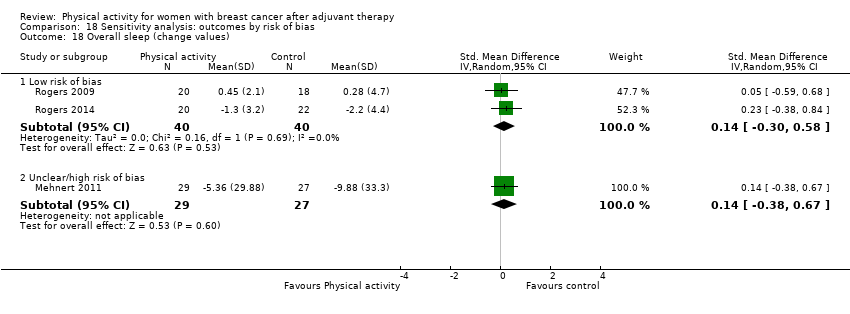
Comparison 18 Sensitivity analysis: outcomes by risk of bias, Outcome 18 Overall sleep (change values).

Comparison 18 Sensitivity analysis: outcomes by risk of bias, Outcome 19 Overall anxiety (follow‐up values).
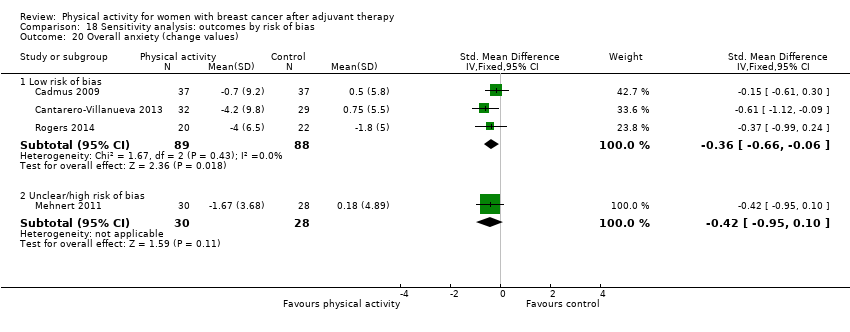
Comparison 18 Sensitivity analysis: outcomes by risk of bias, Outcome 20 Overall anxiety (change values).

Comparison 18 Sensitivity analysis: outcomes by risk of bias, Outcome 21 Overall self‐esteem/body image (follow‐up values).

Comparison 18 Sensitivity analysis: outcomes by risk of bias, Outcome 22 Overall self‐esteem/body image (change values).
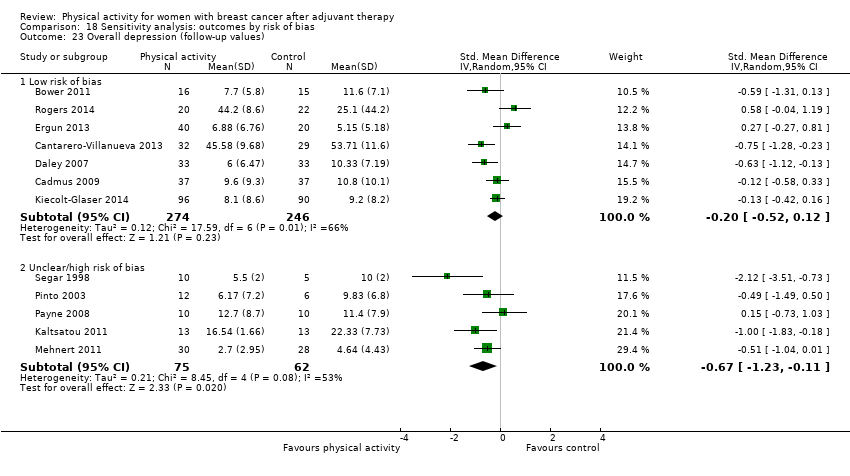
Comparison 18 Sensitivity analysis: outcomes by risk of bias, Outcome 23 Overall depression (follow‐up values).

Comparison 18 Sensitivity analysis: outcomes by risk of bias, Outcome 24 Overall depression (change values).

Comparison 18 Sensitivity analysis: outcomes by risk of bias, Outcome 25 Overall fatigue (follow‐up values).

Comparison 18 Sensitivity analysis: outcomes by risk of bias, Outcome 26 Overall fatigue (change values).
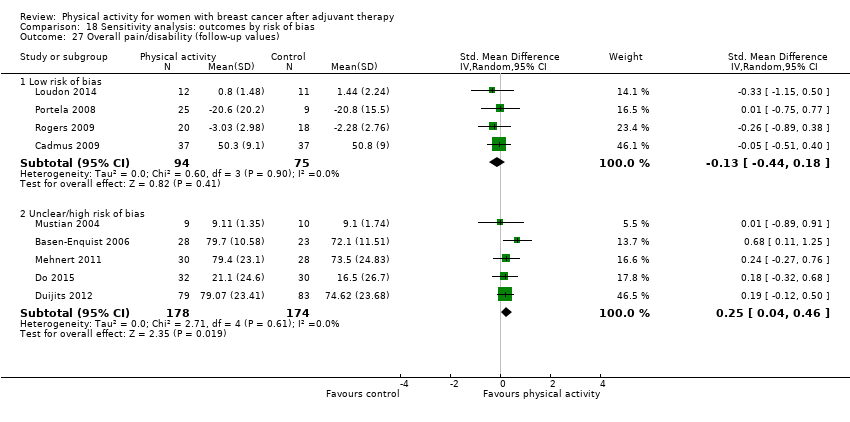
Comparison 18 Sensitivity analysis: outcomes by risk of bias, Outcome 27 Overall pain/disability (follow‐up values).
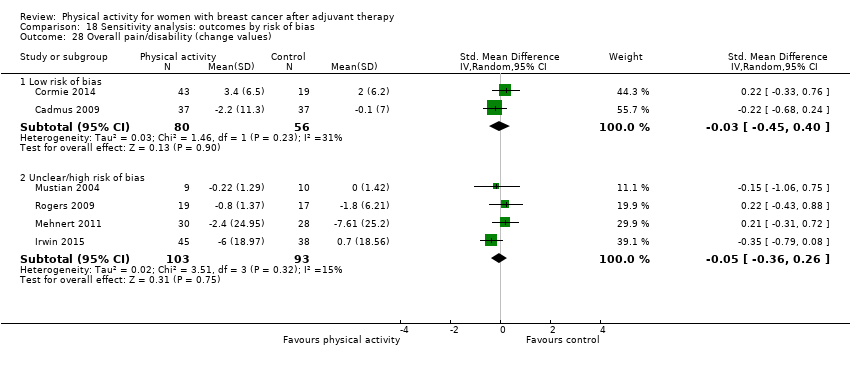
Comparison 18 Sensitivity analysis: outcomes by risk of bias, Outcome 28 Overall pain/disability (change values).

Comparison 18 Sensitivity analysis: outcomes by risk of bias, Outcome 29 Overall cardiorespiratory fitness (follow‐up values).

Comparison 18 Sensitivity analysis: outcomes by risk of bias, Outcome 30 Overall cardiorespiratory fitness (change values).

Comparison 18 Sensitivity analysis: outcomes by risk of bias, Outcome 31 Overall self‐reported physical activity (follow‐up values).

Comparison 18 Sensitivity analysis: outcomes by risk of bias, Outcome 32 Overall self‐reported physical activity (change values).
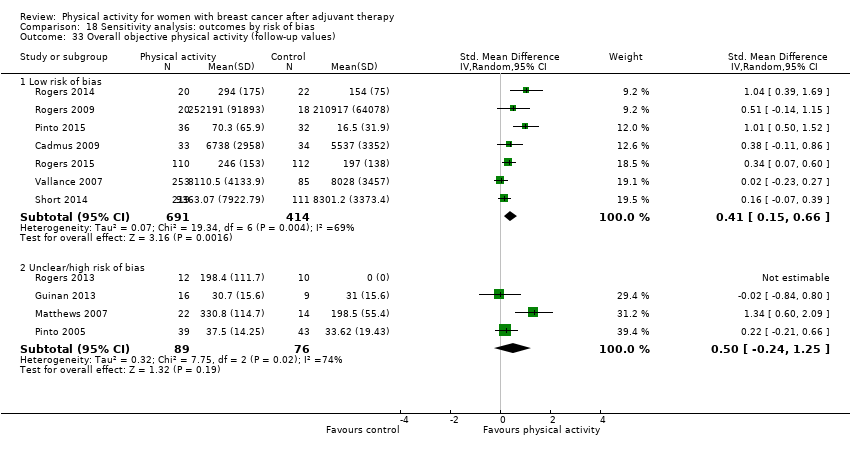
Comparison 18 Sensitivity analysis: outcomes by risk of bias, Outcome 33 Overall objective physical activity (follow‐up values).

Comparison 18 Sensitivity analysis: outcomes by risk of bias, Outcome 34 Overall objective physical activity (change values).
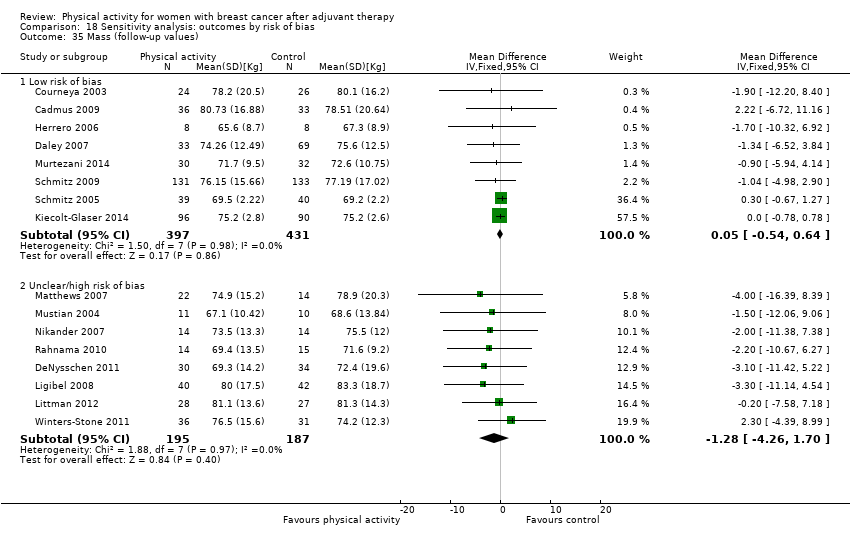
Comparison 18 Sensitivity analysis: outcomes by risk of bias, Outcome 35 Mass (follow‐up values).
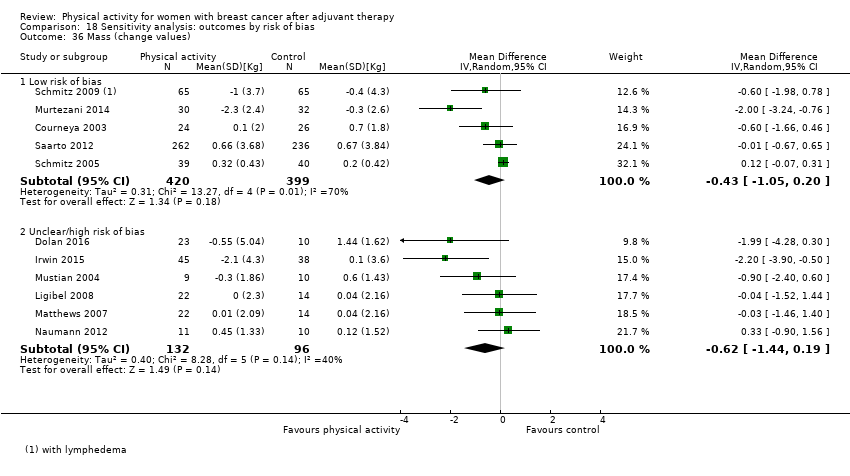
Comparison 18 Sensitivity analysis: outcomes by risk of bias, Outcome 36 Mass (change values).

Comparison 18 Sensitivity analysis: outcomes by risk of bias, Outcome 37 BMI (follow‐up values).

Comparison 18 Sensitivity analysis: outcomes by risk of bias, Outcome 38 BMI (change values).
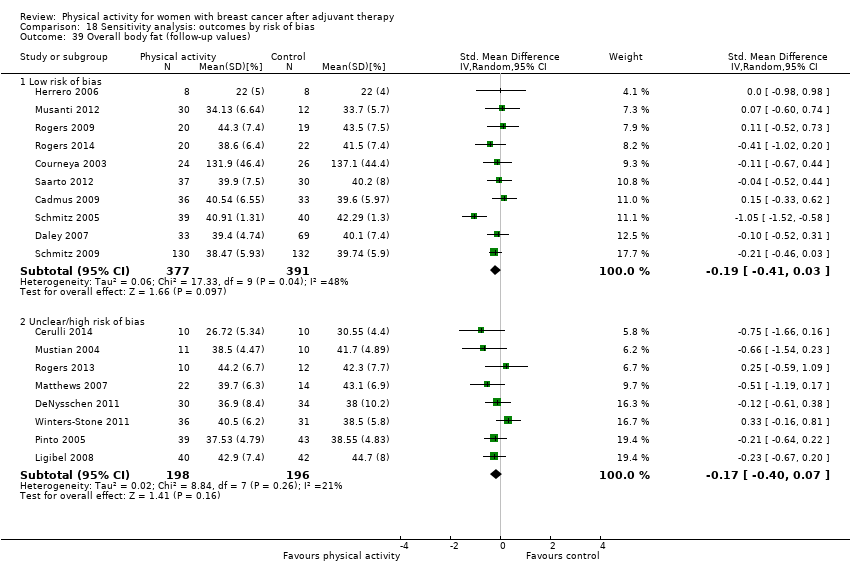
Comparison 18 Sensitivity analysis: outcomes by risk of bias, Outcome 39 Overall body fat (follow‐up values).
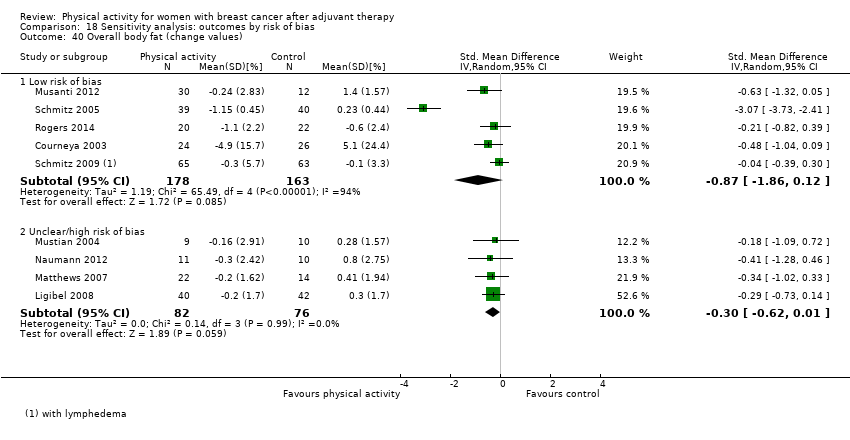
Comparison 18 Sensitivity analysis: outcomes by risk of bias, Outcome 40 Overall body fat (change values).

Comparison 18 Sensitivity analysis: outcomes by risk of bias, Outcome 41 Lower body strength (follow‐up values).

Comparison 18 Sensitivity analysis: outcomes by risk of bias, Outcome 42 Lower body strength (change values).

Comparison 18 Sensitivity analysis: outcomes by risk of bias, Outcome 43 Upper body strength (follow‐up values).

Comparison 18 Sensitivity analysis: outcomes by risk of bias, Outcome 44 Upper body strength (change values).

Comparison 18 Sensitivity analysis: outcomes by risk of bias, Outcome 45 Bone mineral density ‐ femoral neck (follow‐up and change values).

Comparison 18 Sensitivity analysis: outcomes by risk of bias, Outcome 46 Bone mineral density ‐ lumbar spine (follow‐up and change values).
| Physical activity versus control for women with breast cancer after adjuvant therapy | |||||
| Patient or population: women with breast cancer after adjuvant therapy | |||||
| Outcomes | Illustrative comparative risks* (95% CI) | No. of participants | Quality of the evidence | Comments | |
| Assumed risk | Corresponding risk | ||||
| Control | Physical activity | ||||
| HRQoL at end of intervention follow‐up | Mean HRQoL at end of intervention follow‐up ranged across control groups from | Mean HRQoL at end of intervention follow‐up in the intervention groups was | 1996 | ⊕⊕⊝⊝ | SMD 0.39 (0.21 to 0.57) re‐expressed using FACT‐G (0 to 104 scale); the intervention mean HRQoL was 5.9 (3.2 to 8.6) points higher than control (MID 5 to 6 points). |
| Emotional function/mental health at end of intervention follow‐up | Mean emotional function/mental health at end of intervention follow‐up ranged across control groups from | Mean emotional function/mental health at end of intervention follow‐up in the intervention groups was | 2102 | ⊕⊕⊕⊝ | SMD 0.21 (0.10 to 0.32) re‐expressed using FACT‐EBW (0 to 24 scale); the intervention mean emotion function was 0.7 (0.3 to 1.0) points higher than control (MID 2 points). |
| Perceived physical function at end of intervention follow‐up | Mean physical function at end of intervention follow‐up ranged across control groups from | Mean physical function at end of intervention follow‐up in the intervention groups was | 2129 | ⊕⊕⊕⊝ | SMD 0.33 (0.18 to 0.49) re‐expressed using FACT‐PBW (0 to 28 scale); the intervention mean physical function was 1.7 (0.9 to 2.5) points higher than control (MID 2 points). |
| Anxiety at end of intervention follow‐up | Mean anxiety at end of intervention follow‐up ranged across control groups from | Mean anxiety at end of intervention follow‐up in the intervention groups was | 326 | ⊕⊝⊝⊝ | SMD ‐0.57 (‐0.95 to ‐0.19) re‐expressed using PROMIS (0 to 9 scale); the intervention mean anxiety was 1.9 (3.2 to 0.6) points lower than control (MID 3 to 4.5 points). |
| Depression at end of intervention follow‐up | Mean depression at end of intervention follow‐up ranged across control groups from | Mean depression at end of intervention follow‐up in the intervention groups was | 657 | ⊕⊕⊝⊝ | SMD ‐0.34 (‐0.62 to ‐0.05) re‐expressed using BDI‐II (0 to 63 scale); the intervention mean depression was 3.8 (7.0 to 0.6) % lower than control (MID 18%). |
| Fatigue at end of intervention follow‐up | Mean fatigue at end of intervention follow‐up ranged across control groups from | Mean fatigue at end of intervention follow‐up in the intervention groups was | 2020 | ⊕⊕⊕⊝ | SMD ‐0.32 (‐0.47 to ‐0.18) re‐expressed using FACT‐F (0 to 52 scale); the intervention mean fatigue was 2.8 (4.1 to 1.6) points lower than control (MID 3 points). |
| Cardiorespiratory fitness at end of intervention follow‐up | Mean cardiorespiratory fitness at end of intervention follow‐up ranged across control groups from | Mean cardiorespiratory fitness at end of intervention follow‐up in the intervention groups was | 1265 | ⊕⊕⊕⊝ | SMD 0.44 (0.30 to 0.58) re‐expressed as VO₂max (mL/kg/min); the intervention mean was 2.1 (1.4 to 2.7) mL/kg/min higher than control (MID 3.5 mL/kg/min). |
| *The basis for the assumed risk (e.g. median control group risk across studies) is provided in footnotes. The corresponding risk (and its 95% confidence interval) is based on the assumed risk in the comparison group and the relative effect of the intervention (and its 95% CI). | |||||
| GRADE Working Group grades of evidence. | |||||
| aAs a rule of thumb, 0.2 SD represents a small effect, 0.5 SD a moderate effect, and 0.8 SD a large effect. cAll trials lacked blinding of participants (performance bias), and most trials lacked blinding of outcome assessors (detection bias) and had incomplete outcome reporting and/or high attrition (attrition bias), but most were at a low risk of selection bias, reporting bias, and other bias, and therefore, we did not downgraded based on risk of bias. | |||||
| Physical activity versus control for women with breast cancer after adjuvant therapy | |||||
| Patient or population: women with breast cancer after adjuvant therapy | |||||
| Outcomes | Illustrative comparative risks* (95% CI) | No. of participants | Quality of the evidence | Comments | |
| Assumed risk | Corresponding risk | ||||
| Control | Physical activity | ||||
| HRQoL change from baseline to end of intervention | Mean HRQoL change from baseline to end of intervention ranged across control groups from | Mean HRQoL change from baseline to end of intervention in the intervention groups was | 1459 | ⊕⊕⊝⊝ | SMD 0.78 (0.39 to 1.17) re‐expressed using FACT‐G (0 to 104 scale); the intervention mean change was 5.0 (2.5 to 7.5) points higher than control (MID 5 to 6 points) |
| Emotional function/mental health change from baseline to end of intervention | Mean emotional function/mental health change from baseline to end of intervention ranged across control groups from | Mean emotional function/mental health change from baseline to end of intervention in the intervention groups was | 1579 | ⊕⊕⊕⊝ | SMD 0.31 (0.09 to 0.53) re‐expressed using FACT‐EBW (0 to 24 scale); the intervention mean change was 0.8 (0.2 to 1.3) points higher than control (MID 2 points). |
| Perceived physical function change from baseline to end of intervention | Mean physical function change from baseline to end of intervention ranged across control groups from | Mean physical function change from baseline to end of intervention in the intervention groups was | 1433 | ⊕⊕⊕⊝ | SMD 0.60 (0.23 to 0.97) re‐expressed using FACT‐PBW (0 to 28 scale); the intervention mean change was 1.3 (0.5 to 2.1) points higher than control (MID 2 points). |
| Anxiety change from baseline to end of intervention | Mean anxiety change from baseline to end of intervention ranged across control groups from | Mean anxiety change from baseline to end of intervention in the intervention groups was | 235 | ⊕⊕⊝⊝ | SMD ‐0.37 (‐0.63 to ‐0.12) re‐expressed using PROMIS (0 to 9 scale); the intervention mean change was 4.6 (7.6 to 1.5) points lower than control (MID 3 to 4.5 points). |
| Depression change from baseline to end of intervention | Mean depression change from baseline to end of intervention ranged across control groups from | Mean depression change from baseline to end of intervention in the intervention groups was | 816 | ⊕⊝⊝⊝ very lowc,g | SMD ‐0.34 (‐0.63 to ‐0.05) re‐expressed using BDI‐II (0 to 63 scale); the intervention mean change was 2.5 (4.6 to 0.4) % lower than control (MID 18%). |
| Fatigue change from baseline to end of intervention | Mean fatigue change from baseline to end of intervention ranged across control groups from | Mean fatigue change from baseline to end of intervention in the intervention groups was | 1289 | ⊕⊕⊝⊝ | SMD ‐0.3 (‐0.61 to 0) re‐expressed using FACT‐F (0 to 52 scale); the intervention mean change was 2.6 (5.2 to 0) points lower than control (MID 3 units). |
| Cardiorespiratory fitness change from baseline to end of intervention | Mean cardiorespiratory fitness change from baseline to end of intervention ranged across control groups from | Mean cardiorespiratory fitness change from baseline to end of intervention in the intervention groups was | 863 | ⊕⊝⊝⊝ | SMD 0.83 (0.4 to 1.27) re‐expressed using VO₂max (mL/kg/min); the intervention mean change was 2.3 (1.1 to 3.4) mL/kg/min higher than control (MID 3.5 mL/kg/min). |
| *The basis for the assumed risk (e.g. median control group risk across studies) is provided in footnotes. The corresponding risk (and its 95% confidence interval) is based on the assumed risk in the comparison group and the relative effect of the intervention (and its 95% CI). | |||||
| GRADE Working Group grades of evidence. | |||||
| aAs a rule of thumb, 0.2 SD represents a small effect, 0.5 SD a moderate effect, and 0.8 SD a large effect. | |||||
| QoL domain and instrument name | Direction of response | Trials using this scale |
| Cognitive function | ||
| Cognitive problems ‐ Breast Cancer Prevention Trial (BCPT) Symptom Checklist | Higher score indicates worse status. | |
| Cognitive function ‐ European Organization for Research and Treatment of Cancer Quality of Life Questionnaire‐C30 (EORTC QLQ‐C30) | Higher score indicates better status. | |
| Cognitive function ‐ Functional Assessment of Cancer Therapy‐Cognitive (FACT‐C) | Higher score indicates worse status. | |
| Confusion ‐ Profile of Mood States (POMS) | Higher score indicates worse status. | |
| Emotional function/mental health | ||
| Psychosocial global score ‐ Cancer Rehabilitation Evaluation System Short Form (CARES‐SF) | Higher score indicates worse status. | |
| Emotional function ‐ EORTC QLQ‐C30 | Higher score indicates better status. | |
| Emotional well‐being ‐ FACT‐General (FACT‐G) | Higher score indicates better status. | Banasik 2011; Cadmus 2009; Courneya 2003; Daley 2007; Littman 2012; Loh 2014; Milne 2008; Murtezani 2014; Naumann 2012; Rogers 2009; Rogers 2015; Vallance 2007 |
| Emotions ‐ Lymphedema Quality of Life Tool (LYMQOL) | Higher score indicates worse status. | |
| Mental composite ‐ Medical Outcomes Study Short Form‐12 (MOS SF‐12) and MOS SF‐36 | Higher score indicates better status. | SF‐12: Cuesta‐Vargas 2014; Fillion 2008 SF‐36: (Cormie 2014; Kiecolt‐Glaser 2014; Pinto 2015; Schmitz 2009 |
| Mental health ‐ MOS SF‐12 | Higher score indicates better status. | Baruth 2013; Basen‐Enquist 2006; Cadmus 2009; Cormie 2014; Duijits 2012; Kiecolt‐Glaser 2014; McKenzie 2003; Mehnert 2011; Pinto 2015 |
| Role emotion ‐ MOS SF‐36 | Higher score indicates better status. | Baruth 2013; Basen‐Enquist 2006; Cadmus 2009; Cormie 2014; Duijits 2012; Kiecolt‐Glaser 2014; McKenzie 2003; Mehnert 2011 |
| Positive and Negative Affect Scale (PANAS) | Higher score indicates better status. | |
| Total mood disturbance score ‐ POMS | Higher score indicates worse status. | |
| Anxiety and depression ‐ POMS | Higher score indicates worse status. | |
| Anger ‐ POMS | Higher score indicates worse status. | |
| General health perspective | ||
| Global health ‐ EORTC QLQ‐C30 | Higher score indicates better status. | Do 2015; Ergun 2013; Herrero 2006; Mehnert 2011; Saarto 2012 |
| Current health ‐ International Breast Cancer Study Group (IBCSG) | Higher score indicates better status. | |
| General health ‐ MOS SF‐36 | Higher score indicates better status. | Baruth 2013; Basen‐Enquist 2006; Cadmus 2009; Cormie 2014; Duijits 2012; Kiecolt‐Glaser 2014; McKenzie 2003; Mehnert 2011; Mustian 2004 |
| Single question on perceived general health | Higher score indicates better status. | |
| Perceived physical function | ||
| Physical condition ‐ Body Esteem Scale (BES) | Higher score indicates better status. | |
| Physical strength ‐ Body Image and Relationships Scale (BIRS) | Higher score indicates worse status. | |
| Physical global ‐ CARES‐SF | Higher score indicates worse status. | |
| Physical function ‐ EORTC QLQ‐C30 | Higher score indicates better status. | |
| Physical well‐being ‐ FACT‐G | Higher score indicates better status. | Banasik 2011; Cadmus 2009; Courneya 2003; Daley 2007; Littman 2012; Loh 2014; Milne 2008; Murtezani 2014; Naumann 2012; Rogers 2009; Rogers 2015; Vallance 2007 |
| Physical well‐being ‐ IBCSG | Higher score indicates better status. | |
| Physical function ‐ MOS SF‐12 | Higher score indicates better status. | |
| Physical function composite score ‐ MOS SF‐36 | Higher score indicates better status. | Baruth 2013; Cormie 2014; Duijits 2012; McKenzie 2003; Mehnert 2011; Mustian 2004; Schmitz 2009; Winters‐Stone 2011 |
| Role function | ||
| Marital global score ‐ CARES‐SF | Higher score indicates worse status. | |
| Role function ‐ EORTC QLQ‐C30 | Higher score indicates better status. | |
| Functional well‐being ‐ FACT‐G | Higher score indicates better status. | Banasik 2011; Cadmus 2009; Courneya 2003; Daley 2007; Littman 2012; Loh 2014; Milne 2008; Murtezani 2014; Naumann 2012; Rogers 2009; Rogers 2015; Vallance 2007 |
| Function ‐ LYMQOL | Higher score indicates worse status. | |
| Physical role function ‐ MOS SF‐36 | Higher score indicates better status. | Baruth 2013; Basen‐Enquist 2006; Cadmus 2009; Cormie 2014; Duijits 2012; Kiecolt‐Glaser 2014; McKenzie 2003; Mehnert 2011; Mustian 2004 |
| Sexuality | ||
| Sexual attractiveness ‐ BES | Higher score indicates better status. | |
| Appearance and sexuality ‐ BIRS | Higher score indicates worse status. | |
| Sexual function and sexual enjoyment ‐ EORTC QLQ‐C30 | Higher score indicates better status. | |
| Sexual global ‐ CARES‐SF | Higher score indicates worse status. | |
| Sexual functioning ‐ Sexual Activity Questionnaire | Higher score indicates better status. | |
| Sleep | ||
| Pittsburgh Sleep Quality Index (PSI) | Higher score indicates worse status. | Bower 2011; Carson 2009; Kiecolt‐Glaser 2014; Payne 2008; Rogers 2009; Rogers 2013; Rogers 2014 |
| Sleep disturbance (0 to 9 scale) | Higher score indicates higher disturbance. | |
| Sleep objectively via accelerometers | Higher sleep time and efficiency indicate better status. | |
| Social function | ||
| Social functioning ‐ BIRS | Higher score indicates worse status. | |
| Body Image Questionnaire (BIQ) | Higher score indicates worse status. | |
| Social function ‐ EORTC QLQ‐C30 | Higher score indicates better status. | |
| Social well‐being ‐ FACT‐G | Higher score indicates better status. | Banasik 2011; Cadmus 2009; Courneya 2003; Daley 2007; Littman 2012; Loh 2014; Milne 2008; Murtezani 2014; Naumann 2012; Rogers 2009; Rogers 2015; Vallance 2007 |
| Social support ‐ IBCSG | Higher score indicates better status. | |
| Social functioning ‐ MOS SF‐36 | Higher score indicates better status. | Baruth 2013; Basen‐Enquist 2006; Cadmus 2009; Cormie 2014; Duijits 2012; Kiecolt‐Glaser 2014; McKenzie 2003; Mehnert 2011; Mustian 2004 |
| Social Barriers Scale | Higher score indicates better status. | |
| Other psychological outcomes | ||
| Anxiety | ||
| Depression and Anxiety Stress Scale‐21 (DASS‐21) | Higher score indicates worse status. | |
| Hospital Anxiety and Depression scale (HADS) | Higher score indicates worse status. | |
| Tension‐anxiety ‐ POMS | Higher score indicates worse status. | |
| Anxiety ‐ Patient Reported Outcomes Measurement Information System (PROMIS) | Higher score indicates worse status. | |
| Social Physique Anxiety Scale‐7 (SPAS‐7) | Higher score indicates worse status. | |
| State‐Trait Anxiety Index (STAI) | Higher score indicates worse status. | |
| Cohen’s 10‐item perceived stress scale | Higher score indicates worse status. | |
| Symptoms of Stress Inventory (SOSI) | Higher score indicates worse status. | |
| Depression | ||
| Beck Depression Inventory (BDI) | Higher score indicates worse status. | Bower 2011; Daley 2007; Ergun 2013; Kaltsatou 2011; Naumann 2012; Saarto 2012; Segar 1998 |
| Centres for Epidemiological Studies Depression scale (CES‐D) | Higher score indicates worse status. | |
| DASS‐21 | Higher score indicates worse status. | |
| HADS | Higher score indicates worse status. | |
| Depression subscale ‐ POMS | Higher score indicates worse status. | |
| Depression ‐ PROMIS | Higher score indicates worse status. | |
| Fatigue | ||
| Brief Fatigue Inventory | Higher score indicates worse status. | |
| Fatigue subscale ‐ FACT‐F | Higher score indicates better status. | Baruth 2013; Courneya 2003; Littman 2012; Loh 2014; Peppone 2015; Rogers 2009; Saarto 2012; Short 2014; Vallance 2007 |
| Likert scale responses to fatigue‐related items (0 to 4) | Higher score indicates worse status. | |
| Linear visual analogue scale (VAS) for fatigue (0 to 10) | Higher score indicates worse status. | |
| Multidimensional Fatigue Symptom Inventory (MFSI) | Higher score indicates worse status. | Bower 2011; Fillion 2008; Heim 2007; Peppone 2015; Rogers 2013; Rogers 2014 |
| Fatigue subscale ‐ POMS | Higher score indicates worse status. | |
| Fatigue ‐ PROMIS | Higher score indicates worse status. | |
| Revised Piper Fatigue Scale (PFS) | Higher score indicates worse status. | Cantarero‐Villanueva 2013; Cuesta‐Vargas 2014; Daley 2007; Musanti 2012; Naumann 2012; Payne 2008 |
| Schwartz Cancer Fatigue Scale (SCFS) | Higher score indicates worse status. | |
| Fatigue 0 to 9 scale | Higher score indicates worse status. | |
| Happiness/satisfaction with life | ||
| 2‐Item Fordyce Happiness Measure | Higher score indicates better status. | |
| Happiness measure | Higher score indicates better status. | |
| Life Satisfaction Inventory (LSI) | Higher score indicates better status. | |
| Satisfaction With Life Scale (SWLS) | Higher score indicates better status. | |
| Pain/disability | ||
| Brief Pain Inventory (BPI) | Higher score indicates worse status. | |
| Disabilities of the Arm, Shoulder, and Hand (DASH) | Higher score indicates worse status. | |
| Pain subscale ‐ EORTC QLQ‐C30 | Higher score indicates worse status. | |
| Pain scale ‐ MOS SF‐36 | Higher score indicates better status. | Baruth 2013; Basen‐Enquist 2006; Cadmus 2009; Cormie 2014; Duijits 2012; Mehnert 2011; Mustian 2004 |
| University of Rochester Cancer Center Symptom Inventory (URCC SI) | Higher score indicates worse status. | |
| Pain VAS 0 to 10 | Higher score indicates worse status. | |
| 5‐Point Likert scale version of 24‐item Western Ontario and McMaster Universities Osteoarthritis Index (WOMAC) | Higher score indicates worse status. | |
| Pain 0 to 9 scale | Higher score indicates worse status. | |
| Self‐esteem | ||
| BES | Higher score indicates better status. | |
| Body Image Questionnaire (BIQ) | Higher score indicates worse status. | |
| Body Image and Relationships Scale (BIRS) | Higher score indicates worse status. | |
| Body image ‐ EORTC QLQ‐Breast‐Related 23 | Higher score indicates better status. | |
| Physical Self‐Perception Profile | Higher score indicates better status. | |
| Rosenberg Self‐Esteem Scale (RSE) | Higher score indicates better status. | Cadmus 2009; Courneya 2003; Musanti 2012; Mustian 2004; Segar 1998 |
| Social Physique Anxiety Scale 7 (SPAS‐7) | Higher score indicates worse status. | |
| Vitality/vigour | ||
| Vitality scale ‐ MOS SF‐36 | Higher score indicates better status. | Baruth 2013; Basen‐Enquist 2006; Cadmus 2009; Cormie 2014; Duijits 2012; Kiecolt‐Glaser 2014; Mehnert 2011; Mustian 2004 |
| Vigour subscale ‐ POMS | Higher score indicates better status. | Cantarero‐Villanueva 2013; Fillion 2008; Pinto 2003; Pinto 2005 |
| Other psychological measures | ||
| Basic Psychological Needs Satisfaction Scale (BNS) | Higher score indicates better status. | |
| Behavioral Regulation for Exercise Questionnaire 2 (BREQ‐2) | Higher score indicates higher status of each subscale. | |
| Endocrine symptoms ‐ FACT‐Endocrine symptoms | Higher score indicates worse status. | |
| Exercise role identity ‐ 9‐item, 5‐point Likert‐type instrument (Anderson and Cychosz) | Higher score indicates greater exercise role identity. | |
| Exercise self‐efficacy ‐ 14‐item Steinhardt and Dishman Questionnaire | Higher score indicates better status. | |
| Hot flashes and night sweats ‐ Hot Flush Rating Scale | Higher score indicates worse status. | |
| Outcome expectancy value ‐ 19‐item Steinhardt and | Higher score indicates higher outcome expectancy. | |
| Menopausal symptoms 0 to 9 scale | Higher score indicates worse status. | |
| Menopausal symptoms ‐ Women’s Health Questionnaire (WHQ) | Higher score indicates worse status. | |
| Self‐regulation ‐ 20‐item, 5‐point Likert‐type instrument | Higher score indicates better status. | |
| Symptom Checklist‐90 Revised (SCL‐90R) | Higher score indicates worse status. | |
| Urinary symptoms ‐ Bristol Female Lower Urinary Tract Symptoms Questionnaire (BFLUTS) | Higher score indicates worse status. | |
| Instrument or test name | Outcome | Measurement units | Trials using this instrument or test |
| 12‐Minute walk test | Cardiorespiratory fitness | Distance covered in metres | |
| 2‐Kilometre walking test | Cardiorespiratory fitness | Time to complete in minutes | |
| 6‐Minute walk test | Cardiorespiratory fitness | Distance covered in metres | Basen‐Enquist 2006; Kaltsatou 2011; Kim 2015; Mustian 2004; Nieman 1995 |
| Aerobic Power Index cycle test | Cardiorespiratory fitness | Relative power output in W/kg | |
| Astrand‐Rhyming cycle test | Cardiorespiratory fitness | Estimated maximal oxygen uptake (VO₂max) in mL/kg/min | |
| Ebbeling 8‐minute single‐stage walking treadmill test | Cardiorespiratory fitness | Distance covered in metres | |
| Graded exercise treadmill test | Cardiorespiratory fitness | Direct VO₂max in mL/kg/min | |
| Graded exercise cycle ergometer test | Cardiorespiratory fitness | Direct VO₂max in mL/kg/min | |
| Harvard step test | Cardiorespiratory fitness | Heart rate in beats per minute (bpm) post test | |
| Modified Bruce protocol | Cardiorespiratory fitness | Estimated VO₂max in mL/kg/min | |
| Naughton submaximal treadmill test | Cardiorespiratory fitness | Estimated VO₂max in mL/kg/min | |
| Rockport 1‐mile walk test | Cardiorespiratory fitness | Time to complete in minutes | |
| 7‐Day Physical Activity Recall (PAR) | Self‐reported physical activity | Minutes/week | Basen‐Enquist 2006; Cadmus 2009; Hatchett 2013; Pinto 2005; Pinto 2015 |
| Community Health Activities Model Programme for Seniors (CHAMPS) | Self‐reported physical activity | Metabolic equivalent (MET)‐h/week | Baruth 2013; Kiecolt‐Glaser 2014; Matthews 2007; Winters‐Stone 2011 |
| International Physical Activity Questionnaire (IPAQ) | Self‐reported physical activity | MET‐h/week | |
| Physical activity questionnaire | Self‐reported physical activity | Minutes/week | |
| Leisure Score Index (LSI) of Godin Leisure‐Time Exercise Questionnaire | Self‐reported physical activity | Minutes/week | Courneya 2003; Guinan 2013; Kim 2015; Rogers 2009; Rogers 2015; Short 2014; Vallance 2007 |
| Modifiable Activity Questionnaire | Self‐reported physical activity | MET‐h/week | |
| Physical Activity Recall Questionnaire | Self‐reported physical activity | MET‐h/week | |
| Accelerometer | Objective physical activity | Counts per minute/d | Guinan 2013; Matthews 2007; Pinto 2005; Pinto 2015; Rogers 2009; Rogers 2013; Rogers 2014; Rogers 2015 |
| Pedometer | Objective physical activity | Steps/d | |
| Body fat via bioelectrical impedance analysis (BIA) | Body composition | % and/or kg | Cerulli 2014; Daley 2007; Guinan 2013; Ligibel 2008; Matthews 2007; Musanti 2012; Mustian 2004; Rogers 2013; Rogers 2014 |
| Body fat and lean mass via dual‐energy X‐ray absorptiometry (DEXA) | Body composition | % and/or kg | Cadmus 2009; DeNysschen 2011; Matthews 2007; Rogers 2009; Saarto 2012; Schmitz 2005; Schmitz 2009; Winters‐Stone 2011 |
| Body fat and muscle mass via multi‐slice magnetic resonance imaging (MRI) | Body composition | % and kg | |
| Body mass index (BMI) | Anthropometric | kg/m² | Basen‐Enquist 2006; Cadmus 2009; Courneya 2003; Daley 2007; Kiecolt‐Glaser 2014; Ligibel 2008; Littman 2012; Murtezani 2014; Mustian 2004; Naumann 2012; Nikander 2007; Pinto 2003; Portela 2008; Rahnama 2010; Rogers 2009; Rogers 2013; Rogers 2014; Schmitz 2005; Schmitz 2009 |
| Body mass | Anthropometric | kg | Cadmus 2009; Courneya 2003; Daley 2007; DeNysschen 2011; Dolan 2016; Guinan 2013; Herrero 2006; Irwin 2015; Kiecolt‐Glaser 2014; Ligibel 2008; Littman 2012; Matthews 2007; Murtezani 2014; Musanti 2012; Naumann 2012; Nikander 2007; Pinto 2003; Rahnama 2010; Saarto 2012; Schmitz 2005; Schmitz 2009; Winters‐Stone 2011 |
| Skinfold thickness | Body composition | mm and/or % | |
| Hip circumference | Anthropometric | cm | Basen‐Enquist 2006; Cadmus 2009; Dolan 2016; Ligibel 2008; Littman 2012; Rahnama 2010; Rogers 2009 |
| Waist circumference | Anthropometric | cm | Basen‐Enquist 2006; Cadmus 2009; Dolan 2016; Guinan 2013; Ligibel 2008; Littman 2012; Rahnama 2010; Rogers 2009; Schmitz 2005 |
| Waist‐to‐hip ratio | Anthropometric | NA | Ligibel 2008; Rahnama 2010; Rogers 2009; Rogers 2013; Rogers 2014 |
| Handgrip strength | Muscular strength | kg | Irwin 2015; Kaltsatou 2011; Kim 2015; Mustian 2004; Portela 2008; Rogers 2009; Saarto 2012; Winters‐Stone 2011 |
| Repetition maximum (RM) bench/chest press | Muscular strength | kg | Cormie 2014; Milne 2008; Musanti 2012; Naumann 2012; Schmitz 2005; Schmitz 2009; Winters‐Stone 2011) |
| RM leg press | Muscular strength | kg | Cerulli 2014; Cormie 2014; Dolan 2016; Milne 2008; Musanti 2012; Naumann 2012; Schmitz 2005; Schmitz 2009; Winters‐Stone 2011 |
| Total bone mineral content (BMC) | Bone‐related outcomes | g/cm | |
| BMC of distal tibia, tibial midshaft, and femoral neck | Bone‐related outcomes | g/cm | |
| Bone mineral density (BMD) via DEXA | Bone‐related outcomes | g/cm² | Cadmus 2009; Kim 2015; Rogers 2009; Saarto 2012; Waltman 2010; Winters‐Stone 2011 |
| BMD of femoral neck and lumbar spine | Bone‐related outcomes | g/cm² | Kim 2015; Rogers 2009; Saarto 2012; Waltman 2010; Winters‐Stone 2011 |
| BMD greater trochanter via DEXA | Bone‐related outcomes | g/cm² | |
| BMD total hip via DEXA | Bone‐related outcomes | g/cm² | |
| BMD total radius and 33% radius via DEXA | Bone‐related outcomes | g/cm² | |
| Bone Remodeling Index (BRI) | Bone‐related outcomes | NA | |
| Serum bone‐specific alkaline phosphatase (BSAP) | Bone‐related outcomes | μg/L | |
| SerumN‐telopeptides of type I collagen (NTx) | Bone‐related outcomes | nm bone collagen equivalent (BCE) | |
| Serum osteocalcin | Bone‐related outcomes | nmol |
| Outcome | Immediate postintervention estimate (95% CI) | ≥ 3‐Month postintervention estimate (95% CI) | Change from baseline to end of intervention estimate (95% CI) | Change from baseline to ≥ 3‐month postintervention estimate (95% CI) |
| QoL subscale domain | ||||
| Cognitive function | SMD: 0.40 (0.11 to 0.69) N women (trials): 189 (5) I² = 0% | SMD: 0.31 (‐0.09 to 0.71) N women (trials): 97 (2) I² = 0% | SMD: ‐0.00 (‐0.27 to 0.26) N women (trials): 672 (5) I² = 35% | SMD: 0.20 (‐0.20 to 0.60) N women (trials): 97 (2) I² = 0% |
| Emotional function/mental health | SMD: 0.21 (0.10 to 0.32) N women (trials): 2102 (26) I² = 27% | SMD: 0.20 (0.03 to 0.36) N women (trials): 655 (7) I² = 10% | SMD: 0.31 (0.09 to 0.53) N women (trials): 1579 (15) I² = 72% | SMD: 0.06 (‐0.29 to 0.41) N women (trials): 179 (3) I² = 27% |
| General health perspective | SMD: 0.18 (‐0.08 to 0.45) N women (trials): 456 (1) I² = 47% | NA | SMD: 0.17 (‐0.07 to 0.40) N women (trials): 906 (9) I² = 49% | NA |
| Perceived physical function | SMD: 0.33 (0.18 to 0.49) N women (trials): 2129 (25) I² = 61% | SMD: 0.21 (0.06 to 0.37) N women (trials): 637 (6) I² = 0% | SMD: 0.60 (0.23 to 0.97) N women (trials): 1433 (13) I² = 89% | NA |
| Role function | SMD: 0.29 (0.07 to 0.51) N women (trials): 1370 (18) I² = 69% | SMD: 0.13 (‐0.12 to 0.38) N women (trials): 249 (2) I² = 0% | SMD: 0.14 (‐0.05 to 0.33) N women (trials): 1315 (12) I² = 50% | NA |
| Sexual function | SMD: 0.16 (‐0.04 to 0.35) N women (trials): 411 (5) I² = 0% | NA | SMD: 0.22 (‐0.08 to 0.52) N women (trials): 693 (3) I² = 62% | NA |
| Sleep | SMD: ‐0.09 (‐0.37 to 0.20) N women (trials): 188 (5) I² = 0% | NA | SMD: 0.14 (‐0.20 to 0.48) N women (trials): 136 (3) I² = 0% | NA |
| Social function | SMD: 0.19 (0.08 to 0.30) N women (trials): 1557 (18) I² = 11% | NA | SMD: 0.52 (0.16 to 0.87) N women (trials): 1384 (12) I² = 87% | NA |
| Other psychological outcomes | ||||
| Anxiety | SMD: ‐0.57 (‐0.95 to ‐0.19) N women (trials): 326 (7) I² = 60% | NA | SMD: ‐0.37 (‐0.63 to ‐0.12) N women (trials): 235 (4) I² = 0% | NA |
| Depression | SMD: ‐0.34 (‐0.62 to ‐0.05) N women (trials): 657 (12) I² = 63% | SMD: ‐0.28 (‐0.51 to ‐0.05) N women (trials): 340 (4) I² = 9% | SMD: ‐0.34 (‐0.63 to ‐0.05) N women (trials): 816 (7) I² = 62% | NA |
| Fatigue | SMD: ‐0.32 (‐0.47 to ‐0.18) N women (trials): 2020 (26) I² = 54% | SMD: ‐0.43 (‐0.60 to ‐0.26) N women (trials): 536 (7) I² = 0% | SMD:‐0.30 (‐0.61 to 0.00) N women (trials): 1289 (13) I² = 80% | SMD: ‐0.47 (‐0.84 to ‐0.11) N women (trials): 178 (4) I² = 23% |
| Happiness/satisfaction with life | SMD: 0.61 (‐0.16 to 1.37) N women (studies): 209 (4) I² = 85% | NA | SMD: 0.28 (‐0.05 to 0.62) N women (studies): 182 (3) I² = 23% | NA |
| Pain/disability | SMD: 0.08 (‐0.09 to 0.25) N women (trials): 535 (9) I² = 0% | NA | SMD: ‐0.08 (‐0.33 to 0.16) N women (trials): 296 (5) I² = 5% | NA |
| Self‐esteem | SMD: 0.27 (0.05 to 0.48) N women (trials): 667 (12) I² = 42% | NA | SMD: 0.23 (‐0.11 to 0.58) N women (trials): 992 (9) I² = 80% | NA |
| Vigour/vitality | SMD: 0.36 (0.21 to 0.50) N women (trials): 762 (10) I² = 0% | SMD: 0.26 (0.04 to 0.48) N women (trials): 454 (4) I² = 24% | SMD: 0.23 (0.00 to 0.45) N women (trials): 359 (6) I² = 10% | SMD: 0.20 (‐0.06 to 0.46) N women (trials): 233 (2) I² = 0% |
| Cardiorespiratory fitness outcomes | ||||
| Overall cardiorespiratory fitness | SMD: 0.44 (0.30 to 0.58) N women (trials): 1265 (23) I² = 30% | SMD: 0.36 (0.03 to 0.69) N women (trials): 362 (3) I² = 53% | SMD: 0.83 (0.40 to 1.27) N women (trials): 863 (9) I² = 82% | SMD: 0.42 (0.05 to 0.79) N women (trials): 115 (2) I² = 0% |
| Directly assessed VO₂peak (mL/kg/min) | MD: 1.89 (0.65 to 3.13) N women (trials): 199 (4) I² = 0% | NA | MD: 1.31 (0.66 to 1.96) N women (trials): 166 (3) I² = 68% | NA |
| Peak power output (W) | MD: 18.92 (9.64 to 28.20) N women (trials): 66 (2) I² = 0% | NA | NA | NA |
| Resting heart rate (bpm) | MD: ‐4.47 (‐7.94 to ‐1.00) N women (trials): 82 (2) I² = 0% | NA | MD: ‐1.05 (‐2.22 to 0.11) N women (trials): 86 (2) I² = 81% | NA |
| Resting systolic blood pressure (mmHg) | MD: ‐0.83 (‐3.72 to 2.05) N women (trials): 134 (4) I² = 0% | NA | MD: ‐1.12 (‐7.74 to 5.50) N women (trials): 143 (3) I² = 73% | NA |
| Resting diastolic blood pressure (mmHg) | MD: 0.66 (‐2.89 to 4.21) N women (trials): 106 (3) I² = 22% | NA | MD: 0.53 (‐1.61 to 2.68) N women (trials): 144 (3) I² = 23% | NA |
| Physical activity outcomes | ||||
| Self‐reported physical activity | SMD: 0.52 (0.33 to 0.71) N women (trials): 2012 (17) I² = 72% | SMD: 0.44 (0.17 to 0.72) N women (trials): 683 (4) I² = 53% | SMD: 0.57 (0.25 to 0.90) N women (trials): 1274 (8) I² = 82% | SMD: 0.51 (0.08 to 0.93) N women (trials): 521 (4) I² = 67% |
| Meeting recommended physical activity guidelines | OR: 8.44 (2.41 to 29.56) N women (trials): 819 (6) I² = 89% | OR: 3.11 (1.50 to 6.46) N women (trials): 280 (2) I² = 28% | NA | NA |
| Objective physical activity | SMD: 0.43 (0.19 to 0.66) N women (trials): 1248 (10) I² = 67% | SMD: 0.22 (‐0.21 to 0.66) N women (trials): 305 (3) I² = 58% | SMD: 0.71 (0.14 to 1.29) N women (trials): 508 (5) I² = 83% | SMD: 0.23 (‐1.00 to 1.46) N women (trials): 61 (2) I² = 81% |
| Objective sedentary behaviour | SMD: ‐1.45 (‐3.68 to 0.78) N women (trials): 103 (3) I² = 95% | NA | SMD: ‐0.01 (‐0.63 to 0.60) N women (trials): 103 (3) I² = 57% | NA |
| Anthropometric outcomes | ||||
| Mass (kg) | MD: 0.00 (‐0.57 to 0.58) N women (trials): 1210 (16) I² = 0% | NA | MD: ‐0.50 (‐0.98 to ‐0.01) N women (trials): 1047 (11) I² = 59% | NA |
| BMI (kg/m2) | MD: 0.01 (‐0.19 to 0.22) N women (trials): 1481 (17) I² = 0% | NA | MD: ‐0.22 (‐0.45 to 0.01) N women (trials): 485 (8) I² = 65% | NA |
| Body fat | SMD: ‐0.18 (‐0.34 to ‐0.03) N women (trials): 1162 (18) I² = 35% | NA | SMD: ‐0.62 (‐1.19 to ‐0.06) N women (trials): 499 (9) I² = 88% | NA |
| Lean mass | MD: 0.05 (‐0.11 to 0.21) N women (trials): 612 (8) I² = 0% | NA | MD: 0.80 (‐0.13 to 1.72) N women (trials): 760 (5) I² = 95% | NA |
| Waist‐to‐hip ratio | MD: ‐0.03 (‐0.06 to 0.01) N women (trials): 213 (5) I² = 54% | NA | MD: 0.00 (‐0.01 to 0.01) N women (trials): 124 (2) I² = 0% | NA |
| Waist circumference (cm) | MD: ‐0.50 (‐3.18 to 2.18) N women (trials): 330 (6) I² = 0% | NA | MD: ‐1.71 (‐2.56 to ‐0.86) N women (trials): 285 (5) I² = 48% | NA |
| Hip circumference (cm) | MD: ‐0.97 (‐3.96 to 2.01) N women (trials): 249 (4) I² = 0% | NA | MD: ‐2.37 (‐3.31 to ‐1.44) N women (trials): 115 (2) I² = 5% | NA |
| Muscular strength outcomes | ||||
| Lower body strength | SMD: 0.44 (0.09 to 0.78) N women (trials): 637 (10) I² = 74% | NA | SMD: 0.72 (0.38 to 1.07) N women (trials): 720 (8) I² = 73% | NA |
| Upper body strength | SMD: 0.42 (0.08 to 0.76) N women (trials): 13 (768) I² = 79% | NA | SMD: 0.72 (0.30 to 1.14) N women (trials): 832 (8) I² = 86% | NA |
| Grip strength | MD: 2.37 kg (0.20 to 4.55) N women (trials): 320 (7) I² = 68% | NA | SMD: 0.24 (‐0.09 to 0.58) N women (trials): 145 (2) I² = 0% | NA |
| Bone health outcomes | ||||
| Bone mineral content (change and postintervention values) | SMD: 0.04 (‐0.20 to 0.27) N women (trials): 525 (2) I² = 22% | NA | NA | NA |
| Bone mineral density – femoral neck (change and postintervention values) | SMD: 0.21 (‐0.13 to 0.55) N women (trials): 786 (4) I² = 75% | NA | NA | NA |
| Bone mineral density – lumbar spine (change and postintervention values) | SMD: 0.22 (‐0.09 to 0.53) N women (trials): 786 (4) I² = 70% | NA | NA | NA |
| Bone mineral density – total hip (change and postintervention values) | SMD: 0.58 (‐0.02 to 1.18) N women (trials): 329 (3) I² = 97% | NA | NA | NA |
| Bone formation ‐ Alkaline phosphatase (change and postintervention values) | SMD: ‐0.25 (‐1.81 to 1.31) N women (trials): 239 (2) I² = 89% | NA | NA | NA |
| Bone resorption ‐ serum NTx (change and postintervention values) | SMD: 0.38 (‐1.58 to 2.34) N women (trials): 278 (3) I² = 97% | NA | NA | NA |
| CI: confidence interval. MD: mean difference. NA: not applicable. OR: odds ratio. SMD: standardised mean difference. | ||||
| Outcome or subgroup title | No. of studies | No. of participants | Statistical method | Effect size |
| 1 Overall HRQoL (follow‐up values) Show forest plot | 22 | Std. Mean Difference (IV, Random, 95% CI) | Subtotals only | |
| 1.1 End of intervention | 22 | 1996 | Std. Mean Difference (IV, Random, 95% CI) | 0.39 [0.21, 0.57] |
| 1.2 Follow‐up | 4 | 418 | Std. Mean Difference (IV, Random, 95% CI) | 0.20 [0.00, 0.39] |
| 2 Overall HRQoL (change values) Show forest plot | 14 | Std. Mean Difference (IV, Random, 95% CI) | Subtotals only | |
| 2.1 End of intervention | 14 | 1459 | Std. Mean Difference (IV, Random, 95% CI) | 0.78 [0.39, 1.17] |
| 2.2 Follow‐up | 2 | 132 | Std. Mean Difference (IV, Random, 95% CI) | 0.52 [0.15, 0.88] |
| 3 FACT‐G (follow‐up values) Show forest plot | 10 | Mean Difference (IV, Random, 95% CI) | Subtotals only | |
| 3.1 End of intervention | 10 | 1094 | Mean Difference (IV, Random, 95% CI) | 7.06 [2.82, 11.30] |
| 3.2 Follow‐up | 3 | 342 | Mean Difference (IV, Random, 95% CI) | 2.81 [‐0.46, 6.08] |
| 4 FACT‐G (change values) Show forest plot | 6 | Mean Difference (IV, Random, 95% CI) | Subtotals only | |
| 4.1 End of intervention | 6 | 663 | Mean Difference (IV, Random, 95% CI) | 5.04 [1.32, 8.75] |
| 4.2 Follow‐up | 2 | 132 | Mean Difference (IV, Random, 95% CI) | 6.16 [1.63, 10.69] |
| 5 FACT‐B (follow‐up values) Show forest plot | 11 | Mean Difference (IV, Random, 95% CI) | Subtotals only | |
| 5.1 End of intervention | 11 | 1395 | Mean Difference (IV, Random, 95% CI) | 6.31 [1.15, 11.47] |
| 5.2 Follow‐up | 4 | 421 | Mean Difference (IV, Random, 95% CI) | 3.77 [0.11, 7.43] |
| 6 FACT‐B (change values) Show forest plot | 6 | Mean Difference (IV, Random, 95% CI) | Subtotals only | |
| 6.1 End of intervention | 6 | 605 | Mean Difference (IV, Random, 95% CI) | 8.16 [2.56, 13.76] |
| 6.2 Follow‐up | 2 | 132 | Mean Difference (IV, Random, 95% CI) | 6.95 [1.34, 12.56] |
| 7 FACT Breast Cancer Subscale (follow‐up values) Show forest plot | 11 | Mean Difference (IV, Random, 95% CI) | Subtotals only | |
| 7.1 End of intervention | 11 | 1043 | Mean Difference (IV, Random, 95% CI) | 1.98 [0.92, 3.04] |
| 7.2 Follow‐up | 4 | 386 | Mean Difference (IV, Random, 95% CI) | 3.20 [‐0.65, 7.05] |
| 8 FACT Breast Cancer Subscale (change values) Show forest plot | 7 | Mean Difference (IV, Random, 95% CI) | Subtotals only | |
| 8.1 End of intervention | 7 | 646 | Mean Difference (IV, Random, 95% CI) | 1.78 [‐0.14, 3.70] |
| 8.2 Follow‐up | 1 | 36 | Mean Difference (IV, Random, 95% CI) | 1.30 [‐1.56, 4.16] |
| 9 FACT Trial Outcome Index (follow‐up values) Show forest plot | 4 | Mean Difference (IV, Random, 95% CI) | Subtotals only | |
| 9.1 End of intervention | 4 | 658 | Mean Difference (IV, Random, 95% CI) | 7.90 [‐1.24, 17.04] |
| 9.2 Follow‐up | 1 | 213 | Mean Difference (IV, Random, 95% CI) | 3.60 [0.01, 7.19] |
| 10 EORTC QLQ‐C30 Global Health (follow‐up values) Show forest plot | 4 | Mean Difference (IV, Random, 95% CI) | Subtotals only | |
| 10.1 End of intervention | 4 | 195 | Mean Difference (IV, Random, 95% CI) | 7.85 [2.16, 13.55] |
| 10.2 Follow‐up | 0 | 0 | Mean Difference (IV, Random, 95% CI) | 0.0 [0.0, 0.0] |
| 11 EORTC QLQ‐C30 Global Health (change values) Show forest plot | 4 | Mean Difference (IV, Random, 95% CI) | Subtotals only | |
| 11.1 End of intervention | 4 | 633 | Mean Difference (IV, Random, 95% CI) | 9.53 [‐2.43, 21.49] |
| 11.2 Follow‐up | 0 | 0 | Mean Difference (IV, Random, 95% CI) | 0.0 [0.0, 0.0] |
| 12 Overall emotional function/mental health (follow‐up values) Show forest plot | 26 | Std. Mean Difference (IV, Random, 95% CI) | Subtotals only | |
| 12.1 End of intervention | 26 | 2102 | Std. Mean Difference (IV, Random, 95% CI) | 0.21 [0.10, 0.32] |
| 12.2 Follow‐up | 7 | 655 | Std. Mean Difference (IV, Random, 95% CI) | 0.20 [0.03, 0.36] |
| 13 Overall emotional function/mental health (change values) Show forest plot | 15 | Std. Mean Difference (IV, Random, 95% CI) | Subtotals only | |
| 13.1 End of intervention | 15 | 1579 | Std. Mean Difference (IV, Random, 95% CI) | 0.31 [0.09, 0.53] |
| 13.2 Follow‐up | 3 | 179 | Std. Mean Difference (IV, Random, 95% CI) | 0.06 [‐0.29, 0.41] |
| 14 FACT Emotional well‐being (follow‐up values) Show forest plot | 11 | Mean Difference (IV, Random, 95% CI) | Subtotals only | |
| 14.1 End of intervention | 11 | 1064 | Mean Difference (IV, Random, 95% CI) | 0.47 [0.01, 0.94] |
| 14.2 Follow‐up | 3 | 311 | Mean Difference (IV, Random, 95% CI) | 0.14 [‐0.85, 1.14] |
| 15 FACT Emotional well‐being (change values) Show forest plot | 6 | Mean Difference (IV, Random, 95% CI) | Subtotals only | |
| 15.1 End of intervention | 6 | 582 | Mean Difference (IV, Random, 95% CI) | 0.96 [0.34, 1.57] |
| 15.2 Follow‐up | 1 | 36 | Mean Difference (IV, Random, 95% CI) | 0.79 [‐0.67, 2.25] |
| 16 MOS SF Mental composite (follow‐up values) Show forest plot | 5 | Mean Difference (IV, Random, 95% CI) | Subtotals only | |
| 16.1 End of intervention | 5 | 563 | Mean Difference (IV, Random, 95% CI) | 0.49 [‐1.09, 2.06] |
| 16.2 Follow‐up | 3 | 281 | Mean Difference (IV, Random, 95% CI) | 2.27 [0.05, 4.50] |
| 17 MOS SF Mental composite (change values) Show forest plot | 2 | Mean Difference (IV, Fixed, 95% CI) | Subtotals only | |
| 17.1 End of intervention | 2 | 294 | Mean Difference (IV, Fixed, 95% CI) | 2.22 [‐0.95, 5.40] |
| 17.2 Follow‐up | 0 | 0 | Mean Difference (IV, Fixed, 95% CI) | 0.0 [0.0, 0.0] |
| 18 MOS SF Mental health (follow‐up values) Show forest plot | 7 | Mean Difference (IV, Random, 95% CI) | Subtotals only | |
| 18.1 End of intervention | 7 | 524 | Mean Difference (IV, Random, 95% CI) | 1.67 [‐0.65, 3.99] |
| 18.2 Follow‐up | 2 | 196 | Mean Difference (IV, Random, 95% CI) | 3.49 [‐0.97, 7.95] |
| 19 MOS SF Mental health (change values) Show forest plot | 5 | Mean Difference (IV, Fixed, 95% CI) | Subtotals only | |
| 19.1 End of intervention | 5 | 333 | Mean Difference (IV, Fixed, 95% CI) | 2.22 [0.70, 3.74] |
| 19.2 Follow‐up | 0 | 0 | Mean Difference (IV, Fixed, 95% CI) | 0.0 [0.0, 0.0] |
| 20 MOS SF Emotional role (follow‐up values) Show forest plot | 5 | Mean Difference (IV, Fixed, 95% CI) | Subtotals only | |
| 20.1 End of intervention | 5 | 330 | Mean Difference (IV, Fixed, 95% CI) | ‐0.00 [‐1.09, 1.09] |
| 20.2 Follow‐up | 1 | 120 | Mean Difference (IV, Fixed, 95% CI) | 3.06 [‐11.55, 17.67] |
| 21 MOS SF Emotional role (change values) Show forest plot | 4 | Mean Difference (IV, Fixed, 95% CI) | Subtotals only | |
| 21.1 End of intervention | 4 | 213 | Mean Difference (IV, Fixed, 95% CI) | 0.23 [‐0.79, 1.24] |
| 21.2 Follow‐up | 0 | 0 | Mean Difference (IV, Fixed, 95% CI) | 0.0 [0.0, 0.0] |
| 22 EORTC QLQ‐C30 Emotional function (follow‐up values) Show forest plot | 3 | Mean Difference (IV, Random, 95% CI) | Subtotals only | |
| 22.1 End of intervention | 3 | 135 | Mean Difference (IV, Random, 95% CI) | 11.53 [3.96, 19.11] |
| 22.2 Follow‐up | 0 | 0 | Mean Difference (IV, Random, 95% CI) | 0.0 [0.0, 0.0] |
| 23 EORTC QLQ‐C30 Emotional function (change values) Show forest plot | 3 | Mean Difference (IV, Random, 95% CI) | Subtotals only | |
| 23.1 End of intervention | 3 | 573 | Mean Difference (IV, Random, 95% CI) | 0.90 [‐5.12, 6.92] |
| 23.2 Follow‐up | 0 | 0 | Mean Difference (IV, Random, 95% CI) | 0.0 [0.0, 0.0] |
| 24 POMS total mood disturbance (follow‐up values) Show forest plot | 3 | Std. Mean Difference (IV, Random, 95% CI) | Subtotals only | |
| 24.1 End of intervention | 3 | 161 | Std. Mean Difference (IV, Random, 95% CI) | ‐0.93 [‐1.55, ‐0.32] |
| 24.2 Follow‐up | 1 | 61 | Std. Mean Difference (IV, Random, 95% CI) | ‐0.54 [‐1.06, ‐0.03] |
| 25 POMS total mood disturbance (change values) Show forest plot | 2 | Std. Mean Difference (IV, Random, 95% CI) | Subtotals only | |
| 25.1 End of intervention | 2 | 143 | Std. Mean Difference (IV, Random, 95% CI) | 0.07 [‐0.65, 0.79] |
| 25.2 Follow‐up | 2 | 143 | Std. Mean Difference (IV, Random, 95% CI) | 0.09 [‐0.23, 0.42] |
| 26 POMS anger subscale (follow‐up values) Show forest plot | 2 | Std. Mean Difference (IV, Random, 95% CI) | Subtotals only | |
| 26.1 End of intervention | 2 | 79 | Std. Mean Difference (IV, Random, 95% CI) | ‐0.78 [‐1.25, ‐0.31] |
| 26.2 Follow‐up | 1 | 61 | Std. Mean Difference (IV, Random, 95% CI) | ‐0.44 [‐0.94, 0.07] |
| 27 Happiness/satisfaction with life (follow‐up values) Show forest plot | 4 | Std. Mean Difference (IV, Random, 95% CI) | Subtotals only | |
| 27.1 End of intervention | 4 | 209 | Std. Mean Difference (IV, Random, 95% CI) | 0.61 [‐0.16, 1.37] |
| 27.2 Follow‐up | 0 | 0 | Std. Mean Difference (IV, Random, 95% CI) | 0.0 [0.0, 0.0] |
| 28 Happiness/satisfaction with life (change values) Show forest plot | 3 | Std. Mean Difference (IV, Random, 95% CI) | Subtotals only | |
| 28.1 End of intervention | 3 | 182 | Std. Mean Difference (IV, Random, 95% CI) | 0.28 [‐0.05, 0.62] |
| 28.2 Follow‐up | 0 | 0 | Std. Mean Difference (IV, Random, 95% CI) | 0.0 [0.0, 0.0] |
| 29 Overall physical function (follow‐up values) Show forest plot | 25 | Std. Mean Difference (IV, Random, 95% CI) | Subtotals only | |
| 29.1 End of intervention | 25 | 2129 | Std. Mean Difference (IV, Random, 95% CI) | 0.33 [0.18, 0.49] |
| 29.2 Follow‐up | 6 | 637 | Std. Mean Difference (IV, Random, 95% CI) | 0.21 [0.06, 0.37] |
| 30 Overall physical function (change values) Show forest plot | 13 | Std. Mean Difference (IV, Random, 95% CI) | Subtotals only | |
| 30.1 End of intervention | 13 | 1433 | Std. Mean Difference (IV, Random, 95% CI) | 0.60 [0.23, 0.97] |
| 30.2 Follow‐up | 1 | 36 | Std. Mean Difference (IV, Random, 95% CI) | 0.17 [‐0.48, 0.83] |
| 31 FACT Physical well‐being (follow‐up values) Show forest plot | 11 | Mean Difference (IV, Random, 95% CI) | Subtotals only | |
| 31.1 End of intervention | 11 | 1064 | Mean Difference (IV, Random, 95% CI) | 1.44 [0.31, 2.56] |
| 31.2 Follow‐up | 3 | 311 | Mean Difference (IV, Random, 95% CI) | 1.17 [0.22, 2.12] |
| 32 FACT Physical well‐being (change values) Show forest plot | 6 | Mean Difference (IV, Random, 95% CI) | Subtotals only | |
| 32.1 End of intervention | 6 | 579 | Mean Difference (IV, Random, 95% CI) | 1.60 [‐0.85, 4.05] |
| 32.2 Follow‐up | 1 | 36 | Mean Difference (IV, Random, 95% CI) | 0.9 [‐2.37, 4.17] |
| 33 MOS SF Physical composite (follow‐up values) Show forest plot | 4 | Mean Difference (IV, Fixed, 95% CI) | Subtotals only | |
| 33.1 End of intervention | 4 | 437 | Mean Difference (IV, Fixed, 95% CI) | 1.78 [0.12, 3.43] |
| 33.2 Follow‐up | 2 | 163 | Mean Difference (IV, Fixed, 95% CI) | 1.30 [‐1.23, 3.82] |
| 34 MOS SF Physical composite (change values) Show forest plot | 2 | Mean Difference (IV, Fixed, 95% CI) | Subtotals only | |
| 34.1 End of intervention | 2 | 294 | Mean Difference (IV, Fixed, 95% CI) | 2.56 [‐0.13, 5.25] |
| 34.2 Follow‐up | 0 | 0 | Mean Difference (IV, Fixed, 95% CI) | 0.0 [0.0, 0.0] |
| 35 MOS SF Physical function (follow‐up values) Show forest plot | 7 | Mean Difference (IV, Random, 95% CI) | Subtotals only | |
| 35.1 End of intervention | 7 | 515 | Mean Difference (IV, Random, 95% CI) | 2.09 [0.03, 4.15] |
| 35.2 Follow‐up | 2 | 239 | Mean Difference (IV, Random, 95% CI) | 2.71 [‐1.58, 6.99] |
| 36 MOS SF Physical function (change values) Show forest plot | 5 | Mean Difference (IV, Random, 95% CI) | Subtotals only | |
| 36.1 End of intervention | 5 | 333 | Mean Difference (IV, Random, 95% CI) | 2.08 [0.21, 3.94] |
| 36.2 Follow‐up | 0 | 0 | Mean Difference (IV, Random, 95% CI) | 0.0 [0.0, 0.0] |
| 37 EORTC QLQ‐C30 Physical function (follow‐up values) Show forest plot | 3 | Mean Difference (IV, Random, 95% CI) | Subtotals only | |
| 37.1 End of intervention | 3 | 135 | Mean Difference (IV, Random, 95% CI) | 2.99 [‐1.64, 7.63] |
| 37.2 Follow‐up | 0 | 0 | Mean Difference (IV, Random, 95% CI) | 0.0 [0.0, 0.0] |
| 38 EORTC QLQ‐C30 Physical function (change values) Show forest plot | 3 | Mean Difference (IV, Random, 95% CI) | Subtotals only | |
| 38.1 End of intrevention | 3 | 573 | Mean Difference (IV, Random, 95% CI) | 3.12 [‐3.24, 9.49] |
| 38.2 Follow‐up | 0 | 0 | Mean Difference (IV, Random, 95% CI) | 0.0 [0.0, 0.0] |
| 39 Body Esteem Scale ‐ Physical condition (follow‐up values) Show forest plot | 2 | Mean Difference (IV, Random, 95% CI) | Subtotals only | |
| 39.1 End of intervention | 2 | 106 | Mean Difference (IV, Random, 95% CI) | 4.41 [0.57, 8.25] |
| 39.2 Follow‐up | 0 | 0 | Mean Difference (IV, Random, 95% CI) | 0.0 [0.0, 0.0] |
| 40 Overall role function (follow‐up values) Show forest plot | 18 | Std. Mean Difference (IV, Random, 95% CI) | Subtotals only | |
| 40.1 End of intervention | 18 | 1370 | Std. Mean Difference (IV, Random, 95% CI) | 0.29 [0.07, 0.51] |
| 40.2 Follow‐up | 2 | 249 | Std. Mean Difference (IV, Random, 95% CI) | 0.13 [‐0.12, 0.38] |
| 41 Overall role function (change values) Show forest plot | 12 | Std. Mean Difference (IV, Random, 95% CI) | Subtotals only | |
| 41.1 End of intervention | 12 | 1315 | Std. Mean Difference (IV, Random, 95% CI) | 0.14 [‐0.05, 0.33] |
| 41.2 Follow‐up | 1 | 36 | Std. Mean Difference (IV, Random, 95% CI) | 0.37 [‐0.29, 1.03] |
| 42 FACT Functional well‐being (follow‐up values) Show forest plot | 11 | Mean Difference (IV, Random, 95% CI) | Subtotals only | |
| 42.1 End of intervention | 11 | 1064 | Mean Difference (IV, Random, 95% CI) | 1.67 [0.29, 3.06] |
| 42.2 Follow‐up | 2 | 249 | Mean Difference (IV, Random, 95% CI) | 0.68 [‐0.65, 2.01] |
| 43 FACT Functional well‐being (change values) Show forest plot | 6 | Mean Difference (IV, Fixed, 95% CI) | Subtotals only | |
| 43.1 End of intervention | 6 | 582 | Mean Difference (IV, Fixed, 95% CI) | 0.72 [0.42, 1.01] |
| 43.2 Follow‐up | 1 | 36 | Mean Difference (IV, Fixed, 95% CI) | 1.31 [‐1.02, 3.64] |
| 44 MOS SF Physical role (follow‐up values) Show forest plot | 3 | Mean Difference (IV, Fixed, 95% CI) | Subtotals only | |
| 44.1 End of intervention | 3 | 143 | Mean Difference (IV, Fixed, 95% CI) | ‐0.16 [‐1.47, 1.15] |
| 44.2 Follow‐up | 0 | 0 | Mean Difference (IV, Fixed, 95% CI) | 0.0 [0.0, 0.0] |
| 45 MOS SF Physical role (change values) Show forest plot | 3 | Mean Difference (IV, Random, 95% CI) | Subtotals only | |
| 45.1 End of intervention | 3 | 155 | Mean Difference (IV, Random, 95% CI) | 0.46 [‐1.52, 2.43] |
| 45.2 Follow‐up | 0 | 0 | Mean Difference (IV, Random, 95% CI) | 0.0 [0.0, 0.0] |
| 46 EORTC QLQ‐C30 Role function (follow‐up values) Show forest plot | 3 | Mean Difference (IV, Random, 95% CI) | Subtotals only | |
| 46.1 End of intervention | 3 | 135 | Mean Difference (IV, Random, 95% CI) | 0.44 [‐5.78, 6.66] |
| 46.2 Follow‐up | 0 | 0 | Mean Difference (IV, Random, 95% CI) | 0.0 [0.0, 0.0] |
| 47 EORTC QLQ‐C30 Role function (change values) Show forest plot | 3 | Mean Difference (IV, Fixed, 95% CI) | Subtotals only | |
| 47.1 End of intervention | 3 | 573 | Mean Difference (IV, Fixed, 95% CI) | ‐1.08 [‐4.52, 2.36] |
| 47.2 Follow‐up | 0 | 0 | Mean Difference (IV, Fixed, 95% CI) | 0.0 [0.0, 0.0] |
| 48 Overall social well‐being/function (follow‐up values) Show forest plot | 18 | Std. Mean Difference (IV, Random, 95% CI) | Subtotals only | |
| 48.1 End of intervention | 18 | 1557 | Std. Mean Difference (IV, Random, 95% CI) | 0.19 [0.08, 0.30] |
| 48.2 Follow‐up | 1 | 213 | Std. Mean Difference (IV, Random, 95% CI) | 0.09 [‐0.18, 0.36] |
| 49 Overall social well‐being/function (change values) Show forest plot | 12 | Std. Mean Difference (IV, Random, 95% CI) | Subtotals only | |
| 49.1 End of intervention | 12 | 1384 | Std. Mean Difference (IV, Random, 95% CI) | 0.52 [0.16, 0.87] |
| 49.2 Follow‐up | 1 | 36 | Std. Mean Difference (IV, Random, 95% CI) | 0.69 [0.01, 1.36] |
| 50 FACT Social well‐being (follow‐up values) Show forest plot | 11 | Mean Difference (IV, Random, 95% CI) | Subtotals only | |
| 50.1 End of intervention | 11 | 1064 | Mean Difference (IV, Random, 95% CI) | 0.77 [0.11, 1.43] |
| 50.2 Follow‐up | 1 | 213 | Mean Difference (IV, Random, 95% CI) | 0.5 [‐1.02, 2.02] |
| 51 FACT Social well‐being (change values) Show forest plot | 6 | Mean Difference (IV, Fixed, 95% CI) | Subtotals only | |
| 51.1 End of intervention | 6 | 582 | Mean Difference (IV, Fixed, 95% CI) | 1.93 [1.58, 2.28] |
| 51.2 Follow‐up | 1 | 36 | Mean Difference (IV, Fixed, 95% CI) | 3.86 [0.17, 7.55] |
| 52 MOS SF Social functioning (follow‐up values) Show forest plot | 5 | Mean Difference (IV, Fixed, 95% CI) | Subtotals only | |
| 52.1 End of intervention | 5 | 234 | Mean Difference (IV, Fixed, 95% CI) | ‐0.32 [‐1.87, 1.23] |
| 52.2 Follow‐up | 0 | 0 | Mean Difference (IV, Fixed, 95% CI) | 0.0 [0.0, 0.0] |
| 53 MOS SF Social functioning (change values) Show forest plot | 4 | Mean Difference (IV, Fixed, 95% CI) | Subtotals only | |
| 53.1 End of intervention | 4 | 213 | Mean Difference (IV, Fixed, 95% CI) | 1.05 [‐0.08, 2.18] |
| 53.2 Follow‐up | 0 | 0 | Mean Difference (IV, Fixed, 95% CI) | 0.0 [0.0, 0.0] |
| 54 EORTC QLQ‐C30 Social function (follow‐up values) Show forest plot | 2 | Mean Difference (IV, Random, 95% CI) | Subtotals only | |
| 54.1 End of intervention | 2 | 73 | Mean Difference (IV, Random, 95% CI) | 7.55 [‐11.77, 26.86] |
| 54.2 Follow‐up | 0 | 0 | Mean Difference (IV, Random, 95% CI) | 0.0 [0.0, 0.0] |
| 55 EORTC QLQ‐C30 Social function (change values) Show forest plot | 3 | Mean Difference (IV, Random, 95% CI) | Subtotals only | |
| 55.1 End of intervention | 3 | 573 | Mean Difference (IV, Random, 95% CI) | 2.14 [‐8.02, 12.30] |
| 55.2 Follow‐up | 0 | 0 | Mean Difference (IV, Random, 95% CI) | 0.0 [0.0, 0.0] |
| 56 Overall cognitive function (follow‐up values) Show forest plot | 5 | Std. Mean Difference (IV, Random, 95% CI) | Subtotals only | |
| 56.1 End of intervention | 5 | 189 | Std. Mean Difference (IV, Random, 95% CI) | 0.40 [0.11, 0.69] |
| 56.2 Follow‐up | 2 | 97 | Std. Mean Difference (IV, Random, 95% CI) | 0.31 [‐0.09, 0.71] |
| 57 Overall cognitive function (change values) Show forest plot | 5 | Std. Mean Difference (IV, Random, 95% CI) | Subtotals only | |
| 57.1 End of intervention | 5 | 672 | Std. Mean Difference (IV, Random, 95% CI) | ‐0.00 [‐0.27, 0.26] |
| 57.2 Follow‐up | 2 | 97 | Std. Mean Difference (IV, Random, 95% CI) | 0.20 [‐0.20, 0.60] |
| 58 EORTC QLQ‐C30 Cognitive function (follow‐up values) Show forest plot | 2 | Mean Difference (IV, Fixed, 95% CI) | Subtotals only | |
| 58.1 End of intervention | 2 | 73 | Mean Difference (IV, Fixed, 95% CI) | 2.43 [‐5.75, 10.61] |
| 58.2 Follow‐up | 0 | 0 | Mean Difference (IV, Fixed, 95% CI) | 0.0 [0.0, 0.0] |
| 59 EORTC QLQ‐C30 Cognitive function (change values) Show forest plot | 3 | Mean Difference (IV, Fixed, 95% CI) | Subtotals only | |
| 59.1 End of intervention | 3 | 573 | Mean Difference (IV, Fixed, 95% CI) | ‐3.25 [‐6.31, ‐0.18] |
| 59.2 Follow‐up | 0 | 0 | Mean Difference (IV, Fixed, 95% CI) | 0.0 [0.0, 0.0] |
| 60 POMS confusion subscale (follow‐up values) Show forest plot | 2 | Std. Mean Difference (IV, Fixed, 95% CI) | Subtotals only | |
| 60.1 End of intervention | 2 | 79 | Std. Mean Difference (IV, Fixed, 95% CI) | ‐0.66 [‐1.12, ‐0.19] |
| 60.2 Follow‐up | 1 | 61 | Std. Mean Difference (IV, Fixed, 95% CI) | ‐0.45 [‐0.96, 0.06] |
| 61 Overall general health (follow‐up values) Show forest plot | 9 | Std. Mean Difference (IV, Random, 95% CI) | Subtotals only | |
| 61.1 End of intervention | 9 | 456 | Std. Mean Difference (IV, Random, 95% CI) | 0.18 [‐0.08, 0.45] |
| 61.2 Follow‐up | 1 | 36 | Std. Mean Difference (IV, Random, 95% CI) | ‐0.22 [‐0.87, 0.44] |
| 62 Overall general health (change values) Show forest plot | 9 | Std. Mean Difference (IV, Random, 95% CI) | Subtotals only | |
| 62.1 End of intervention | 9 | 906 | Std. Mean Difference (IV, Random, 95% CI) | 0.17 [‐0.07, 0.40] |
| 62.2 Follow‐up | 1 | 36 | Std. Mean Difference (IV, Random, 95% CI) | 0.07 [‐0.59, 0.72] |
| 63 MOS SF General health (follow‐up values) Show forest plot | 5 | Mean Difference (IV, Random, 95% CI) | Subtotals only | |
| 63.1 End of intervention | 5 | 233 | Mean Difference (IV, Random, 95% CI) | 2.14 [‐2.61, 6.88] |
| 63.2 Follow‐up | 0 | 0 | Mean Difference (IV, Random, 95% CI) | 0.0 [0.0, 0.0] |
| 64 MOS SF General health (change values) Show forest plot | 4 | Mean Difference (IV, Fixed, 95% CI) | Subtotals only | |
| 64.1 End of intervention | 4 | 213 | Mean Difference (IV, Fixed, 95% CI) | 0.10 [‐1.26, 1.45] |
| 64.2 Follow‐up | 0 | 0 | Mean Difference (IV, Fixed, 95% CI) | 0.0 [0.0, 0.0] |
| 65 Overall sexual function (follow‐up values) Show forest plot | 5 | Std. Mean Difference (IV, Fixed, 95% CI) | Subtotals only | |
| 65.1 End of intervention | 5 | 411 | Std. Mean Difference (IV, Fixed, 95% CI) | 0.16 [‐0.04, 0.35] |
| 65.2 Follow‐up | 1 | 102 | Std. Mean Difference (IV, Fixed, 95% CI) | 0.19 [‐0.20, 0.58] |
| 66 Overall sexual function (change values) Show forest plot | 3 | Std. Mean Difference (IV, Random, 95% CI) | Subtotals only | |
| 66.1 End of intervention | 3 | 693 | Std. Mean Difference (IV, Random, 95% CI) | 0.22 [‐0.08, 0.52] |
| 66.2 Follow‐up | 0 | 0 | Std. Mean Difference (IV, Random, 95% CI) | 0.0 [0.0, 0.0] |
| 67 Body Esteem Scale ‐ sexual attractiveness (follow‐up values) Show forest plot | 2 | Mean Difference (IV, Fixed, 95% CI) | Subtotals only | |
| 67.1 End of intervention | 2 | 100 | Mean Difference (IV, Fixed, 95% CI) | 1.71 [‐1.41, 4.82] |
| 67.2 Follow‐up | 0 | 0 | Mean Difference (IV, Fixed, 95% CI) | 0.0 [0.0, 0.0] |
| 68 Overall sleep (follow‐up values) Show forest plot | 5 | Std. Mean Difference (IV, Fixed, 95% CI) | Subtotals only | |
| 68.1 End of intervention | 5 | 188 | Std. Mean Difference (IV, Fixed, 95% CI) | ‐0.09 [‐0.37, 0.20] |
| 68.2 Follow‐up | 1 | 31 | Std. Mean Difference (IV, Fixed, 95% CI) | ‐0.49 [‐1.20, 0.23] |
| 69 Overall sleep (change values) Show forest plot | 3 | Std. Mean Difference (IV, Random, 95% CI) | Subtotals only | |
| 69.1 End of intervention | 3 | 136 | Std. Mean Difference (IV, Random, 95% CI) | 0.14 [‐0.20, 0.48] |
| 69.2 Follow‐up | 0 | 0 | Std. Mean Difference (IV, Random, 95% CI) | 0.0 [0.0, 0.0] |
| 70 PSQI Global sleep score (follow‐up values) Show forest plot | 5 | Mean Difference (IV, Fixed, 95% CI) | Subtotals only | |
| 70.1 End of intervention | 5 | 317 | Mean Difference (IV, Fixed, 95% CI) | ‐0.47 [‐1.01, 0.08] |
| 70.2 Follow‐up | 1 | 31 | Mean Difference (IV, Fixed, 95% CI) | ‐1.5 [‐3.63, 0.63] |
| 71 PSQI Global sleep score (change values) Show forest plot | 2 | Mean Difference (IV, Fixed, 95% CI) | Subtotals only | |
| 71.1 End of intervention | 2 | 80 | Mean Difference (IV, Fixed, 95% CI) | 0.54 [‐1.11, 2.19] |
| 71.2 Follow‐up | 0 | 0 | Mean Difference (IV, Fixed, 95% CI) | 0.0 [0.0, 0.0] |
| 72 PSQI sleep quality (follow‐up values) Show forest plot | 2 | Mean Difference (IV, Random, 95% CI) | Subtotals only | |
| 72.1 End of intervention | 2 | 80 | Mean Difference (IV, Random, 95% CI) | ‐0.24 [‐0.81, 0.32] |
| 72.2 Follow‐up | 0 | 0 | Mean Difference (IV, Random, 95% CI) | 0.0 [0.0, 0.0] |
| 73 PSQI sleep efficiency (follow‐up values) Show forest plot | 3 | Mean Difference (IV, Fixed, 95% CI) | Subtotals only | |
| 73.1 End of intervention | 3 | 100 | Mean Difference (IV, Fixed, 95% CI) | 0.15 [‐0.24, 0.53] |
| 73.2 Follow‐up | 0 | 0 | Mean Difference (IV, Fixed, 95% CI) | 0.0 [0.0, 0.0] |
| 74 PSQI sleep latency (follow‐up values) Show forest plot | 3 | Mean Difference (IV, Fixed, 95% CI) | Subtotals only | |
| 74.1 End of intervention | 3 | 100 | Mean Difference (IV, Fixed, 95% CI) | 0.19 [‐0.16, 0.55] |
| 74.2 Follow‐up | 0 | 0 | Mean Difference (IV, Fixed, 95% CI) | 0.0 [0.0, 0.0] |
| 75 PSQI sleep duration (follow‐up values) Show forest plot | 2 | Mean Difference (IV, Fixed, 95% CI) | Subtotals only | |
| 75.1 End of intervention | 2 | 80 | Mean Difference (IV, Fixed, 95% CI) | 0.06 [‐0.28, 0.41] |
| 75.2 Follow‐up | 0 | 0 | Mean Difference (IV, Fixed, 95% CI) | 0.0 [0.0, 0.0] |
| 76 PSQI daytime dysfunction (follow‐up values) Show forest plot | 3 | Mean Difference (IV, Random, 95% CI) | Subtotals only | |
| 76.1 End of intervention | 3 | 100 | Mean Difference (IV, Random, 95% CI) | ‐0.08 [‐0.51, 0.35] |
| 76.2 Follow‐up | 0 | 0 | Mean Difference (IV, Random, 95% CI) | 0.0 [0.0, 0.0] |
| 77 PSQI medication use (follow‐up values) Show forest plot | 2 | Std. Mean Difference (IV, Random, 95% CI) | Subtotals only | |
| 77.1 End of intervention | 2 | 80 | Std. Mean Difference (IV, Random, 95% CI) | ‐0.06 [‐0.50, 0.38] |
| 77.2 Follow‐up | 0 | 0 | Std. Mean Difference (IV, Random, 95% CI) | 0.0 [0.0, 0.0] |
| 78 Accelerator‐derived sleep efficiency (follow‐up values) Show forest plot | 2 | Mean Difference (IV, Fixed, 95% CI) | Subtotals only | |
| 78.1 End of intervention | 2 | 62 | Mean Difference (IV, Fixed, 95% CI) | ‐2.25 [‐5.52, 1.01] |
| 78.2 Follow‐up | 0 | 0 | Mean Difference (IV, Fixed, 95% CI) | 0.0 [0.0, 0.0] |
| 79 Accelerator‐derived sleep latency (follow‐up values) Show forest plot | 2 | Mean Difference (IV, Fixed, 95% CI) | Subtotals only | |
| 79.1 End of intervention | 2 | 62 | Mean Difference (IV, Fixed, 95% CI) | ‐2.04 [‐4.78, 0.69] |
| 79.2 Follow‐up | 0 | 0 | Mean Difference (IV, Fixed, 95% CI) | 0.0 [0.0, 0.0] |
| Outcome or subgroup title | No. of studies | No. of participants | Statistical method | Effect size |
| 1 Overall anxiety (follow‐up values) Show forest plot | 7 | Std. Mean Difference (IV, Random, 95% CI) | Subtotals only | |
| 1.1 End of intervention | 7 | 326 | Std. Mean Difference (IV, Random, 95% CI) | ‐0.57 [‐0.95, ‐0.19] |
| 1.2 Follow‐up | 1 | 61 | Std. Mean Difference (IV, Random, 95% CI) | ‐0.47 [‐0.98, 0.04] |
| 2 Overall anxiety (change values) Show forest plot | 4 | Std. Mean Difference (IV, Fixed, 95% CI) | Subtotals only | |
| 2.1 End of intervention | 4 | 235 | Std. Mean Difference (IV, Fixed, 95% CI) | ‐0.37 [‐0.63, ‐0.12] |
| 2.2 Follow‐up | 1 | 61 | Std. Mean Difference (IV, Fixed, 95% CI) | ‐0.30 [‐0.81, 0.20] |
| 3 POMS tension ‐ anxiety (follow‐up values) Show forest plot | 2 | Std. Mean Difference (IV, Fixed, 95% CI) | Subtotals only | |
| 3.1 End of intervention | 2 | 79 | Std. Mean Difference (IV, Fixed, 95% CI) | ‐0.66 [‐1.12, ‐0.20] |
| 3.2 Follow‐up | 1 | 61 | Std. Mean Difference (IV, Fixed, 95% CI) | ‐0.47 [‐0.98, 0.04] |
| 4 State Trait Anxiety Inventory (follow‐up values) Show forest plot | 2 | Std. Mean Difference (IV, Random, 95% CI) | Subtotals only | |
| 4.1 End of intervention | 2 | 89 | Std. Mean Difference (IV, Random, 95% CI) | ‐1.20 [‐3.49, 1.09] |
| 4.2 Follow‐up | 0 | 0 | Std. Mean Difference (IV, Random, 95% CI) | 0.0 [0.0, 0.0] |
| 5 Cohen's Perceived Stress Scale Show forest plot | 2 | Mean Difference (IV, Fixed, 95% CI) | Subtotals only | |
| 5.1 End of intervention | 2 | 105 | Mean Difference (IV, Fixed, 95% CI) | ‐1.25 [‐3.99, 1.50] |
| 5.2 Follow‐up | 0 | 0 | Mean Difference (IV, Fixed, 95% CI) | 0.0 [0.0, 0.0] |
| Outcome or subgroup title | No. of studies | No. of participants | Statistical method | Effect size |
| 1 Overall depression (follow‐up values) Show forest plot | 12 | Std. Mean Difference (IV, Random, 95% CI) | Subtotals only | |
| 1.1 End of intervention | 12 | 657 | Std. Mean Difference (IV, Random, 95% CI) | ‐0.34 [‐0.62, ‐0.05] |
| 1.2 Follow‐up | 4 | 340 | Std. Mean Difference (IV, Random, 95% CI) | ‐0.28 [‐0.51, ‐0.05] |
| 2 Overall depression (change values) Show forest plot | 7 | Std. Mean Difference (IV, Random, 95% CI) | Subtotals only | |
| 2.1 End of intervention | 7 | 816 | Std. Mean Difference (IV, Random, 95% CI) | ‐0.34 [‐0.63, ‐0.05] |
| 2.2 Follow‐up | 1 | 61 | Std. Mean Difference (IV, Random, 95% CI) | ‐0.46 [‐0.97, 0.05] |
| 3 Beck Depression Inventory‐II (follow‐up values) Show forest plot | 5 | Mean Difference (IV, Random, 95% CI) | Subtotals only | |
| 3.1 End of intervention | 5 | 198 | Mean Difference (IV, Random, 95% CI) | ‐3.25 [‐5.94, ‐0.56] |
| 3.2 Follow‐up | 2 | 93 | Mean Difference (IV, Random, 95% CI) | ‐2.35 [‐5.31, 0.60] |
| 4 Beck Depression Inventory‐II (change values) Show forest plot | 3 | Mean Difference (IV, Random, 95% CI) | Subtotals only | |
| 4.1 End of intervention | 3 | 581 | Mean Difference (IV, Random, 95% CI) | ‐1.84 [‐5.33, 1.65] |
| 4.2 Follow‐up | 0 | 0 | Mean Difference (IV, Random, 95% CI) | 0.0 [0.0, 0.0] |
| 5 CES‐Depression scale (follow‐up values) Show forest plot | 3 | Mean Difference (IV, Fixed, 95% CI) | Subtotals only | |
| 5.1 End of intervention | 3 | 280 | Mean Difference (IV, Fixed, 95% CI) | ‐1.36 [‐3.39, 0.67] |
| 5.2 Follow‐up | 1 | 186 | Mean Difference (IV, Fixed, 95% CI) | ‐1.90 [‐4.32, 0.52] |
| 6 POMS depression subscale (follow‐up values) Show forest plot | 2 | Mean Difference (IV, Random, 95% CI) | Subtotals only | |
| 6.1 End of intervention | 2 | 79 | Mean Difference (IV, Random, 95% CI) | ‐6.39 [‐10.66, ‐2.12] |
| 6.2 Follow‐up | 1 | 61 | Mean Difference (IV, Random, 95% CI) | ‐6.65 [‐11.97, ‐1.33] |
| 7 POMS tension subscale (follow‐up values) Show forest plot | 2 | Mean Difference (IV, Random, 95% CI) | Subtotals only | |
| 7.1 End of intervention | 2 | 79 | Mean Difference (IV, Random, 95% CI) | ‐5.14 [‐9.55, ‐0.73] |
| 7.2 Follow‐up | 1 | 61 | Mean Difference (IV, Random, 95% CI) | ‐4.87 [‐10.09, 0.35] |
| Outcome or subgroup title | No. of studies | No. of participants | Statistical method | Effect size |
| 1 Overall fatigue (follow‐up values) Show forest plot | 26 | Std. Mean Difference (IV, Random, 95% CI) | Subtotals only | |
| 1.1 End of intervention | 26 | 2020 | Std. Mean Difference (IV, Random, 95% CI) | ‐0.32 [‐0.47, ‐0.18] |
| 1.2 Follow‐up | 7 | 536 | Std. Mean Difference (IV, Random, 95% CI) | ‐0.43 [‐0.60, ‐0.26] |
| 2 Overall fatigue (change values) Show forest plot | 13 | Std. Mean Difference (IV, Random, 95% CI) | Subtotals only | |
| 2.1 End of intervention | 13 | 1289 | Std. Mean Difference (IV, Random, 95% CI) | ‐0.30 [‐0.61, 0.00] |
| 2.2 Follow‐up | 4 | 178 | Std. Mean Difference (IV, Random, 95% CI) | ‐0.47 [‐0.84, ‐0.11] |
| 3 FACT‐Fatigue (follow‐up values) Show forest plot | 7 | Mean Difference (IV, Fixed, 95% CI) | Subtotals only | |
| 3.1 End of intervention | 7 | 952 | Mean Difference (IV, Fixed, 95% CI) | 1.14 [‐0.06, 2.35] |
| 3.2 Follow‐up | 2 | 112 | Mean Difference (IV, Fixed, 95% CI) | 1.49 [‐1.95, 4.93] |
| 4 FACT‐Fatigue (change values) Show forest plot | 4 | Mean Difference (IV, Random, 95% CI) | Subtotals only | |
| 4.1 End of intervention | 4 | 925 | Mean Difference (IV, Random, 95% CI) | ‐0.54 [‐3.23, 2.14] |
| 4.2 Follow‐up | 1 | 36 | Mean Difference (IV, Random, 95% CI) | 1.28 [‐4.11, 6.67] |
| 5 EORTC QLQ‐C30 Fatigue scale (follow‐up values) Show forest plot | 2 | Mean Difference (IV, Fixed, 95% CI) | Subtotals only | |
| 5.1 End of intervention | 2 | 119 | Mean Difference (IV, Fixed, 95% CI) | ‐6.83 [‐13.08, ‐0.58] |
| 5.2 Follow‐up | 0 | 0 | Mean Difference (IV, Fixed, 95% CI) | 0.0 [0.0, 0.0] |
| 6 EORTC QLQ‐C30 Fatigue scale (change values) Show forest plot | 2 | Mean Difference (IV, Random, 95% CI) | Subtotals only | |
| 6.1 End of intervention | 2 | 73 | Mean Difference (IV, Random, 95% CI) | ‐2.81 [‐14.98, 9.36] |
| 6.2 Follow‐up | 0 | 0 | Mean Difference (IV, Random, 95% CI) | 0.0 [0.0, 0.0] |
| 7 Multidimensional Fatigue Symptom Inventory (follow‐up values) Show forest plot | 5 | Mean Difference (IV, Random, 95% CI) | Subtotals only | |
| 7.1 End of intervention | 5 | 366 | Mean Difference (IV, Random, 95% CI) | ‐0.53 [‐1.35, 0.29] |
| 7.2 Follow‐up | 3 | 304 | Mean Difference (IV, Random, 95% CI) | ‐2.04 [‐4.30, 0.23] |
| 8 Multidimensional Fatigue Symptom Inventory ‐ interference (follow‐up values) Show forest plot | 2 | Mean Difference (IV, Random, 95% CI) | Subtotals only | |
| 8.1 End of intervention | 2 | 62 | Mean Difference (IV, Random, 95% CI) | ‐0.37 [‐1.34, 0.60] |
| 8.2 Follow‐up | 0 | 0 | Mean Difference (IV, Random, 95% CI) | 0.0 [0.0, 0.0] |
| 9 Revised Piper Fatigue Scale total fatigue (follow‐up values) Show forest plot | 4 | Mean Difference (IV, Random, 95% CI) | Subtotals only | |
| 9.1 End of intervention | 4 | 187 | Mean Difference (IV, Random, 95% CI) | ‐1.18 [‐2.38, 0.02] |
| 9.2 Follow‐up | 2 | 120 | Mean Difference (IV, Random, 95% CI) | ‐1.15 [‐1.86, ‐0.43] |
| 10 Revised Piper Fatigue Scale total fatigue (change values) Show forest plot | 4 | Mean Difference (IV, Random, 95% CI) | Subtotals only | |
| 10.1 End of intervention | 4 | 166 | Mean Difference (IV, Random, 95% CI) | ‐1.96 [‐2.93, 1.00] |
| 10.2 Follow‐up | 2 | 120 | Mean Difference (IV, Random, 95% CI) | ‐1.14 [‐1.78, ‐0.49] |
| 11 Revised Piper Fatigue Scale behavioural/severity (follow‐up values) Show forest plot | 3 | Mean Difference (IV, Random, 95% CI) | Subtotals only | |
| 11.1 End of intervention | 3 | 121 | Mean Difference (IV, Random, 95% CI) | ‐1.24 [‐2.49, 0.01] |
| 11.2 Follow‐up | 1 | 61 | Mean Difference (IV, Random, 95% CI) | ‐1.41 [‐2.57, ‐0.25] |
| 12 Revised Piper Fatigue Scale affective/meaning (follow‐up values) Show forest plot | 3 | Mean Difference (IV, Fixed, 95% CI) | Subtotals only | |
| 12.1 End of intervention | 3 | 121 | Mean Difference (IV, Fixed, 95% CI) | ‐2.11 [‐3.03, ‐1.20] |
| 12.2 Follow‐up | 1 | 61 | Mean Difference (IV, Fixed, 95% CI) | ‐2.05 [‐3.21, ‐0.89] |
| 13 Revised Piper Fatigue Scale sensory (follow‐up values) Show forest plot | 3 | Mean Difference (IV, Random, 95% CI) | Subtotals only | |
| 13.1 End of intervention | 3 | 121 | Mean Difference (IV, Random, 95% CI) | ‐0.44 [‐3.11, 2.22] |
| 13.2 Follow‐up | 1 | 61 | Mean Difference (IV, Random, 95% CI) | ‐1.60 [‐2.65, ‐0.55] |
| 14 Revised Piper Fatigue Scale cognitive/mood (follow‐up values) Show forest plot | 3 | Mean Difference (IV, Random, 95% CI) | Subtotals only | |
| 14.1 End of intervention | 3 | 121 | Mean Difference (IV, Random, 95% CI) | ‐0.72 [‐2.31, 0.87] |
| 14.2 Follow‐up | 1 | 61 | Mean Difference (IV, Random, 95% CI) | ‐1.40 [‐2.50, ‐0.30] |
| 15 Schwartz Cancer Fatigue Scale (follow‐up values) Show forest plot | 2 | Mean Difference (IV, Random, 95% CI) | Subtotals only | |
| 15.1 End of intervention | 2 | 125 | Mean Difference (IV, Random, 95% CI) | ‐2.01 [‐9.25, 5.23] |
| 15.2 Follow‐up | 0 | 0 | Mean Difference (IV, Random, 95% CI) | 0.0 [0.0, 0.0] |
| 16 POMS fatigue scale (follow‐up values) Show forest plot | 2 | Std. Mean Difference (IV, Fixed, 95% CI) | Subtotals only | |
| 16.1 End of intervention | 2 | 79 | Std. Mean Difference (IV, Fixed, 95% CI) | ‐0.54 [1.00, ‐0.08] |
| 16.2 Follow‐up | 1 | 61 | Std. Mean Difference (IV, Fixed, 95% CI) | ‐0.57 [‐1.08, ‐0.05] |
| 17 Visual analogue scale fatigue (follow‐up and change values) Show forest plot | 4 | Std. Mean Difference (IV, Fixed, 95% CI) | Subtotals only | |
| 17.1 End of intervention | 4 | 148 | Std. Mean Difference (IV, Fixed, 95% CI) | ‐0.51 [‐0.88, ‐0.14] |
| 17.2 Follow‐up | 1 | 22 | Std. Mean Difference (IV, Fixed, 95% CI) | 0.0 [0.0, 0.0] |
| 18 Overall vigour/vitality (follow‐up values) Show forest plot | 10 | Std. Mean Difference (IV, Random, 95% CI) | Subtotals only | |
| 18.1 End of intervention | 10 | 762 | Std. Mean Difference (IV, Random, 95% CI) | 0.36 [0.21, 0.50] |
| 18.2 Follow‐up | 4 | 454 | Std. Mean Difference (IV, Random, 95% CI) | 0.26 [0.04, 0.48] |
| 19 Overall vigour/vitality (change values) Show forest plot | 6 | Std. Mean Difference (IV, Random, 95% CI) | Subtotals only | |
| 19.1 End of intervention | 6 | 359 | Std. Mean Difference (IV, Random, 95% CI) | 0.23 [0.00, 0.45] |
| 19.2 Follow‐up | 2 | 233 | Std. Mean Difference (IV, Random, 95% CI) | 0.20 [‐0.06, 0.46] |
| 20 MOS SF vitality (follow‐up values) Show forest plot | 6 | Mean Difference (IV, Fixed, 95% CI) | Subtotals only | |
| 20.1 End of intervention | 6 | 514 | Mean Difference (IV, Fixed, 95% CI) | 3.08 [0.84, 5.31] |
| 20.2 Follow‐up | 2 | 306 | Mean Difference (IV, Fixed, 95% CI) | 5.09 [0.99, 9.19] |
| 21 MOS SF vitality (change values) Show forest plot | 4 | Mean Difference (IV, Fixed, 95% CI) | Subtotals only | |
| 21.1 End of intervention | 4 | 212 | Mean Difference (IV, Fixed, 95% CI) | 1.36 [‐0.52, 3.25] |
| 21.2 Follow‐up | 0 | 0 | Mean Difference (IV, Fixed, 95% CI) | 0.0 [0.0, 0.0] |
| 22 POMS vigour scale (follow‐up values) Show forest plot | 4 | Std. Mean Difference (IV, Random, 95% CI) | Subtotals only | |
| 22.1 End of intervention | 4 | 248 | Std. Mean Difference (IV, Random, 95% CI) | 0.46 [0.13, 0.79] |
| 22.2 Follow‐up | 2 | 148 | Std. Mean Difference (IV, Random, 95% CI) | 0.21 [‐0.34, 0.77] |
| 23 POMS vigour scale (change values) Show forest plot | 2 | Std. Mean Difference (IV, Random, 95% CI) | Subtotals only | |
| 23.1 End of intervention | 2 | 147 | Std. Mean Difference (IV, Random, 95% CI) | 0.25 [‐0.45, 0.95] |
| 23.2 Follow‐up | 2 | 233 | Std. Mean Difference (IV, Random, 95% CI) | 0.20 [‐0.06, 0.46] |
| Outcome or subgroup title | No. of studies | No. of participants | Statistical method | Effect size |
| 1 Overall pain/disability (follow‐up values) Show forest plot | 9 | Std. Mean Difference (IV, Random, 95% CI) | Subtotals only | |
| 1.1 End of intervention | 9 | 535 | Std. Mean Difference (IV, Random, 95% CI) | 0.08 [‐0.09, 0.25] |
| 1.2 Follow‐up | 1 | 162 | Std. Mean Difference (IV, Random, 95% CI) | 0.19 [‐0.12, 0.50] |
| 2 Overall pain/disability (change values) Show forest plot | 6 | Std. Mean Difference (IV, Random, 95% CI) | Subtotals only | |
| 2.1 End of intervention | 5 | 296 | Std. Mean Difference (IV, Random, 95% CI) | ‐0.08 [‐0.33, 0.16] |
| 2.2 Follow‐up | 1 | 36 | Std. Mean Difference (IV, Random, 95% CI) | 0.22 [‐0.43, 0.88] |
| 3 Brief Pain Inventory severity score (change values) Show forest plot | 2 | Mean Difference (IV, Random, 95% CI) | Subtotals only | |
| 3.1 End of intervention | 2 | 145 | Mean Difference (IV, Random, 95% CI) | ‐0.84 [‐1.92, 0.23] |
| 3.2 Follow‐up | 0 | 0 | Mean Difference (IV, Random, 95% CI) | 0.0 [0.0, 0.0] |
| 4 Brief Pain Inventory interference score (change values) Show forest plot | 2 | Mean Difference (IV, Random, 95% CI) | Subtotals only | |
| 4.1 End of intervention | 2 | 145 | Mean Difference (IV, Random, 95% CI) | ‐1.08 [‐1.91, ‐0.24] |
| 4.2 Follow‐up | 0 | 0 | Mean Difference (IV, Random, 95% CI) | 0.0 [0.0, 0.0] |
| 5 DASH (follow‐up and change values) Show forest plot | 3 | Mean Difference (IV, Fixed, 95% CI) | Subtotals only | |
| 5.1 End of intervention | 3 | 179 | Mean Difference (IV, Fixed, 95% CI) | ‐4.00 [‐9.08, ‐2.91] |
| 5.2 Follow‐up | 0 | 0 | Mean Difference (IV, Fixed, 95% CI) | 0.0 [0.0, 0.0] |
| 6 EORTC QLQ‐C30 Pain scale (follow‐up and change values) Show forest plot | 2 | Mean Difference (IV, Fixed, 95% CI) | Subtotals only | |
| 6.1 End of intervention | 2 | 119 | Mean Difference (IV, Fixed, 95% CI) | ‐1.04 [‐9.83, 7.75] |
| 6.2 Follow‐up | 0 | 0 | Mean Difference (IV, Fixed, 95% CI) | 0.0 [0.0, 0.0] |
| 7 MOS SF Pain (follow‐up values) Show forest plot | 5 | Mean Difference (IV, Random, 95% CI) | Subtotals only | |
| 7.1 End of intervention | 5 | 378 | Mean Difference (IV, Random, 95% CI) | 1.25 [‐1.40, 3.90] |
| 7.2 Follow‐up | 1 | 162 | Mean Difference (IV, Random, 95% CI) | 4.45 [‐2.80, 11.70] |
| 8 MOS SF Pain (change values) Show forest plot | 4 | Mean Difference (IV, Fixed, 95% CI) | Subtotals only | |
| 8.1 End of intervention | 4 | 213 | Mean Difference (IV, Fixed, 95% CI) | 0.07 [‐1.04, 1.17] |
| 8.2 Follow‐up | 0 | 0 | Mean Difference (IV, Fixed, 95% CI) | 0.0 [0.0, 0.0] |
| 9 WOMAC joint pain (follow‐up and change values) Show forest plot | 2 | Mean Difference (IV, Random, 95% CI) | Subtotals only | |
| 9.1 End of intervention | 2 | 121 | Mean Difference (IV, Random, 95% CI) | ‐2.36 [‐7.55, 2.82] |
| 9.2 Follow‐up | 0 | 0 | Mean Difference (IV, Random, 95% CI) | 0.0 [0.0, 0.0] |
| 10 WOMAC physical dysfunction (follow‐up and change values) Show forest plot | 2 | Mean Difference (IV, Random, 95% CI) | Subtotals only | |
| 10.1 End of intervention | 2 | 121 | Mean Difference (IV, Random, 95% CI) | ‐6.15 [‐16.21, 3.92] |
| 10.2 Follow‐up | 0 | 0 | Mean Difference (IV, Random, 95% CI) | 0.0 [0.0, 0.0] |
| 11 WOMAC total score (follow‐up and change values) Show forest plot | 2 | Mean Difference (IV, Random, 95% CI) | Subtotals only | |
| 11.1 End of intervention | 2 | 121 | Mean Difference (IV, Random, 95% CI) | ‐6.49 [‐13.57, 0.58] |
| 11.2 Follow‐up | 0 | 0 | Mean Difference (IV, Random, 95% CI) | 0.0 [0.0, 0.0] |
| Outcome or subgroup title | No. of studies | No. of participants | Statistical method | Effect size |
| 1 Overall self‐esteem/body image (follow‐up values) Show forest plot | 12 | Std. Mean Difference (IV, Random, 95% CI) | Subtotals only | |
| 1.1 End of intervention | 12 | 667 | Std. Mean Difference (IV, Random, 95% CI) | 0.27 [0.05, 0.48] |
| 1.2 Follow‐up | 1 | 61 | Std. Mean Difference (IV, Random, 95% CI) | 0.57 [0.05, 1.08] |
| 2 Overall self‐esteem/body image (change values) Show forest plot | 9 | Std. Mean Difference (IV, Random, 95% CI) | Subtotals only | |
| 2.1 End of intervention | 9 | 992 | Std. Mean Difference (IV, Random, 95% CI) | 0.23 [‐0.11, 0.58] |
| 2.2 Follow‐up | 1 | 62 | Std. Mean Difference (IV, Random, 95% CI) | 0.46 [‐0.05, 0.96] |
| 3 Body Esteem Scale ‐ weight concern (follow‐up values) Show forest plot | 2 | Mean Difference (IV, Random, 95% CI) | Subtotals only | |
| 3.1 End of intervention | 2 | 100 | Mean Difference (IV, Random, 95% CI) | 4.22 [‐1.01, 9.45] |
| 3.2 Follow‐up | 0 | 0 | Mean Difference (IV, Random, 95% CI) | 0.0 [0.0, 0.0] |
| 4 Physical self‐perception profile ‐ attractiveness of body (follow‐up values) Show forest plot | 2 | Mean Difference (IV, Fixed, 95% CI) | Subtotals only | |
| 4.1 End of intervention | 2 | 107 | Mean Difference (IV, Fixed, 95% CI) | 0.46 [0.13, 0.79] |
| 4.2 Follow‐up | 1 | 61 | Mean Difference (IV, Fixed, 95% CI) | 0.29 [0.04, 0.54] |
| 5 Physical self‐perception profile ‐ attractiveness of body (change values) Show forest plot | 2 | Mean Difference (IV, Fixed, 95% CI) | Subtotals only | |
| 5.1 End of intervention | 2 | 108 | Mean Difference (IV, Fixed, 95% CI) | 0.26 [‐0.07, 0.59] |
| 5.2 Follow‐up | 1 | 62 | Mean Difference (IV, Fixed, 95% CI) | 0.26 [‐0.02, 0.54] |
| 6 Rosenberg Self‐Esteem Scale (follow‐up values) Show forest plot | 4 | Mean Difference (IV, Random, 95% CI) | Subtotals only | |
| 6.1 End of intervention | 4 | 183 | Mean Difference (IV, Random, 95% CI) | 0.24 [‐1.79, 2.26] |
| 6.2 Follow‐up | 0 | 0 | Mean Difference (IV, Random, 95% CI) | 0.0 [0.0, 0.0] |
| 7 Rosenberg Self‐Esteem Scale (change values) Show forest plot | 4 | Mean Difference (IV, Fixed, 95% CI) | Subtotals only | |
| 7.1 End of intervention | 4 | 189 | Mean Difference (IV, Fixed, 95% CI) | 2.78 [1.98, 3.58] |
| 7.2 Follow‐up | 0 | 0 | Mean Difference (IV, Fixed, 95% CI) | 0.0 [0.0, 0.0] |
| 8 EORTC QLQ‐C30 Body image (follow‐up and change values) Show forest plot | 2 | Mean Difference (IV, Fixed, 95% CI) | Subtotals only | |
| 8.1 End of intervention | 2 | 562 | Mean Difference (IV, Fixed, 95% CI) | ‐0.85 [‐4.38, 2.68] |
| 8.2 Follow‐up | 0 | 0 | Mean Difference (IV, Fixed, 95% CI) | 0.0 [0.0, 0.0] |
| Outcome or subgroup title | No. of studies | No. of participants | Statistical method | Effect size |
| 1 Overall cardiorespiratory fitness (follow‐up values) Show forest plot | 23 | Std. Mean Difference (IV, Random, 95% CI) | Subtotals only | |
| 1.1 End of intervention | 23 | 1265 | Std. Mean Difference (IV, Random, 95% CI) | 0.44 [0.30, 0.58] |
| 1.2 Follow‐up | 3 | 362 | Std. Mean Difference (IV, Random, 95% CI) | 0.36 [0.03, 0.69] |
| 2 Overall cardiorespiratory fitness (change values) Show forest plot | 10 | Std. Mean Difference (IV, Random, 95% CI) | Subtotals only | |
| 2.1 End of intervention | 9 | 863 | Std. Mean Difference (IV, Random, 95% CI) | 0.83 [0.40, 1.27] |
| 2.2 Follow‐up | 2 | 115 | Std. Mean Difference (IV, Random, 95% CI) | 0.42 [0.05, 0.79] |
| 3 Directly assessed VO₂max/peak (follow‐up values) Show forest plot | 4 | Mean Difference (IV, Fixed, 95% CI) | Subtotals only | |
| 3.1 End of intervention | 4 | 199 | Mean Difference (IV, Fixed, 95% CI) | 1.89 [0.65, 3.13] |
| 3.2 Follow‐up | 0 | 0 | Mean Difference (IV, Fixed, 95% CI) | 0.0 [0.0, 0.0] |
| 4 Directly assessed VO₂max/peak (change values) Show forest plot | 3 | Std. Mean Difference (IV, Random, 95% CI) | Subtotals only | |
| 4.1 End of intervention | 3 | 166 | Std. Mean Difference (IV, Random, 95% CI) | 1.31 [0.66, 1.96] |
| 4.2 Follow‐up | 0 | 0 | Std. Mean Difference (IV, Random, 95% CI) | 0.0 [0.0, 0.0] |
| 5 Directly assessed VO₂max/peak ‐ treadmill (follow‐up and change values) Show forest plot | 2 | Std. Mean Difference (IV, Random, 95% CI) | Subtotals only | |
| 5.1 End of intervention | 2 | 116 | Std. Mean Difference (IV, Random, 95% CI) | 1.04 [‐0.49, 2.58] |
| 5.2 Follow‐up | 0 | 0 | Std. Mean Difference (IV, Random, 95% CI) | 0.0 [0.0, 0.0] |
| 6 Directly assessed VO₂max/peak ‐ cycle ergometer (follow‐up values) Show forest plot | 3 | Mean Difference (IV, Random, 95% CI) | Subtotals only | |
| 6.1 End of intervention | 3 | 116 | Mean Difference (IV, Random, 95% CI) | 1.99 [0.39, 3.59] |
| 6.2 Follow‐up | 0 | 0 | Mean Difference (IV, Random, 95% CI) | 0.0 [0.0, 0.0] |
| 7 Peak Power Output ‐ cycle ergometer test (follow‐up values) Show forest plot | 2 | Mean Difference (IV, Fixed, 95% CI) | Subtotals only | |
| 7.1 End of intervention | 2 | 66 | Mean Difference (IV, Fixed, 95% CI) | 18.92 [9.64, 28.20] |
| 7.2 Follow‐up | 0 | 0 | Mean Difference (IV, Fixed, 95% CI) | 0.0 [0.0, 0.0] |
| 8 Peak Respiratory Exchange Ratio ‐ cycle ergometer test (follow‐up values) Show forest plot | 2 | Mean Difference (IV, Fixed, 95% CI) | Subtotals only | |
| 8.1 End of intervention | 2 | 66 | Mean Difference (IV, Fixed, 95% CI) | ‐0.01 [‐0.04, 0.03] |
| 8.2 Follow‐up | 0 | 0 | Mean Difference (IV, Fixed, 95% CI) | 0.0 [0.0, 0.0] |
| 9 Peak Heart Rate ‐ cycle ergometer test (follow‐up values) Show forest plot | 2 | Mean Difference (IV, Fixed, 95% CI) | Subtotals only | |
| 9.1 End of intervention | 2 | 66 | Mean Difference (IV, Fixed, 95% CI) | 2.02 [‐5.65, 9.68] |
| 9.2 Follow‐up | 0 | 0 | Mean Difference (IV, Fixed, 95% CI) | 0.0 [0.0, 0.0] |
| 10 Ebbeling single‐stage treadmill test (follow‐up and change values) Show forest plot | 2 | Mean Difference (IV, Random, 95% CI) | Subtotals only | |
| 10.1 End of intervention | 2 | 189 | Mean Difference (IV, Random, 95% CI) | 1.30 [‐0.16, 2.75] |
| 10.2 Follow‐up | 2 | 149 | Mean Difference (IV, Random, 95% CI) | 1.77 [‐1.23, 4.77] |
| 11 Modified Bruce treadmill test (follow‐up and change values) Show forest plot | 3 | Mean Difference (IV, Random, 95% CI) | Subtotals only | |
| 11.1 End of intervention | 3 | 92 | Mean Difference (IV, Random, 95% CI) | 3.57 [0.95, 6.19] |
| 11.2 Follow‐up | 0 | 0 | Mean Difference (IV, Random, 95% CI) | 0.0 [0.0, 0.0] |
| 12 Naughton submaximal treadmill test (follow‐up and change values) Show forest plot | 4 | Mean Difference (IV, Random, 95% CI) | Subtotals only | |
| 12.1 End of intervention | 4 | 315 | Mean Difference (IV, Random, 95% CI) | 2.02 [‐0.33, 4.37] |
| 12.2 Follow‐up | 2 | 249 | Mean Difference (IV, Random, 95% CI) | 1.91 [0.57, 3.26] |
| 13 Cardiorespiratory fitness walk tests (follow‐up values) Show forest plot | 7 | Std. Mean Difference (IV, Random, 95% CI) | Subtotals only | |
| 13.1 End of intervention | 7 | 314 | Std. Mean Difference (IV, Random, 95% CI) | 0.62 [0.33, 0.91] |
| 13.2 Follow‐up | 0 | 0 | Std. Mean Difference (IV, Random, 95% CI) | 0.0 [0.0, 0.0] |
| 14 Cardiorespiratory fitness walk tests (change values) Show forest plot | 3 | Std. Mean Difference (IV, Random, 95% CI) | Subtotals only | |
| 14.1 End of intervention | 3 | 592 | Std. Mean Difference (IV, Random, 95% CI) | 0.72 [‐0.05, 1.49] |
| 14.2 Follow‐up | 1 | 79 | Std. Mean Difference (IV, Random, 95% CI) | 0.54 [0.09, 0.99] |
| 15 6‐Minute walk test (follow‐up and change values) Show forest plot | 5 | Mean Difference (IV, Random, 95% CI) | Subtotals only | |
| 15.1 End of intervention | 5 | 159 | Mean Difference (IV, Random, 95% CI) | 54.74 [33.25, 76.22] |
| 15.2 Follow‐up | 0 | 0 | Mean Difference (IV, Random, 95% CI) | 0.0 [0.0, 0.0] |
| 16 12‐Minute walk test (follow‐up values) Show forest plot | 2 | Mean Difference (IV, Random, 95% CI) | Subtotals only | |
| 16.1 End of intervention | 2 | 96 | Mean Difference (IV, Random, 95% CI) | 94.56 [‐24.25, 213.37] |
| 16.2 Follow‐up | 0 | 0 | Mean Difference (IV, Random, 95% CI) | 0.0 [0.0, 0.0] |
| 17 2‐Kilometer walk test (follow‐up and change values) Show forest plot | 2 | Mean Difference (IV, Random, 95% CI) | Subtotals only | |
| 17.1 End of intervention | 2 | 526 | Mean Difference (IV, Random, 95% CI) | ‐0.11 [‐0.46, 0.25] |
| 17.2 Follow‐up | 0 | 0 | Mean Difference (IV, Random, 95% CI) | 0.0 [0.0, 0.0] |
| 18 Resting Heart Rate (follow‐up values) Show forest plot | 2 | Mean Difference (IV, Fixed, 95% CI) | Subtotals only | |
| 18.1 End of intervention | 2 | 82 | Mean Difference (IV, Fixed, 95% CI) | ‐4.47 [‐7.94, ‐1.00] |
| 18.2 Follow‐up | 0 | 0 | Mean Difference (IV, Fixed, 95% CI) | 0.0 [0.0, 0.0] |
| 19 Resting Heart Rate (change values) Show forest plot | 2 | Std. Mean Difference (IV, Random, 95% CI) | Subtotals only | |
| 19.1 End of intervention | 2 | 86 | Std. Mean Difference (IV, Random, 95% CI) | ‐1.05 [‐2.22, 0.11] |
| 19.2 Follow‐up | 0 | 0 | Std. Mean Difference (IV, Random, 95% CI) | 0.0 [0.0, 0.0] |
| 20 Resting Systolic Blood Pressure (follow‐up values) Show forest plot | 4 | Mean Difference (IV, Random, 95% CI) | Subtotals only | |
| 20.1 End of intervention | 4 | 134 | Mean Difference (IV, Random, 95% CI) | ‐0.83 [‐3.72, 2.05] |
| 20.2 Follow‐up | 1 | 26 | Mean Difference (IV, Random, 95% CI) | 5.20 [‐5.35, 15.75] |
| 21 Resting Systolic Blood Pressure (change values) Show forest plot | 3 | Mean Difference (IV, Random, 95% CI) | Subtotals only | |
| 21.1 End of intervention | 3 | 143 | Mean Difference (IV, Random, 95% CI) | ‐1.12 [‐7.74, 5.50] |
| 21.2 Follow‐up | 1 | 26 | Mean Difference (IV, Random, 95% CI) | ‐2.70 [‐5.94, 0.54] |
| 22 Resting Diastolic Blood Pressure (follow‐up values) Show forest plot | 3 | Mean Difference (IV, Random, 95% CI) | Subtotals only | |
| 22.1 End of intervention | 3 | 106 | Mean Difference (IV, Random, 95% CI) | 0.66 [‐2.89, 4.21] |
| 22.2 Follow‐up | 1 | 26 | Mean Difference (IV, Random, 95% CI) | 2.10 [‐3.78, 7.98] |
| 23 Resting Diastolic Blood Pressure (change values) Show forest plot | 3 | 170 | Mean Difference (IV, Random, 95% CI) | ‐0.04 [‐1.82, 1.73] |
| 23.1 End of intervention | 3 | 144 | Mean Difference (IV, Random, 95% CI) | 0.53 [‐1.61, 2.68] |
| 23.2 Follow‐up | 1 | 26 | Mean Difference (IV, Random, 95% CI) | ‐1.30 [‐3.85, 1.25] |
| Outcome or subgroup title | No. of studies | No. of participants | Statistical method | Effect size |
| 1 Overall self‐reported physical activity (follow‐up values) Show forest plot | 17 | Std. Mean Difference (IV, Random, 95% CI) | Subtotals only | |
| 1.1 End of intervention | 17 | 2012 | Std. Mean Difference (IV, Random, 95% CI) | 0.52 [0.33, 0.71] |
| 1.2 Follow‐up | 4 | 683 | Std. Mean Difference (IV, Random, 95% CI) | 0.44 [0.17, 0.72] |
| 2 Overall self‐reported physical activity (change values) Show forest plot | 9 | Std. Mean Difference (IV, Random, 95% CI) | Subtotals only | |
| 2.1 End of intervention | 8 | 1274 | Std. Mean Difference (IV, Random, 95% CI) | 0.57 [0.25, 0.90] |
| 2.2 Follow‐up | 4 | 521 | Std. Mean Difference (IV, Random, 95% CI) | 0.51 [0.08, 0.93] |
| 3 Self‐reported total physical activity (follow‐up values) Show forest plot | 9 | Std. Mean Difference (IV, Random, 95% CI) | Subtotals only | |
| 3.1 End of intervention | 9 | 881 | Std. Mean Difference (IV, Random, 95% CI) | 0.57 [0.28, 0.86] |
| 3.2 Follow‐up | 1 | 26 | Std. Mean Difference (IV, Random, 95% CI) | 0.37 [‐0.43, 1.16] |
| 4 Self‐reported total physical activity (change values) Show forest plot | 5 | Std. Mean Difference (IV, Random, 95% CI) | Subtotals only | |
| 4.1 End of intervention | 5 | 332 | Std. Mean Difference (IV, Random, 95% CI) | 0.80 [0.30, 1.31] |
| 4.2 Follow‐up | 2 | 108 | Std. Mean Difference (IV, Random, 95% CI) | 0.73 [‐0.36, 1.83] |
| 5 Self‐reported moderate physical activity (follow‐up values) Show forest plot | 4 | Std. Mean Difference (IV, Random, 95% CI) | Subtotals only | |
| 5.1 End of intervention | 4 | 249 | Std. Mean Difference (IV, Random, 95% CI) | 0.77 [0.47, 1.07] |
| 5.2 Follow‐up | 1 | 26 | Std. Mean Difference (IV, Random, 95% CI) | 0.10 [‐0.69, 0.89] |
| 6 Self‐reported moderate physical activity (change values) Show forest plot | 2 | Std. Mean Difference (IV, Random, 95% CI) | Subtotals only | |
| 6.1 End of intervention | 2 | 93 | Std. Mean Difference (IV, Random, 95% CI) | 1.19 [0.27, 2.11] |
| 6.2 Follow‐up | 1 | 26 | Std. Mean Difference (IV, Random, 95% CI) | 1.20 [0.33, 2.06] |
| 7 Self‐reported moderate‐vigorous physical activity (follow‐up values) Show forest plot | 6 | Std. Mean Difference (IV, Random, 95% CI) | Subtotals only | |
| 7.1 End of intervention | 6 | 1025 | Std. Mean Difference (IV, Random, 95% CI) | 0.42 [0.12, 0.72] |
| 7.2 Follow‐up | 3 | 657 | Std. Mean Difference (IV, Random, 95% CI) | 0.46 [0.13, 0.78] |
| 8 Self‐reported moderate‐vigorous physical activity (change values) Show forest plot | 4 | Std. Mean Difference (IV, Random, 95% CI) | Subtotals only | |
| 8.1 End of intervention | 2 | 875 | Std. Mean Difference (IV, Random, 95% CI) | 0.15 [‐0.14, 0.44] |
| 8.2 Follow‐up | 3 | 495 | Std. Mean Difference (IV, Random, 95% CI) | 0.30 [0.00, 0.59] |
| 9 Self‐reported vigorous physical activity (follow‐up values) Show forest plot | 3 | Std. Mean Difference (IV, Random, 95% CI) | Subtotals only | |
| 9.1 End of intervention | 3 | 182 | Std. Mean Difference (IV, Random, 95% CI) | 0.74 [0.43, 1.04] |
| 9.2 Follow‐up | 1 | 26 | Std. Mean Difference (IV, Random, 95% CI) | 0.19 [‐0.61, 0.98] |
| 10 Self‐reported vigorous physical activity (change values) Show forest plot | 2 | Std. Mean Difference (IV, Random, 95% CI) | Subtotals only | |
| 10.1 End of intervention | 2 | 108 | Std. Mean Difference (IV, Random, 95% CI) | 1.72 [0.78, 2.66] |
| 10.2 Follow‐up | 2 | 108 | Std. Mean Difference (IV, Random, 95% CI) | ‐0.13 [‐0.92, 0.66] |
| 11 Self‐reported walking (follow‐up values) Show forest plot | 2 | Std. Mean Difference (IV, Random, 95% CI) | Subtotals only | |
| 11.1 End of intervention | 2 | 374 | Std. Mean Difference (IV, Random, 95% CI) | 0.40 [‐0.06, 0.86] |
| 11.2 Follow‐up | 1 | 338 | Std. Mean Difference (IV, Random, 95% CI) | 0.09 [‐0.15, 0.34] |
| 12 Self‐reported walking (change values) Show forest plot | 2 | Std. Mean Difference (IV, Random, 95% CI) | Subtotals only | |
| 12.1 End of intervention | 2 | 374 | Std. Mean Difference (IV, Random, 95% CI) | 0.50 [0.23, 0.77] |
| 12.2 Follow‐up | 1 | 338 | Std. Mean Difference (IV, Random, 95% CI) | 0.23 [‐0.02, 0.47] |
| 13 7‐Day PAR self‐reported moderate physical activity (follow‐up values) Show forest plot | 2 | Mean Difference (IV, Fixed, 95% CI) | Subtotals only | |
| 13.1 End of intervention | 2 | 149 | Mean Difference (IV, Fixed, 95% CI) | 110.44 [72.50, 148.38] |
| 13.2 Follow‐up | 0 | 0 | Mean Difference (IV, Fixed, 95% CI) | 0.0 [0.0, 0.0] |
| 14 7‐day PAR self‐reported moderate‐vigorous physical activity (follow‐up values) Show forest plot | 2 | Mean Difference (IV, Random, 95% CI) | Subtotals only | |
| 14.1 End of intervention | 2 | 128 | Mean Difference (IV, Random, 95% CI) | 52.86 [29.04, 76.67] |
| 14.2 Follow‐up | 1 | 67 | Mean Difference (IV, Random, 95% CI) | 41.2 [11.81, 70.59] |
| 15 Godin LSI self‐reported moderate‐vigorous physical activity (follow‐up values) Show forest plot | 5 | Mean Difference (IV, Random, 95% CI) | Subtotals only | |
| 15.1 End of intervention | 5 | 936 | Mean Difference (IV, Random, 95% CI) | 39.42 [‐1.51, 80.34] |
| 15.2 Follow‐up | 2 | 590 | Mean Difference (IV, Random, 95% CI) | 55.07 [17.16, 92.99] |
| 16 Meeting recommended physical activity guidelines (follow‐up values) Show forest plot | 6 | Odds Ratio (M‐H, Random, 95% CI) | Subtotals only | |
| 16.1 End of intervention | 6 | 819 | Odds Ratio (M‐H, Random, 95% CI) | 8.44 [2.41, 29.56] |
| 16.2 Follow‐up | 2 | 280 | Odds Ratio (M‐H, Random, 95% CI) | 3.11 [1.50, 6.46] |
| 17 Overall objective physical activity (follow‐up values) Show forest plot | 10 | Std. Mean Difference (IV, Random, 95% CI) | Subtotals only | |
| 17.1 End of intervention | 10 | 1248 | Std. Mean Difference (IV, Random, 95% CI) | 0.43 [0.19, 0.66] |
| 17.2 Follow‐up | 3 | 305 | Std. Mean Difference (IV, Random, 95% CI) | 0.22 [‐0.21, 0.66] |
| 18 Overall objective physical activity (change values) Show forest plot | 6 | Std. Mean Difference (IV, Random, 95% CI) | Subtotals only | |
| 18.1 End of intervention | 5 | 508 | Std. Mean Difference (IV, Random, 95% CI) | 0.71 [0.14, 1.29] |
| 18.2 Follow‐up | 2 | 61 | Std. Mean Difference (IV, Random, 95% CI) | 0.23 [1.00, 1.46] |
| 19 Objective moderate‐vigorous physical activity (follow‐up values) Show forest plot | 5 | Std. Mean Difference (IV, Random, 95% CI) | Subtotals only | |
| 19.1 End of intervention | 5 | 390 | Std. Mean Difference (IV, Random, 95% CI) | 1.49 [0.47, 2.51] |
| 19.2 Follow‐up | 2 | 280 | Std. Mean Difference (IV, Random, 95% CI) | 0.36 [‐0.08, 0.79] |
| 20 Objective moderate‐vigorous physical activity (change values) Show forest plot | 3 | Std. Mean Difference (IV, Random, 95% CI) | Subtotals only | |
| 20.1 End of intervention | 2 | 78 | Std. Mean Difference (IV, Random, 95% CI) | 0.92 [0.45, 1.40] |
| 20.2 Follow‐up | 1 | 36 | Std. Mean Difference (IV, Random, 95% CI) | 0.84 [0.15, 1.52] |
| 21 Objective vigorous physical activity (follow‐up values) Show forest plot | 2 | Std. Mean Difference (IV, Random, 95% CI) | Subtotals only | |
| 21.1 End of intervention | 2 | 63 | Std. Mean Difference (IV, Random, 95% CI) | 0.46 [‐0.05, 0.97] |
| 21.2 Follow‐up | 1 | 25 | Std. Mean Difference (IV, Random, 95% CI) | ‐0.16 [‐0.97, 0.66] |
| 22 Accelerometer counts (follow‐up values) Show forest plot | 2 | Std. Mean Difference (IV, Random, 95% CI) | Subtotals only | |
| 22.1 End of intervention | 2 | 74 | Std. Mean Difference (IV, Random, 95% CI) | 0.90 [0.08, 1.72] |
| 22.2 Follow‐up | 0 | 0 | Std. Mean Difference (IV, Random, 95% CI) | 0.0 [0.0, 0.0] |
| 23 Pedometer/accelerometer steps/d (follow‐up values) Show forest plot | 5 | Std. Mean Difference (IV, Random, 95% CI) | Subtotals only | |
| 23.1 End of intervention | 5 | 809 | Std. Mean Difference (IV, Random, 95% CI) | 0.22 [‐0.08, 0.53] |
| 23.2 Follow‐up | 0 | 0 | Std. Mean Difference (IV, Random, 95% CI) | 0.0 [0.0, 0.0] |
| 24 Pedometer/accelerometer steps/d (change values) Show forest plot | 3 | Std. Mean Difference (IV, Random, 95% CI) | Subtotals only | |
| 24.1 End of intervention | 3 | 441 | Std. Mean Difference (IV, Random, 95% CI) | 0.45 [‐0.18, 1.09] |
| 24.2 Follow‐up | 0 | 0 | Std. Mean Difference (IV, Random, 95% CI) | 0.0 [0.0, 0.0] |
| 25 Overall sedentary behaviour (follow‐up values) Show forest plot | 4 | Std. Mean Difference (IV, Random, 95% CI) | Subtotals only | |
| 25.1 End of intervention | 4 | 402 | Std. Mean Difference (IV, Random, 95% CI) | ‐1.01 [‐2.28, 0.26] |
| 25.2 Follow‐up | 1 | 25 | Std. Mean Difference (IV, Random, 95% CI) | 0.58 [‐0.26, 1.41] |
| 26 Objective sedentary behaviour (follow‐up values) Show forest plot | 3 | Std. Mean Difference (IV, Random, 95% CI) | Subtotals only | |
| 26.1 End of intervention | 3 | 103 | Std. Mean Difference (IV, Random, 95% CI) | ‐1.45 [‐3.68, 0.78] |
| 26.2 Follow‐up | 1 | 25 | Std. Mean Difference (IV, Random, 95% CI) | 0.58 [‐0.26, 1.41] |
| 27 Objective sedentary behaviour (change values) Show forest plot | 3 | Std. Mean Difference (IV, Random, 95% CI) | Subtotals only | |
| 27.1 End of intervention | 3 | 103 | Std. Mean Difference (IV, Random, 95% CI) | ‐0.01 [‐0.63, 0.60] |
| 27.2 Follow‐up | 1 | 25 | Std. Mean Difference (IV, Random, 95% CI) | 0.88 [0.02, 1.74] |
| Outcome or subgroup title | No. of studies | No. of participants | Statistical method | Effect size |
| 1 Mass (follow‐up values) Show forest plot | 16 | Mean Difference (IV, Fixed, 95% CI) | Subtotals only | |
| 1.1 End of intervention | 16 | 1210 | Mean Difference (IV, Fixed, 95% CI) | 0.00 [‐0.57, 0.58] |
| 1.2 Follow‐up | 1 | 49 | Mean Difference (IV, Fixed, 95% CI) | 5.02 [‐5.17, 15.21] |
| 2 Mass (change values) Show forest plot | 11 | Mean Difference (IV, Random, 95% CI) | Subtotals only | |
| 2.1 End of intervention | 11 | 1047 | Mean Difference (IV, Random, 95% CI) | ‐0.50 [‐0.98, ‐0.01] |
| 2.2 Follow‐up | 0 | 0 | Mean Difference (IV, Random, 95% CI) | 0.0 [0.0, 0.0] |
| 3 BMI (follow‐up values) Show forest plot | 17 | Mean Difference (IV, Fixed, 95% CI) | Subtotals only | |
| 3.1 End of intervention | 17 | 1481 | Mean Difference (IV, Fixed, 95% CI) | 0.01 [‐0.19, 0.22] |
| 3.2 Follow‐up | 0 | 0 | Mean Difference (IV, Fixed, 95% CI) | 0.0 [0.0, 0.0] |
| 4 BMI (change values) Show forest plot | 8 | Mean Difference (IV, Random, 95% CI) | Subtotals only | |
| 4.1 End of intervention | 8 | 485 | Mean Difference (IV, Random, 95% CI) | ‐0.22 [‐0.45, 0.01] |
| 4.2 Follow‐up | 0 | 0 | Mean Difference (IV, Random, 95% CI) | 0.0 [0.0, 0.0] |
| 5 Overall body fat (follow‐up values) Show forest plot | 18 | Std. Mean Difference (IV, Random, 95% CI) | Subtotals only | |
| 5.1 End of intervention | 18 | 1162 | Std. Mean Difference (IV, Random, 95% CI) | ‐0.18 [‐0.34, ‐0.03] |
| 5.2 Follow‐up | 1 | 49 | Std. Mean Difference (IV, Random, 95% CI) | 0.08 [‐0.48, 0.64] |
| 6 Overall body fat (change values) Show forest plot | 9 | Std. Mean Difference (IV, Random, 95% CI) | Subtotals only | |
| 6.1 End of intervention | 9 | 499 | Std. Mean Difference (IV, Random, 95% CI) | ‐0.62 [‐1.19, ‐0.06] |
| 6.2 Follow‐up | 0 | 0 | Std. Mean Difference (IV, Random, 95% CI) | 0.0 [0.0, 0.0] |
| 7 Percentage body fat ‐ DEXA (follow‐up values) Show forest plot | 6 | Mean Difference (IV, Random, 95% CI) | Subtotals only | |
| 7.1 End of intervention | 6 | 580 | Mean Difference (IV, Random, 95% CI) | ‐0.66 [‐1.70, 0.37] |
| 7.2 Follow‐up | 1 | 49 | Mean Difference (IV, Random, 95% CI) | 0.52 [‐3.18, 4.22] |
| 8 Percentage body fat ‐ DEXA (change values) Show forest plot | 3 | Mean Difference (IV, Random, 95% CI) | Subtotals only | |
| 8.1 End of intervention | 3 | 228 | Mean Difference (IV, Random, 95% CI) | ‐1.32 [‐1.66, ‐0.99] |
| 8.2 Follow‐up | 0 | 0 | Mean Difference (IV, Random, 95% CI) | 0.0 [0.0, 0.0] |
| 9 Percentage body fat ‐ BIA (follow‐up values) Show forest plot | 7 | Mean Difference (IV, Fixed, 95% CI) | Subtotals only | |
| 9.1 End of intervention | 7 | 331 | Mean Difference (IV, Fixed, 95% CI) | ‐1.47 [‐2.84, ‐0.10] |
| 9.2 Follow‐up | 0 | 0 | Mean Difference (IV, Fixed, 95% CI) | 0.0 [0.0, 0.0] |
| 10 Percentage body fat ‐ BIA (change values) Show forest plot | 4 | Mean Difference (IV, Fixed, 95% CI) | Subtotals only | |
| 10.1 End of intervention | 4 | 185 | Mean Difference (IV, Fixed, 95% CI) | ‐0.70 [‐1.26, ‐0.13] |
| 10.2 Follow‐up | 0 | 0 | Mean Difference (IV, Fixed, 95% CI) | 0.0 [0.0, 0.0] |
| 11 Percentage body fat ‐ SKF (follow‐up values) Show forest plot | 3 | Mean Difference (IV, Random, 95% CI) | Subtotals only | |
| 11.1 End of intervention | 3 | 165 | Mean Difference (IV, Random, 95% CI) | ‐0.73 [‐2.41, 0.96] |
| 11.2 Follow‐up | 0 | 0 | Mean Difference (IV, Random, 95% CI) | 0.0 [0.0, 0.0] |
| 12 Fat mass (follow‐up values) Show forest plot | 5 | Mean Difference (IV, Fixed, 95% CI) | Subtotals only | |
| 12.1 End of intervention | 5 | 460 | Mean Difference (IV, Fixed, 95% CI) | ‐0.70 [‐1.40, ‐0.00] |
| 12.2 Follow‐up | 0 | 0 | Mean Difference (IV, Fixed, 95% CI) | 0.0 [0.0, 0.0] |
| 13 Fat mass (change values) Show forest plot | 4 | Mean Difference (IV, Random, 95% CI) | Subtotals only | |
| 13.1 End of intervention | 4 | 768 | Mean Difference (IV, Random, 95% CI) | ‐0.46 [‐1.08, 0.15] |
| 13.2 Follow‐up | 0 | 0 | Mean Difference (IV, Random, 95% CI) | 0.0 [0.0, 0.0] |
| 14 Fat mass ‐ DEXA (follow‐up values) Show forest plot | 3 | Mean Difference (IV, Fixed, 95% CI) | Subtotals only | |
| 14.1 End of intervention | 3 | 408 | Mean Difference (IV, Fixed, 95% CI) | ‐0.68 [‐1.39, 0.03] |
| 14.2 Follow‐up | 0 | 0 | Mean Difference (IV, Fixed, 95% CI) | 0.0 [0.0, 0.0] |
| 15 Fat mass ‐ DEXA (change values) Show forest plot | 2 | Mean Difference (IV, Random, 95% CI) | Subtotals only | |
| 15.1 End of intervention | 2 | 207 | Mean Difference (IV, Random, 95% CI) | ‐0.74 [‐0.93, ‐0.56] |
| 15.2 Follow‐up | 0 | 0 | Mean Difference (IV, Random, 95% CI) | 0.0 [0.0, 0.0] |
| 16 Lean mass (follow‐up values) Show forest plot | 8 | Std. Mean Difference (IV, Fixed, 95% CI) | Subtotals only | |
| 16.1 End of intervention | 8 | 612 | Std. Mean Difference (IV, Fixed, 95% CI) | 0.05 [‐0.11, 0.21] |
| 16.2 Follow‐up | 1 | 49 | Std. Mean Difference (IV, Fixed, 95% CI) | 0.33 [‐0.24, 0.89] |
| 17 Lean mass (change values) Show forest plot | 5 | Std. Mean Difference (IV, Random, 95% CI) | Subtotals only | |
| 17.1 End of intervention | 5 | 760 | Std. Mean Difference (IV, Random, 95% CI) | 0.80 [‐0.13, 1.72] |
| 17.2 Follow‐up | 0 | 0 | Std. Mean Difference (IV, Random, 95% CI) | 0.0 [0.0, 0.0] |
| 18 Lean mass ‐ DEXA (follow‐up values) Show forest plot | 5 | Mean Difference (IV, Fixed, 95% CI) | Subtotals only | |
| 18.1 End of intervention | 5 | 541 | Mean Difference (IV, Fixed, 95% CI) | 0.43 [‐0.54, 1.40] |
| 18.2 Follow‐up | 1 | 49 | Mean Difference (IV, Fixed, 95% CI) | 2.41 [‐1.62, 6.44] |
| 19 Lean mass ‐ DEXA (change values) Show forest plot | 2 | Mean Difference (IV, Random, 95% CI) | Subtotals only | |
| 19.1 End of intervention | 2 | 207 | Mean Difference (IV, Random, 95% CI) | 0.73 [0.17, 1.29] |
| 19.2 Follow‐up | 0 | 0 | Mean Difference (IV, Random, 95% CI) | 0.0 [0.0, 0.0] |
| 20 Waist‐to‐hip ratio (follow‐up values) Show forest plot | 5 | Mean Difference (IV, Random, 95% CI) | Subtotals only | |
| 20.1 End of intervention | 5 | 213 | Mean Difference (IV, Random, 95% CI) | ‐0.03 [‐0.06, 0.01] |
| 20.2 Follow‐up | 0 | 0 | Mean Difference (IV, Random, 95% CI) | 0.0 [0.0, 0.0] |
| 21 Waist‐to‐hip ratio (change values) Show forest plot | 3 | Mean Difference (IV, Fixed, 95% CI) | Subtotals only | |
| 21.1 End of intervention | 2 | 124 | Mean Difference (IV, Fixed, 95% CI) | 0.0 [‐0.01, 0.01] |
| 21.2 Follow‐up | 1 | 36 | Mean Difference (IV, Fixed, 95% CI) | 0.04 [‐0.14, 0.22] |
| 22 Waist circumference (follow‐up values) Show forest plot | 6 | Mean Difference (IV, Fixed, 95% CI) | Subtotals only | |
| 22.1 End of intervention | 6 | 330 | Mean Difference (IV, Fixed, 95% CI) | ‐0.50 [‐3.18, 2.18] |
| 22.2 Follow‐up | 1 | 26 | Mean Difference (IV, Fixed, 95% CI) | 1.40 [‐8.29, 11.09] |
| 23 Waist circumference (change values) Show forest plot | 5 | Mean Difference (IV, Random, 95% CI) | Subtotals only | |
| 23.1 End of intervention | 5 | 285 | Mean Difference (IV, Random, 95% CI) | ‐1.71 [‐2.56, ‐0.86] |
| 23.2 Follow‐up | 1 | 26 | Mean Difference (IV, Random, 95% CI) | ‐0.90 [‐2.61, 0.81] |
| 24 Hip circumference (follow‐up values) Show forest plot | 4 | Mean Difference (IV, Fixed, 95% CI) | Subtotals only | |
| 24.1 End of intervention | 4 | 249 | Mean Difference (IV, Fixed, 95% CI) | ‐0.97 [‐3.96, 2.01] |
| 24.2 Follow‐up | 0 | 0 | Mean Difference (IV, Fixed, 95% CI) | 0.0 [0.0, 0.0] |
| 25 Hip circumference (change values) Show forest plot | 2 | Mean Difference (IV, Random, 95% CI) | Subtotals only | |
| 25.1 End of intervention | 2 | 115 | Mean Difference (IV, Random, 95% CI) | ‐2.37 [‐3.31, ‐1.44] |
| 25.2 Follow‐up | 0 | 0 | Mean Difference (IV, Random, 95% CI) | 0.0 [0.0, 0.0] |
| Outcome or subgroup title | No. of studies | No. of participants | Statistical method | Effect size |
| 1 Lower body strength (follow‐up values) Show forest plot | 10 | Std. Mean Difference (IV, Random, 95% CI) | Subtotals only | |
| 1.1 End of intervention | 10 | 637 | Std. Mean Difference (IV, Random, 95% CI) | 0.44 [0.09, 0.78] |
| 1.2 Follow‐up | 0 | 0 | Std. Mean Difference (IV, Random, 95% CI) | 0.0 [0.0, 0.0] |
| 2 Lower body strength (change values) Show forest plot | 9 | Std. Mean Difference (IV, Random, 95% CI) | Subtotals only | |
| 2.1 End of intervention | 8 | 720 | Std. Mean Difference (IV, Random, 95% CI) | 0.72 [0.38, 1.07] |
| 2.2 Follow‐up | 1 | 36 | Std. Mean Difference (IV, Random, 95% CI) | 0.78 [0.10, 1.46] |
| 3 Leg press (follow‐up values) Show forest plot | 5 | Std. Mean Difference (IV, Random, 95% CI) | Subtotals only | |
| 3.1 End of intervention | 5 | 422 | Std. Mean Difference (IV, Random, 95% CI) | 0.79 [0.35, 1.22] |
| 3.2 Follow‐up | 0 | 0 | Std. Mean Difference (IV, Random, 95% CI) | 0.0 [0.0, 0.0] |
| 4 Leg press (change values) Show forest plot | 5 | Std. Mean Difference (IV, Random, 95% CI) | Subtotals only | |
| 4.1 End of intervention | 5 | 393 | Std. Mean Difference (IV, Random, 95% CI) | 0.94 [0.68, 1.20] |
| 4.2 Follow‐up | 0 | 0 | Std. Mean Difference (IV, Random, 95% CI) | 0.0 [0.0, 0.0] |
| 5 Back & leg strength (follow‐up values) Show forest plot | 2 | Mean Difference (IV, Fixed, 95% CI) | Subtotals only | |
| 5.1 End of intervention | 2 | 58 | Mean Difference (IV, Fixed, 95% CI) | 7.90 [‐2.31, 18.11] |
| 5.2 Follow‐up | 0 | 0 | Mean Difference (IV, Fixed, 95% CI) | 0.0 [0.0, 0.0] |
| 6 Leg extension (follow‐up values) Show forest plot | 4 | Std. Mean Difference (IV, Random, 95% CI) | Subtotals only | |
| 6.1 End of intervention | 4 | 177 | Std. Mean Difference (IV, Random, 95% CI) | ‐0.01 [‐0.34, 0.32] |
| 6.2 Follow‐up | 0 | 0 | Std. Mean Difference (IV, Random, 95% CI) | 0.0 [0.0, 0.0] |
| 7 Leg extension (change values) Show forest plot | 4 | Std. Mean Difference (IV, Random, 95% CI) | Subtotals only | |
| 7.1 End of intervention | 4 | 389 | Std. Mean Difference (IV, Random, 95% CI) | 0.57 [0.03, 1.12] |
| 7.2 Follow‐up | 0 | 0 | Std. Mean Difference (IV, Random, 95% CI) | 0.0 [0.0, 0.0] |
| 8 Hip extension (follow‐up values) Show forest plot | 2 | Std. Mean Difference (IV, Random, 95% CI) | Subtotals only | |
| 8.1 End of intervention | 2 | 285 | Std. Mean Difference (IV, Random, 95% CI) | 0.14 [‐0.45, 0.72] |
| 8.2 Follow‐up | 0 | 0 | Std. Mean Difference (IV, Random, 95% CI) | 0.0 [0.0, 0.0] |
| 9 Hip flexion (follow‐up values) Show forest plot | 2 | Std. Mean Difference (IV, Random, 95% CI) | Subtotals only | |
| 9.1 End of intervention | 2 | 285 | Std. Mean Difference (IV, Random, 95% CI) | 0.04 [‐0.76, 0.83] |
| 9.2 Follow‐up | 0 | 0 | Std. Mean Difference (IV, Random, 95% CI) | 0.0 [0.0, 0.0] |
| 10 Leg flexion (follow‐up values) Show forest plot | 2 | Std. Mean Difference (IV, Random, 95% CI) | Subtotals only | |
| 10.1 End of intervention | 2 | 243 | Std. Mean Difference (IV, Random, 95% CI) | 0.86 [‐0.05, 1.76] |
| 10.2 Follow‐up | 0 | 0 | Std. Mean Difference (IV, Random, 95% CI) | 0.0 [0.0, 0.0] |
| 11 Upper body strength (follow‐up values) Show forest plot | 13 | Std. Mean Difference (IV, Random, 95% CI) | Subtotals only | |
| 11.1 End of intervention | 13 | 768 | Std. Mean Difference (IV, Random, 95% CI) | 0.42 [0.08, 0.76] |
| 11.2 Follow‐up | 0 | 0 | Std. Mean Difference (IV, Random, 95% CI) | 0.0 [0.0, 0.0] |
| 12 Upper body strength (change values) Show forest plot | 9 | Std. Mean Difference (IV, Random, 95% CI) | Subtotals only | |
| 12.1 End of intervention | 8 | 832 | Std. Mean Difference (IV, Random, 95% CI) | 0.72 [0.30, 1.14] |
| 12.2 Follow‐up | 1 | 36 | Std. Mean Difference (IV, Random, 95% CI) | 0.76 [0.08, 1.44] |
| 13 Chest press (follow‐up values) Show forest plot | 5 | Std. Mean Difference (IV, Random, 95% CI) | Subtotals only | |
| 13.1 End of intervention | 5 | 444 | Std. Mean Difference (IV, Random, 95% CI) | 0.51 [‐0.15, 1.17] |
| 13.2 Follow‐up | 0 | 0 | Std. Mean Difference (IV, Random, 95% CI) | 0.0 [0.0, 0.0] |
| 14 Chest press (change values) Show forest plot | 4 | Std. Mean Difference (IV, Random, 95% CI) | Subtotals only | |
| 14.1 End of intervention | 4 | 381 | Std. Mean Difference (IV, Random, 95% CI) | 1.13 [0.46, 1.80] |
| 14.2 Follow‐up | 0 | 0 | Std. Mean Difference (IV, Random, 95% CI) | 0.0 [0.0, 0.0] |
| 15 Grip strength (follow‐up) Show forest plot | 7 | Mean Difference (IV, Random, 95% CI) | Subtotals only | |
| 15.1 End of intervention | 7 | 320 | Mean Difference (IV, Random, 95% CI) | 2.37 [0.20, 4.55] |
| 15.2 Follow‐up | 0 | 0 | Mean Difference (IV, Random, 95% CI) | 0.0 [0.0, 0.0] |
| 16 Grip strength (change values) Show forest plot | 3 | Std. Mean Difference (IV, Random, 95% CI) | Subtotals only | |
| 16.1 End of intervention | 2 | 145 | Std. Mean Difference (IV, Random, 95% CI) | 0.24 [‐0.09, 0.58] |
| 16.2 Follow‐up | 1 | 36 | Std. Mean Difference (IV, Random, 95% CI) | 0.76 [0.08, 1.44] |
| 17 Grip strength right hand (follow‐up) Show forest plot | 5 | Mean Difference (IV, Random, 95% CI) | Subtotals only | |
| 17.1 End of intervention | 5 | 232 | Mean Difference (IV, Random, 95% CI) | 2.30 [‐0.56, 5.16] |
| 17.2 Follow‐up | 0 | 0 | Mean Difference (IV, Random, 95% CI) | 0.0 [0.0, 0.0] |
| 18 Grip strength left hand (follow‐up) Show forest plot | 4 | Mean Difference (IV, Random, 95% CI) | Subtotals only | |
| 18.1 End of intervention | 4 | 198 | Mean Difference (IV, Random, 95% CI) | 2.12 [‐1.05, 5.30] |
| 18.2 Follow‐up | 0 | 0 | Mean Difference (IV, Random, 95% CI) | 0.0 [0.0, 0.0] |
| 19 Elbow flexion (follow‐up values) Show forest plot | 3 | Std. Mean Difference (IV, Fixed, 95% CI) | Subtotals only | |
| 19.1 End of intervention | 3 | 148 | Std. Mean Difference (IV, Fixed, 95% CI) | ‐0.08 [‐0.41, 0.24] |
| 19.2 Follow‐up | 0 | 0 | Std. Mean Difference (IV, Fixed, 95% CI) | 0.0 [0.0, 0.0] |
| Outcome or subgroup title | No. of studies | No. of participants | Statistical method | Effect size |
| 1 Bone mineral content (follow‐up and change values) Show forest plot | 2 | Std. Mean Difference (IV, Random, 95% CI) | Subtotals only | |
| 1.1 End of intervention | 2 | 525 | Std. Mean Difference (IV, Random, 95% CI) | 0.04 [‐0.20, 0.27] |
| 1.2 Follow‐up | 0 | 0 | Std. Mean Difference (IV, Random, 95% CI) | 0.0 [0.0, 0.0] |
| 2 Bone mineral density ‐ femoral neck (follow‐up and change values) Show forest plot | 4 | Std. Mean Difference (IV, Random, 95% CI) | Subtotals only | |
| 2.1 End of intervention | 4 | 786 | Std. Mean Difference (IV, Random, 95% CI) | 0.21 [‐0.13, 0.55] |
| 2.2 Follow‐up | 0 | 0 | Std. Mean Difference (IV, Random, 95% CI) | 0.0 [0.0, 0.0] |
| 3 Bone mineral density ‐ lumbar spine (follow‐up and change values) Show forest plot | 4 | Std. Mean Difference (IV, Random, 95% CI) | Subtotals only | |
| 3.1 End of intervention | 4 | 786 | Std. Mean Difference (IV, Random, 95% CI) | 0.22 [‐0.09, 0.53] |
| 3.2 Follow‐up | 0 | 0 | Std. Mean Difference (IV, Random, 95% CI) | 0.0 [0.0, 0.0] |
| 4 Bone mineral density ‐ total hip (follow‐up and change values) Show forest plot | 3 | Std. Mean Difference (IV, Random, 95% CI) | Subtotals only | |
| 4.1 End of intervention | 3 | 329 | Std. Mean Difference (IV, Random, 95% CI) | 0.58 [‐0.02, 1.18] |
| 4.2 Follow‐up | 0 | 0 | Std. Mean Difference (IV, Random, 95% CI) | 0.0 [0.0, 0.0] |
| 5 Bone formation ‐ alkaline phosphatase (follow‐up and change values) Show forest plot | 2 | Std. Mean Difference (IV, Random, 95% CI) | Subtotals only | |
| 5.1 End of intervention | 2 | 239 | Std. Mean Difference (IV, Random, 95% CI) | ‐0.25 [‐1.81, 1.31] |
| 5.2 Follow‐up | 0 | 0 | Std. Mean Difference (IV, Random, 95% CI) | 0.0 [0.0, 0.0] |
| 6 Bone resorption ‐ serum NTx (follow‐up and change values) Show forest plot | 3 | Std. Mean Difference (IV, Random, 95% CI) | Subtotals only | |
| 6.1 End of intervention | 3 | 278 | Std. Mean Difference (IV, Random, 95% CI) | 0.38 [‐1.58, 2.34] |
| 6.2 Follow‐up | 0 | 0 | Std. Mean Difference (IV, Random, 95% CI) | 0.0 [0.0, 0.0] |
| Outcome or subgroup title | No. of studies | No. of participants | Statistical method | Effect size |
| 1 Overall HRQoL (follow‐up values) Show forest plot | 9 | Std. Mean Difference (IV, Random, 95% CI) | Subtotals only | |
| 1.1 Postmenopausal only | 3 | 186 | Std. Mean Difference (IV, Random, 95% CI) | 0.24 [‐0.05, 0.54] |
| 1.2 Not postmenopausal only | 6 | 818 | Std. Mean Difference (IV, Random, 95% CI) | 0.55 [0.11, 0.98] |
| 2 Overall HRQoL (change values) Show forest plot | 7 | Std. Mean Difference (IV, Random, 95% CI) | Subtotals only | |
| 2.1 Postmenopausal only | 3 | 186 | Std. Mean Difference (IV, Random, 95% CI) | 0.49 [0.19, 0.79] |
| 2.2 Not postmenopausal only | 4 | 952 | Std. Mean Difference (IV, Random, 95% CI) | 0.13 [‐0.11, 0.38] |
| 3 Overall emotional function/mental health (follow‐up values) Show forest plot | 11 | Std. Mean Difference (IV, Random, 95% CI) | Subtotals only | |
| 3.1 Postmenopausal only | 2 | 126 | Std. Mean Difference (IV, Random, 95% CI) | 0.21 [‐0.14, 0.56] |
| 3.2 Not postmenopausal only | 9 | 990 | Std. Mean Difference (IV, Random, 95% CI) | 0.25 [0.06, 0.44] |
| 4 Overall emotional function/mental health (change values) Show forest plot | 7 | Std. Mean Difference (IV, Random, 95% CI) | Subtotals only | |
| 4.1 Postmenopausal only | 2 | 126 | Std. Mean Difference (IV, Random, 95% CI) | 0.37 [0.01, 0.72] |
| 4.2 Not postmenopausal only | 5 | 1013 | Std. Mean Difference (IV, Random, 95% CI) | 0.08 [‐0.17, 0.33] |
| 5 Overall physical function (follow‐up values) Show forest plot | 11 | Std. Mean Difference (IV, Random, 95% CI) | Subtotals only | |
| 5.1 Postmenopausal only | 3 | 187 | Std. Mean Difference (IV, Random, 95% CI) | 0.09 [‐0.20, 0.38] |
| 5.2 Not postmenopausal only | 8 | 929 | Std. Mean Difference (IV, Random, 95% CI) | 0.50 [0.10, 0.90] |
| 6 Overall physical function (change values) Show forest plot | 6 | Std. Mean Difference (IV, Random, 95% CI) | Subtotals only | |
| 6.1 Postmenopausal only | 2 | 126 | Std. Mean Difference (IV, Random, 95% CI) | 0.52 [‐0.36, 1.39] |
| 6.2 Not postmenopausal only | 4 | 949 | Std. Mean Difference (IV, Random, 95% CI) | 0.03 [‐0.20, 0.25] |
| 7 Overall role function (follow‐up values) Show forest plot | 8 | Std. Mean Difference (IV, Random, 95% CI) | Subtotals only | |
| 7.1 Postmenopausal only | 2 | 126 | Std. Mean Difference (IV, Random, 95% CI) | 0.27 [‐0.08, 0.62] |
| 7.2 Not postmenopausal only | 6 | 818 | Std. Mean Difference (IV, Random, 95% CI) | 0.42 [‐0.07, 0.90] |
| 8 Overall role function (change values) Show forest plot | 6 | Std. Mean Difference (IV, Random, 95% CI) | Subtotals only | |
| 8.1 Postmenopausal only | 2 | 126 | Std. Mean Difference (IV, Random, 95% CI) | 0.11 [‐0.24, 0.46] |
| 8.2 Not postmenopausal only | 4 | 952 | Std. Mean Difference (IV, Random, 95% CI) | ‐0.00 [‐0.14, 0.13] |
| 9 Overall social well‐being/function (follow‐up values) Show forest plot | 8 | Std. Mean Difference (IV, Random, 95% CI) | Subtotals only | |
| 9.1 Postmenopausal only | 3 | 168 | Std. Mean Difference (IV, Random, 95% CI) | 0.43 [‐0.06, 0.91] |
| 9.2 Not postmenopausal only | 5 | 867 | Std. Mean Difference (IV, Random, 95% CI) | 0.09 [‐0.05, 0.24] |
| 10 Overall social well‐being/function (change values) Show forest plot | 6 | Std. Mean Difference (IV, Random, 95% CI) | Subtotals only | |
| 10.1 Postmenopausal only | 3 | 168 | Std. Mean Difference (IV, Random, 95% CI) | 0.50 [0.19, 0.80] |
| 10.2 Not postmenopausal only | 3 | 873 | Std. Mean Difference (IV, Random, 95% CI) | 0.50 [‐0.39, 1.40] |
| 11 Overall cognitive function (follow‐up values) Show forest plot | 3 | Std. Mean Difference (IV, Random, 95% CI) | Subtotals only | |
| 11.1 Postmenopausal only | 0 | 0 | Std. Mean Difference (IV, Random, 95% CI) | 0.0 [0.0, 0.0] |
| 11.2 Not postmenopausal only | 3 | 116 | Std. Mean Difference (IV, Random, 95% CI) | 0.58 [0.20, 0.95] |
| 12 Overall cognitive function (change values) Show forest plot | 3 | Std. Mean Difference (IV, Random, 95% CI) | Subtotals only | |
| 12.1 Postmenopausal only | 0 | 0 | Std. Mean Difference (IV, Random, 95% CI) | 0.0 [0.0, 0.0] |
| 12.2 Not postmenopausal only | 3 | 599 | Std. Mean Difference (IV, Random, 95% CI) | 0.12 [‐0.31, 0.55] |
| 13 Overall general health (follow‐up values) Show forest plot | 4 | Std. Mean Difference (IV, Random, 95% CI) | Subtotals only | |
| 13.1 Postmenopausal only | 2 | 134 | Std. Mean Difference (IV, Random, 95% CI) | ‐0.03 [‐0.41, 0.35] |
| 13.2 Not postmenopausal only | 2 | 117 | Std. Mean Difference (IV, Random, 95% CI) | ‐0.09 [‐0.57, 0.39] |
| 14 Overall general health (change values) Show forest plot | 5 | Std. Mean Difference (IV, Random, 95% CI) | Subtotals only | |
| 14.1 Postmenopausal only | 2 | 134 | Std. Mean Difference (IV, Random, 95% CI) | 0.27 [‐0.18, 0.71] |
| 14.2 Not postmenopausal only | 3 | 617 | Std. Mean Difference (IV, Random, 95% CI) | ‐0.01 [‐0.22, 0.21] |
| 15 Overall sexual function (follow‐up values) Show forest plot | 2 | Std. Mean Difference (IV, Fixed, 95% CI) | Subtotals only | |
| 15.1 Postmenopausal only | 0 | 0 | Std. Mean Difference (IV, Fixed, 95% CI) | 0.0 [0.0, 0.0] |
| 15.2 Not postmenopausal only | 2 | 161 | Std. Mean Difference (IV, Fixed, 95% CI) | 0.31 [‐0.00, 0.62] |
| 16 Overall sexual function (change values) Show forest plot | 2 | Std. Mean Difference (IV, Random, 95% CI) | Subtotals only | |
| 16.1 Postmenopausal only | 0 | 0 | Std. Mean Difference (IV, Random, 95% CI) | 0.0 [0.0, 0.0] |
| 16.2 Not postmenopausal only | 2 | 579 | Std. Mean Difference (IV, Random, 95% CI) | 0.08 [‐0.14, 0.30] |
| 17 Overall sleep (follow‐up values) Show forest plot | 4 | Std. Mean Difference (IV, Fixed, 95% CI) | Subtotals only | |
| 17.1 Postmenopausal only | 1 | 42 | Std. Mean Difference (IV, Fixed, 95% CI) | ‐0.11 [‐0.72, 0.49] |
| 17.2 Not postmenopausal only | 3 | 89 | Std. Mean Difference (IV, Fixed, 95% CI) | 0.18 [‐0.24, 0.60] |
| 18 Overall sleep (change values) Show forest plot | 2 | Std. Mean Difference (IV, Random, 95% CI) | Subtotals only | |
| 18.1 Postmenopausal only | 1 | 42 | Std. Mean Difference (IV, Random, 95% CI) | 0.23 [‐0.38, 0.84] |
| 18.2 Not postmenopausal only | 1 | 38 | Std. Mean Difference (IV, Random, 95% CI) | 0.05 [‐0.59, 0.68] |
| 19 Overall anxiety (follow‐up values) Show forest plot | 4 | Std. Mean Difference (IV, Random, 95% CI) | Subtotals only | |
| 19.1 Postmenopausal only | 2 | 116 | Std. Mean Difference (IV, Random, 95% CI) | ‐0.09 [‐0.46, 0.27] |
| 19.2 Not postmenopausal only | 2 | 79 | Std. Mean Difference (IV, Random, 95% CI) | ‐0.66 [‐1.12, ‐0.20] |
| 20 Overall anxiety (change values) Show forest plot | 3 | Std. Mean Difference (IV, Fixed, 95% CI) | Subtotals only | |
| 20.1 Postmenopausal only | 2 | 116 | Std. Mean Difference (IV, Fixed, 95% CI) | ‐0.23 [‐0.60, 0.13] |
| 20.2 Not postmenopausal only | 1 | 61 | Std. Mean Difference (IV, Fixed, 95% CI) | ‐0.61 [‐1.12, ‐0.09] |
| 21 Overall self‐esteem/body image (follow‐up values) Show forest plot | 4 | Std. Mean Difference (IV, Random, 95% CI) | Subtotals only | |
| 21.1 Postmenopausal only | 2 | 126 | Std. Mean Difference (IV, Random, 95% CI) | 0.10 [‐0.25, 0.45] |
| 21.2 Not postmenopausal only | 2 | 76 | Std. Mean Difference (IV, Random, 95% CI) | 0.60 [‐0.15, 1.35] |
| 22 Overall self‐esteem/body image (change values) Show forest plot | 4 | Std. Mean Difference (IV, Random, 95% CI) | Subtotals only | |
| 22.1 Postmenopausal only | 2 | 126 | Std. Mean Difference (IV, Random, 95% CI) | 0.38 [‐0.30, 1.05] |
| 22.2 Not postmenopausal only | 2 | 558 | Std. Mean Difference (IV, Random, 95% CI) | 0.08 [‐0.31, 0.47] |
| 23 Overall depression (follow‐up values) Show forest plot | 8 | Std. Mean Difference (IV, Random, 95% CI) | Subtotals only | |
| 23.1 Postmenopausal only | 4 | 196 | Std. Mean Difference (IV, Random, 95% CI) | 0.18 [‐0.13, 0.48] |
| 23.2 Not postmenopausal only | 4 | 296 | Std. Mean Difference (IV, Random, 95% CI) | ‐0.42 [‐0.77, ‐0.06] |
| 24 Overall depression (change values) Show forest plot | 5 | Std. Mean Difference (IV, Random, 95% CI) | Subtotals only | |
| 24.1 Postmenopausal only | 3 | 176 | Std. Mean Difference (IV, Random, 95% CI) | ‐0.27 [‐0.57, 0.04] |
| 24.2 Not postmenopausal only | 2 | 561 | Std. Mean Difference (IV, Random, 95% CI) | ‐0.21 [‐0.82, 0.40] |
| 25 Overall fatigue (follow‐up values) Show forest plot | 15 | Std. Mean Difference (IV, Random, 95% CI) | Subtotals only | |
| 25.1 Postmenopausal only | 6 | 313 | Std. Mean Difference (IV, Random, 95% CI) | 0.04 [‐0.19, 0.26] |
| 25.2 Not postmenopausal only | 9 | 834 | Std. Mean Difference (IV, Random, 95% CI) | ‐0.53 [‐0.87, ‐0.18] |
| 26 Overall fatigue (change values) Show forest plot | 7 | Std. Mean Difference (IV, Random, 95% CI) | Subtotals only | |
| 26.1 Postmenopausal only | 2 | 70 | Std. Mean Difference (IV, Random, 95% CI) | 0.05 [‐1.55, 1.64] |
| 26.2 Not postmenopausal only | 5 | 954 | Std. Mean Difference (IV, Random, 95% CI) | ‐0.24 [‐0.69, 0.20] |
| 27 Overall pain/disability (follow‐up values) Show forest plot | 2 | Std. Mean Difference (IV, Random, 95% CI) | Subtotals only | |
| 27.1 Postmenopausal only | 1 | 74 | Std. Mean Difference (IV, Random, 95% CI) | ‐0.05 [‐0.51, 0.40] |
| 27.2 Not postmenopausal only | 1 | 38 | Std. Mean Difference (IV, Random, 95% CI) | ‐0.26 [‐0.89, 0.38] |
| 28 Overall pain/disability (change values) Show forest plot | 3 | Std. Mean Difference (IV, Random, 95% CI) | Subtotals only | |
| 28.1 Postmenopausal only | 2 | 157 | Std. Mean Difference (IV, Random, 95% CI) | ‐0.29 [‐0.61, 0.02] |
| 28.2 Not postmenopausal only | 1 | 36 | Std. Mean Difference (IV, Random, 95% CI) | 0.22 [‐0.43, 0.88] |
| 29 Overall cardiorespiratory fitness (follow‐up values) Show forest plot | 9 | Std. Mean Difference (IV, Random, 95% CI) | Subtotals only | |
| 29.1 Postmenopausal only | 4 | 214 | Std. Mean Difference (IV, Random, 95% CI) | 0.61 [0.30, 0.92] |
| 29.2 Not postmenopausal only | 5 | 418 | Std. Mean Difference (IV, Random, 95% CI) | 0.19 [‐0.01, 0.38] |
| 30 Overall cardiorespiratory fitness (change values) Show forest plot | 5 | Std. Mean Difference (IV, Random, 95% CI) | Subtotals only | |
| 30.1 Postmenopausal only | 4 | 208 | Std. Mean Difference (IV, Random, 95% CI) | 1.07 [0.48, 1.67] |
| 30.2 Not postmenopausal only | 1 | 498 | Std. Mean Difference (IV, Random, 95% CI) | 0.16 [‐0.02, 0.33] |
| 31 Overall self‐reported physical activity (follow‐up values) Show forest plot | 10 | Std. Mean Difference (IV, Random, 95% CI) | Subtotals only | |
| 31.1 Postmenopausal only | 5 | 292 | Std. Mean Difference (IV, Random, 95% CI) | 0.63 [0.17, 1.10] |
| 31.2 Not postmenopausal only | 5 | 810 | Std. Mean Difference (IV, Random, 95% CI) | 0.45 [0.16, 0.75] |
| 32 Overall self‐reported physical activity (change values) Show forest plot | 6 | Std. Mean Difference (IV, Random, 95% CI) | Subtotals only | |
| 32.1 Postmenopausal only | 3 | 186 | Std. Mean Difference (IV, Random, 95% CI) | 0.83 [0.53, 1.13] |
| 32.2 Not postmenopausal only | 3 | 901 | Std. Mean Difference (IV, Random, 95% CI) | 0.57 [‐0.02, 1.16] |
| 33 Overall objective physical activity (follow‐up values) Show forest plot | 8 | Std. Mean Difference (IV, Random, 95% CI) | Subtotals only | |
| 33.1 Postmenopausal only | 3 | 145 | Std. Mean Difference (IV, Random, 95% CI) | 0.87 [0.27, 1.46] |
| 33.2 Not postmenopausal only | 5 | 645 | Std. Mean Difference (IV, Random, 95% CI) | 0.19 [‐0.03, 0.42] |
| 34 Overall objective physical activity (change values) Show forest plot | 5 | Std. Mean Difference (IV, Random, 95% CI) | Subtotals only | |
| 34.1 Postmenopausal only | 3 | 145 | Std. Mean Difference (IV, Random, 95% CI) | 0.89 [0.54, 1.24] |
| 34.2 Not postmenopausal only | 2 | 363 | Std. Mean Difference (IV, Random, 95% CI) | 0.45 [‐0.67, 1.58] |
| 35 Mass (follow‐up values) Show forest plot | 8 | Mean Difference (IV, Fixed, 95% CI) | Subtotals only | |
| 35.1 Postmenopausal only | 4 | 222 | Mean Difference (IV, Fixed, 95% CI) | 0.69 [‐3.74, 5.13] |
| 35.2 Not postmenopausal only | 4 | 411 | Mean Difference (IV, Fixed, 95% CI) | 0.08 [‐0.52, 0.68] |
| 36 Mass (change values) Show forest plot | 7 | Mean Difference (IV, Random, 95% CI) | Subtotals only | |
| 36.1 Postmenopausal only | 4 | 202 | Mean Difference (IV, Random, 95% CI) | ‐0.99 [‐1.96, ‐0.02] |
| 36.2 Not postmenopausal only | 3 | 613 | Mean Difference (IV, Random, 95% CI) | 0.11 [‐0.07, 0.29] |
| 37 BMI (follow‐up values) Show forest plot | 9 | Mean Difference (IV, Fixed, 95% CI) | Subtotals only | |
| 37.1 Postmenopausal only | 3 | 161 | Mean Difference (IV, Fixed, 95% CI) | ‐0.60 [‐2.62, 1.42] |
| 37.2 Not postmenopausal only | 6 | 745 | Mean Difference (IV, Fixed, 95% CI) | 0.08 [‐0.13, 0.29] |
| 38 BMI (change values) Show forest plot | 4 | Mean Difference (IV, Random, 95% CI) | Subtotals only | |
| 38.1 Postmenopausal only | 2 | 92 | Mean Difference (IV, Random, 95% CI) | ‐0.17 [‐0.54, 0.20] |
| 38.2 Not postmenopausal only | 2 | 161 | Mean Difference (IV, Random, 95% CI) | ‐0.02 [‐0.09, 0.05] |
| 39 Overall body fat (follow‐up values) Show forest plot | 11 | Std. Mean Difference (IV, Random, 95% CI) | Subtotals only | |
| 39.1 Postmenopausal only | 5 | 264 | Std. Mean Difference (IV, Random, 95% CI) | ‐0.06 [‐0.36, 0.25] |
| 39.2 Not postmenopausal only | 6 | 353 | Std. Mean Difference (IV, Random, 95% CI) | ‐0.22 [‐0.59, 0.15] |
| 40 Overall body fat (change values) Show forest plot | 5 | Std. Mean Difference (IV, Random, 95% CI) | Subtotals only | |
| 40.1 Postmenopausal only | 3 | 128 | Std. Mean Difference (IV, Random, 95% CI) | ‐0.35 [‐0.70, 0.00] |
| 40.2 Not postmenopausal only | 2 | 161 | Std. Mean Difference (IV, Random, 95% CI) | ‐1.67 [‐4.39, 1.05] |
| 41 Lower body strength (follow‐up values) Show forest plot | 6 | Std. Mean Difference (IV, Random, 95% CI) | Subtotals only | |
| 41.1 Postmenopausal only | 1 | 67 | Std. Mean Difference (IV, Random, 95% CI) | 0.19 [‐0.30, 0.67] |
| 41.2 Not postmenopausal only | 5 | 228 | Std. Mean Difference (IV, Random, 95% CI) | 0.46 [0.04, 0.88] |
| 42 Lower body strength (change values) Show forest plot | 3 | Std. Mean Difference (IV, Random, 95% CI) | Subtotals only | |
| 42.1 Postmenopausal only | 2 | 256 | Std. Mean Difference (IV, Random, 95% CI) | 0.70 [‐0.01, 1.41] |
| 42.2 Not postmenopausal only | 1 | 45 | Std. Mean Difference (IV, Random, 95% CI) | 1.27 [0.63, 1.92] |
| 43 Upper body strength (follow‐up values) Show forest plot | 5 | Std. Mean Difference (IV, Random, 95% CI) | Subtotals only | |
| 43.1 Postmenopausal only | 1 | 67 | Std. Mean Difference (IV, Random, 95% CI) | 0.14 [‐0.34, 0.62] |
| 43.2 Not postmenopausal only | 4 | 208 | Std. Mean Difference (IV, Random, 95% CI) | 0.44 [‐0.40, 1.28] |
| 44 Upper body strength (change values) Show forest plot | 4 | Std. Mean Difference (IV, Random, 95% CI) | Subtotals only | |
| 44.1 Postmenopausal only | 2 | 306 | Std. Mean Difference (IV, Random, 95% CI) | 0.25 [0.03, 0.48] |
| 44.2 Not postmenopausal only | 2 | 81 | Std. Mean Difference (IV, Random, 95% CI) | 1.49 [0.04, 2.93] |
| 45 Bone mineral density ‐ femoral neck (follow‐up and change values) Show forest plot | 4 | Std. Mean Difference (IV, Random, 95% CI) | Subtotals only | |
| 45.1 Postmenopausal only | 3 | 329 | Std. Mean Difference (IV, Random, 95% CI) | 0.18 [‐0.39, 0.75] |
| 45.2 Not postmenopausal only | 1 | 457 | Std. Mean Difference (IV, Random, 95% CI) | 0.18 [‐0.00, 0.37] |
| 46 Bone mineral density ‐ lumbar spine (follow‐up and change values) Show forest plot | 4 | Std. Mean Difference (IV, Random, 95% CI) | Subtotals only | |
| 46.1 Postmenopausal only | 3 | 329 | Std. Mean Difference (IV, Random, 95% CI) | 0.27 [‐0.16, 0.70] |
| 46.2 Not postmenopausal only | 1 | 457 | Std. Mean Difference (IV, Random, 95% CI) | 0.09 [‐0.09, 0.27] |
| Outcome or subgroup title | No. of studies | No. of participants | Statistical method | Effect size |
| 1 Overall HRQoL (follow‐up values) Show forest plot | 22 | Std. Mean Difference (IV, Random, 95% CI) | Subtotals only | |
| 1.1 Aerobic exercise interventions | 12 | 971 | Std. Mean Difference (IV, Random, 95% CI) | 0.41 [0.19, 0.63] |
| 1.2 Resistance exercise interventions | 1 | 79 | Std. Mean Difference (IV, Random, 95% CI) | 0.35 [‐0.09, 0.79] |
| 1.3 Combined aerobic and resistance exercise | 7 | 589 | Std. Mean Difference (IV, Random, 95% CI) | 0.63 [0.08, 1.19] |
| 1.4 Yoga, Tai Chi, and Pilates interventions | 3 | 184 | Std. Mean Difference (IV, Random, 95% CI) | 0.11 [‐0.22, 0.45] |
| 2 Overall HRQoL (change values) Show forest plot | 14 | Std. Mean Difference (IV, Random, 95% CI) | Subtotals only | |
| 2.1 Aerobic exercise interventions | 9 | 1280 | Std. Mean Difference (IV, Random, 95% CI) | 0.68 [0.22, 1.15] |
| 2.2 Resistance exercise interventions | 1 | 79 | Std. Mean Difference (IV, Random, 95% CI) | 0.40 [‐0.05, 0.84] |
| 2.3 Combined aerobic and resistance exercise | 4 | 139 | Std. Mean Difference (IV, Random, 95% CI) | 0.69 [0.01, 1.38] |
| 2.4 Yoga, Tai Chi, and Pilates interventions | 1 | 21 | Std. Mean Difference (IV, Random, 95% CI) | 2.88 [1.59, 4.17] |
| 3 Overall emotional function/mental health (follow‐up values) Show forest plot | 26 | Std. Mean Difference (IV, Random, 95% CI) | Subtotals only | |
| 3.1 Aerobic exercise interventions | 14 | 1415 | Std. Mean Difference (IV, Random, 95% CI) | 0.15 [0.04, 0.25] |
| 3.2 Resistance exercise interventions | 2 | 311 | Std. Mean Difference (IV, Random, 95% CI) | 0.08 [‐0.28, 0.44] |
| 3.3 Combined aerobic and resistance exercise | 6 | 263 | Std. Mean Difference (IV, Random, 95% CI) | 0.72 [0.47, 0.97] |
| 3.4 Yoga, Tai Chi, and Pilates interventions | 4 | 113 | Std. Mean Difference (IV, Random, 95% CI) | ‐0.03 [‐0.40, 0.34] |
| 4 Overall emotional function/mental health (change values) Show forest plot | 15 | Std. Mean Difference (IV, Random, 95% CI) | Subtotals only | |
| 4.1 Aerobic exercise | 7 | 701 | Std. Mean Difference (IV, Random, 95% CI) | 0.44 [0.06, 0.82] |
| 4.2 Resistance exercise | 3 | 261 | Std. Mean Difference (IV, Random, 95% CI) | 0.22 [‐0.09, 0.54] |
| 4.3 Combined aerobic and resistance exercise | 4 | 598 | Std. Mean Difference (IV, Random, 95% CI) | ‐0.01 [‐0.38, 0.36] |
| 4.4 Yoga, Tai Chi, and Pilates | 1 | 19 | Std. Mean Difference (IV, Random, 95% CI) | 1.06 [0.08, 2.03] |
| 5 Overall physical function (follow‐up values) Show forest plot | 25 | Std. Mean Difference (IV, Random, 95% CI) | Subtotals only | |
| 5.1 Aerobic exercise | 14 | 1465 | Std. Mean Difference (IV, Random, 95% CI) | 0.28 [0.15, 0.41] |
| 5.2 Resistance exercise | 3 | 372 | Std. Mean Difference (IV, Random, 95% CI) | 0.23 [‐0.11, 0.57] |
| 5.3 Combined aerobic and resistance exercise | 5 | 202 | Std. Mean Difference (IV, Random, 95% CI) | 0.80 [‐0.04, 1.64] |
| 5.4 Yoga, Tai Chi, and Pilates | 3 | 90 | Std. Mean Difference (IV, Random, 95% CI) | 0.16 [‐0.26, 0.57] |
| 6 Overall physical function (change values) Show forest plot | 13 | Std. Mean Difference (IV, Random, 95% CI) | Subtotals only | |
| 6.1 Aerobic exercise | 7 | 1116 | Std. Mean Difference (IV, Random, 95% CI) | 0.72 [0.14, 1.30] |
| 6.2 Resistance exercise | 3 | 261 | Std. Mean Difference (IV, Random, 95% CI) | 0.24 [‐0.17, 0.65] |
| 6.3 Combined aerobic and resistance exercise | 2 | 37 | Std. Mean Difference (IV, Random, 95% CI) | 0.75 [‐0.22, 1.73] |
| 6.4 Yoga, Tai Chi, and Pilates | 1 | 19 | Std. Mean Difference (IV, Random, 95% CI) | 0.93 [‐0.03, 1.89] |
| 7 Overall role function (follow‐up values) Show forest plot | 18 | Std. Mean Difference (IV, Random, 95% CI) | Subtotals only | |
| 7.1 Aerobic exercise | 10 | 1043 | Std. Mean Difference (IV, Random, 95% CI) | 0.28 [0.12, 0.44] |
| 7.2 Resistance exercise | 1 | 79 | Std. Mean Difference (IV, Random, 95% CI) | 0.12 [‐0.32, 0.57] |
| 7.3 Combined aerobic and resistance exercise | 3 | 136 | Std. Mean Difference (IV, Random, 95% CI) | 0.61 [‐1.15, 2.37] |
| 7.4 Yoga, Tai Chi, and Pilates | 4 | 112 | Std. Mean Difference (IV, Random, 95% CI) | 0.11 [‐0.26, 0.48] |
| 8 Overall role function (change values) Show forest plot | 12 | Std. Mean Difference (IV, Random, 95% CI) | Subtotals only | |
| 8.1 Aerobic exercise | 7 | 1118 | Std. Mean Difference (IV, Random, 95% CI) | 0.16 [‐0.10, 0.43] |
| 8.2 Resistance exercise | 2 | 141 | Std. Mean Difference (IV, Random, 95% CI) | 0.17 [‐0.32, 0.65] |
| 8.3 Combined aerobic and resistance exercise | 2 | 37 | Std. Mean Difference (IV, Random, 95% CI) | 0.12 [‐0.52, 0.77] |
| 8.4 Yoga, Tai Chi, and Pilates | 1 | 19 | Std. Mean Difference (IV, Random, 95% CI) | ‐0.15 [‐1.05, 0.76] |
| 9 Overall social well‐being/function (follow‐up values) Show forest plot | 18 | Std. Mean Difference (IV, Random, 95% CI) | Subtotals only | |
| 9.1 Aerobic exercise | 10 | 1044 | Std. Mean Difference (IV, Random, 95% CI) | 0.18 [0.04, 0.31] |
| 9.2 Resistance exercise | 1 | 121 | Std. Mean Difference (IV, Random, 95% CI) | 0.14 [‐0.21, 0.50] |
| 9.3 Combined aerobic and resistance exercise | 3 | 116 | Std. Mean Difference (IV, Random, 95% CI) | 0.45 [‐0.16, 1.05] |
| 9.4 Yoga, Tai Chi, and Pilates | 4 | 276 | Std. Mean Difference (IV, Random, 95% CI) | 0.10 [‐0.13, 0.34] |
| 10 Overall social well‐being/function (change values) Show forest plot | 12 | Std. Mean Difference (IV, Random, 95% CI) | Subtotals only | |
| 10.1 Aerobic exercise | 7 | 1119 | Std. Mean Difference (IV, Random, 95% CI) | 0.60 [0.07, 1.13] |
| 10.2 Resistance exercise | 2 | 183 | Std. Mean Difference (IV, Random, 95% CI) | 0.11 [‐0.19, 0.41] |
| 10.3 Combined aerobic and resistance exercise | 2 | 63 | Std. Mean Difference (IV, Random, 95% CI) | 0.66 [0.15, 1.17] |
| 10.4 Yoga, Tai Chi, and Pilates | 1 | 19 | Std. Mean Difference (IV, Random, 95% CI) | 0.76 [‐0.18, 1.70] |
| 11 Overall cognitive function (follow‐up values) Show forest plot | 5 | Std. Mean Difference (IV, Random, 95% CI) | Subtotals only | |
| 11.1 Aerobic exercise | 2 | 94 | Std. Mean Difference (IV, Random, 95% CI) | 0.24 [‐0.17, 0.65] |
| 11.2 Resistance exercise | 0 | 0 | Std. Mean Difference (IV, Random, 95% CI) | 0.0 [0.0, 0.0] |
| 11.3 Combined aerobic and resistance exercise | 3 | 95 | Std. Mean Difference (IV, Random, 95% CI) | 0.57 [0.15, 0.98] |
| 11.4 Yoga, Tai Chi, and Pilates | 0 | 0 | Std. Mean Difference (IV, Random, 95% CI) | 0.0 [0.0, 0.0] |
| 12 Overall cognitive function (change values) Show forest plot | 5 | Std. Mean Difference (IV, Random, 95% CI) | Subtotals only | |
| 12.1 Aerobic exercise | 2 | 95 | Std. Mean Difference (IV, Random, 95% CI) | 0.08 [‐0.50, 0.65] |
| 12.2 Resistance exercise | 0 | 0 | Std. Mean Difference (IV, Random, 95% CI) | 0.0 [0.0, 0.0] |
| 12.3 Combined aerobic and resistance exercise | 3 | 577 | Std. Mean Difference (IV, Random, 95% CI) | ‐0.01 [‐0.38, 0.35] |
| 12.4 Yoga, Tai Chi, and Pilates | 0 | 0 | Std. Mean Difference (IV, Random, 95% CI) | 0.0 [0.0, 0.0] |
| 13 Overall general health (follow‐up values) Show forest plot | 10 | Std. Mean Difference (IV, Random, 95% CI) | Subtotals only | |
| 13.1 Aerobic exercise | 6 | 293 | Std. Mean Difference (IV, Random, 95% CI) | 0.11 [‐0.29, 0.51] |
| 13.2 Resistance exercise | 1 | 79 | Std. Mean Difference (IV, Random, 95% CI) | 0.10 [‐0.34, 0.55] |
| 13.3 Combined aerobic and resistance exercise | 3 | 118 | Std. Mean Difference (IV, Random, 95% CI) | 0.46 [0.00, 0.91] |
| 13.4 Yoga, Tai Chi, and Pilates | 1 | 18 | Std. Mean Difference (IV, Random, 95% CI) | ‐0.18 [‐1.11, 0.74] |
| 14 Overall general health (change values) Show forest plot | 9 | Std. Mean Difference (IV, Fixed, 95% CI) | Subtotals only | |
| 14.1 Aerobic exercise | 5 | 710 | Std. Mean Difference (IV, Fixed, 95% CI) | ‐0.02 [‐0.17, 0.13] |
| 14.2 Resistance exercise | 2 | 141 | Std. Mean Difference (IV, Fixed, 95% CI) | 0.23 [‐0.12, 0.57] |
| 14.3 Combined aerobic and resistance exercise | 2 | 76 | Std. Mean Difference (IV, Fixed, 95% CI) | 0.66 [0.17, 1.16] |
| 14.4 Yoga, Tai Chi, and Pilates | 1 | 19 | Std. Mean Difference (IV, Fixed, 95% CI) | ‐0.20 [‐1.10, 0.71] |
| 15 Overall sexual function (follow‐up values) Show forest plot | 5 | Std. Mean Difference (IV, Fixed, 95% CI) | Subtotals only | |
| 15.1 Aerobic exercise | 2 | 136 | Std. Mean Difference (IV, Fixed, 95% CI) | ‐0.00 [‐0.34, 0.34] |
| 15.2 Resistance exercise | 2 | 193 | Std. Mean Difference (IV, Fixed, 95% CI) | 0.21 [‐0.07, 0.49] |
| 15.3 Combined aerobic and resistance exercise | 1 | 82 | Std. Mean Difference (IV, Fixed, 95% CI) | 0.29 [‐0.14, 0.73] |
| 15.4 Yoga, Tai Chi, and Pilates | 0 | 0 | Std. Mean Difference (IV, Fixed, 95% CI) | 0.0 [0.0, 0.0] |
| 16 Overall sexual function (change values) Show forest plot | 3 | Mean Difference (IV, Random, 95% CI) | Subtotals only | |
| 16.1 Aerobic exercise | 1 | 500 | Mean Difference (IV, Random, 95% CI) | 0.5 [‐3.86, 4.86] |
| 16.2 Resistance exercise | 2 | 193 | Mean Difference (IV, Random, 95% CI) | 3.83 [‐1.83, 9.48] |
| 16.3 Combined aerobic and resistance exercise | 0 | 0 | Mean Difference (IV, Random, 95% CI) | 0.0 [0.0, 0.0] |
| 16.4 Yoga, Tai Chi, and Pilates | 0 | 0 | Mean Difference (IV, Random, 95% CI) | 0.0 [0.0, 0.0] |
| 17 Overall sleep (follow‐up values) Show forest plot | 5 | Std. Mean Difference (IV, Fixed, 95% CI) | Subtotals only | |
| 17.1 Aerobic exercise | 2 | 95 | Std. Mean Difference (IV, Fixed, 95% CI) | ‐0.18 [‐0.59, 0.23] |
| 17.2 Resistance exercise | 0 | 0 | Std. Mean Difference (IV, Fixed, 95% CI) | 0.0 [0.0, 0.0] |
| 17.3 Combined aerobic and resistance exercise | 2 | 62 | Std. Mean Difference (IV, Fixed, 95% CI) | ‐0.07 [‐0.57, 0.43] |
| 17.4 Yoga, Tai Chi, and Pilates | 1 | 31 | Std. Mean Difference (IV, Fixed, 95% CI) | 0.15 [‐0.55, 0.86] |
| 18 Overall sleep (change values) Show forest plot | 3 | Std. Mean Difference (IV, Random, 95% CI) | Subtotals only | |
| 18.1 Aerobic exercise | 2 | 94 | Std. Mean Difference (IV, Random, 95% CI) | 0.10 [‐0.30, 0.51] |
| 18.2 Resistance exercise | 0 | 0 | Std. Mean Difference (IV, Random, 95% CI) | 0.0 [0.0, 0.0] |
| 18.3 Combined aerobic and resistance exercise | 1 | 42 | Std. Mean Difference (IV, Random, 95% CI) | 0.23 [‐0.38, 0.84] |
| 18.4 Yoga, Tai Chi, and Pilates | 0 | 0 | Std. Mean Difference (IV, Random, 95% CI) | 0.0 [0.0, 0.0] |
| 19 Overall anxiety (follow‐up values) Show forest plot | 7 | Std. Mean Difference (IV, Random, 95% CI) | Subtotals only | |
| 19.1 Aerobic exercise | 4 | 205 | Std. Mean Difference (IV, Random, 95% CI) | ‐0.76 [‐1.37, ‐0.14] |
| 19.2 Resistance exercise | 0 | 0 | Std. Mean Difference (IV, Random, 95% CI) | 0.0 [0.0, 0.0] |
| 19.3 Combined aerobic and resistance exercise | 3 | 121 | Std. Mean Difference (IV, Random, 95% CI) | ‐0.40 [‐0.87, 0.07] |
| 19.4 Yoga, Tai Chi, and Pilates | 0 | 0 | Std. Mean Difference (IV, Random, 95% CI) | 0.0 [0.0, 0.0] |
| 20 Overall anxiety (change values) Show forest plot | 4 | Std. Mean Difference (IV, Fixed, 95% CI) | Subtotals only | |
| 20.1 Aerobic exercise | 2 | 132 | Std. Mean Difference (IV, Fixed, 95% CI) | ‐0.27 [‐0.61, 0.07] |
| 20.2 Resistance exercise | 0 | 0 | Std. Mean Difference (IV, Fixed, 95% CI) | 0.0 [0.0, 0.0] |
| 20.3 Combined aerobic and resistance exercise | 2 | 103 | Std. Mean Difference (IV, Fixed, 95% CI) | ‐0.51 [‐0.90, ‐0.12] |
| 20.4 Yoga, Tai Chi, and Pilates | 0 | 0 | Std. Mean Difference (IV, Fixed, 95% CI) | 0.0 [0.0, 0.0] |
| 21 Overall depression (follow‐up values) Show forest plot | 12 | Std. Mean Difference (IV, Random, 95% CI) | Subtotals only | |
| 21.1 Aerobic exercise | 6 | 273 | Std. Mean Difference (IV, Random, 95% CI) | ‐0.32 [‐0.78, 0.14] |
| 21.2 Resistance exercise | 0 | 0 | Std. Mean Difference (IV, Random, 95% CI) | 0.0 [0.0, 0.0] |
| 21.3 Combined aerobic and resistance exercise | 5 | 187 | Std. Mean Difference (IV, Random, 95% CI) | ‐0.33 [‐0.90, 0.24] |
| 21.4 Yoga, Tai Chi, and Pilates | 2 | 217 | Std. Mean Difference (IV, Random, 95% CI) | ‐0.23 [‐0.61, 0.14] |
| 22 Overall depression (change values) Show forest plot | 7 | Std. Mean Difference (IV, Random, 95% CI) | Subtotals only | |
| 22.1 Aerobic exercise | 4 | 672 | Std. Mean Difference (IV, Random, 95% CI) | ‐0.18 [‐0.48, 0.11] |
| 22.2 Resistance exercise | 0 | 0 | Std. Mean Difference (IV, Random, 95% CI) | 0.0 [0.0, 0.0] |
| 22.3 Combined aerobic and resistance exercise | 4 | 164 | Std. Mean Difference (IV, Random, 95% CI) | ‐0.47 [‐0.92, ‐0.02] |
| 22.4 Yoga, Tai Chi, and Pilates | 0 | 0 | Std. Mean Difference (IV, Random, 95% CI) | 0.0 [0.0, 0.0] |
| 23 Overall fatigue (follow‐up values) Show forest plot | 25 | Std. Mean Difference (IV, Random, 95% CI) | Subtotals only | |
| 23.1 Aerobic exercise | 11 | 925 | Std. Mean Difference (IV, Random, 95% CI) | ‐0.24 [‐0.41, ‐0.07] |
| 23.2 Resistance exercise | 1 | 67 | Std. Mean Difference (IV, Random, 95% CI) | 0.23 [‐0.25, 0.72] |
| 23.3 Combined aerobic and resistance exercise | 9 | 642 | Std. Mean Difference (IV, Random, 95% CI) | ‐0.48 [‐0.83, ‐0.13] |
| 23.4 Yoga, Tai Chi, and Pilates | 5 | 311 | Std. Mean Difference (IV, Random, 95% CI) | ‐0.36 [‐0.58, ‐0.13] |
| 24 Overall fatigue (change values) Show forest plot | 12 | Std. Mean Difference (IV, Random, 95% CI) | Subtotals only | |
| 24.1 Aerobic exercise | 7 | 1130 | Std. Mean Difference (IV, Random, 95% CI) | ‐0.08 [‐0.38, 0.23] |
| 24.2 Resistance exercise | 0 | 0 | Std. Mean Difference (IV, Random, 95% CI) | 0.0 [0.0, 0.0] |
| 24.3 Combined aerobic and resistance exercise | 4 | 118 | Std. Mean Difference (IV, Random, 95% CI) | ‐0.81 [‐1.57, ‐0.05] |
| 24.4 Yoga, Tai Chi, and Pilates | 1 | 23 | Std. Mean Difference (IV, Random, 95% CI) | ‐0.07 [‐0.89, 0.75] |
| 25 Overall pain/disability (follow‐up values) Show forest plot | 9 | Std. Mean Difference (IV, Random, 95% CI) | Subtotals only | |
| 25.1 Aerobic exercise | 5 | 397 | Std. Mean Difference (IV, Random, 95% CI) | 0.11 [‐0.15, 0.37] |
| 25.2 Resistance exercise | 0 | 0 | Std. Mean Difference (IV, Random, 95% CI) | 0.0 [0.0, 0.0] |
| 25.3 Combined aerobic and resistance exercise | 2 | 96 | Std. Mean Difference (IV, Random, 95% CI) | 0.13 [‐0.29, 0.54] |
| 25.4 Yoga, Tai Chi, and Pilates | 2 | 42 | Std. Mean Difference (IV, Random, 95% CI) | ‐0.18 [‐0.78, 0.43] |
| 26 Overall pain/disability (change values) Show forest plot | 5 | Std. Mean Difference (IV, Random, 95% CI) | Subtotals only | |
| 26.1 Aerobic exercise | 2 | 132 | Std. Mean Difference (IV, Random, 95% CI) | ‐0.03 [‐0.44, 0.39] |
| 26.2 Resistance exercise | 1 | 62 | Std. Mean Difference (IV, Random, 95% CI) | 0.22 [‐0.33, 0.76] |
| 26.3 Combined aerobic and resistance exercise | 1 | 83 | Std. Mean Difference (IV, Random, 95% CI) | ‐0.35 [‐0.79, 0.08] |
| 26.4 Yoga, Tai Chi, and Pilates | 1 | 19 | Std. Mean Difference (IV, Random, 95% CI) | ‐0.15 [‐1.06, 0.75] |
| 27 Overall self‐esteem/body image (follow‐up values) Show forest plot | 12 | Std. Mean Difference (IV, Random, 95% CI) | Subtotals only | |
| 27.1 Aerobic exercise | 7 | 364 | Std. Mean Difference (IV, Random, 95% CI) | 0.29 [‐0.07, 0.64] |
| 27.2 Resistance exercise | 2 | 143 | Std. Mean Difference (IV, Random, 95% CI) | 0.06 [‐0.27, 0.39] |
| 27.3 Combined aerobic and resistance exercise | 4 | 161 | Std. Mean Difference (IV, Random, 95% CI) | 0.14 [‐0.46, 0.74] |
| 27.4 Yoga, Tai Chi, and Pilates | 1 | 23 | Std. Mean Difference (IV, Random, 95% CI) | 0.20 [‐0.62, 1.02] |
| 28 Overall self‐esteem/body image (change values) Show forest plot | 9 | Std. Mean Difference (IV, Random, 95% CI) | Subtotals only | |
| 28.1 Aerobic exercise | 6 | 771 | Std. Mean Difference (IV, Random, 95% CI) | 0.14 [‐0.12, 0.39] |
| 28.2 Resistance exercise | 2 | 143 | Std. Mean Difference (IV, Random, 95% CI) | ‐0.29 [‐0.88, 0.30] |
| 28.3 Combined aerobic and resistance exercise | 2 | 81 | Std. Mean Difference (IV, Random, 95% CI) | 0.10 [‐0.54, 0.75] |
| 28.4 Yoga, Tai Chi, and Pilates | 1 | 21 | Std. Mean Difference (IV, Random, 95% CI) | 3.42 [1.99, 4.86] |
| 29 Overall cardiorespiratory fitness (follow‐up values) Show forest plot | 23 | Std. Mean Difference (IV, Random, 95% CI) | Subtotals only | |
| 29.1 Aerobic exercise | 12 | 814 | Std. Mean Difference (IV, Random, 95% CI) | 0.37 [0.21, 0.54] |
| 29.2 Resistance exercise | 1 | 21 | Std. Mean Difference (IV, Random, 95% CI) | 0.27 [‐0.60, 1.14] |
| 29.3 Combined aerobic and resistance exercise | 11 | 433 | Std. Mean Difference (IV, Random, 95% CI) | 0.56 [0.30, 0.81] |
| 29.4 Yoga, Tai Chi, and Pilates | 1 | 21 | Std. Mean Difference (IV, Random, 95% CI) | 0.39 [‐0.48, 1.25] |
| 30 Overall cardiorespiratory fitness (change values) Show forest plot | 9 | Std. Mean Difference (IV, Random, 95% CI) | Subtotals only | |
| 30.1 Aerobic exercise | 5 | 685 | Std. Mean Difference (IV, Random, 95% CI) | 0.79 [0.17, 1.42] |
| 30.2 Resistance exercise | 1 | 21 | Std. Mean Difference (IV, Random, 95% CI) | ‐0.04 [‐0.91, 0.82] |
| 30.3 Combined aerobic and resistance exercise | 5 | 181 | Std. Mean Difference (IV, Random, 95% CI) | 0.75 [0.18, 1.31] |
| 30.4 Yoga, Tai Chi, and Pilates | 0 | 0 | Std. Mean Difference (IV, Random, 95% CI) | 0.0 [0.0, 0.0] |
| 31 Overall self‐reported physical activity (follow‐up values) Show forest plot | 17 | Std. Mean Difference (IV, Random, 95% CI) | Subtotals only | |
| 31.1 Aerobic exercise | 10 | 1011 | Std. Mean Difference (IV, Random, 95% CI) | 0.69 [0.44, 0.94] |
| 31.2 Resistance exercise | 2 | 331 | Std. Mean Difference (IV, Random, 95% CI) | 0.08 [‐0.13, 0.30] |
| 31.3 Combined aerobic and resistance exercise | 3 | 421 | Std. Mean Difference (IV, Random, 95% CI) | 0.53 [‐0.05, 1.10] |
| 31.4 Yoga, Tai Chi, and Pilates | 2 | 249 | Std. Mean Difference (IV, Random, 95% CI) | 0.33 [0.08, 0.58] |
| 32 Overall self‐reported physical activity (change values) Show forest plot | 8 | Std. Mean Difference (IV, Random, 95% CI) | Subtotals only | |
| 32.1 Aerobic exercise | 6 | 1086 | Std. Mean Difference (IV, Random, 95% CI) | 0.59 [0.20, 0.97] |
| 32.2 Resistance exercise | 1 | 105 | Std. Mean Difference (IV, Random, 95% CI) | 0.21 [‐0.17, 0.60] |
| 32.3 Combined aerobic and resistance exercise | 1 | 83 | Std. Mean Difference (IV, Random, 95% CI) | 0.94 [0.48, 1.40] |
| 32.4 Yoga, Tai Chi, and Pilates | 0 | 0 | Std. Mean Difference (IV, Random, 95% CI) | 0.0 [0.0, 0.0] |
| 33 Overall objective physical activity (follow‐up values) Show forest plot | 11 | Std. Mean Difference (IV, Random, 95% CI) | Subtotals only | |
| 33.1 Aerobic exercise | 8 | 876 | Std. Mean Difference (IV, Random, 95% CI) | 0.43 [0.15, 0.70] |
| 33.2 Resistance exercise | 0 | 0 | Std. Mean Difference (IV, Random, 95% CI) | 0.0 [0.0, 0.0] |
| 33.3 Combined aerobic and resistance exercise | 3 | 394 | Std. Mean Difference (IV, Random, 95% CI) | 0.54 [‐0.31, 1.40] |
| 33.4 Yoga, Tai Chi, and Pilates | 0 | 0 | Std. Mean Difference (IV, Random, 95% CI) | 0.0 [0.0, 0.0] |
| 34 Overall objective physical activity (change values) Show forest plot | 5 | Std. Mean Difference (IV, Random, 95% CI) | Subtotals only | |
| 34.1 Aerobic exercise | 4 | 466 | Std. Mean Difference (IV, Random, 95% CI) | 0.61 [‐0.01, 1.23] |
| 34.2 Resistance exercise | 0 | 0 | Std. Mean Difference (IV, Random, 95% CI) | 0.0 [0.0, 0.0] |
| 34.3 Combined aerobic and resistance exercise | 1 | 42 | Std. Mean Difference (IV, Random, 95% CI) | 1.13 [0.47, 1.78] |
| 34.4 Yoga, Tai Chi, and Pilates | 0 | 0 | Std. Mean Difference (IV, Random, 95% CI) | 0.0 [0.0, 0.0] |
| 35 Mass (follow‐up values) Show forest plot | 16 | Mean Difference (IV, Fixed, 95% CI) | Subtotals only | |
| 35.1 Aerobic exercise | 7 | 411 | Mean Difference (IV, Fixed, 95% CI) | ‐1.29 [‐4.06, 1.47] |
| 35.2 Resistance exercise | 3 | 410 | Mean Difference (IV, Fixed, 95% CI) | 0.26 [‐0.67, 1.20] |
| 35.3 Combined aerobic and resistance exercise | 3 | 127 | Mean Difference (IV, Fixed, 95% CI) | ‐2.46 [‐7.24, 2.33] |
| 35.4 Yoga, Tai Chi, and Pilates | 3 | 262 | Mean Difference (IV, Fixed, 95% CI) | ‐0.01 [‐0.78, 0.76] |
| 36 Mass (change values) Show forest plot | 11 | Mean Difference (IV, Random, 95% CI) | Subtotals only | |
| 36.1 Aerobic exercise | 5 | 679 | Mean Difference (IV, Random, 95% CI) | ‐0.74 [‐1.58, 0.09] |
| 36.2 Resistance exercise | 2 | 209 | Mean Difference (IV, Random, 95% CI) | 0.10 [‐0.15, 0.34] |
| 36.3 Combined aerobic and resistance exercise | 3 | 140 | Mean Difference (IV, Random, 95% CI) | ‐0.55 [‐1.99, 0.90] |
| 36.4 Yoga, Tai Chi, and Pilates | 1 | 19 | Mean Difference (IV, Random, 95% CI) | ‐0.90 [‐2.40, 0.60] |
| 37 BMI (follow‐up values) Show forest plot | 17 | Mean Difference (IV, Fixed, 95% CI) | Subtotals only | |
| 37.1 Aerobic exercise | 6 | 639 | Mean Difference (IV, Fixed, 95% CI) | ‐0.41 [‐1.26, 0.43] |
| 37.2 Resistance exercise | 2 | 343 | Mean Difference (IV, Fixed, 95% CI) | 0.17 [‐0.15, 0.48] |
| 37.3 Combined aerobic and resistance exercise | 6 | 237 | Mean Difference (IV, Fixed, 95% CI) | ‐1.03 [‐2.63, 0.56] |
| 37.4 Yoga, Tai Chi, and Pilates | 3 | 262 | Mean Difference (IV, Fixed, 95% CI) | ‐0.03 [‐0.32, 0.26] |
| 38 BMI (change values) Show forest plot | 8 | Mean Difference (IV, Random, 95% CI) | Subtotals only | |
| 38.1 Aerobic exercise | 2 | 112 | Mean Difference (IV, Random, 95% CI) | ‐0.48 [‐0.84, ‐0.13] |
| 38.2 Resistance exercise | 2 | 209 | Mean Difference (IV, Random, 95% CI) | ‐0.01 [‐0.08, 0.06] |
| 38.3 Combined aerobic and resistance exercise | 3 | 145 | Mean Difference (IV, Random, 95% CI) | ‐0.02 [‐0.28, 0.24] |
| 38.4 Yoga, Tai Chi, and Pilates | 1 | 19 | Mean Difference (IV, Random, 95% CI) | ‐0.71 [‐1.33, ‐0.09] |
| 39 Overall body fat (follow‐up values) Show forest plot | 18 | Std. Mean Difference (IV, Random, 95% CI) | Subtotals only | |
| 39.1 Aerobic exercise | 10 | 551 | Std. Mean Difference (IV, Random, 95% CI) | ‐0.11 [‐0.28, 0.06] |
| 39.2 Resistance exercise | 4 | 429 | Std. Mean Difference (IV, Random, 95% CI) | ‐0.26 [‐0.81, 0.28] |
| 39.3 Combined aerobic and resistance exercise | 5 | 185 | Std. Mean Difference (IV, Random, 95% CI) | ‐0.13 [‐0.42, 0.16] |
| 39.4 Yoga, Tai Chi, and Pilates | 1 | 21 | Std. Mean Difference (IV, Random, 95% CI) | ‐0.66 [‐1.54, 0.23] |
| 40 Overall body fat (change values) Show forest plot | 9 | Std. Mean Difference (IV, Random, 95% CI) | Subtotals only | |
| 40.1 Aerobic exercise | 3 | 108 | Std. Mean Difference (IV, Random, 95% CI) | ‐0.43 [‐0.82, ‐0.05] |
| 40.2 Resistance exercise | 3 | 228 | Std. Mean Difference (IV, Random, 95% CI) | ‐1.38 [‐3.39, 0.63] |
| 40.3 Combined aerobic and resistance exercise | 4 | 168 | Std. Mean Difference (IV, Random, 95% CI) | ‐0.30 [‐0.61, 0.00] |
| 40.4 Yoga, Tai Chi, and Pilates | 1 | 19 | Std. Mean Difference (IV, Random, 95% CI) | ‐0.18 [‐1.09, 0.72] |
| 41 Lower body strength (follow‐up values) Show forest plot | 10 | Std. Mean Difference (IV, Random, 95% CI) | Subtotals only | |
| 41.1 Aerobic exercise | 3 | 125 | Std. Mean Difference (IV, Random, 95% CI) | 0.75 [‐0.20, 1.69] |
| 41.2 Resistance exercise | 3 | 344 | Std. Mean Difference (IV, Random, 95% CI) | 0.72 [0.22, 1.23] |
| 41.3 Combined aerobic and resistance exercise | 4 | 168 | Std. Mean Difference (IV, Random, 95% CI) | 0.05 [‐0.28, 0.38] |
| 41.4 Yoga, Tai Chi, and Pilates | 0 | 0 | Std. Mean Difference (IV, Random, 95% CI) | 0.0 [0.0, 0.0] |
| 42 Lower body strength (change values) Show forest plot | 8 | Std. Mean Difference (IV, Random, 95% CI) | Subtotals only | |
| 42.1 Aerobic exercise | 1 | 33 | Std. Mean Difference (IV, Random, 95% CI) | 1.17 [0.37, 1.97] |
| 42.2 Resistance exercise | 4 | 562 | Std. Mean Difference (IV, Random, 95% CI) | 0.85 [0.48, 1.22] |
| 42.3 Combined aerobic and resistance exercise | 3 | 125 | Std. Mean Difference (IV, Random, 95% CI) | 0.28 [‐0.37, 0.93] |
| 42.4 Yoga, Tai Chi, and Pilates | 0 | 0 | Std. Mean Difference (IV, Random, 95% CI) | 0.0 [0.0, 0.0] |
| 43 Upper body strength (follow‐up values) Show forest plot | 13 | Std. Mean Difference (IV, Random, 95% CI) | Subtotals only | |
| 43.1 Aerobic exercise | 5 | 175 | Std. Mean Difference (IV, Random, 95% CI) | 0.35 [0.05, 0.65] |
| 43.2 Resistance exercise | 4 | 365 | Std. Mean Difference (IV, Random, 95% CI) | 0.80 [0.28, 1.33] |
| 43.3 Combined aerobic and resistance exercise | 5 | 231 | Std. Mean Difference (IV, Random, 95% CI) | 0.25 [‐0.47, 0.97] |
| 43.4 Yoga, Tai Chi, and Pilates | 1 | 21 | Std. Mean Difference (IV, Random, 95% CI) | 0.60 [‐0.28, 1.49] |
| 44 Upper body strength (change values) Show forest plot | 8 | Std. Mean Difference (IV, Random, 95% CI) | Subtotals only | |
| 44.1 Aerobic exercise | 1 | 22 | Std. Mean Difference (IV, Random, 95% CI) | 0.36 [‐0.48, 1.21] |
| 44.2 Resistance exercise | 5 | 583 | Std. Mean Difference (IV, Random, 95% CI) | 0.96 [0.43, 1.49] |
| 44.3 Combined aerobic and resistance exercise | 3 | 168 | Std. Mean Difference (IV, Random, 95% CI) | 0.07 [‐0.34, 0.48] |
| 44.4 Yoga, Tai Chi, and Pilates | 1 | 83 | Std. Mean Difference (IV, Random, 95% CI) | 1.30 [0.82, 1.78] |
| 45 Bone mineral density ‐ femoral neck (follow‐up and change values) Show forest plot | 4 | Std. Mean Difference (IV, Random, 95% CI) | Subtotals only | |
| 45.1 Aerobic exercise | 1 | 457 | Std. Mean Difference (IV, Random, 95% CI) | 0.18 [‐0.00, 0.37] |
| 45.2 Resistance exercise | 2 | 290 | Std. Mean Difference (IV, Random, 95% CI) | 0.41 [‐0.09, 0.91] |
| 45.3 Combined aerobic and resistance exercise | 1 | 39 | Std. Mean Difference (IV, Random, 95% CI) | ‐0.37 [‐1.00, 0.27] |
| 45.4 Yoga, Tai Chi, and Pilates | 0 | 0 | Std. Mean Difference (IV, Random, 95% CI) | 0.0 [0.0, 0.0] |
| 46 Bone mineral density ‐ lumbar spine (follow‐up and change values) Show forest plot | 4 | Std. Mean Difference (IV, Random, 95% CI) | Subtotals only | |
| 46.1 Aerobic exercise | 1 | 457 | Std. Mean Difference (IV, Random, 95% CI) | 0.09 [‐0.09, 0.27] |
| 46.2 Resistance exercise | 2 | 290 | Std. Mean Difference (IV, Random, 95% CI) | 0.49 [0.25, 0.72] |
| 46.3 Combined aerobic and resistance exercise | 1 | 39 | Std. Mean Difference (IV, Random, 95% CI) | ‐0.26 [‐0.89, 0.37] |
| 46.4 Yoga, Tai Chi, and Pilates | 0 | 0 | Std. Mean Difference (IV, Random, 95% CI) | 0.0 [0.0, 0.0] |
| 47 Bone mineral density ‐ total hip (follow‐up and change values) Show forest plot | 3 | Std. Mean Difference (IV, Random, 95% CI) | Subtotals only | |
| 47.1 Aerobic exercise | 0 | 0 | Std. Mean Difference (IV, Random, 95% CI) | 0.0 [0.0, 0.0] |
| 47.2 Resistance exercise | 2 | 290 | Std. Mean Difference (IV, Random, 95% CI) | 0.64 [‐0.20, 1.48] |
| 47.3 Combined aerobic and resistance exercise | 1 | 39 | Std. Mean Difference (IV, Random, 95% CI) | 10.34 [7.84, 12.84] |
| 47.4 Yoga, Tai Chi, and Pilates | 0 | 0 | Std. Mean Difference (IV, Random, 95% CI) | 0.0 [0.0, 0.0] |
| Outcome or subgroup title | No. of studies | No. of participants | Statistical method | Effect size |
| 1 Overall HRQoL (follow‐up values) Show forest plot | 22 | Std. Mean Difference (IV, Random, 95% CI) | Subtotals only | |
| 1.1 Light‐to‐moderate intensity | 16 | 983 | Std. Mean Difference (IV, Random, 95% CI) | 0.51 [0.25, 0.77] |
| 1.2 Moderate‐to‐high intensity | 6 | 820 | Std. Mean Difference (IV, Random, 95% CI) | 0.19 [‐0.05, 0.43] |
| 2 Overall HRQoL (change values) Show forest plot | 14 | Std. Mean Difference (IV, Random, 95% CI) | Subtotals only | |
| 2.1 Light‐to‐moderate intensity | 10 | 534 | Std. Mean Difference (IV, Random, 95% CI) | 0.99 [0.39, 1.60] |
| 2.2 Moderate‐to‐high intensity | 4 | 925 | Std. Mean Difference (IV, Random, 95% CI) | 0.28 [‐0.11, 0.67] |
| 3 Overall emotional function/mental health (follow‐up values) Show forest plot | 26 | Std. Mean Difference (IV, Random, 95% CI) | Subtotals only | |
| 3.1 Light‐to‐moderate intensity | 21 | 1489 | Std. Mean Difference (IV, Random, 95% CI) | 0.19 [0.08, 0.30] |
| 3.2 Moderate‐to‐high intensity | 5 | 613 | Std. Mean Difference (IV, Random, 95% CI) | 0.29 [‐0.07, 0.65] |
| 4 Overall emotional function/mental health (change values) Show forest plot | 15 | Std. Mean Difference (IV, Random, 95% CI) | Subtotals only | |
| 4.1 Light‐to‐moderate intensity | 10 | 592 | Std. Mean Difference (IV, Random, 95% CI) | 0.41 [0.04, 0.77] |
| 4.2 Moderate‐to‐high intensity | 5 | 987 | Std. Mean Difference (IV, Random, 95% CI) | 0.07 [‐0.07, 0.21] |
| 5 Overall physical function (follow‐up values) Show forest plot | 25 | Std. Mean Difference (IV, Random, 95% CI) | Subtotals only | |
| 5.1 Light‐to‐moderate intensity | 20 | 1466 | Std. Mean Difference (IV, Random, 95% CI) | 0.38 [0.19, 0.58] |
| 5.2 Moderate‐to‐high intensity | 5 | 663 | Std. Mean Difference (IV, Random, 95% CI) | 0.14 [‐0.02, 0.30] |
| 6 Overall physical function (change values) Show forest plot | 13 | Std. Mean Difference (IV, Random, 95% CI) | Subtotals only | |
| 6.1 Light‐to‐moderate intensity | 8 | 449 | Std. Mean Difference (IV, Random, 95% CI) | 0.81 [0.11, 1.51] |
| 6.2 Moderate‐to‐high intensity | 5 | 984 | Std. Mean Difference (IV, Random, 95% CI) | 0.28 [‐0.06, 0.62] |
| 7 Overall role function (follow‐up values) Show forest plot | 18 | Std. Mean Difference (IV, Random, 95% CI) | Subtotals only | |
| 7.1 Light‐to‐moderate intensity | 14 | 883 | Std. Mean Difference (IV, Random, 95% CI) | 0.36 [0.08, 0.64] |
| 7.2 Moderate‐to‐high intensity | 4 | 487 | Std. Mean Difference (IV, Random, 95% CI) | 0.11 [‐0.13, 0.35] |
| 8 Overall role function (change values) Show forest plot | 12 | Std. Mean Difference (IV, Random, 95% CI) | Subtotals only | |
| 8.1 Light‐to‐moderate intensity | 7 | 328 | Std. Mean Difference (IV, Random, 95% CI) | 0.18 [‐0.19, 0.56] |
| 8.2 Moderate‐to‐high intensity | 5 | 987 | Std. Mean Difference (IV, Random, 95% CI) | 0.06 [‐0.09, 0.21] |
| 9 Overall social well‐being/function (follow‐up values) Show forest plot | 18 | Std. Mean Difference (IV, Random, 95% CI) | Subtotals only | |
| 9.1 Light‐to‐moderate intensity | 15 | 1132 | Std. Mean Difference (IV, Random, 95% CI) | 0.23 [0.10, 0.36] |
| 9.2 Moderate‐to‐high intensity | 3 | 425 | Std. Mean Difference (IV, Random, 95% CI) | 0.05 [‐0.16, 0.26] |
| 10 Overall social well‐being/function (change values) Show forest plot | 12 | Std. Mean Difference (IV, Random, 95% CI) | Subtotals only | |
| 10.1 Light‐to‐moderate intensity | 8 | 413 | Std. Mean Difference (IV, Random, 95% CI) | 0.63 [0.21, 1.04] |
| 10.2 Moderate‐to‐high intensity | 4 | 971 | Std. Mean Difference (IV, Random, 95% CI) | 0.33 [‐0.33, 0.98] |
| 11 Overall cognitive function (follow‐up values) Show forest plot | 5 | Std. Mean Difference (IV, Random, 95% CI) | Subtotals only | |
| 11.1 Light‐to‐moderate intensity | 4 | 173 | Std. Mean Difference (IV, Random, 95% CI) | 0.43 [0.11, 0.74] |
| 11.2 Moderate‐to‐high intensity | 1 | 16 | Std. Mean Difference (IV, Random, 95% CI) | 0.16 [‐0.82, 1.14] |
| 12 Overall cognitive function (change values) Show forest plot | 5 | Std. Mean Difference (IV, Random, 95% CI) | Subtotals only | |
| 12.1 Light‐to‐moderate intensity | 3 | 156 | Std. Mean Difference (IV, Random, 95% CI) | 0.17 [‐0.21, 0.55] |
| 12.2 Moderate‐to‐high intensity | 2 | 516 | Std. Mean Difference (IV, Random, 95% CI) | ‐0.17 [‐0.35, 0.00] |
| 13 Overall general health (follow‐up values) Show forest plot | 10 | Std. Mean Difference (IV, Random, 95% CI) | Subtotals only | |
| 13.1 Light‐to‐moderate intensity | 6 | 304 | Std. Mean Difference (IV, Random, 95% CI) | 0.17 [‐0.14, 0.48] |
| 13.2 Moderate‐to‐high intensity | 4 | 184 | Std. Mean Difference (IV, Random, 95% CI) | 0.30 [‐0.35, 0.95] |
| 14 Overall general health (change values) Show forest plot | 9 | Std. Mean Difference (IV, Random, 95% CI) | Subtotals only | |
| 14.1 Light‐to‐moderate intensity | 5 | 254 | Std. Mean Difference (IV, Random, 95% CI) | 0.23 [‐0.02, 0.48] |
| 14.2 Moderate‐to‐high intensity | 4 | 652 | Std. Mean Difference (IV, Random, 95% CI) | 0.20 [‐0.24, 0.64] |
| 15 Overall sexual function (follow‐up values) Show forest plot | 5 | Std. Mean Difference (IV, Fixed, 95% CI) | Subtotals only | |
| 15.1 Light‐to‐moderate intensity | 4 | 293 | Std. Mean Difference (IV, Fixed, 95% CI) | 0.22 [‐0.01, 0.45] |
| 15.2 Moderate‐to‐high intensity | 1 | 118 | Std. Mean Difference (IV, Fixed, 95% CI) | 0.01 [‐0.35, 0.38] |
| 16 Overall sexual function (change values) Show forest plot | 3 | Mean Difference (IV, Random, 95% CI) | Subtotals only | |
| 16.1 Light‐to‐moderate intensity | 2 | 193 | Mean Difference (IV, Random, 95% CI) | 3.83 [‐1.83, 9.48] |
| 16.2 Moderate‐to‐high intensity | 1 | 500 | Mean Difference (IV, Random, 95% CI) | 0.5 [‐3.86, 4.86] |
| 17 Overall anxiety (follow‐up values) Show forest plot | 7 | Std. Mean Difference (IV, Random, 95% CI) | Subtotals only | |
| 17.1 Light‐to‐moderate intensity | 5 | 237 | Std. Mean Difference (IV, Random, 95% CI) | ‐0.56 [‐0.88, ‐0.25] |
| 17.2 Moderate‐to‐high intensity | 2 | 89 | Std. Mean Difference (IV, Random, 95% CI) | ‐1.20 [‐3.49, 1.09] |
| 18 Overall anxiety (change values) Show forest plot | 4 | Std. Mean Difference (IV, Fixed, 95% CI) | Subtotals only | |
| 18.1 Light‐to‐moderate intensity | 3 | 161 | Std. Mean Difference (IV, Fixed, 95% CI) | ‐0.48 [‐0.79, ‐0.16] |
| 18.2 Moderate‐to‐high intensity | 1 | 74 | Std. Mean Difference (IV, Fixed, 95% CI) | ‐0.15 [‐0.61, 0.30] |
| 19 Overall depression (follow‐up values) Show forest plot | 12 | Std. Mean Difference (IV, Random, 95% CI) | Subtotals only | |
| 19.1 Light‐to‐moderate intensity | 9 | 542 | Std. Mean Difference (IV, Random, 95% CI) | ‐0.24 [‐0.53, 0.06] |
| 19.2 Moderate‐to‐high intensity | 3 | 115 | Std. Mean Difference (IV, Random, 95% CI) | ‐0.92 [‐1.95, 0.11] |
| 20 Overall depression (change values) Show forest plot | 6 | Std. Mean Difference (IV, Random, 95% CI) | Subtotals only | |
| 20.1 Light‐to‐moderate intensity | 4 | 182 | Std. Mean Difference (IV, Random, 95% CI) | ‐0.60 [‐0.89, ‐0.30] |
| 20.2 Moderate‐to‐high intensity | 2 | 574 | Std. Mean Difference (IV, Random, 95% CI) | 0.00 [‐0.21, 0.22] |
| 21 Overall fatigue (follow‐up values) Show forest plot | 25 | Std. Mean Difference (IV, Random, 95% CI) | Subtotals only | |
| 21.1 Light‐to‐moderate intensity | 21 | 1155 | Std. Mean Difference (IV, Random, 95% CI) | ‐0.38 [‐0.56, ‐0.19] |
| 21.2 Moderate‐to‐high intensity | 4 | 770 | Std. Mean Difference (IV, Random, 95% CI) | ‐0.13 [‐0.28, 0.03] |
| 22 Overall fatigue (change values) Show forest plot | 12 | Std. Mean Difference (IV, Random, 95% CI) | Subtotals only | |
| 22.1 Light‐to‐moderate intensity | 9 | 420 | Std. Mean Difference (IV, Random, 95% CI) | ‐0.36 [‐0.84, 0.11] |
| 22.2 Moderate‐to‐high intensity | 3 | 851 | Std. Mean Difference (IV, Random, 95% CI) | 0.05 [‐0.14, 0.24] |
| 23 Overall pain/disability (follow‐up values) Show forest plot | 9 | Std. Mean Difference (IV, Random, 95% CI) | Subtotals only | |
| 23.1 Light‐to‐moderate intensity | 5 | 189 | Std. Mean Difference (IV, Random, 95% CI) | 0.13 [‐0.25, 0.50] |
| 23.2 Moderate‐to‐high intensity | 4 | 346 | Std. Mean Difference (IV, Random, 95% CI) | 0.03 [‐0.18, 0.24] |
| 24 Overall pain/disability (change values) Show forest plot | 5 | Std. Mean Difference (IV, Random, 95% CI) | Subtotals only | |
| 24.1 Light‐to‐moderate intensity | 2 | 77 | Std. Mean Difference (IV, Random, 95% CI) | 0.12 [‐0.33, 0.56] |
| 24.2 Moderate‐to‐high intensity | 3 | 219 | Std. Mean Difference (IV, Random, 95% CI) | ‐0.15 [‐0.47, 0.16] |
| 25 Overall self‐esteem/body image (follow‐up values) Show forest plot | 12 | Std. Mean Difference (IV, Random, 95% CI) | Subtotals only | |
| 25.1 Light‐to‐moderate intensity | 8 | 474 | Std. Mean Difference (IV, Random, 95% CI) | 0.35 [0.14, 0.55] |
| 25.2 Moderate‐to‐high intensity | 4 | 193 | Std. Mean Difference (IV, Random, 95% CI) | 0.06 [‐0.45, 0.56] |
| 26 Overall self‐esteem/body image (change values) Show forest plot | 9 | Std. Mean Difference (IV, Random, 95% CI) | Subtotals only | |
| 26.1 Light‐to‐moderate intensity | 6 | 376 | Std. Mean Difference (IV, Random, 95% CI) | 0.52 [‐0.09, 1.13] |
| 26.2 Moderate‐to‐high intensity | 3 | 616 | Std. Mean Difference (IV, Random, 95% CI) | ‐0.05 [‐0.21, 0.10] |
| 27 Overall cardiorespiratory fitness (follow‐up values) Show forest plot | 23 | Std. Mean Difference (IV, Random, 95% CI) | Subtotals only | |
| 27.1 Light‐to‐moderate intensity | 16 | 975 | Std. Mean Difference (IV, Random, 95% CI) | 0.43 [0.27, 0.59] |
| 27.2 Moderate‐to‐high intensity | 7 | 290 | Std. Mean Difference (IV, Random, 95% CI) | 0.46 [0.13, 0.80] |
| 28 Overall cardiorespiratory fitness (change values) Show forest plot | 9 | Std. Mean Difference (IV, Random, 95% CI) | Subtotals only | |
| 28.1 Light‐to‐moderate intensity | 6 | 228 | Std. Mean Difference (IV, Random, 95% CI) | 1.18 [0.60, 1.77] |
| 28.2 Moderate‐to‐high intensity | 4 | 645 | Std. Mean Difference (IV, Random, 95% CI) | 0.57 [0.01, 1.14] |
| 29 Overall self‐reported physical activity (follow‐up values) Show forest plot | 17 | Std. Mean Difference (IV, Random, 95% CI) | Subtotals only | |
| 29.1 Light‐to‐moderate intensity | 11 | 1112 | Std. Mean Difference (IV, Random, 95% CI) | 0.47 [0.23, 0.72] |
| 29.2 Moderate‐to‐high intensity | 6 | 893 | Std. Mean Difference (IV, Random, 95% CI) | 0.65 [0.27, 1.03] |
| 30 Overall self‐reported physical activity (change values) Show forest plot | 8 | Std. Mean Difference (IV, Random, 95% CI) | Subtotals only | |
| 30.1 Light‐to‐moderate intensity | 4 | 249 | Std. Mean Difference (IV, Random, 95% CI) | 0.79 [0.15, 1.44] |
| 30.2 Moderate‐to‐high intensity | 4 | 1025 | Std. Mean Difference (IV, Random, 95% CI) | 0.46 [0.07, 0.85] |
| 31 Overall objective physical activity (follow‐up values) Show forest plot | 12 | Std. Mean Difference (IV, Random, 95% CI) | Subtotals only | |
| 31.1 Light‐to‐moderate intensity | 9 | 574 | Std. Mean Difference (IV, Random, 95% CI) | 0.58 [0.29, 0.87] |
| 31.2 Moderate‐to‐high intensity | 3 | 735 | Std. Mean Difference (IV, Random, 95% CI) | 0.12 [‐0.03, 0.28] |
| 32 Overall objective physical activity (change values) Show forest plot | 5 | Std. Mean Difference (IV, Random, 95% CI) | Subtotals only | |
| 32.1 Light‐to‐moderate intensity | 3 | 103 | Std. Mean Difference (IV, Random, 95% CI) | 1.05 [0.62, 1.47] |
| 32.2 Moderate‐to‐high intensity | 2 | 405 | Std. Mean Difference (IV, Random, 95% CI) | 0.32 [‐0.45, 1.09] |
| 33 Mass (follow‐up values) Show forest plot | 16 | Mean Difference (IV, Fixed, 95% CI) | Subtotals only | |
| 33.1 Light‐to‐moderate intensity | 12 | 1015 | Mean Difference (IV, Fixed, 95% CI) | 0.03 [‐0.56, 0.61] |
| 33.2 Moderate‐to‐high intensity | 4 | 195 | Mean Difference (IV, Fixed, 95% CI) | ‐1.34 [‐5.66, 2.98] |
| 34 Mass (change values) Show forest plot | 11 | Mean Difference (IV, Random, 95% CI) | Subtotals only | |
| 34.1 Light‐to‐moderate intensity | 8 | 418 | Mean Difference (IV, Random, 95% CI) | ‐0.58 [‐1.21, 0.05] |
| 34.2 Moderate‐to‐high intensity | 4 | 639 | Mean Difference (IV, Random, 95% CI) | ‐0.97 [‐2.18, 0.24] |
| 35 BMI (follow‐up values) Show forest plot | 17 | Mean Difference (IV, Fixed, 95% CI) | Subtotals only | |
| 35.1 Light‐to‐moderate intensity | 12 | 930 | Mean Difference (IV, Fixed, 95% CI) | 0.03 [‐0.18, 0.24] |
| 35.2 Moderate‐to‐high intensity | 5 | 551 | Mean Difference (IV, Fixed, 95% CI) | ‐0.35 [‐1.40, 0.69] |
| 36 BMI (change values) Show forest plot | 8 | Mean Difference (IV, Random, 95% CI) | Subtotals only | |
| 36.1 Light‐to‐moderate intensity | 7 | 403 | Mean Difference (IV, Random, 95% CI) | ‐0.23 [‐0.50, 0.05] |
| 36.2 Moderate‐to‐high intensity | 1 | 82 | Mean Difference (IV, Random, 95% CI) | ‐0.2 [‐0.57, 0.17] |
| 37 Overall body fat (follow‐up values) Show forest plot | 18 | Std. Mean Difference (IV, Random, 95% CI) | Subtotals only | |
| 37.1 Light‐to‐moderate intensity | 13 | 886 | Std. Mean Difference (IV, Random, 95% CI) | ‐0.24 [‐0.44, ‐0.04] |
| 37.2 Moderate‐to‐high intensity | 5 | 276 | Std. Mean Difference (IV, Random, 95% CI) | ‐0.03 [‐0.27, 0.21] |
| 38 Overall body fat (change values) Show forest plot | 9 | Std. Mean Difference (IV, Random, 95% CI) | Subtotals only | |
| 38.1 Light‐to‐moderate intensity | 7 | 375 | Std. Mean Difference (IV, Random, 95% CI) | ‐0.68 [‐1.44, 0.09] |
| 38.2 Moderate‐to‐high intensity | 2 | 124 | Std. Mean Difference (IV, Random, 95% CI) | ‐0.39 [‐0.76, ‐0.02] |
| 39 Lower body strength (follow‐up values) Show forest plot | 10 | Std. Mean Difference (IV, Random, 95% CI) | Subtotals only | |
| 39.1 Light‐to‐moderate intensity | 7 | 480 | Std. Mean Difference (IV, Random, 95% CI) | 0.69 [0.34, 1.04] |
| 39.2 Moderate‐to‐high intensity | 3 | 157 | Std. Mean Difference (IV, Random, 95% CI) | ‐0.10 [‐0.42, 0.21] |
| 40 Lower body strength (change values) Show forest plot | 8 | Std. Mean Difference (IV, Random, 95% CI) | Subtotals only | |
| 40.1 Light‐to‐moderate intensity | 5 | 331 | Std. Mean Difference (IV, Random, 95% CI) | 0.87 [0.64, 1.09] |
| 40.2 Moderate‐to‐high intensity | 4 | 399 | Std. Mean Difference (IV, Random, 95% CI) | 0.62 [0.07, 1.17] |
| 41 Upper body strength (follow‐up values) Show forest plot | 13 | Std. Mean Difference (IV, Random, 95% CI) | Subtotals only | |
| 41.1 Light‐to‐moderate intensity | 7 | 481 | Std. Mean Difference (IV, Random, 95% CI) | 0.43 [‐0.11, 0.96] |
| 41.2 Moderate‐to‐high intensity | 6 | 287 | Std. Mean Difference (IV, Random, 95% CI) | 0.41 [‐0.05, 0.87] |
| 42 Upper body strength (change values) Show forest plot | 8 | Std. Mean Difference (IV, Random, 95% CI) | Subtotals only | |
| 42.1 Light‐to‐moderate intensity | 3 | 360 | Std. Mean Difference (IV, Random, 95% CI) | 1.32 [0.47, 2.16] |
| 42.2 Moderate‐to‐high intensity | 5 | 472 | Std. Mean Difference (IV, Random, 95% CI) | 0.37 [‐0.05, 0.79] |
| 43 Bone mineral density ‐ femoral neck (follow‐up and change values) Show forest plot | 4 | Std. Mean Difference (IV, Random, 95% CI) | Subtotals only | |
| 43.1 Light‐to‐moderate intensity | 2 | 106 | Std. Mean Difference (IV, Random, 95% CI) | ‐0.08 [‐0.54, 0.37] |
| 43.2 Moderate‐to‐high intensity | 2 | 680 | Std. Mean Difference (IV, Random, 95% CI) | 0.39 [‐0.04, 0.83] |
| 44 Bone mineral density ‐ lumbar spine (follow‐up and change values) Show forest plot | 4 | Std. Mean Difference (IV, Random, 95% CI) | Subtotals only | |
| 44.1 Light‐to‐moderate intensity | 2 | 106 | Std. Mean Difference (IV, Random, 95% CI) | 0.06 [‐0.48, 0.60] |
| 44.2 Moderate‐to‐high intensity | 2 | 680 | Std. Mean Difference (IV, Random, 95% CI) | 0.31 [‐0.14, 0.75] |
| 45 Bone mineral density ‐ total hip (follow‐up and change values) Show forest plot | 3 | Std. Mean Difference (IV, Random, 95% CI) | Subtotals only | |
| 45.1 Light‐to‐moderate intensity | 2 | 106 | Std. Mean Difference (IV, Random, 95% CI) | 5.19 [‐4.76, 15.14] |
| 45.2 Moderate‐to‐high intensity | 1 | 223 | Std. Mean Difference (IV, Random, 95% CI) | 1.05 [0.77, 1.33] |
| Outcome or subgroup title | No. of studies | No. of participants | Statistical method | Effect size |
| 1 Overall HRQoL (follow‐up values) Show forest plot | 22 | Std. Mean Difference (IV, Random, 95% CI) | Subtotals only | |
| 1.1 12 weeks or less | 16 | 1404 | Std. Mean Difference (IV, Random, 95% CI) | 0.45 [0.19, 0.70] |
| 1.2 More than 12 weeks | 6 | 399 | Std. Mean Difference (IV, Random, 95% CI) | 0.38 [0.10, 0.65] |
| 2 Overall HRQoL (change values) Show forest plot | 14 | Std. Mean Difference (IV, Random, 95% CI) | Subtotals only | |
| 2.1 12 weeks or less | 11 | 828 | Std. Mean Difference (IV, Random, 95% CI) | 0.99 [0.45, 1.52] |
| 2.2 More than 12 weeks | 3 | 631 | Std. Mean Difference (IV, Random, 95% CI) | 0.27 [‐0.21, 0.76] |
| 3 Overall emotional function/mental health (follow‐up values) Show forest plot | 26 | Std. Mean Difference (IV, Random, 95% CI) | Subtotals only | |
| 3.1 12 weeks or less | 20 | 1557 | Std. Mean Difference (IV, Random, 95% CI) | 0.26 [0.12, 0.39] |
| 3.2 More than 12 weeks | 6 | 545 | Std. Mean Difference (IV, Random, 95% CI) | 0.06 [‐0.11, 0.23] |
| 4 Overall emotional function/mental health (change values) Show forest plot | 15 | Std. Mean Difference (IV, Random, 95% CI) | Subtotals only | |
| 4.1 12 weeks or less | 10 | 754 | Std. Mean Difference (IV, Random, 95% CI) | 0.39 [0.03, 0.76] |
| 4.2 More than 12 weeks | 5 | 825 | Std. Mean Difference (IV, Random, 95% CI) | 0.19 [‐0.05, 0.43] |
| 5 Overall physical function (follow‐up values) Show forest plot | 25 | Std. Mean Difference (IV, Random, 95% CI) | Subtotals only | |
| 5.1 12 weeks or less | 18 | 1523 | Std. Mean Difference (IV, Random, 95% CI) | 0.37 [0.17, 0.58] |
| 5.2 More than 12 weeks | 7 | 606 | Std. Mean Difference (IV, Random, 95% CI) | 0.24 [0.08, 0.40] |
| 6 Overall physical function (change values) Show forest plot | 13 | Std. Mean Difference (IV, Random, 95% CI) | Subtotals only | |
| 6.1 12 weeks or less | 8 | 608 | Std. Mean Difference (IV, Random, 95% CI) | 0.97 [0.27, 1.66] |
| 6.2 More than 12 weeks | 5 | 825 | Std. Mean Difference (IV, Random, 95% CI) | 0.15 [‐0.16, 0.45] |
| 7 Overall role function (follow‐up values) Show forest plot | 18 | Std. Mean Difference (IV, Random, 95% CI) | Subtotals only | |
| 7.1 12 weeks or less | 13 | 1057 | Std. Mean Difference (IV, Random, 95% CI) | 0.30 [‐0.01, 0.60] |
| 7.2 More than 12 weeks | 5 | 313 | Std. Mean Difference (IV, Random, 95% CI) | 0.27 [0.04, 0.49] |
| 8 Overall role function (change values) Show forest plot | 12 | Std. Mean Difference (IV, Random, 95% CI) | Subtotals only | |
| 8.1 12 weeks or less | 8 | 610 | Std. Mean Difference (IV, Random, 95% CI) | 0.24 [‐0.06, 0.55] |
| 8.2 More than 12 weeks | 4 | 705 | Std. Mean Difference (IV, Random, 95% CI) | ‐0.03 [‐0.18, 0.11] |
| 9 Overall social well‐being/function (follow‐up values) Show forest plot | 18 | Std. Mean Difference (IV, Random, 95% CI) | Subtotals only | |
| 9.1 12 weeks or less | 13 | 1202 | Std. Mean Difference (IV, Random, 95% CI) | 0.23 [0.06, 0.39] |
| 9.2 More than 12 weeks | 5 | 355 | Std. Mean Difference (IV, Random, 95% CI) | 0.15 [‐0.05, 0.36] |
| 10 Overall social well‐being/function (change values) Show forest plot | 12 | Std. Mean Difference (IV, Random, 95% CI) | Subtotals only | |
| 10.1 12 weeks or less | 8 | 637 | Std. Mean Difference (IV, Random, 95% CI) | 0.73 [0.35, 1.11] |
| 10.2 More than 12 weeks | 4 | 747 | Std. Mean Difference (IV, Random, 95% CI) | 0.11 [‐0.19, 0.42] |
| 11 Overall cognitive function (follow‐up values) Show forest plot | 5 | Std. Mean Difference (IV, Random, 95% CI) | Subtotals only | |
| 11.1 12 weeks or less | 5 | 189 | Std. Mean Difference (IV, Random, 95% CI) | 0.40 [0.11, 0.69] |
| 11.2 More than 12 weeks | 0 | 0 | Std. Mean Difference (IV, Random, 95% CI) | 0.0 [0.0, 0.0] |
| 12 Overall cognitive function (change values) Show forest plot | 5 | Std. Mean Difference (IV, Random, 95% CI) | Subtotals only | |
| 12.1 12 weeks or less | 4 | 172 | Std. Mean Difference (IV, Random, 95% CI) | 0.14 [‐0.17, 0.44] |
| 12.2 More than 12 weeks | 1 | 500 | Std. Mean Difference (IV, Random, 95% CI) | ‐0.17 [‐0.35, 0.00] |
| 13 Overall general health (follow‐up values) Show forest plot | 9 | Std. Mean Difference (IV, Random, 95% CI) | Subtotals only | |
| 13.1 12 weeks or less | 6 | 252 | Std. Mean Difference (IV, Random, 95% CI) | 0.17 [‐0.16, 0.50] |
| 13.2 More than 12 weeks | 3 | 204 | Std. Mean Difference (IV, Random, 95% CI) | 0.21 [‐0.32, 0.75] |
| 14 Overall general health (change values) Show forest plot | 9 | Std. Mean Difference (IV, Random, 95% CI) | Subtotals only | |
| 14.1 12 weeks or less | 6 | 253 | Std. Mean Difference (IV, Random, 95% CI) | 0.29 [‐0.09, 0.67] |
| 14.2 More than 12 weeks | 3 | 653 | Std. Mean Difference (IV, Random, 95% CI) | 0.01 [‐0.20, 0.22] |
| 15 Overall sexual function (follow‐up values) Show forest plot | 5 | Std. Mean Difference (IV, Fixed, 95% CI) | Subtotals only | |
| 15.1 12 weeks or less | 3 | 218 | Std. Mean Difference (IV, Fixed, 95% CI) | 0.11 [‐0.16, 0.38] |
| 15.2 More than 12 weeks | 2 | 193 | Std. Mean Difference (IV, Fixed, 95% CI) | 0.21 [‐0.07, 0.49] |
| 16 Overall sexual function (change values) Show forest plot | 3 | Mean Difference (IV, Random, 95% CI) | Subtotals only | |
| 16.1 12 weeks or less | 0 | 0 | Mean Difference (IV, Random, 95% CI) | 0.0 [0.0, 0.0] |
| 16.2 More than 12 weeks | 3 | 693 | Mean Difference (IV, Random, 95% CI) | 2.44 [‐0.76, 5.64] |
| 17 Overall sleep (follow‐up values) Show forest plot | 5 | Std. Mean Difference (IV, Fixed, 95% CI) | Subtotals only | |
| 17.1 12 weeks or less | 5 | 188 | Std. Mean Difference (IV, Fixed, 95% CI) | ‐0.09 [‐0.37, 0.20] |
| 17.2 More than 12 weeks | 0 | 0 | Std. Mean Difference (IV, Fixed, 95% CI) | 0.0 [0.0, 0.0] |
| 18 Overall sleep (change values) Show forest plot | 3 | Std. Mean Difference (IV, Random, 95% CI) | Subtotals only | |
| 18.1 12 weeks or less | 3 | 136 | Std. Mean Difference (IV, Random, 95% CI) | 0.14 [‐0.20, 0.48] |
| 18.2 More than 12 weeks | 0 | 0 | Std. Mean Difference (IV, Random, 95% CI) | 0.0 [0.0, 0.0] |
| 19 Overall anxiety (follow‐up values) Show forest plot | 7 | Std. Mean Difference (IV, Random, 95% CI) | Subtotals only | |
| 19.1 12 weeks or less | 6 | 252 | Std. Mean Difference (IV, Random, 95% CI) | ‐0.67 [‐1.09, ‐0.25] |
| 19.2 More than 12 weeks | 1 | 74 | Std. Mean Difference (IV, Random, 95% CI) | ‐0.14 [‐0.60, 0.31] |
| 20 Overall anxiety (change values) Show forest plot | 4 | Std. Mean Difference (IV, Fixed, 95% CI) | Subtotals only | |
| 20.1 12 weeks or less | 3 | 161 | Std. Mean Difference (IV, Fixed, 95% CI) | ‐0.48 [‐0.79, ‐0.16] |
| 20.2 More than 12 weeks | 1 | 74 | Std. Mean Difference (IV, Fixed, 95% CI) | ‐0.15 [‐0.61, 0.30] |
| 21 Overall depression (follow‐up values) Show forest plot | 12 | Std. Mean Difference (IV, Random, 95% CI) | Subtotals only | |
| 21.1 12 weeks or less | 9 | 537 | Std. Mean Difference (IV, Random, 95% CI) | ‐0.36 [‐0.70, ‐0.01] |
| 21.2 More than 12 weeks | 3 | 120 | Std. Mean Difference (IV, Random, 95% CI) | ‐0.30 [‐0.90, 0.30] |
| 22 Overall depression (change values) Show forest plot | 6 | Std. Mean Difference (IV, Random, 95% CI) | Subtotals only | |
| 22.1 12 weeks or less | 4 | 182 | Std. Mean Difference (IV, Random, 95% CI) | ‐0.60 [‐0.89, ‐0.30] |
| 22.2 More than 12 weeks | 2 | 574 | Std. Mean Difference (IV, Random, 95% CI) | 0.00 [‐0.21, 0.22] |
| 23 Overall fatigue (follow‐up values) Show forest plot | 25 | Std. Mean Difference (IV, Random, 95% CI) | Subtotals only | |
| 23.1 12 weeks or less | 20 | 1657 | Std. Mean Difference (IV, Random, 95% CI) | ‐0.42 [‐0.59, ‐0.25] |
| 23.2 More than 12 weeks | 5 | 268 | Std. Mean Difference (IV, Random, 95% CI) | 0.02 [‐0.22, 0.26] |
| 24 Overall fatigue (change values) Show forest plot | 12 | Std. Mean Difference (IV, Random, 95% CI) | Subtotals only | |
| 24.1 12 weeks or less | 10 | 719 | Std. Mean Difference (IV, Random, 95% CI) | ‐0.44 [‐0.83, ‐0.05] |
| 24.2 More than 12 weeks | 2 | 552 | Std. Mean Difference (IV, Random, 95% CI) | 0.36 [‐0.43, 1.15] |
| 25 Overall pain/disability (follow‐up values) Show forest plot | 9 | Std. Mean Difference (IV, Random, 95% CI) | Subtotals only | |
| 25.1 12 weeks or less | 6 | 376 | Std. Mean Difference (IV, Random, 95% CI) | 0.03 [‐0.17, 0.23] |
| 25.2 More than 12 weeks | 3 | 159 | Std. Mean Difference (IV, Random, 95% CI) | 0.21 [‐0.27, 0.70] |
| 26 Overall pain/disability (change values) Show forest plot | 5 | Std. Mean Difference (IV, Random, 95% CI) | Subtotals only | |
| 26.1 12 weeks or less | 3 | 139 | Std. Mean Difference (IV, Random, 95% CI) | 0.16 [‐0.19, 0.50] |
| 26.2 More than 12 weeks | 2 | 157 | Std. Mean Difference (IV, Random, 95% CI) | ‐0.29 [‐0.61, 0.02] |
| 27 Overall self‐esteem/body image (follow‐up values) Show forest plot | 12 | Std. Mean Difference (IV, Random, 95% CI) | Subtotals only | |
| 27.1 12 weeks or less | 9 | 419 | Std. Mean Difference (IV, Random, 95% CI) | 0.36 [0.07, 0.66] |
| 27.2 More than 12 weeks | 3 | 248 | Std. Mean Difference (IV, Random, 95% CI) | 0.08 [‐0.17, 0.33] |
| 28 Overall self‐esteem/body image (change values) Show forest plot | 9 | Std. Mean Difference (IV, Random, 95% CI) | Subtotals only | |
| 28.1 12 weeks or less | 5 | 244 | Std. Mean Difference (IV, Random, 95% CI) | 0.54 [‐0.10, 1.18] |
| 28.2 More than 12 weeks | 4 | 748 | Std. Mean Difference (IV, Random, 95% CI) | 0.01 [‐0.37, 0.39] |
| 29 Overall cardiorespiratory fitness (follow‐up values) Show forest plot | 23 | Std. Mean Difference (IV, Random, 95% CI) | Subtotals only | |
| 29.1 12 weeks or less | 15 | 923 | Std. Mean Difference (IV, Random, 95% CI) | 0.35 [0.20, 0.49] |
| 29.2 More than 12 weeks | 8 | 342 | Std. Mean Difference (IV, Random, 95% CI) | 0.67 [0.40, 0.94] |
| 30 Overall cardiorespiratory fitness (change values) Show forest plot | 9 | Std. Mean Difference (IV, Random, 95% CI) | Subtotals only | |
| 30.1 12 weeks or less | 6 | 232 | Std. Mean Difference (IV, Random, 95% CI) | 0.91 [0.31, 1.52] |
| 30.2 More than 12 weeks | 3 | 631 | Std. Mean Difference (IV, Random, 95% CI) | 0.76 [0.02, 1.51] |
| 31 Overall self‐reported physical activity (follow‐up values) Show forest plot | 18 | Std. Mean Difference (IV, Random, 95% CI) | Subtotals only | |
| 31.1 12 weeks or less | 11 | 1401 | Std. Mean Difference (IV, Random, 95% CI) | 0.60 [0.36, 0.84] |
| 31.2 More than 12 weeks | 7 | 643 | Std. Mean Difference (IV, Random, 95% CI) | 0.41 [0.09, 0.74] |
| 32 Overall self‐reported physical activity (change values) Show forest plot | 8 | Std. Mean Difference (IV, Random, 95% CI) | Subtotals only | |
| 32.1 12 weeks or less | 4 | 521 | Std. Mean Difference (IV, Random, 95% CI) | 0.78 [0.20, 1.36] |
| 32.2 More than 12 weeks | 4 | 753 | Std. Mean Difference (IV, Random, 95% CI) | 0.46 [‐0.01, 0.92] |
| 33 Overall objective physical activity (follow‐up values) Show forest plot | 11 | Std. Mean Difference (IV, Random, 95% CI) | Subtotals only | |
| 33.1 12 weeks or less | 10 | 1203 | Std. Mean Difference (IV, Random, 95% CI) | 0.44 [0.18, 0.70] |
| 33.2 More than 12 weeks | 1 | 67 | Std. Mean Difference (IV, Random, 95% CI) | 0.38 [‐0.11, 0.86] |
| 34 Overall objective physical activity (change values) Show forest plot | 5 | Std. Mean Difference (IV, Random, 95% CI) | Subtotals only | |
| 34.1 12 weeks or less | 4 | 441 | Std. Mean Difference (IV, Random, 95% CI) | 0.72 [‐0.02, 1.46] |
| 34.2 More than 12 weeks | 1 | 67 | Std. Mean Difference (IV, Random, 95% CI) | 0.75 [0.25, 1.24] |
| 35 Mass (follow‐up values) Show forest plot | 16 | Mean Difference (IV, Fixed, 95% CI) | Subtotals only | |
| 35.1 12 weeks or less | 7 | 451 | Mean Difference (IV, Fixed, 95% CI) | ‐0.10 [‐0.85, 0.65] |
| 35.2 More than 12 weeks | 9 | 759 | Mean Difference (IV, Fixed, 95% CI) | 0.14 [‐0.76, 1.05] |
| 36 Mass (change values) Show forest plot | 11 | Mean Difference (IV, Random, 95% CI) | Subtotals only | |
| 36.1 12 weeks or less | 5 | 171 | Mean Difference (IV, Random, 95% CI) | ‐0.82 [‐1.81, 0.17] |
| 36.2 More than 12 weeks | 6 | 876 | Mean Difference (IV, Random, 95% CI) | ‐0.25 [‐0.73, 0.24] |
| 37 BMI (follow‐up values) Show forest plot | 17 | Mean Difference (IV, Fixed, 95% CI) | Subtotals only | |
| 37.1 12 weeks or less | 9 | 819 | Mean Difference (IV, Fixed, 95% CI) | ‐0.07 [‐0.35, 0.20] |
| 37.2 More than 12 weeks | 8 | 662 | Mean Difference (IV, Fixed, 95% CI) | 0.13 [‐0.18, 0.43] |
| 38 BMI (change values) Show forest plot | 8 | Mean Difference (IV, Random, 95% CI) | Subtotals only | |
| 38.1 12 weeks or less | 4 | 144 | Mean Difference (IV, Random, 95% CI) | ‐0.27 [‐0.76, 0.22] |
| 38.2 More than 12 weeks | 4 | 341 | Mean Difference (IV, Random, 95% CI) | ‐0.08 [‐0.22, 0.07] |
| 39 Overall body fat (follow‐up values) Show forest plot | 18 | Std. Mean Difference (IV, Random, 95% CI) | Subtotals only | |
| 39.1 12 weeks or less | 9 | 402 | Std. Mean Difference (IV, Random, 95% CI) | ‐0.16 [‐0.37, 0.04] |
| 39.2 More than 12 weeks | 9 | 760 | Std. Mean Difference (IV, Random, 95% CI) | ‐0.20 [‐0.45, 0.05] |
| 40 Overall body fat (change values) Show forest plot | 9 | Std. Mean Difference (IV, Random, 95% CI) | Subtotals only | |
| 40.1 12 weeks or less | 5 | 160 | Std. Mean Difference (IV, Random, 95% CI) | ‐0.36 [‐0.68, ‐0.04] |
| 40.2 More than 12 weeks | 4 | 339 | Std. Mean Difference (IV, Random, 95% CI) | ‐0.94 [‐2.07, 0.18] |
| 41 Lower body strength (follow‐up values) Show forest plot | 10 | Std. Mean Difference (IV, Random, 95% CI) | Subtotals only | |
| 41.1 12 weeks or less | 5 | 206 | Std. Mean Difference (IV, Random, 95% CI) | 0.15 [‐0.19, 0.50] |
| 41.2 More than 12 weeks | 5 | 431 | Std. Mean Difference (IV, Random, 95% CI) | 0.72 [0.20, 1.24] |
| 42 Lower body strength (change values) Show forest plot | 8 | Std. Mean Difference (IV, Random, 95% CI) | Subtotals only | |
| 42.1 12 weeks or less | 5 | 220 | Std. Mean Difference (IV, Random, 95% CI) | 0.71 [0.06, 1.37] |
| 42.2 More than 12 weeks | 3 | 500 | Std. Mean Difference (IV, Random, 95% CI) | 0.76 [0.36, 1.17] |
| 43 Upper body strength (follow‐up values) Show forest plot | 13 | Std. Mean Difference (IV, Random, 95% CI) | Subtotals only | |
| 43.1 12 weeks or less | 6 | 249 | Std. Mean Difference (IV, Random, 95% CI) | 0.15 [‐0.32, 0.62] |
| 43.2 More than 12 weeks | 7 | 519 | Std. Mean Difference (IV, Random, 95% CI) | 0.64 [0.24, 1.04] |
| 44 Upper body strength (change values) Show forest plot | 8 | Std. Mean Difference (IV, Random, 95% CI) | Subtotals only | |
| 44.1 12 weeks or less | 4 | 249 | Std. Mean Difference (IV, Random, 95% CI) | 0.72 [‐0.06, 1.50] |
| 44.2 More than 12 weeks | 4 | 583 | Std. Mean Difference (IV, Random, 95% CI) | 0.71 [0.17, 1.25] |
| Outcome or subgroup title | No. of studies | No. of participants | Statistical method | Effect size |
| 1 Overall HRQoL (follow‐up values) Show forest plot | 21 | Std. Mean Difference (IV, Random, 95% CI) | Subtotals only | |
| 1.1 Group format | 5 | 214 | Std. Mean Difference (IV, Random, 95% CI) | 0.99 [0.22, 1.75] |
| 1.2 Individual format | 10 | 1137 | Std. Mean Difference (IV, Random, 95% CI) | 0.21 [0.03, 0.38] |
| 1.3 Both group and individual formats | 6 | 390 | Std. Mean Difference (IV, Random, 95% CI) | 0.33 [0.04, 0.62] |
| 2 Overall HRQoL (change values) Show forest plot | 14 | Std. Mean Difference (IV, Random, 95% CI) | Subtotals only | |
| 2.1 Group format | 5 | 198 | Std. Mean Difference (IV, Random, 95% CI) | 1.88 [0.19, 3.56] |
| 2.2 Individual format | 6 | 649 | Std. Mean Difference (IV, Random, 95% CI) | 0.43 [0.25, 0.61] |
| 2.3 Both group and individual formats | 3 | 612 | Std. Mean Difference (IV, Random, 95% CI) | 0.06 [‐0.22, 0.33] |
| 3 Overall emotional function/mental health (follow‐up values) Show forest plot | 26 | Std. Mean Difference (IV, Random, 95% CI) | Subtotals only | |
| 3.1 Group format | 10 | 649 | Std. Mean Difference (IV, Random, 95% CI) | 0.28 [0.07, 0.49] |
| 3.2 Individual format | 10 | 923 | Std. Mean Difference (IV, Random, 95% CI) | 0.16 [0.02, 0.30] |
| 3.3 Both group and individual formats | 6 | 500 | Std. Mean Difference (IV, Random, 95% CI) | 0.10 [‐0.09, 0.29] |
| 4 Overall emotional function/mental health (change values) Show forest plot | 15 | Std. Mean Difference (IV, Random, 95% CI) | Subtotals only | |
| 4.1 Group format | 7 | 398 | Std. Mean Difference (IV, Random, 95% CI) | 0.42 [‐0.14, 0.99] |
| 4.2 Individual format | 5 | 569 | Std. Mean Difference (IV, Random, 95% CI) | 0.26 [0.08, 0.44] |
| 4.3 Both group and individual formats | 3 | 612 | Std. Mean Difference (IV, Random, 95% CI) | 0.09 [‐0.16, 0.34] |
| 5 Overall physical function (follow‐up values) Show forest plot | 24 | Std. Mean Difference (IV, Random, 95% CI) | Subtotals only | |
| 5.1 Group format | 9 | 588 | Std. Mean Difference (IV, Random, 95% CI) | 0.53 [0.12, 0.94] |
| 5.2 Individual format | 9 | 941 | Std. Mean Difference (IV, Random, 95% CI) | 0.28 [0.12, 0.45] |
| 5.3 Both group and individual formats | 6 | 538 | Std. Mean Difference (IV, Random, 95% CI) | 0.18 [‐0.06, 0.42] |
| 6 Overall physical function (change values) Show forest plot | 13 | Std. Mean Difference (IV, Random, 95% CI) | Subtotals only | |
| 6.1 Group format | 6 | 337 | Std. Mean Difference (IV, Random, 95% CI) | 1.25 [0.29, 2.21] |
| 6.2 Individual format | 3 | 432 | Std. Mean Difference (IV, Random, 95% CI) | 0.20 [‐0.01, 0.41] |
| 6.3 Both group and individual formats | 4 | 664 | Std. Mean Difference (IV, Random, 95% CI) | 0.19 [‐0.25, 0.63] |
| 7 Overall role function (follow‐up values) Show forest plot | 18 | Std. Mean Difference (IV, Random, 95% CI) | Subtotals only | |
| 7.1 Group format | 6 | 225 | Std. Mean Difference (IV, Random, 95% CI) | 0.52 [‐0.27, 1.30] |
| 7.2 Individual format | 7 | 689 | Std. Mean Difference (IV, Random, 95% CI) | 0.23 [0.07, 0.40] |
| 7.3 Both group and individual formats | 5 | 426 | Std. Mean Difference (IV, Random, 95% CI) | 0.15 [‐0.15, 0.45] |
| 8 Overall role function (change values) Show forest plot | 12 | Std. Mean Difference (IV, Random, 95% CI) | Subtotals only | |
| 8.1 Group format | 5 | 216 | Std. Mean Difference (IV, Random, 95% CI) | 0.36 [‐0.14, 0.85] |
| 8.2 Individual format | 4 | 487 | Std. Mean Difference (IV, Random, 95% CI) | 0.13 [‐0.07, 0.32] |
| 8.3 Both group and individual formats | 3 | 612 | Std. Mean Difference (IV, Random, 95% CI) | ‐0.06 [‐0.22, 0.10] |
| 9 Overall social well‐being/function (follow‐up values) Show forest plot | 18 | Std. Mean Difference (IV, Random, 95% CI) | Subtotals only | |
| 9.1 Group format | 7 | 348 | Std. Mean Difference (IV, Random, 95% CI) | 0.22 [0.00, 0.45] |
| 9.2 Individual format | 5 | 546 | Std. Mean Difference (IV, Random, 95% CI) | 0.27 [‐0.07, 0.61] |
| 9.3 Both group and individual formats | 6 | 663 | Std. Mean Difference (IV, Random, 95% CI) | 0.16 [0.01, 0.32] |
| 10 Overall social well‐being/function (change values) Show forest plot | 12 | Std. Mean Difference (IV, Random, 95% CI) | Subtotals only | |
| 10.1 Group format | 5 | 322 | Std. Mean Difference (IV, Random, 95% CI) | 0.57 [‐0.06, 1.19] |
| 10.2 Individual format | 4 | 450 | Std. Mean Difference (IV, Random, 95% CI) | 0.72 [0.38, 1.06] |
| 10.3 Both group and individual formats | 3 | 612 | Std. Mean Difference (IV, Random, 95% CI) | 0.27 [‐0.31, 0.85] |
| 11 Overall cognitive function (follow‐up values) Show forest plot | 5 | Std. Mean Difference (IV, Random, 95% CI) | Subtotals only | |
| 11.1 Group format | 3 | 134 | Std. Mean Difference (IV, Random, 95% CI) | 0.32 [‐0.02, 0.66] |
| 11.2 Individual format | 1 | 18 | Std. Mean Difference (IV, Random, 95% CI) | 1.14 [0.07, 2.20] |
| 11.3 Both group and individual formats | 1 | 37 | Std. Mean Difference (IV, Random, 95% CI) | 0.42 [‐0.24, 1.07] |
| 12 Overall cognitive function (change values) Show forest plot | 5 | Std. Mean Difference (IV, Random, 95% CI) | Subtotals only | |
| 12.1 Group format | 3 | 134 | Std. Mean Difference (IV, Random, 95% CI) | 0.06 [‐0.31, 0.43] |
| 12.2 Individual format | 0 | 0 | Std. Mean Difference (IV, Random, 95% CI) | 0.0 [0.0, 0.0] |
| 12.3 Both group and individual formats | 2 | 538 | Std. Mean Difference (IV, Random, 95% CI) | 0.03 [‐0.51, 0.57] |
| 13 Overall general health (follow‐up values) Show forest plot | 9 | Std. Mean Difference (IV, Random, 95% CI) | Subtotals only | |
| 13.1 Group format | 3 | 92 | Std. Mean Difference (IV, Random, 95% CI) | 0.38 [‐0.31, 1.07] |
| 13.2 Individual format | 4 | 222 | Std. Mean Difference (IV, Random, 95% CI) | 0.34 [‐0.08, 0.76] |
| 13.3 Both group and individual formats | 2 | 112 | Std. Mean Difference (IV, Random, 95% CI) | ‐0.26 [‐0.64, 0.11] |
| 14 Overall general health (change values) Show forest plot | 9 | Std. Mean Difference (IV, Random, 95% CI) | Subtotals only | |
| 14.1 Group format | 4 | 155 | Std. Mean Difference (IV, Random, 95% CI) | 0.35 [‐0.25, 0.95] |
| 14.2 Individual format | 2 | 139 | Std. Mean Difference (IV, Random, 95% CI) | 0.38 [0.04, 0.73] |
| 14.3 Both group and individual formats | 3 | 612 | Std. Mean Difference (IV, Random, 95% CI) | ‐0.07 [‐0.23, 0.09] |
| 15 Overall sexual function (follow‐up values) Show forest plot | 5 | Std. Mean Difference (IV, Fixed, 95% CI) | Subtotals only | |
| 15.1 Group format | 1 | 114 | Std. Mean Difference (IV, Fixed, 95% CI) | 0.14 [‐0.23, 0.51] |
| 15.2 Individual format | 4 | 297 | Std. Mean Difference (IV, Fixed, 95% CI) | 0.17 [‐0.06, 0.40] |
| 15.3 Both group and individual formats | 0 | 0 | Std. Mean Difference (IV, Fixed, 95% CI) | 0.0 [0.0, 0.0] |
| 16 Overall sleep (follow‐up values) Show forest plot | 5 | Std. Mean Difference (IV, Fixed, 95% CI) | Subtotals only | |
| 16.1 Group format | 2 | 88 | Std. Mean Difference (IV, Fixed, 95% CI) | ‐0.26 [‐0.68, 0.16] |
| 16.2 Individual format | 2 | 62 | Std. Mean Difference (IV, Fixed, 95% CI) | ‐0.07 [‐0.57, 0.43] |
| 16.3 Both group and individual formats | 1 | 38 | Std. Mean Difference (IV, Fixed, 95% CI) | 0.28 [‐0.36, 0.92] |
| 17 Overall anxiety (follow‐up values) Show forest plot | 6 | Std. Mean Difference (IV, Random, 95% CI) | Subtotals only | |
| 17.1 Group format | 3 | 177 | Std. Mean Difference (IV, Random, 95% CI) | ‐0.73 [‐1.03, ‐0.42] |
| 17.2 Individual format | 2 | 60 | Std. Mean Difference (IV, Random, 95% CI) | ‐0.13 [‐0.64, 0.39] |
| 17.3 Both group and individual formats | 1 | 74 | Std. Mean Difference (IV, Random, 95% CI) | ‐0.14 [‐0.60, 0.31] |
| 18 Overall anxiety (change values) Show forest plot | 4 | Std. Mean Difference (IV, Fixed, 95% CI) | Subtotals only | |
| 18.1 Group format | 2 | 119 | Std. Mean Difference (IV, Fixed, 95% CI) | ‐0.52 [‐0.88, ‐0.15] |
| 18.2 Individual format | 1 | 42 | Std. Mean Difference (IV, Fixed, 95% CI) | ‐0.37 [‐0.99, 0.24] |
| 18.3 Both group and individual formats | 1 | 74 | Std. Mean Difference (IV, Fixed, 95% CI) | ‐0.15 [‐0.61, 0.30] |
| 19 Overall depression (change values) Show forest plot | 7 | Std. Mean Difference (IV, Random, 95% CI) | Subtotals only | |
| 19.1 Group format | 2 | 119 | Std. Mean Difference (IV, Random, 95% CI) | ‐0.54 [‐0.91, ‐0.18] |
| 19.2 Individual format | 3 | 123 | Std. Mean Difference (IV, Random, 95% CI) | ‐0.51 [‐1.03, 0.01] |
| 19.3 Both group and individual formats | 2 | 574 | Std. Mean Difference (IV, Random, 95% CI) | 0.00 [‐0.21, 0.22] |
| 20 Overall depression (follow‐up values) Show forest plot | 11 | Std. Mean Difference (IV, Random, 95% CI) | Subtotals only | |
| 20.1 Group format | 4 | 176 | Std. Mean Difference (IV, Random, 95% CI) | ‐0.68 [‐0.98, ‐0.37] |
| 20.2 Individual format | 5 | 206 | Std. Mean Difference (IV, Random, 95% CI) | ‐0.01 [‐0.51, 0.49] |
| 20.3 Both group and individual formats | 2 | 260 | Std. Mean Difference (IV, Random, 95% CI) | ‐0.13 [‐0.37, 0.12] |
| 21 Overall fatigue (follow‐up values) Show forest plot | 24 | Std. Mean Difference (IV, Random, 95% CI) | Subtotals only | |
| 21.1 Group format | 7 | 350 | Std. Mean Difference (IV, Random, 95% CI) | ‐0.77 [‐1.15, ‐0.39] |
| 21.2 Individual format | 11 | 1068 | Std. Mean Difference (IV, Random, 95% CI) | ‐0.19 [‐0.36, ‐0.02] |
| 21.3 Both group and individual formats | 6 | 445 | Std. Mean Difference (IV, Random, 95% CI) | ‐0.18 [‐0.37, 0.01] |
| 22 Overall fatigue (change values) Show forest plot | 12 | Std. Mean Difference (IV, Random, 95% CI) | Subtotals only | |
| 22.1 Group format | 2 | 73 | Std. Mean Difference (IV, Random, 95% CI) | ‐0.10 [‐0.70, 0.50] |
| 22.2 Individual format | 7 | 637 | Std. Mean Difference (IV, Random, 95% CI) | ‐0.40 [‐0.98, 0.17] |
| 22.3 Both group and individual formats | 3 | 561 | Std. Mean Difference (IV, Random, 95% CI) | ‐0.02 [‐0.18, 0.15] |
| 23 Overall pain/disability (follow‐up values) Show forest plot | 8 | Std. Mean Difference (IV, Random, 95% CI) | Subtotals only | |
| 23.1 Group format | 2 | 77 | Std. Mean Difference (IV, Random, 95% CI) | 0.18 [‐0.26, 0.63] |
| 23.2 Individual format | 3 | 261 | Std. Mean Difference (IV, Random, 95% CI) | 0.22 [‐0.22, 0.65] |
| 23.3 Both group and individual formats | 3 | 135 | Std. Mean Difference (IV, Random, 95% CI) | ‐0.16 [‐0.50, 0.18] |
| 24 Overall pain/disability (change values) Show forest plot | 3 | Std. Mean Difference (IV, Random, 95% CI) | Subtotals only | |
| 24.1 Group format | 3 | 139 | Std. Mean Difference (IV, Random, 95% CI) | 0.16 [‐0.19, 0.50] |
| 24.2 Individual format | 0 | 0 | Std. Mean Difference (IV, Random, 95% CI) | 0.0 [0.0, 0.0] |
| 24.3 Both group and individual formats | 0 | 0 | Std. Mean Difference (IV, Random, 95% CI) | 0.0 [0.0, 0.0] |
| 25 Overall self‐esteem/body image (follow‐up values) Show forest plot | 10 | Std. Mean Difference (IV, Random, 95% CI) | Subtotals only | |
| 25.1 Group format | 3 | 234 | Std. Mean Difference (IV, Random, 95% CI) | 0.28 [‐0.04, 0.60] |
| 25.2 Individual format | 5 | 259 | Std. Mean Difference (IV, Random, 95% CI) | 0.27 [‐0.21, 0.76] |
| 25.3 Both group and individual formats | 2 | 97 | Std. Mean Difference (IV, Random, 95% CI) | 0.15 [‐0.25, 0.55] |
| 26 Overall self‐esteem/body image (change values) Show forest plot | 9 | Std. Mean Difference (IV, Random, 95% CI) | Subtotals only | |
| 26.1 Group format | 4 | 258 | Std. Mean Difference (IV, Random, 95% CI) | 0.59 [‐0.33, 1.51] |
| 26.2 Individual format | 3 | 160 | Std. Mean Difference (IV, Random, 95% CI) | 0.31 [‐0.19, 0.81] |
| 26.3 Both group and individual formats | 2 | 574 | Std. Mean Difference (IV, Random, 95% CI) | ‐0.05 [‐0.21, 0.12] |
| 27 Overall cardiorespiratory fitness (follow‐up values) Show forest plot | 21 | Std. Mean Difference (IV, Random, 95% CI) | Subtotals only | |
| 27.1 Group format | 7 | 321 | Std. Mean Difference (IV, Random, 95% CI) | 0.29 [0.06, 0.51] |
| 27.2 Individual format | 10 | 493 | Std. Mean Difference (IV, Random, 95% CI) | 0.59 [0.38, 0.79] |
| 27.3 Both group and individual formats | 4 | 362 | Std. Mean Difference (IV, Random, 95% CI) | 0.24 [0.03, 0.44] |
| 28 Overall cardiorespiratory fitness (change values) Show forest plot | 6 | Std. Mean Difference (IV, Random, 95% CI) | Subtotals only | |
| 28.1 Group format | 0 | 0 | Std. Mean Difference (IV, Random, 95% CI) | 0.0 [0.0, 0.0] |
| 28.2 Individual format | 4 | 216 | Std. Mean Difference (IV, Random, 95% CI) | 0.64 [0.08, 1.19] |
| 28.3 Both group and individual formats | 2 | 581 | Std. Mean Difference (IV, Random, 95% CI) | 0.44 [‐0.18, 1.05] |
| 29 Overall self‐reported physical activity (follow‐up values) Show forest plot | 17 | Std. Mean Difference (IV, Random, 95% CI) | Subtotals only | |
| 29.1 Group format | 1 | 264 | Std. Mean Difference (IV, Random, 95% CI) | 0.13 [‐0.11, 0.37] |
| 29.2 Individual format | 8 | 989 | Std. Mean Difference (IV, Random, 95% CI) | 0.59 [0.28, 0.90] |
| 29.3 Both group and individual formats | 8 | 752 | Std. Mean Difference (IV, Random, 95% CI) | 0.55 [0.25, 0.84] |
| 30 Overall self‐reported physical activity (change values) Show forest plot | 8 | Std. Mean Difference (IV, Random, 95% CI) | Subtotals only | |
| 30.1 Group format | 1 | 105 | Std. Mean Difference (IV, Random, 95% CI) | 0.21 [‐0.17, 0.60] |
| 30.2 Individual format | 3 | 495 | Std. Mean Difference (IV, Random, 95% CI) | 0.38 [0.18, 0.57] |
| 30.3 Both group and individual formats | 4 | 674 | Std. Mean Difference (IV, Random, 95% CI) | 0.92 [0.14, 1.70] |
| 31 Overall objective physical activity (follow‐up values) Show forest plot | 12 | Std. Mean Difference (IV, Random, 95% CI) | Subtotals only | |
| 31.1 Group format | 0 | 0 | Std. Mean Difference (IV, Random, 95% CI) | 0.0 [0.0, 0.0] |
| 31.2 Individual format | 8 | 957 | Std. Mean Difference (IV, Random, 95% CI) | 0.51 [0.18, 0.85] |
| 31.3 Both group and individual formats | 4 | 352 | Std. Mean Difference (IV, Random, 95% CI) | 0.34 [0.13, 0.55] |
| 32 Overall objective physical activity (change values) Show forest plot | 5 | Std. Mean Difference (IV, Random, 95% CI) | Subtotals only | |
| 32.1 Group format | 0 | 0 | Std. Mean Difference (IV, Random, 95% CI) | 0.0 [0.0, 0.0] |
| 32.2 Individual format | 3 | 416 | Std. Mean Difference (IV, Random, 95% CI) | 0.62 [‐0.23, 1.46] |
| 32.3 Both group and individual formats | 2 | 92 | Std. Mean Difference (IV, Random, 95% CI) | 0.83 [0.40, 1.27] |
| 33 Mass (follow‐up values) Show forest plot | 15 | Mean Difference (IV, Fixed, 95% CI) | Subtotals only | |
| 33.1 Group format | 4 | 363 | Mean Difference (IV, Fixed, 95% CI) | ‐1.10 [‐3.92, 1.72] |
| 33.2 Individual format | 5 | 331 | Mean Difference (IV, Fixed, 95% CI) | 0.16 [‐0.79, 1.10] |
| 33.3 Both group and individual formats | 6 | 487 | Mean Difference (IV, Fixed, 95% CI) | ‐0.00 [‐0.76, 0.76] |
| 34 Mass (change values) Show forest plot | 10 | Mean Difference (IV, Random, 95% CI) | Subtotals only | |
| 34.1 Group format | 3 | 211 | Mean Difference (IV, Random, 95% CI) | ‐1.23 [‐2.10, ‐0.35] |
| 34.2 Individual format | 4 | 186 | Mean Difference (IV, Random, 95% CI) | 0.10 [‐0.08, 0.28] |
| 34.3 Both group and individual formats | 3 | 617 | Mean Difference (IV, Random, 95% CI) | ‐0.58 [‐1.80, 0.63] |
| 35 BMI (follow‐up values) Show forest plot | 16 | Mean Difference (IV, Fixed, 95% CI) | Subtotals only | |
| 35.1 Group format | 3 | 347 | Mean Difference (IV, Fixed, 95% CI) | ‐0.71 [‐1.74, 0.32] |
| 35.2 Individual format | 7 | 647 | Mean Difference (IV, Fixed, 95% CI) | 0.13 [‐0.18, 0.44] |
| 35.3 Both group and individual formats | 6 | 458 | Mean Difference (IV, Fixed, 95% CI) | ‐0.03 [‐0.31, 0.26] |
| 36 BMI (change values) Show forest plot | 8 | Mean Difference (IV, Random, 95% CI) | Subtotals only | |
| 36.1 Group format | 3 | 211 | Mean Difference (IV, Random, 95% CI) | ‐0.67 [‐0.98, ‐0.36] |
| 36.2 Individual format | 3 | 150 | Mean Difference (IV, Random, 95% CI) | ‐0.03 [‐0.22, 0.15] |
| 36.3 Both group and individual formats | 2 | 124 | Mean Difference (IV, Random, 95% CI) | ‐0.12 [‐0.43, 0.20] |
| 37 Overall body fat (follow‐up values) Show forest plot | 18 | Std. Mean Difference (IV, Random, 95% CI) | Subtotals only | |
| 37.1 Group format | 3 | 299 | Std. Mean Difference (IV, Random, 95% CI) | ‐0.23 [‐0.46, ‐0.00] |
| 37.2 Individual format | 10 | 539 | Std. Mean Difference (IV, Random, 95% CI) | ‐0.30 [‐0.54, ‐0.06] |
| 37.3 Both group and individual formats | 5 | 324 | Std. Mean Difference (IV, Random, 95% CI) | 0.05 [‐0.17, 0.26] |
| 38 Overall body fat (change values) Show forest plot | 9 | Std. Mean Difference (IV, Random, 95% CI) | Subtotals only | |
| 38.1 Group format | 2 | 147 | Std. Mean Difference (IV, Random, 95% CI) | ‐0.06 [‐0.38, 0.26] |
| 38.2 Individual format | 6 | 270 | Std. Mean Difference (IV, Random, 95% CI) | ‐0.86 [‐1.74, 0.02] |
| 38.3 Both group and individual formats | 1 | 82 | Std. Mean Difference (IV, Random, 95% CI) | ‐0.29 [‐0.73, 0.14] |
| 39 Lower body strength (follow‐up values) Show forest plot | 9 | Std. Mean Difference (IV, Random, 95% CI) | Subtotals only | |
| 39.1 Group format | 2 | 290 | Std. Mean Difference (IV, Random, 95% CI) | 0.69 [0.29, 1.10] |
| 39.2 Individual format | 3 | 85 | Std. Mean Difference (IV, Random, 95% CI) | 1.04 [0.08, 2.00] |
| 39.3 Both group and individual formats | 4 | 200 | Std. Mean Difference (IV, Random, 95% CI) | 0.13 [‐0.22, 0.47] |
| 40 Lower body strength (change values) Show forest plot | 5 | Std. Mean Difference (IV, Random, 95% CI) | Subtotals only | |
| 40.1 Group format | 2 | 294 | Std. Mean Difference (IV, Random, 95% CI) | 0.92 [0.61, 1.22] |
| 40.2 Individual format | 3 | 289 | Std. Mean Difference (IV, Random, 95% CI) | 0.65 [0.09, 1.22] |
| 40.3 Both group and individual formats | 0 | 0 | Std. Mean Difference (IV, Random, 95% CI) | 0.0 [0.0, 0.0] |
| 41 Upper body strength (follow‐up values) Show forest plot | 12 | Std. Mean Difference (IV, Random, 95% CI) | Subtotals only | |
| 41.1 Group format | 4 | 365 | Std. Mean Difference (IV, Random, 95% CI) | 0.53 [‐0.29, 1.35] |
| 41.2 Individual format | 4 | 141 | Std. Mean Difference (IV, Random, 95% CI) | 0.63 [‐0.06, 1.32] |
| 41.3 Both group and individual formats | 4 | 200 | Std. Mean Difference (IV, Random, 95% CI) | 0.29 [0.01, 0.57] |
| 42 Upper body strength (change values) Show forest plot | 7 | Std. Mean Difference (IV, Random, 95% CI) | Subtotals only | |
| 42.1 Group format | 3 | 377 | Std. Mean Difference (IV, Random, 95% CI) | 1.01 [0.49, 1.53] |
| 42.2 Individual format | 3 | 310 | Std. Mean Difference (IV, Random, 95% CI) | 1.00 [‐0.08, 2.09] |
| 42.3 Both group and individual formats | 1 | 83 | Std. Mean Difference (IV, Random, 95% CI) | 0.16 [‐0.27, 0.59] |
| 43 Bone mineral density ‐ femoral neck (follow‐up and change values) Show forest plot | 4 | Std. Mean Difference (IV, Random, 95% CI) | Subtotals only | |
| 43.1 Group format | 0 | 0 | Std. Mean Difference (IV, Random, 95% CI) | 0.0 [0.0, 0.0] |
| 43.2 Individual format | 2 | 262 | Std. Mean Difference (IV, Random, 95% CI) | 0.17 [‐0.80, 1.14] |
| 43.3 Both group and individual formats | 2 | 524 | Std. Mean Difference (IV, Random, 95% CI) | 0.17 [0.00, 0.34] |
| 44 Bone mineral density ‐ lumbar spine (follow‐up and change values) Show forest plot | 4 | Std. Mean Difference (IV, Random, 95% CI) | Subtotals only | |
| 44.1 Group format | 0 | 0 | Std. Mean Difference (IV, Random, 95% CI) | 0.0 [0.0, 0.0] |
| 44.2 Individual format | 2 | 262 | Std. Mean Difference (IV, Random, 95% CI) | 0.20 [‐0.59, 0.98] |
| 44.3 Both group and individual formats | 2 | 524 | Std. Mean Difference (IV, Random, 95% CI) | 0.12 [‐0.06, 0.29] |
| 45 Bone mineral density ‐ total hip (follow‐up and change values) Show forest plot | 3 | Std. Mean Difference (IV, Random, 95% CI) | Subtotals only | |
| 45.1 Group format | 0 | 0 | Std. Mean Difference (IV, Random, 95% CI) | 0.0 [0.0, 0.0] |
| 45.2 Individual format | 1 | 39 | Std. Mean Difference (IV, Random, 95% CI) | 10.34 [7.84, 12.84] |
| 45.3 Both group and individual formats | 2 | 290 | Std. Mean Difference (IV, Random, 95% CI) | 0.64 [‐0.20, 1.48] |
| Outcome or subgroup title | No. of studies | No. of participants | Statistical method | Effect size |
| 1 Overall HRQoL (follow‐up values) Show forest plot | 22 | Std. Mean Difference (IV, Random, 95% CI) | Subtotals only | |
| 1.1 Home‐based | 5 | 792 | Std. Mean Difference (IV, Random, 95% CI) | 0.04 [‐0.11, 0.19] |
| 1.2 Facility‐based | 15 | 833 | Std. Mean Difference (IV, Random, 95% CI) | 0.55 [0.27, 0.83] |
| 1.3 Both home‐ and facility‐based | 4 | 227 | Std. Mean Difference (IV, Random, 95% CI) | 0.48 [0.04, 0.92] |
| 2 Overall HRQoL (change values) Show forest plot | 14 | Std. Mean Difference (IV, Random, 95% CI) | Subtotals only | |
| 2.1 Home‐based | 2 | 375 | Std. Mean Difference (IV, Random, 95% CI) | 0.27 [0.04, 0.50] |
| 2.2 Facility‐based | 10 | 492 | Std. Mean Difference (IV, Random, 95% CI) | 1.18 [0.53, 1.82] |
| 2.3 Both home‐ and facility‐based | 3 | 612 | Std. Mean Difference (IV, Random, 95% CI) | 0.06 [‐0.22, 0.33] |
| 3 Overall emotional function/mental health (follow‐up values) Show forest plot | 26 | Std. Mean Difference (IV, Random, 95% CI) | Subtotals only | |
| 3.1 Home‐based | 5 | 670 | Std. Mean Difference (IV, Random, 95% CI) | 0.11 [‐0.06, 0.27] |
| 3.2 Facility‐based | 15 | 901 | Std. Mean Difference (IV, Random, 95% CI) | 0.31 [0.12, 0.50] |
| 3.3 Both home‐ and facility‐based | 6 | 531 | Std. Mean Difference (IV, Random, 95% CI) | 0.15 [‐0.04, 0.34] |
| 4 Overall emotional function/mental health (change values) Show forest plot | 15 | Std. Mean Difference (IV, Random, 95% CI) | Subtotals only | |
| 4.1 Home‐based | 2 | 417 | Std. Mean Difference (IV, Random, 95% CI) | 0.16 [‐0.06, 0.37] |
| 4.2 Facility‐based | 10 | 550 | Std. Mean Difference (IV, Random, 95% CI) | 0.43 [0.04, 0.82] |
| 4.3 Both home‐ and facility‐based | 3 | 612 | Std. Mean Difference (IV, Random, 95% CI) | 0.09 [‐0.16, 0.34] |
| 5 Overall physical function (follow‐up values) Show forest plot | 25 | Std. Mean Difference (IV, Random, 95% CI) | Subtotals only | |
| 5.1 Home‐based | 5 | 720 | Std. Mean Difference (IV, Random, 95% CI) | 0.19 [0.03, 0.34] |
| 5.2 Facility‐based | 13 | 816 | Std. Mean Difference (IV, Random, 95% CI) | 0.43 [0.14, 0.73] |
| 5.3 Both home‐ and facility‐based | 7 | 592 | Std. Mean Difference (IV, Random, 95% CI) | 0.23 [‐0.02, 0.48] |
| 6 Overall physical function (change values) Show forest plot | 13 | Std. Mean Difference (IV, Random, 95% CI) | Subtotals only | |
| 6.1 Home‐based | 1 | 332 | Std. Mean Difference (IV, Random, 95% CI) | 0.26 [0.02, 0.51] |
| 6.2 Facility‐based | 9 | 489 | Std. Mean Difference (IV, Random, 95% CI) | 0.95 [0.31, 1.59] |
| 6.3 Both home‐ and facility‐based | 3 | 612 | Std. Mean Difference (IV, Random, 95% CI) | ‐0.08 [‐0.24, 0.08] |
| 7 Overall role function (follow‐up values) Show forest plot | 18 | Std. Mean Difference (IV, Random, 95% CI) | Subtotals only | |
| 7.1 Home‐based | 2 | 386 | Std. Mean Difference (IV, Random, 95% CI) | 0.26 [‐0.14, 0.66] |
| 7.2 Facility‐based | 12 | 564 | Std. Mean Difference (IV, Random, 95% CI) | 0.33 [‐0.03, 0.69] |
| 7.3 Both home‐ and facility‐based | 4 | 420 | Std. Mean Difference (IV, Random, 95% CI) | 0.20 [‐0.14, 0.54] |
| 8 Overall role function (change values) Show forest plot | 12 | Std. Mean Difference (IV, Random, 95% CI) | Subtotals only | |
| 8.1 Home‐based | 1 | 335 | Std. Mean Difference (IV, Random, 95% CI) | 0.17 [‐0.08, 0.41] |
| 8.2 Facility‐based | 8 | 368 | Std. Mean Difference (IV, Random, 95% CI) | 0.26 [‐0.06, 0.58] |
| 8.3 Both home‐ and facility‐based | 3 | 612 | Std. Mean Difference (IV, Random, 95% CI) | ‐0.06 [‐0.22, 0.10] |
| 9 Overall social well‐being/function (follow‐up values) Show forest plot | 18 | Std. Mean Difference (IV, Random, 95% CI) | Subtotals only | |
| 9.1 Home‐based | 2 | 386 | Std. Mean Difference (IV, Random, 95% CI) | ‐0.01 [‐0.23, 0.22] |
| 9.2 Facility‐based | 11 | 709 | Std. Mean Difference (IV, Random, 95% CI) | 0.22 [0.07, 0.37] |
| 9.3 Both home‐ and facility‐based | 5 | 462 | Std. Mean Difference (IV, Random, 95% CI) | 0.31 [0.03, 0.59] |
| 10 Overall social well‐being/function (change values) Show forest plot | 12 | Std. Mean Difference (IV, Random, 95% CI) | Subtotals only | |
| 10.1 Home‐based | 1 | 335 | Std. Mean Difference (IV, Random, 95% CI) | 0.97 [0.71, 1.23] |
| 10.2 Facility‐based | 7 | 395 | Std. Mean Difference (IV, Random, 95% CI) | 0.50 [0.05, 0.95] |
| 10.3 Both home‐ and facility‐based | 4 | 654 | Std. Mean Difference (IV, Random, 95% CI) | 0.41 [‐0.15, 0.96] |
| 11 Overall cognitive function (follow‐up values) Show forest plot | 5 | Std. Mean Difference (IV, Random, 95% CI) | Subtotals only | |
| 11.1 Home‐based | 0 | 0 | Std. Mean Difference (IV, Random, 95% CI) | 0.0 [0.0, 0.0] |
| 11.2 Facility‐based | 3 | 134 | Std. Mean Difference (IV, Random, 95% CI) | 0.32 [‐0.02, 0.66] |
| 11.3 Both home‐ and facility‐based | 2 | 55 | Std. Mean Difference (IV, Random, 95% CI) | 0.65 [‐0.01, 1.31] |
| 12 Overall cognitive function (change values) Show forest plot | 5 | Std. Mean Difference (IV, Random, 95% CI) | Subtotals only | |
| 12.1 Home‐based | 0 | 0 | Std. Mean Difference (IV, Random, 95% CI) | 0.0 [0.0, 0.0] |
| 12.2 Facility‐based | 3 | 134 | Std. Mean Difference (IV, Random, 95% CI) | 0.06 [‐0.31, 0.43] |
| 12.3 Both home‐ and facility‐based | 2 | 538 | Std. Mean Difference (IV, Random, 95% CI) | 0.03 [‐0.51, 0.57] |
| 13 Overall general health (follow‐up values) Show forest plot | 9 | Std. Mean Difference (IV, Random, 95% CI) | Subtotals only | |
| 13.1 Home‐based | 2 | 111 | Std. Mean Difference (IV, Random, 95% CI) | 0.43 [‐0.32, 1.17] |
| 13.2 Facility‐based | 6 | 273 | Std. Mean Difference (IV, Random, 95% CI) | 0.25 [0.01, 0.49] |
| 13.3 Both home‐ and facility‐based | 2 | 112 | Std. Mean Difference (IV, Random, 95% CI) | ‐0.26 [‐0.64, 0.11] |
| 14 Overall general health (change values) Show forest plot | 5 | Std. Mean Difference (IV, Random, 95% CI) | Subtotals only | |
| 14.1 Home‐based | 1 | 40 | Std. Mean Difference (IV, Random, 95% CI) | 0.42 [‐0.21, 1.05] |
| 14.2 Facility‐based | 2 | 59 | Std. Mean Difference (IV, Random, 95% CI) | 0.27 [‐0.49, 1.03] |
| 14.3 Both home‐ and facility‐based | 3 | 612 | Std. Mean Difference (IV, Random, 95% CI) | ‐0.07 [‐0.23, 0.09] |
| 15 Overall sexual function (follow‐up values) Show forest plot | 5 | Std. Mean Difference (IV, Fixed, 95% CI) | Subtotals only | |
| 15.1 Home‐based | 2 | 136 | Std. Mean Difference (IV, Fixed, 95% CI) | ‐0.00 [‐0.34, 0.34] |
| 15.2 Facility‐based | 2 | 193 | Std. Mean Difference (IV, Fixed, 95% CI) | 0.21 [‐0.07, 0.49] |
| 15.3 Both home‐ and facility‐based | 1 | 82 | Std. Mean Difference (IV, Fixed, 95% CI) | 0.29 [‐0.14, 0.73] |
| 16 Overall sexual function (change values) Show forest plot | 3 | Mean Difference (IV, Random, 95% CI) | Subtotals only | |
| 16.1 Home‐based | 0 | 0 | Mean Difference (IV, Random, 95% CI) | 0.0 [0.0, 0.0] |
| 16.2 Facility‐based | 2 | 193 | Mean Difference (IV, Random, 95% CI) | 3.83 [‐1.83, 9.48] |
| 16.3 Both home‐ and facility‐based | 1 | 500 | Mean Difference (IV, Random, 95% CI) | 0.5 [‐3.86, 4.86] |
| 17 Overall sleep (follow‐up values) Show forest plot | 5 | Std. Mean Difference (IV, Fixed, 95% CI) | Subtotals only | |
| 17.1 Home‐based | 0 | 0 | Std. Mean Difference (IV, Fixed, 95% CI) | 0.0 [0.0, 0.0] |
| 17.2 Facility‐based | 2 | 88 | Std. Mean Difference (IV, Fixed, 95% CI) | ‐0.26 [‐0.68, 0.16] |
| 17.3 Both home‐ and facility‐based | 3 | 100 | Std. Mean Difference (IV, Fixed, 95% CI) | 0.06 [‐0.33, 0.46] |
| 18 Overall sleep (change values) Show forest plot | 3 | Std. Mean Difference (IV, Random, 95% CI) | Subtotals only | |
| 18.1 Home‐based | 0 | 0 | Std. Mean Difference (IV, Random, 95% CI) | 0.0 [0.0, 0.0] |
| 18.2 Facility‐based | 1 | 56 | Std. Mean Difference (IV, Random, 95% CI) | 0.14 [‐0.38, 0.67] |
| 18.3 Both home‐ and facility‐based | 2 | 80 | Std. Mean Difference (IV, Random, 95% CI) | 0.14 [‐0.30, 0.58] |
| 19 Overall anxiety (follow‐up values) Show forest plot | 7 | Std. Mean Difference (IV, Random, 95% CI) | Subtotals only | |
| 19.1 Home‐based | 0 | 0 | Std. Mean Difference (IV, Random, 95% CI) | 0.0 [0.0, 0.0] |
| 19.2 Facility‐based | 4 | 192 | Std. Mean Difference (IV, Random, 95% CI) | ‐0.87 [‐1.34, ‐0.41] |
| 19.3 Both home‐ and facility‐based | 3 | 134 | Std. Mean Difference (IV, Random, 95% CI) | ‐0.14 [‐0.48, 0.21] |
| 20 Overall anxiety (change values) Show forest plot | 4 | Std. Mean Difference (IV, Fixed, 95% CI) | Subtotals only | |
| 20.1 Home‐based | 0 | 0 | Std. Mean Difference (IV, Fixed, 95% CI) | 0.0 [0.0, 0.0] |
| 20.2 Facility‐based | 2 | 119 | Std. Mean Difference (IV, Fixed, 95% CI) | ‐0.52 [‐0.88, ‐0.15] |
| 20.3 Both home‐ and facility‐based | 2 | 116 | Std. Mean Difference (IV, Fixed, 95% CI) | ‐0.23 [‐0.60, 0.13] |
| 21 Overall depression (follow‐up values) Show forest plot | 12 | Std. Mean Difference (IV, Random, 95% CI) | Subtotals only | |
| 21.1 Home‐based | 2 | 60 | Std. Mean Difference (IV, Random, 95% CI) | 0.34 [‐0.17, 0.85] |
| 21.2 Facility‐based | 8 | 483 | Std. Mean Difference (IV, Random, 95% CI) | ‐0.55 [‐0.85, ‐0.25] |
| 21.3 Both home‐ and facility‐based | 3 | 134 | Std. Mean Difference (IV, Random, 95% CI) | 0.05 [‐0.52, 0.61] |
| 22 Overall depression (change values) Show forest plot | 7 | Std. Mean Difference (IV, Random, 95% CI) | Subtotals only | |
| 22.1 Home‐based | 1 | 40 | Std. Mean Difference (IV, Random, 95% CI) | ‐0.39 [‐1.02, 0.23] |
| 22.2 Facility‐based | 3 | 140 | Std. Mean Difference (IV, Random, 95% CI) | ‐0.63 [‐0.97, ‐0.29] |
| 22.3 Both home‐ and facility‐based | 3 | 616 | Std. Mean Difference (IV, Random, 95% CI) | ‐0.11 [‐0.41, 0.19] |
| 23 Overall fatigue (follow‐up values) Show forest plot | 25 | Std. Mean Difference (IV, Random, 95% CI) | Subtotals only | |
| 23.1 Home‐based | 6 | 850 | Std. Mean Difference (IV, Random, 95% CI) | ‐0.18 [‐0.39, 0.03] |
| 23.2 Facility‐based | 13 | 749 | Std. Mean Difference (IV, Random, 95% CI) | ‐0.53 [‐0.77, ‐0.29] |
| 23.3 Both home‐ and facility‐based | 7 | 346 | Std. Mean Difference (IV, Random, 95% CI) | ‐0.09 [‐0.30, 0.13] |
| 24 Overall fatigue (change values) Show forest plot | 12 | Std. Mean Difference (IV, Random, 95% CI) | Subtotals only | |
| 24.1 Home‐based | 2 | 417 | Std. Mean Difference (IV, Random, 95% CI) | ‐0.25 [‐1.10, 0.61] |
| 24.2 Facility‐based | 7 | 296 | Std. Mean Difference (IV, Random, 95% CI) | ‐0.43 [‐1.06, 0.20] |
| 24.3 Both home‐ and facility‐based | 3 | 558 | Std. Mean Difference (IV, Random, 95% CI) | ‐0.01 [‐0.17, 0.16] |
| 25 Overall pain/disability (follow‐up values) Show forest plot | 9 | Std. Mean Difference (IV, Random, 95% CI) | Subtotals only | |
| 25.1 Home‐based | 3 | 249 | Std. Mean Difference (IV, Random, 95% CI) | 0.24 [‐0.20, 0.68] |
| 25.2 Facility‐based | 5 | 183 | Std. Mean Difference (IV, Random, 95% CI) | 0.09 [‐0.20, 0.38] |
| 25.3 Both home‐ and facility‐based | 2 | 112 | Std. Mean Difference (IV, Random, 95% CI) | ‐0.12 [‐0.49, 0.25] |
| 26 Overall pain/disability (change values) Show forest plot | 5 | Std. Mean Difference (IV, Random, 95% CI) | Subtotals only | |
| 26.1 Home‐based | 0 | 0 | Std. Mean Difference (IV, Random, 95% CI) | 0.0 [0.0, 0.0] |
| 26.2 Facility‐based | 3 | 139 | Std. Mean Difference (IV, Random, 95% CI) | 0.16 [‐0.19, 0.50] |
| 26.3 Both home‐ and facility‐based | 2 | 157 | Std. Mean Difference (IV, Random, 95% CI) | ‐0.29 [‐0.61, 0.02] |
| 27 Overall self‐esteem/body image (follow‐up values) Show forest plot | 12 | Std. Mean Difference (IV, Random, 95% CI) | Subtotals only | |
| 27.1 Home‐based | 2 | 124 | Std. Mean Difference (IV, Random, 95% CI) | ‐0.10 [‐1.17, 0.97] |
| 27.2 Facility‐based | 8 | 451 | Std. Mean Difference (IV, Random, 95% CI) | 0.29 [0.09, 0.50] |
| 27.3 Both home‐ and facility‐based | 2 | 92 | Std. Mean Difference (IV, Random, 95% CI) | 0.52 [‐0.44, 1.48] |
| 28 Overall self‐esteem/body image (change values) Show forest plot | 9 | Std. Mean Difference (IV, Random, 95% CI) | Subtotals only | |
| 28.1 Home‐based | 1 | 42 | Std. Mean Difference (IV, Random, 95% CI) | ‐0.22 [‐0.89, 0.45] |
| 28.2 Facility‐based | 6 | 376 | Std. Mean Difference (IV, Random, 95% CI) | 0.52 [‐0.09, 1.13] |
| 28.3 Both home‐ and facility‐based | 2 | 574 | Std. Mean Difference (IV, Random, 95% CI) | ‐0.05 [‐0.21, 0.12] |
| 29 Overall cardiorespiratory fitness (follow‐up values) Show forest plot | 23 | Std. Mean Difference (IV, Random, 95% CI) | Subtotals only | |
| 29.1 Home‐based | 5 | 245 | Std. Mean Difference (IV, Random, 95% CI) | 0.66 [0.40, 0.92] |
| 29.2 Facility‐based | 13 | 603 | Std. Mean Difference (IV, Random, 95% CI) | 0.45 [0.25, 0.66] |
| 29.3 Both home‐ and facility‐based | 6 | 426 | Std. Mean Difference (IV, Random, 95% CI) | 0.29 [0.03, 0.56] |
| 30 Overall cardiorespiratory fitness (change values) Show forest plot | 9 | Std. Mean Difference (IV, Random, 95% CI) | Subtotals only | |
| 30.1 Home‐based | 2 | 124 | Std. Mean Difference (IV, Random, 95% CI) | 0.39 [‐0.20, 0.99] |
| 30.2 Facility‐based | 4 | 116 | Std. Mean Difference (IV, Random, 95% CI) | 1.62 [1.03, 2.21] |
| 30.3 Both home‐ and facility‐based | 3 | 623 | Std. Mean Difference (IV, Random, 95% CI) | 0.40 [‐0.02, 0.82] |
| 31 Overall self‐reported physical activity (follow‐up values) Show forest plot | 18 | Std. Mean Difference (IV, Random, 95% CI) | Subtotals only | |
| 31.1 Home‐based | 9 | 1028 | Std. Mean Difference (IV, Random, 95% CI) | 0.57 [0.29, 0.85] |
| 31.2 Facility‐based | 3 | 513 | Std. Mean Difference (IV, Random, 95% CI) | 0.23 [0.05, 0.40] |
| 31.3 Both home‐ and facility‐based | 6 | 503 | Std. Mean Difference (IV, Random, 95% CI) | 0.62 [0.23, 1.00] |
| 32 Overall self‐reported physical activity (change values) Show forest plot | 8 | Std. Mean Difference (IV, Random, 95% CI) | Subtotals only | |
| 32.1 Home‐based | 3 | 495 | Std. Mean Difference (IV, Random, 95% CI) | 0.38 [0.18, 0.57] |
| 32.2 Facility‐based | 1 | 105 | Std. Mean Difference (IV, Random, 95% CI) | 0.21 [‐0.17, 0.60] |
| 32.3 Both home‐ and facility‐based | 4 | 674 | Std. Mean Difference (IV, Random, 95% CI) | 0.92 [0.14, 1.70] |
| 33 Overall objective physical activity (follow‐up values) Show forest plot | 11 | Std. Mean Difference (IV, Random, 95% CI) | Subtotals only | |
| 33.1 Home‐based | 5 | 854 | Std. Mean Difference (IV, Random, 95% CI) | 0.45 [0.07, 0.82] |
| 33.2 Facility‐based | 0 | 0 | Std. Mean Difference (IV, Random, 95% CI) | 0.0 [0.0, 0.0] |
| 33.3 Both home‐ and facility‐based | 6 | 416 | Std. Mean Difference (IV, Random, 95% CI) | 0.43 [0.17, 0.68] |
| 34 Overall objective physical activity (change values) Show forest plot | 5 | Std. Mean Difference (IV, Random, 95% CI) | Subtotals only | |
| 34.1 Home‐based | 2 | 374 | Std. Mean Difference (IV, Random, 95% CI) | 0.37 [‐0.56, 1.30] |
| 34.2 Facility‐based | 0 | 0 | Std. Mean Difference (IV, Random, 95% CI) | 0.0 [0.0, 0.0] |
| 34.3 Both home‐ and facility‐based | 3 | 134 | Std. Mean Difference (IV, Random, 95% CI) | 0.92 [0.56, 1.28] |
| 35 Mass (follow‐up values) Show forest plot | 16 | Mean Difference (IV, Fixed, 95% CI) | Subtotals only | |
| 35.1 Home‐based | 2 | 100 | Mean Difference (IV, Fixed, 95% CI) | ‐3.38 [‐10.29, 3.53] |
| 35.2 Facility‐based | 10 | 864 | Mean Difference (IV, Fixed, 95% CI) | 0.03 [‐0.56, 0.61] |
| 35.3 Both home‐ and facility‐based | 4 | 246 | Mean Difference (IV, Fixed, 95% CI) | 0.04 [‐3.96, 4.04] |
| 36 Mass (change values) Show forest plot | 11 | Mean Difference (IV, Random, 95% CI) | Subtotals only | |
| 36.1 Home‐based | 1 | 36 | Mean Difference (IV, Random, 95% CI) | ‐0.03 [‐1.46, 1.40] |
| 36.2 Facility‐based | 7 | 394 | Mean Difference (IV, Random, 95% CI) | ‐0.61 [‐1.31, 0.08] |
| 36.3 Both home‐ and facility‐based | 3 | 617 | Mean Difference (IV, Random, 95% CI) | ‐0.58 [‐1.80, 0.63] |
| 37 BMI (follow‐up values) Show forest plot | 17 | Mean Difference (IV, Fixed, 95% CI) | Subtotals only | |
| 37.1 Home‐based | 3 | 442 | Mean Difference (IV, Fixed, 95% CI) | ‐0.53 [‐1.64, 0.57] |
| 37.2 Facility‐based | 9 | 767 | Mean Difference (IV, Fixed, 95% CI) | 0.04 [‐0.17, 0.26] |
| 37.3 Both home‐ and facility‐based | 6 | 281 | Mean Difference (IV, Fixed, 95% CI) | ‐0.61 [‐2.14, 0.91] |
| 38 BMI (change values) Show forest plot | 8 | Mean Difference (IV, Random, 95% CI) | Subtotals only | |
| 38.1 Home‐based | 0 | 0 | Mean Difference (IV, Random, 95% CI) | 0.0 [0.0, 0.0] |
| 38.2 Facility‐based | 6 | 361 | Mean Difference (IV, Random, 95% CI) | ‐0.27 [‐0.58, 0.04] |
| 38.3 Both home‐ and facility‐based | 2 | 124 | Mean Difference (IV, Random, 95% CI) | ‐0.12 [‐0.43, 0.20] |
| 39 Overall body fat (follow‐up values) Show forest plot | 18 | Std. Mean Difference (IV, Random, 95% CI) | Subtotals only | |
| 39.1 Home‐based | 4 | 224 | Std. Mean Difference (IV, Random, 95% CI) | ‐0.18 [‐0.45, 0.09] |
| 39.2 Facility‐based | 7 | 550 | Std. Mean Difference (IV, Random, 95% CI) | ‐0.39 [‐0.69, ‐0.08] |
| 39.3 Both home‐ and facility‐based | 7 | 388 | Std. Mean Difference (IV, Random, 95% CI) | 0.01 [‐0.19, 0.21] |
| 40 Overall body fat (change values) Show forest plot | 9 | Std. Mean Difference (IV, Random, 95% CI) | Subtotals only | |
| 40.1 Home‐based | 2 | 78 | Std. Mean Difference (IV, Random, 95% CI) | ‐0.48 [‐0.97, ‐0.00] |
| 40.2 Facility‐based | 5 | 297 | Std. Mean Difference (IV, Random, 95% CI) | ‐0.84 [‐1.94, 0.26] |
| 40.3 Both home‐ and facility‐based | 2 | 124 | Std. Mean Difference (IV, Random, 95% CI) | ‐0.26 [‐0.62, 0.09] |
| 41 Lower body strength (follow‐up values) Show forest plot | 10 | Std. Mean Difference (IV, Random, 95% CI) | Subtotals only | |
| 41.1 Home‐based | 0 | 0 | Std. Mean Difference (IV, Random, 95% CI) | 0.0 [0.0, 0.0] |
| 41.2 Facility‐based | 5 | 417 | Std. Mean Difference (IV, Random, 95% CI) | 0.75 [0.24, 1.27] |
| 41.3 Both home‐ and facility‐based | 5 | 220 | Std. Mean Difference (IV, Random, 95% CI) | 0.12 [‐0.16, 0.40] |
| 42 Lower body strength (change values) Show forest plot | 8 | Std. Mean Difference (IV, Random, 95% CI) | Subtotals only | |
| 42.1 Home‐based | 0 | 0 | Std. Mean Difference (IV, Random, 95% CI) | 0.0 [0.0, 0.0] |
| 42.2 Facility‐based | 7 | 497 | Std. Mean Difference (IV, Random, 95% CI) | 0.80 [0.38, 1.23] |
| 42.3 Both home‐ and facility‐based | 1 | 223 | Std. Mean Difference (IV, Random, 95% CI) | 0.42 [0.15, 0.69] |
| 43 Upper body strength (follow‐up values) Show forest plot | 13 | Std. Mean Difference (IV, Random, 95% CI) | Subtotals only | |
| 43.1 Home‐based | 2 | 64 | Std. Mean Difference (IV, Random, 95% CI) | 0.58 [0.05, 1.12] |
| 43.2 Facility‐based | 8 | 513 | Std. Mean Difference (IV, Random, 95% CI) | 0.43 [‐0.12, 0.98] |
| 43.3 Both home‐ and facility‐based | 4 | 200 | Std. Mean Difference (IV, Random, 95% CI) | 0.29 [0.01, 0.57] |
| 44 Upper body strength (change values) Show forest plot | 8 | Std. Mean Difference (IV, Random, 95% CI) | Subtotals only | |
| 44.1 Home‐based | 0 | 0 | Std. Mean Difference (IV, Random, 95% CI) | 0.0 [0.0, 0.0] |
| 44.2 Facility‐based | 6 | 526 | Std. Mean Difference (IV, Random, 95% CI) | 0.92 [0.34, 1.50] |
| 44.3 Both home‐ and facility‐based | 2 | 306 | Std. Mean Difference (IV, Random, 95% CI) | 0.25 [0.03, 0.48] |
| 45 Bone mineral density ‐ femoral neck (follow‐up and change values) Show forest plot | 4 | Std. Mean Difference (IV, Random, 95% CI) | Subtotals only | |
| 45.1 Home‐based | 1 | 39 | Std. Mean Difference (IV, Random, 95% CI) | ‐0.37 [‐1.00, 0.27] |
| 45.2 Facility‐based | 0 | 0 | Std. Mean Difference (IV, Random, 95% CI) | 0.0 [0.0, 0.0] |
| 45.3 Both home‐ and facility‐based | 3 | 747 | Std. Mean Difference (IV, Random, 95% CI) | 0.32 [‐0.01, 0.65] |
| 46 Bone mineral density ‐ lumbar spine (follow‐up and change values) Show forest plot | 4 | Std. Mean Difference (IV, Random, 95% CI) | Subtotals only | |
| 46.1 Home‐based | 1 | 39 | Std. Mean Difference (IV, Random, 95% CI) | ‐0.26 [‐0.89, 0.37] |
| 46.2 Facility‐based | 0 | 0 | Std. Mean Difference (IV, Random, 95% CI) | 0.0 [0.0, 0.0] |
| 46.3 Both home‐ and facility‐based | 3 | 747 | Std. Mean Difference (IV, Random, 95% CI) | 0.30 [‐0.02, 0.63] |
| 47 Bone mineral density ‐ total hip (follow‐up and change values) Show forest plot | 3 | Std. Mean Difference (IV, Random, 95% CI) | Subtotals only | |
| 47.1 Home‐based | 1 | 39 | Std. Mean Difference (IV, Random, 95% CI) | 10.34 [7.84, 12.84] |
| 47.2 Facility‐based | 0 | 0 | Std. Mean Difference (IV, Random, 95% CI) | 0.0 [0.0, 0.0] |
| 47.3 Both home‐ and facility‐based | 2 | 290 | Std. Mean Difference (IV, Random, 95% CI) | 0.64 [‐0.20, 1.48] |
| Outcome or subgroup title | No. of studies | No. of participants | Statistical method | Effect size |
| 1 Overall HRQoL (follow‐up values) Show forest plot | 22 | Std. Mean Difference (IV, Random, 95% CI) | Subtotals only | |
| 1.1 Low risk of bias | 15 | 1521 | Std. Mean Difference (IV, Random, 95% CI) | 0.43 [0.19, 0.66] |
| 1.2 Unclear/high risk of bias | 7 | 475 | Std. Mean Difference (IV, Random, 95% CI) | 0.30 [0.06, 0.55] |
| 2 Overall HRQoL (change values) Show forest plot | 14 | Std. Mean Difference (IV, Random, 95% CI) | Subtotals only | |
| 2.1 Low risk of bias | 11 | 1360 | Std. Mean Difference (IV, Random, 95% CI) | 0.70 [0.28, 1.12] |
| 2.2 Unclear/high risk of bias | 3 | 99 | Std. Mean Difference (IV, Random, 95% CI) | 1.26 [‐0.11, 2.62] |
| 3 Overall emotional function/mental health (follow‐up values) Show forest plot | 26 | Std. Mean Difference (IV, Random, 95% CI) | Subtotals only | |
| 3.1 Low risk of bias | 15 | 1427 | Std. Mean Difference (IV, Random, 95% CI) | 0.22 [0.09, 0.34] |
| 3.2 Unclear/high risk of bias | 11 | 675 | Std. Mean Difference (IV, Random, 95% CI) | 0.19 [‐0.02, 0.40] |
| 4 Overall emotional function/mental health (change values) Show forest plot | 15 | Std. Mean Difference (IV, Random, 95% CI) | Subtotals only | |
| 4.1 Low risk of bias | 11 | 1399 | Std. Mean Difference (IV, Random, 95% CI) | 0.31 [0.04, 0.58] |
| 4.2 Unclear/high risk of bias | 4 | 180 | Std. Mean Difference (IV, Random, 95% CI) | 0.28 [‐0.08, 0.65] |
| 5 Overall physical function (follow‐up values) Show forest plot | 25 | Std. Mean Difference (IV, Random, 95% CI) | Subtotals only | |
| 5.1 Low risk of bias | 13 | 1343 | Std. Mean Difference (IV, Random, 95% CI) | 0.38 [0.13, 0.63] |
| 5.2 Unclear/high risk of bias | 12 | 786 | Std. Mean Difference (IV, Random, 95% CI) | 0.28 [0.14, 0.42] |
| 6 Overall physical function (change values) Show forest plot | 13 | Std. Mean Difference (IV, Random, 95% CI) | Subtotals only | |
| 6.1 Low risk of bias | 10 | 1335 | Std. Mean Difference (IV, Random, 95% CI) | 0.63 [0.19, 1.07] |
| 6.2 Unclear/high risk of bias | 3 | 98 | Std. Mean Difference (IV, Random, 95% CI) | 0.50 [0.09, 0.90] |
| 7 Overall role function (follow‐up values) Show forest plot | 18 | Std. Mean Difference (IV, Random, 95% CI) | Subtotals only | |
| 7.1 Low risk of bias | 12 | 1111 | Std. Mean Difference (IV, Random, 95% CI) | 0.32 [0.02, 0.61] |
| 7.2 Unclear/high risk of bias | 6 | 259 | Std. Mean Difference (IV, Random, 95% CI) | 0.24 [‐0.01, 0.48] |
| 8 Overall role function (change values) Show forest plot | 12 | Std. Mean Difference (IV, Random, 95% CI) | Subtotals only | |
| 8.1 Low risk of bias | 9 | 1218 | Std. Mean Difference (IV, Random, 95% CI) | 0.17 [‐0.06, 0.40] |
| 8.2 Unclear/high risk of bias | 3 | 97 | Std. Mean Difference (IV, Random, 95% CI) | 0.04 [‐0.36, 0.44] |
| 9 Overall social well‐being/function (follow‐up values) Show forest plot | 18 | Std. Mean Difference (IV, Random, 95% CI) | Subtotals only | |
| 9.1 Low risk of bias | 12 | 1263 | Std. Mean Difference (IV, Random, 95% CI) | 0.21 [0.07, 0.36] |
| 9.2 Unclear/high risk of bias | 6 | 294 | Std. Mean Difference (IV, Random, 95% CI) | 0.17 [‐0.06, 0.40] |
| 10 Overall social well‐being/function (change values) Show forest plot | 12 | Std. Mean Difference (IV, Random, 95% CI) | Subtotals only | |
| 10.1 Low risk of bias | 9 | 1286 | Std. Mean Difference (IV, Random, 95% CI) | 0.56 [0.13, 0.98] |
| 10.2 Unclear/high risk of bias | 3 | 98 | Std. Mean Difference (IV, Random, 95% CI) | 0.31 [‐0.09, 0.71] |
| 11 Overall cognitive function (follow‐up values) Show forest plot | 5 | Std. Mean Difference (IV, Random, 95% CI) | Subtotals only | |
| 11.1 Low risk of bias | 3 | 114 | Std. Mean Difference (IV, Random, 95% CI) | 0.45 [0.07, 0.82] |
| 11.2 Unclear/high risk of bias | 2 | 75 | Std. Mean Difference (IV, Random, 95% CI) | 0.52 [‐0.44, 1.48] |
| 12 Overall cognitive function (change values) Show forest plot | 5 | Std. Mean Difference (IV, Random, 95% CI) | Subtotals only | |
| 12.1 Low risk of bias | 4 | 615 | Std. Mean Difference (IV, Random, 95% CI) | 0.07 [‐0.28, 0.42] |
| 12.2 Unclear/high risk of bias | 1 | 57 | Std. Mean Difference (IV, Random, 95% CI) | ‐0.19 [‐0.71, 0.33] |
| 13 Overall general health (follow‐up values) Show forest plot | 9 | Std. Mean Difference (IV, Random, 95% CI) | Subtotals only | |
| 13.1 Low risk of bias | 5 | 267 | Std. Mean Difference (IV, Random, 95% CI) | 0.06 [‐0.31, 0.43] |
| 13.2 Unclear/high risk of bias | 4 | 189 | Std. Mean Difference (IV, Random, 95% CI) | 0.36 [0.02, 0.70] |
| 14 Overall general health (change values) Show forest plot | 9 | Std. Mean Difference (IV, Random, 95% CI) | Subtotals only | |
| 14.1 Low risk of bias | 7 | 829 | Std. Mean Difference (IV, Random, 95% CI) | 0.21 [‐0.08, 0.49] |
| 14.2 Unclear/high risk of bias | 2 | 77 | Std. Mean Difference (IV, Random, 95% CI) | 0.10 [‐0.35, 0.55] |
| 15 Overall sexual function (follow‐up values) Show forest plot | 5 | Std. Mean Difference (IV, Fixed, 95% CI) | Subtotals only | |
| 15.1 Low risk of bias | 2 | 193 | Std. Mean Difference (IV, Fixed, 95% CI) | 0.21 [‐0.07, 0.49] |
| 15.2 Unclear/high risk of bias | 3 | 218 | Std. Mean Difference (IV, Fixed, 95% CI) | 0.11 [‐0.16, 0.38] |
| 16 Overall sexual function (change values) Show forest plot | 3 | Std. Mean Difference (IV, Random, 95% CI) | Subtotals only | |
| 16.1 Low risk of bias | 3 | 693 | Std. Mean Difference (IV, Random, 95% CI) | 0.22 [‐0.08, 0.52] |
| 16.2 Unclear/high risk of bias | 0 | 0 | Std. Mean Difference (IV, Random, 95% CI) | 0.0 [0.0, 0.0] |
| 17 Overall sleep (follow‐up values) Show forest plot | 5 | Std. Mean Difference (IV, Fixed, 95% CI) | Subtotals only | |
| 17.1 Low risk of bias | 3 | 111 | Std. Mean Difference (IV, Fixed, 95% CI) | 0.09 [‐0.28, 0.47] |
| 17.2 Unclear/high risk of bias | 2 | 77 | Std. Mean Difference (IV, Fixed, 95% CI) | ‐0.35 [‐0.80, 0.10] |
| 18 Overall sleep (change values) Show forest plot | 3 | Std. Mean Difference (IV, Random, 95% CI) | Subtotals only | |
| 18.1 Low risk of bias | 2 | 80 | Std. Mean Difference (IV, Random, 95% CI) | 0.14 [‐0.30, 0.58] |
| 18.2 Unclear/high risk of bias | 1 | 56 | Std. Mean Difference (IV, Random, 95% CI) | 0.14 [‐0.38, 0.67] |
| 19 Overall anxiety (follow‐up values) Show forest plot | 7 | Std. Mean Difference (IV, Random, 95% CI) | Subtotals only | |
| 19.1 Low risk of bias | 4 | 235 | Std. Mean Difference (IV, Random, 95% CI) | ‐0.46 [‐0.89, ‐0.03] |
| 19.2 Unclear/high risk of bias | 3 | 91 | Std. Mean Difference (IV, Random, 95% CI) | ‐0.95 [‐1.92, 0.02] |
| 20 Overall anxiety (change values) Show forest plot | 4 | Std. Mean Difference (IV, Fixed, 95% CI) | Subtotals only | |
| 20.1 Low risk of bias | 3 | 177 | Std. Mean Difference (IV, Fixed, 95% CI) | ‐0.36 [‐0.66, ‐0.06] |
| 20.2 Unclear/high risk of bias | 1 | 58 | Std. Mean Difference (IV, Fixed, 95% CI) | ‐0.42 [‐0.95, 0.10] |
| 21 Overall self‐esteem/body image (follow‐up values) Show forest plot | 12 | Std. Mean Difference (IV, Random, 95% CI) | Subtotals only | |
| 21.1 Low risk of bias | 7 | 436 | Std. Mean Difference (IV, Random, 95% CI) | 0.14 [‐0.12, 0.40] |
| 21.2 Unclear/high risk of bias | 5 | 231 | Std. Mean Difference (IV, Random, 95% CI) | 0.48 [0.16, 0.80] |
| 22 Overall self‐esteem/body image (change values) Show forest plot | 9 | Std. Mean Difference (IV, Random, 95% CI) | Subtotals only | |
| 22.1 Low risk of bias | 7 | 914 | Std. Mean Difference (IV, Random, 95% CI) | 0.07 [‐0.21, 0.34] |
| 22.2 Unclear/high risk of bias | 2 | 78 | Std. Mean Difference (IV, Random, 95% CI) | 1.72 [‐1.48, 4.92] |
| 23 Overall depression (follow‐up values) Show forest plot | 12 | Std. Mean Difference (IV, Random, 95% CI) | Subtotals only | |
| 23.1 Low risk of bias | 7 | 520 | Std. Mean Difference (IV, Random, 95% CI) | ‐0.20 [‐0.52, 0.12] |
| 23.2 Unclear/high risk of bias | 5 | 137 | Std. Mean Difference (IV, Random, 95% CI) | ‐0.67 [‐1.23, ‐0.11] |
| 24 Overall depression (change values) Show forest plot | 7 | Std. Mean Difference (IV, Random, 95% CI) | Subtotals only | |
| 24.1 Low risk of bias | 5 | 737 | Std. Mean Difference (IV, Random, 95% CI) | ‐0.20 [‐0.47, 0.06] |
| 24.2 Unclear/high risk of bias | 2 | 79 | Std. Mean Difference (IV, Random, 95% CI) | ‐0.75 [‐1.39, ‐0.10] |
| 25 Overall fatigue (follow‐up values) Show forest plot | 25 | Std. Mean Difference (IV, Random, 95% CI) | Subtotals only | |
| 25.1 Low risk of bias | 15 | 1443 | Std. Mean Difference (IV, Random, 95% CI) | ‐0.38 [‐0.59, ‐0.18] |
| 25.2 Unclear/high risk of bias | 10 | 482 | Std. Mean Difference (IV, Random, 95% CI) | ‐0.25 [‐0.45, ‐0.05] |
| 26 Overall fatigue (change values) Show forest plot | 13 | Std. Mean Difference (IV, Random, 95% CI) | Subtotals only | |
| 26.1 Low risk of bias | 8 | 1091 | Std. Mean Difference (IV, Random, 95% CI) | ‐0.22 [‐0.61, 0.16] |
| 26.2 Unclear/high risk of bias | 5 | 198 | Std. Mean Difference (IV, Random, 95% CI) | ‐0.45 [‐0.95, 0.05] |
| 27 Overall pain/disability (follow‐up values) Show forest plot | 9 | Std. Mean Difference (IV, Random, 95% CI) | Subtotals only | |
| 27.1 Low risk of bias | 4 | 169 | Std. Mean Difference (IV, Random, 95% CI) | ‐0.13 [‐0.44, 0.18] |
| 27.2 Unclear/high risk of bias | 5 | 352 | Std. Mean Difference (IV, Random, 95% CI) | 0.25 [0.04, 0.46] |
| 28 Overall pain/disability (change values) Show forest plot | 6 | Std. Mean Difference (IV, Random, 95% CI) | Subtotals only | |
| 28.1 Low risk of bias | 2 | 136 | Std. Mean Difference (IV, Random, 95% CI) | ‐0.03 [‐0.45, 0.40] |
| 28.2 Unclear/high risk of bias | 4 | 196 | Std. Mean Difference (IV, Random, 95% CI) | ‐0.05 [‐0.36, 0.26] |
| 29 Overall cardiorespiratory fitness (follow‐up values) Show forest plot | 23 | Std. Mean Difference (IV, Random, 95% CI) | Subtotals only | |
| 29.1 Low risk of bias | 10 | 657 | Std. Mean Difference (IV, Random, 95% CI) | 0.44 [0.24, 0.65] |
| 29.2 Unclear/high risk of bias | 13 | 608 | Std. Mean Difference (IV, Random, 95% CI) | 0.44 [0.23, 0.65] |
| 30 Overall cardiorespiratory fitness (change values) Show forest plot | 9 | Std. Mean Difference (IV, Random, 95% CI) | Subtotals only | |
| 30.1 Low risk of bias | 4 | 632 | Std. Mean Difference (IV, Random, 95% CI) | 0.49 [‐0.09, 1.06] |
| 30.2 Unclear/high risk of bias | 5 | 231 | Std. Mean Difference (IV, Random, 95% CI) | 1.16 [0.60, 1.72] |
| 31 Overall self‐reported physical activity (follow‐up values) Show forest plot | 17 | Std. Mean Difference (IV, Random, 95% CI) | Subtotals only | |
| 31.1 Low risk of bias | 8 | 1482 | Std. Mean Difference (IV, Random, 95% CI) | 0.45 [0.21, 0.68] |
| 31.2 Unclear/high risk of bias | 9 | 530 | Std. Mean Difference (IV, Random, 95% CI) | 0.61 [0.31, 0.91] |
| 32 Overall self‐reported physical activity (change values) Show forest plot | 8 | Std. Mean Difference (IV, Random, 95% CI) | Subtotals only | |
| 32.1 Low risk of bias | 4 | 1047 | Std. Mean Difference (IV, Random, 95% CI) | 0.27 [‐0.00, 0.55] |
| 32.2 Unclear/high risk of bias | 4 | 227 | Std. Mean Difference (IV, Random, 95% CI) | 0.99 [0.40, 1.58] |
| 33 Overall objective physical activity (follow‐up values) Show forest plot | 11 | Std. Mean Difference (IV, Random, 95% CI) | Subtotals only | |
| 33.1 Low risk of bias | 7 | 1105 | Std. Mean Difference (IV, Random, 95% CI) | 0.41 [0.15, 0.66] |
| 33.2 Unclear/high risk of bias | 4 | 165 | Std. Mean Difference (IV, Random, 95% CI) | 0.50 [‐0.24, 1.25] |
| 34 Overall objective physical activity (change values) Show forest plot | 5 | Std. Mean Difference (IV, Random, 95% CI) | Subtotals only | |
| 34.1 Low risk of bias | 3 | 447 | Std. Mean Difference (IV, Random, 95% CI) | 0.56 [‐0.18, 1.30] |
| 34.2 Unclear/high risk of bias | 2 | 61 | Std. Mean Difference (IV, Random, 95% CI) | 0.99 [0.44, 1.54] |
| 35 Mass (follow‐up values) Show forest plot | 16 | Mean Difference (IV, Fixed, 95% CI) | Subtotals only | |
| 35.1 Low risk of bias | 8 | 828 | Mean Difference (IV, Fixed, 95% CI) | 0.05 [‐0.54, 0.64] |
| 35.2 Unclear/high risk of bias | 8 | 382 | Mean Difference (IV, Fixed, 95% CI) | ‐1.28 [‐4.26, 1.70] |
| 36 Mass (change values) Show forest plot | 11 | Mean Difference (IV, Random, 95% CI) | Subtotals only | |
| 36.1 Low risk of bias | 5 | 819 | Mean Difference (IV, Random, 95% CI) | ‐0.43 [‐1.05, 0.20] |
| 36.2 Unclear/high risk of bias | 6 | 228 | Mean Difference (IV, Random, 95% CI) | ‐0.62 [‐1.44, 0.19] |
| 37 BMI (follow‐up values) Show forest plot | 17 | Mean Difference (IV, Fixed, 95% CI) | Subtotals only | |
| 37.1 Low risk of bias | 10 | 1162 | Mean Difference (IV, Fixed, 95% CI) | 0.05 [‐0.16, 0.26] |
| 37.2 Unclear/high risk of bias | 7 | 319 | Mean Difference (IV, Fixed, 95% CI) | ‐1.07 [‐2.29, 0.14] |
| 38 BMI (change values) Show forest plot | 8 | Mean Difference (IV, Random, 95% CI) | Subtotals only | |
| 38.1 Low risk of bias | 5 | 363 | Mean Difference (IV, Random, 95% CI) | ‐0.24 [‐0.56, 0.08] |
| 38.2 Unclear/high risk of bias | 3 | 122 | Mean Difference (IV, Random, 95% CI) | ‐0.20 [‐0.65, 0.25] |
| 39 Overall body fat (follow‐up values) Show forest plot | 18 | Std. Mean Difference (IV, Random, 95% CI) | Subtotals only | |
| 39.1 Low risk of bias | 10 | 768 | Std. Mean Difference (IV, Random, 95% CI) | ‐0.19 [‐0.41, 0.03] |
| 39.2 Unclear/high risk of bias | 8 | 394 | Std. Mean Difference (IV, Random, 95% CI) | ‐0.17 [‐0.40, 0.07] |
| 40 Overall body fat (change values) Show forest plot | 9 | Std. Mean Difference (IV, Random, 95% CI) | Subtotals only | |
| 40.1 Low risk of bias | 5 | 341 | Std. Mean Difference (IV, Random, 95% CI) | ‐0.87 [‐1.86, 0.12] |
| 40.2 Unclear/high risk of bias | 4 | 158 | Std. Mean Difference (IV, Random, 95% CI) | ‐0.30 [‐0.62, 0.01] |
| 41 Lower body strength (follow‐up values) Show forest plot | 10 | Std. Mean Difference (IV, Random, 95% CI) | Subtotals only | |
| 41.1 Low risk of bias | 5 | 440 | Std. Mean Difference (IV, Random, 95% CI) | 0.61 [0.22, 1.00] |
| 41.2 Unclear/high risk of bias | 5 | 197 | Std. Mean Difference (IV, Random, 95% CI) | 0.23 [‐0.32, 0.79] |
| 42 Lower body strength (change values) Show forest plot | 8 | Std. Mean Difference (IV, Random, 95% CI) | Subtotals only | |
| 42.1 Low risk of bias | 3 | 339 | Std. Mean Difference (IV, Random, 95% CI) | 0.97 [0.70, 1.25] |
| 42.2 Unclear/high risk of bias | 5 | 381 | Std. Mean Difference (IV, Random, 95% CI) | 0.46 [0.04, 0.88] |
| 43 Upper body strength (follow‐up values) Show forest plot | 13 | Std. Mean Difference (IV, Random, 95% CI) | Subtotals only | |
| 43.1 Low risk of bias | 7 | 516 | Std. Mean Difference (IV, Random, 95% CI) | 0.53 [0.04, 1.01] |
| 43.2 Unclear/high risk of bias | 6 | 252 | Std. Mean Difference (IV, Random, 95% CI) | 0.29 [‐0.21, 0.78] |
| 44 Upper body strength (change values) Show forest plot | 9 | Std. Mean Difference (IV, Random, 95% CI) | Subtotals only | |
| 44.1 Low risk of bias | 4 | 381 | Std. Mean Difference (IV, Random, 95% CI) | 1.13 [0.46, 1.80] |
| 44.2 Unclear/high risk of bias | 5 | 487 | Std. Mean Difference (IV, Random, 95% CI) | 0.43 [‐0.05, 0.91] |
| 45 Bone mineral density ‐ femoral neck (follow‐up and change values) Show forest plot | 4 | Std. Mean Difference (IV, Random, 95% CI) | Subtotals only | |
| 45.1 Low risk of bias | 1 | 457 | Std. Mean Difference (IV, Random, 95% CI) | 0.18 [‐0.00, 0.37] |
| 45.2 Unclear/high risk of bias | 3 | 329 | Std. Mean Difference (IV, Random, 95% CI) | 0.18 [‐0.39, 0.75] |
| 46 Bone mineral density ‐ lumbar spine (follow‐up and change values) Show forest plot | 4 | Std. Mean Difference (IV, Random, 95% CI) | Subtotals only | |
| 46.1 Low risk of bias | 1 | 457 | Std. Mean Difference (IV, Random, 95% CI) | 0.09 [‐0.09, 0.27] |
| 46.2 Unclear/high risk of bias | 3 | 329 | Std. Mean Difference (IV, Random, 95% CI) | 0.27 [‐0.16, 0.70] |