Actividad física para las pacientes con cáncer de mama después del tratamiento adyuvante
Información
- DOI:
- https://doi.org/10.1002/14651858.CD011292.pub2Copiar DOI

- Base de datos:
-
- Cochrane Database of Systematic Reviews
- Versión publicada:
-
- 29 enero 2018see what's new
- Tipo:
-
- Intervention
- Etapa:
-
- Review
- Grupo Editorial Cochrane:
-
Grupo Cochrane de Cáncer de mama
- Copyright:
-
- Copyright © 2018 The Cochrane Collaboration. Published by John Wiley & Sons, Ltd.
Cifras del artículo
Altmetric:
Citado por:
Autores
Contributions of authors
-
Drafting the protocol: IML, GSM, ANM, ARC.
-
Selecting studies: IML, GSM.
-
Extracting data from studies: IML, GSM.
-
Entering data into RevMan: IML.
-
Carrying out the analysis: IML, GSM, ANM.
-
Interpreting the analysis: IML, GSM, ANM.
-
Drafting the final review: IML, GSM, ANM, ARC.
-
Resolving disagreements: ANM, ARC.
-
Updating the review: IML, GSM.
Sources of support
Internal sources
-
No support provided, UK.
External sources
-
No support provided, UK.
Declarations of interest
None known.
Acknowledgements
The review authors would like to thank Melina Willson and Fergus Tai for their assistance in completing this current protocol.
Version history
| Published | Title | Stage | Authors | Version |
| 2018 Jan 29 | Physical activity for women with breast cancer after adjuvant therapy | Review | Ian M Lahart, George S Metsios, Alan M Nevill, Amtul R Carmichael | |
| 2014 Sep 08 | Physical activity for women with breast cancer after adjuvant therapy | Protocol | Ian M Lahart, George S Metsios, Alan M Nevill, Amtul R Carmichael | |
Differences between protocol and review
Review authors did not perform planned analysis of effects of physical activity on blood biomarkers because we considered these outcomes to be beyond the scope of the current review, and because the prognostic value of blood biomarkers for breast cancer populations remains uncertain (Ballard‐Barbash 2012). We originally planned to conduct a subgroup analysis by treatment regimen (chemotherapy vs no chemotherapy). However, the numbers of trials conducted with patients who had not undergone chemotherapy were insufficient for performance of this analysis.
Keywords
MeSH
Medical Subject Headings (MeSH) Keywords
Medical Subject Headings Check Words
Female; Humans;
PICO

Study flow diagram.
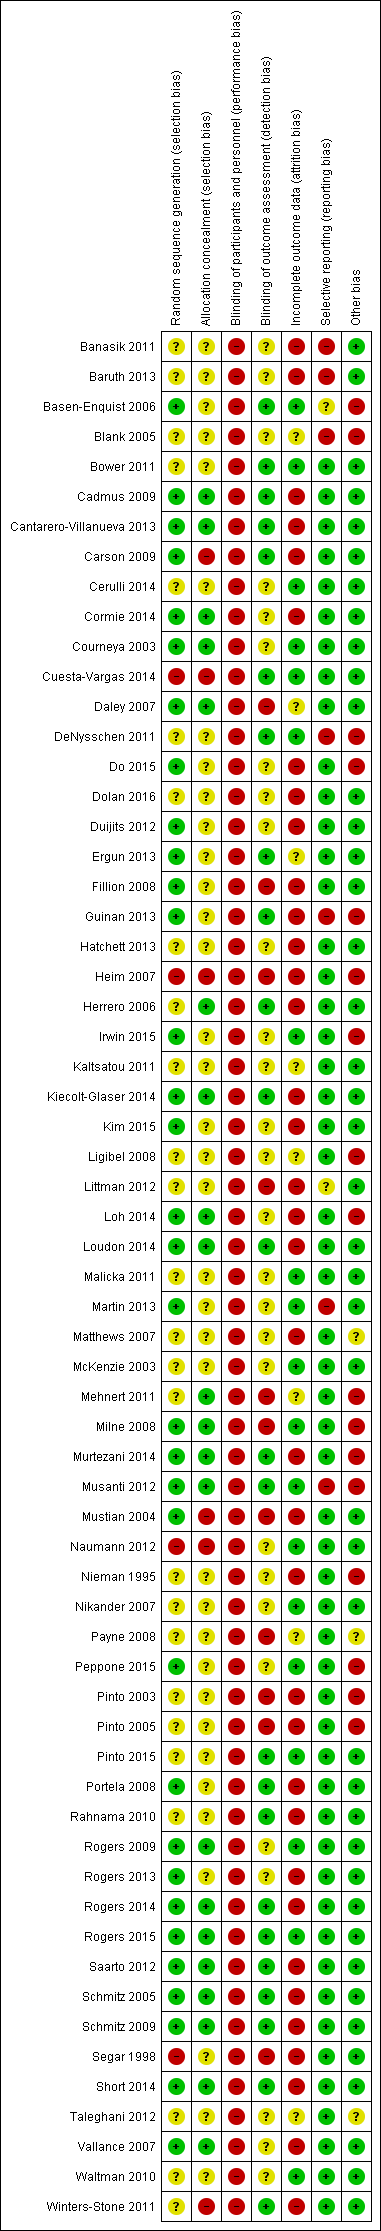
Risk of bias summary: review authors' judgements about each risk of bias item for each included study.
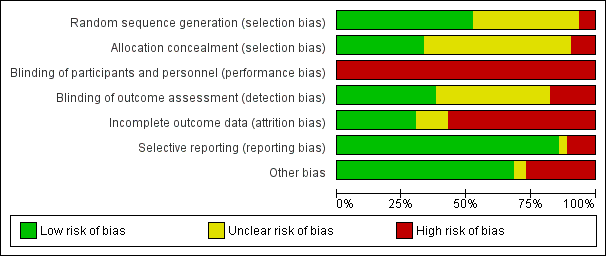
Risk of bias graph: review authors' judgements about each risk of bias item presented as percentages across all included studies.

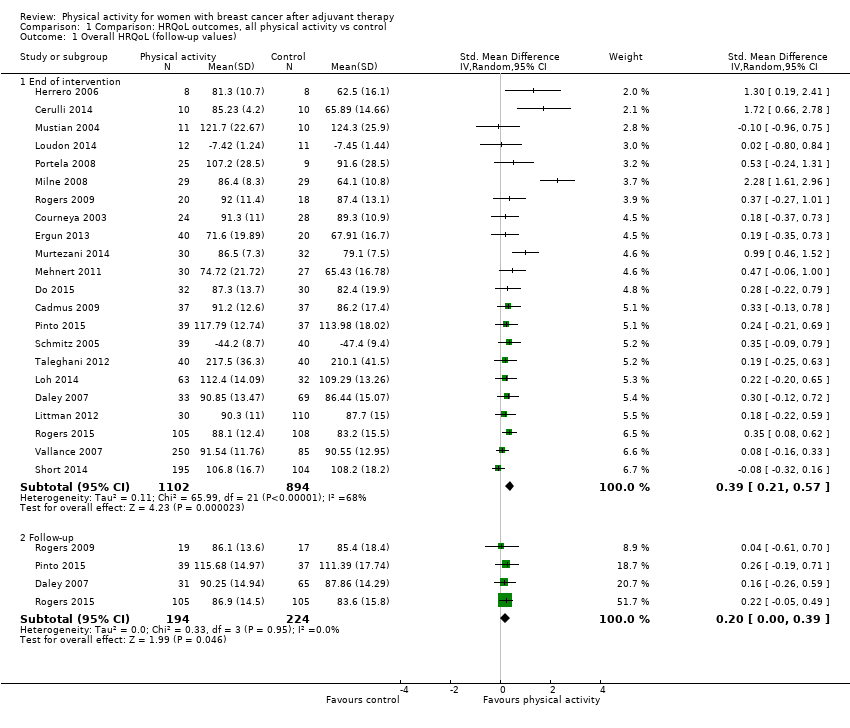
Forest plot of comparison: 1 Comparison: HRQoL outcomes, all physical activity vs control, outcome: 1.1 Overall HRQoL (follow‐up values).

Forest plot of comparison: 1 Comparison: HRQoL outcomes, all physical activity vs control, outcome: 1.2 Overall HRQoL (change values).
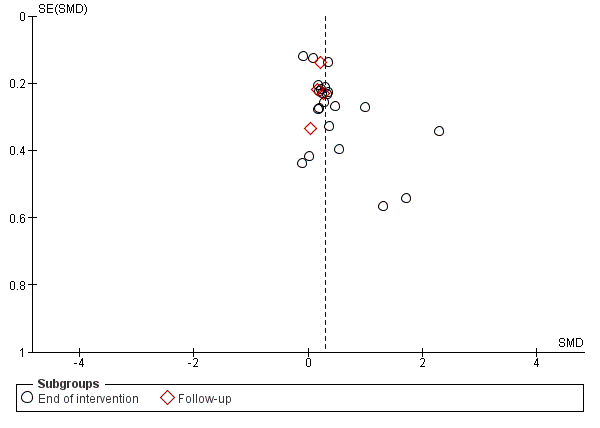
Funnel plot of comparison: 1 Comparison: HRQoL outcomes, all physical activity vs control, outcome: 1.1 Overall HRQoL (follow‐up values).
Comparison 1 Comparison: HRQoL outcomes, all physical activity vs control, Outcome 1 Overall HRQoL (follow‐up values).
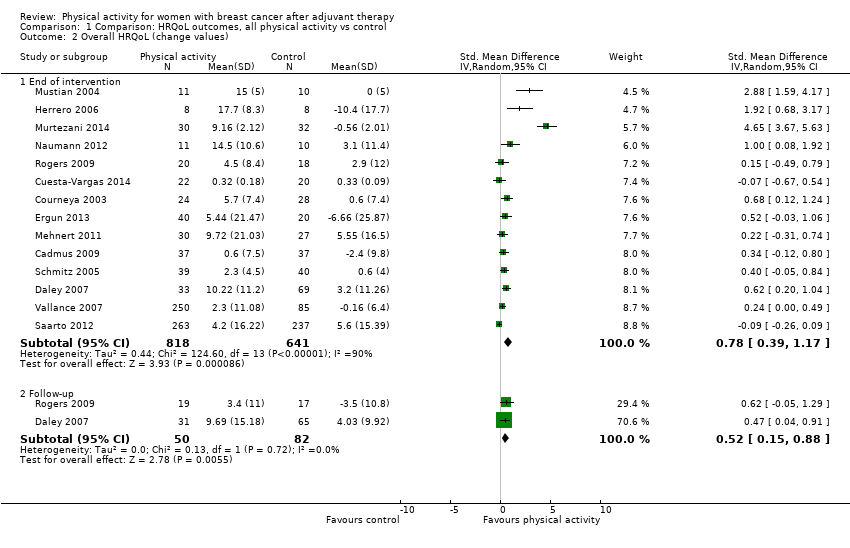
Comparison 1 Comparison: HRQoL outcomes, all physical activity vs control, Outcome 2 Overall HRQoL (change values).

Comparison 1 Comparison: HRQoL outcomes, all physical activity vs control, Outcome 3 FACT‐G (follow‐up values).
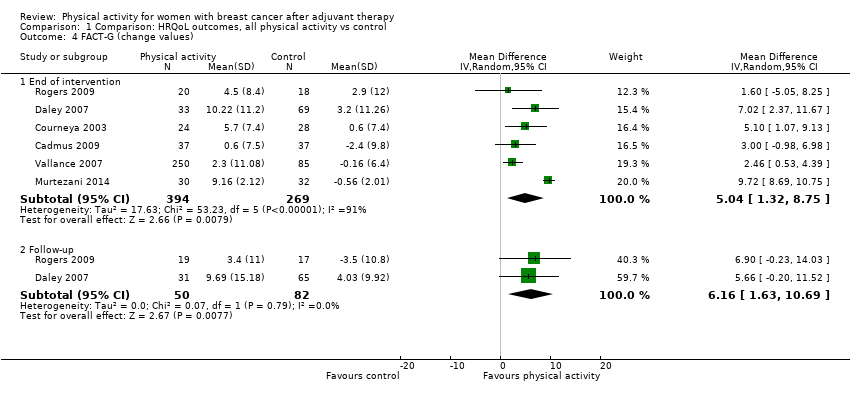
Comparison 1 Comparison: HRQoL outcomes, all physical activity vs control, Outcome 4 FACT‐G (change values).

Comparison 1 Comparison: HRQoL outcomes, all physical activity vs control, Outcome 5 FACT‐B (follow‐up values).
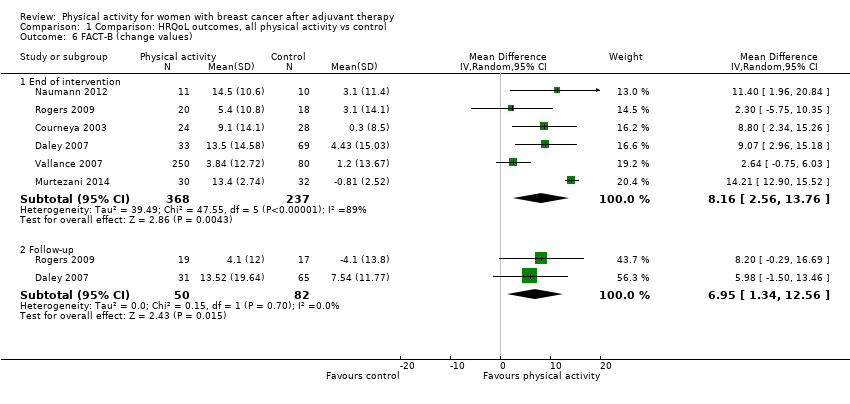
Comparison 1 Comparison: HRQoL outcomes, all physical activity vs control, Outcome 6 FACT‐B (change values).

Comparison 1 Comparison: HRQoL outcomes, all physical activity vs control, Outcome 7 FACT Breast Cancer Subscale (follow‐up values).
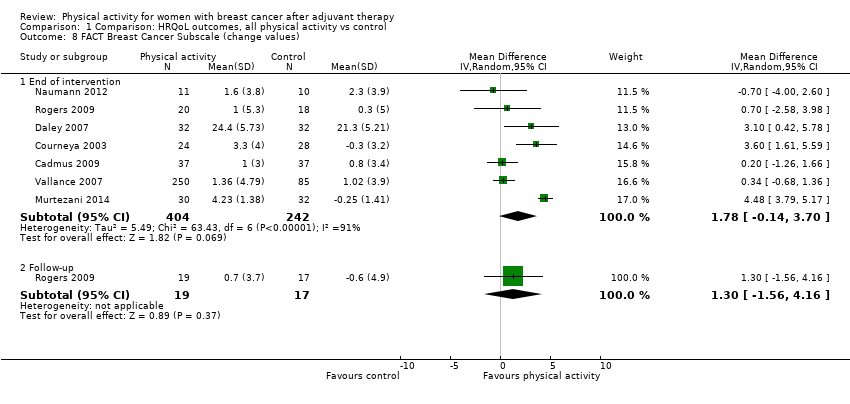
Comparison 1 Comparison: HRQoL outcomes, all physical activity vs control, Outcome 8 FACT Breast Cancer Subscale (change values).
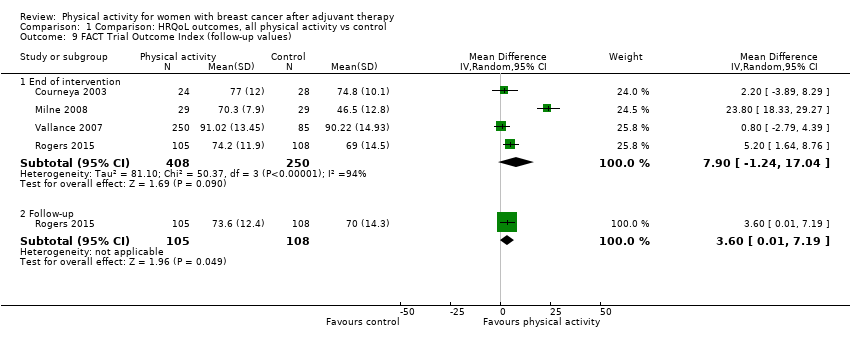
Comparison 1 Comparison: HRQoL outcomes, all physical activity vs control, Outcome 9 FACT Trial Outcome Index (follow‐up values).

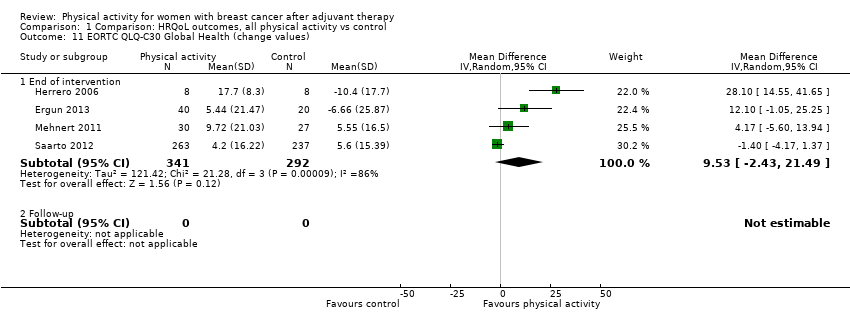
Comparison 1 Comparison: HRQoL outcomes, all physical activity vs control, Outcome 10 EORTC QLQ‐C30 Global Health (follow‐up values).
Comparison 1 Comparison: HRQoL outcomes, all physical activity vs control, Outcome 11 EORTC QLQ‐C30 Global Health (change values).
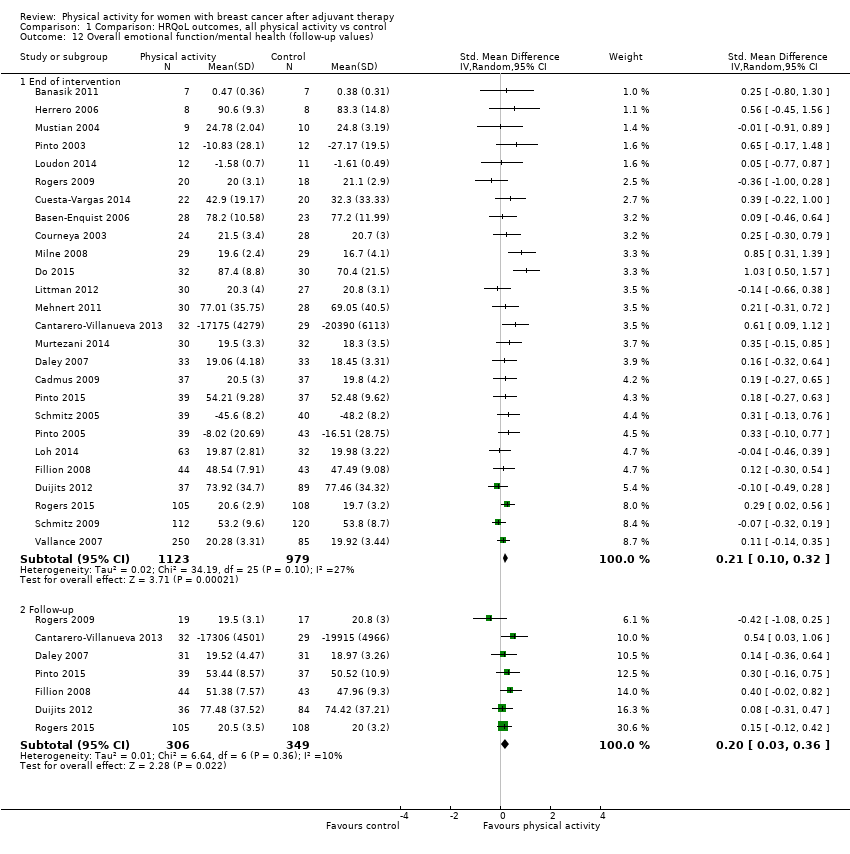
Comparison 1 Comparison: HRQoL outcomes, all physical activity vs control, Outcome 12 Overall emotional function/mental health (follow‐up values).

Comparison 1 Comparison: HRQoL outcomes, all physical activity vs control, Outcome 13 Overall emotional function/mental health (change values).

Comparison 1 Comparison: HRQoL outcomes, all physical activity vs control, Outcome 14 FACT Emotional well‐being (follow‐up values).

Comparison 1 Comparison: HRQoL outcomes, all physical activity vs control, Outcome 15 FACT Emotional well‐being (change values).
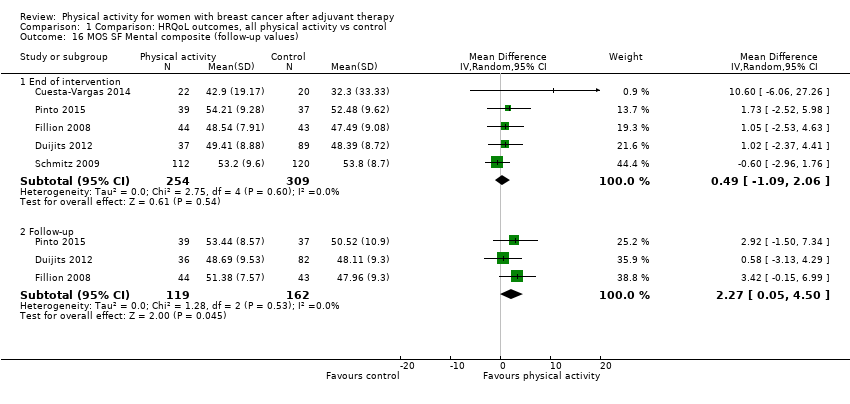
Comparison 1 Comparison: HRQoL outcomes, all physical activity vs control, Outcome 16 MOS SF Mental composite (follow‐up values).
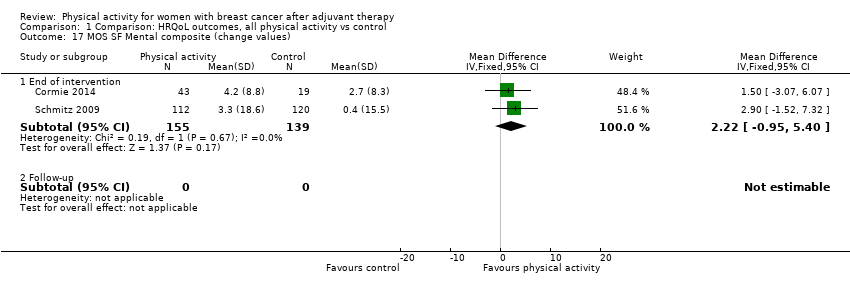
Comparison 1 Comparison: HRQoL outcomes, all physical activity vs control, Outcome 17 MOS SF Mental composite (change values).

Comparison 1 Comparison: HRQoL outcomes, all physical activity vs control, Outcome 18 MOS SF Mental health (follow‐up values).

Comparison 1 Comparison: HRQoL outcomes, all physical activity vs control, Outcome 19 MOS SF Mental health (change values).

Comparison 1 Comparison: HRQoL outcomes, all physical activity vs control, Outcome 20 MOS SF Emotional role (follow‐up values).

Comparison 1 Comparison: HRQoL outcomes, all physical activity vs control, Outcome 21 MOS SF Emotional role (change values).

Comparison 1 Comparison: HRQoL outcomes, all physical activity vs control, Outcome 22 EORTC QLQ‐C30 Emotional function (follow‐up values).

Comparison 1 Comparison: HRQoL outcomes, all physical activity vs control, Outcome 23 EORTC QLQ‐C30 Emotional function (change values).
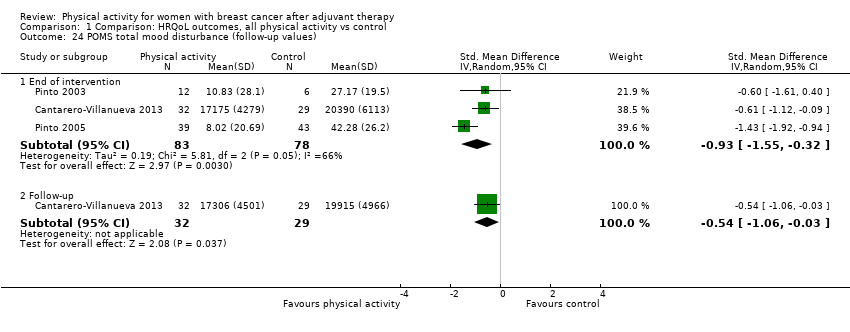
Comparison 1 Comparison: HRQoL outcomes, all physical activity vs control, Outcome 24 POMS total mood disturbance (follow‐up values).
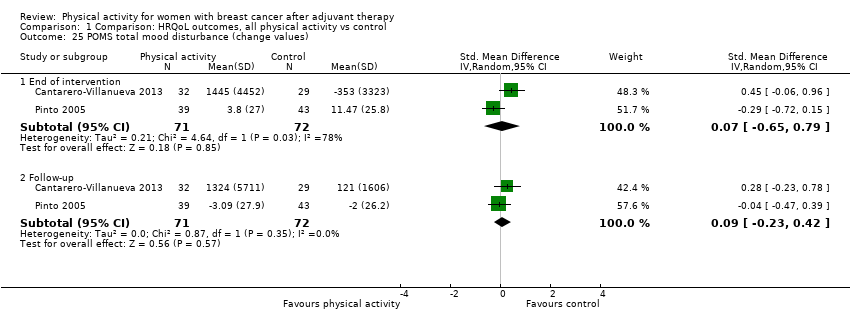
Comparison 1 Comparison: HRQoL outcomes, all physical activity vs control, Outcome 25 POMS total mood disturbance (change values).

Comparison 1 Comparison: HRQoL outcomes, all physical activity vs control, Outcome 26 POMS anger subscale (follow‐up values).
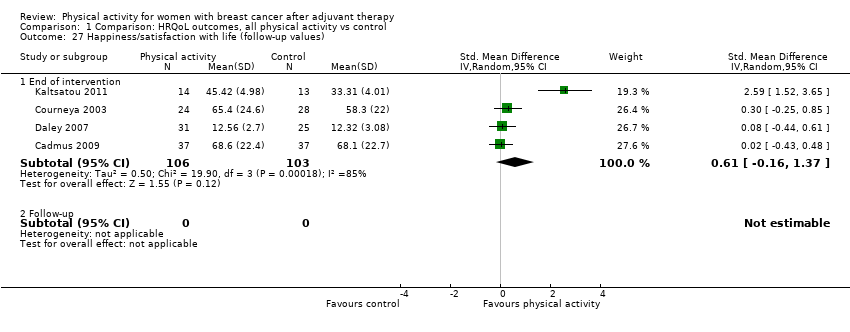
Comparison 1 Comparison: HRQoL outcomes, all physical activity vs control, Outcome 27 Happiness/satisfaction with life (follow‐up values).

Comparison 1 Comparison: HRQoL outcomes, all physical activity vs control, Outcome 28 Happiness/satisfaction with life (change values).
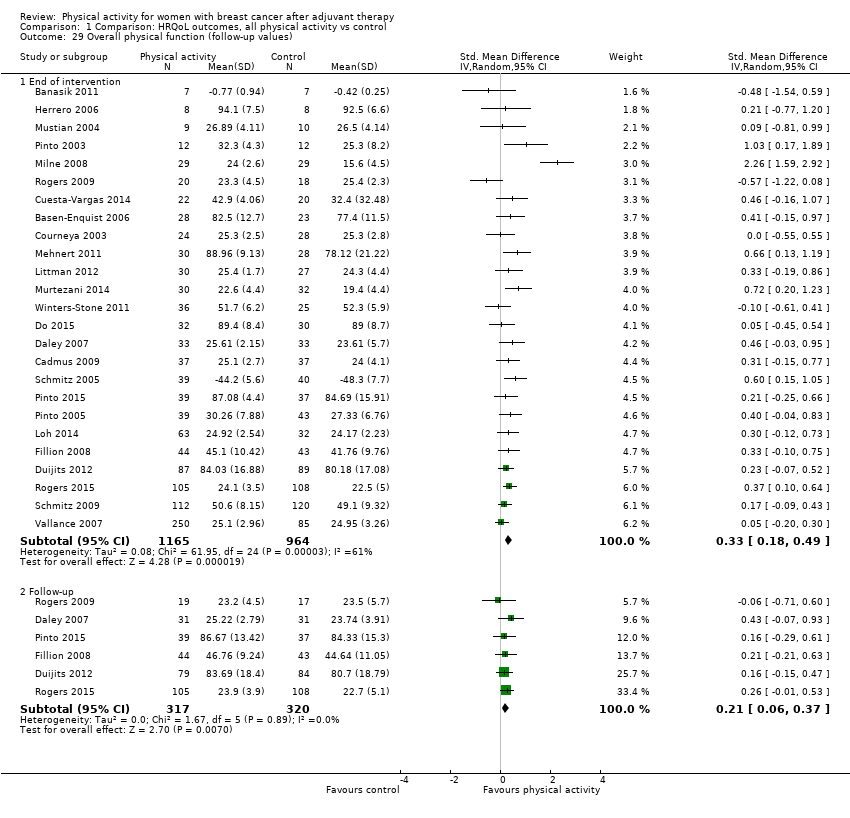
Comparison 1 Comparison: HRQoL outcomes, all physical activity vs control, Outcome 29 Overall physical function (follow‐up values).
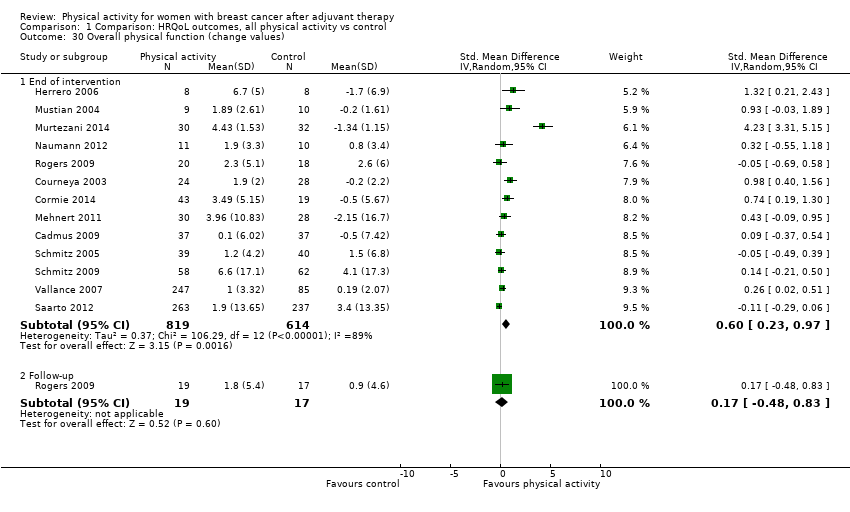
Comparison 1 Comparison: HRQoL outcomes, all physical activity vs control, Outcome 30 Overall physical function (change values).
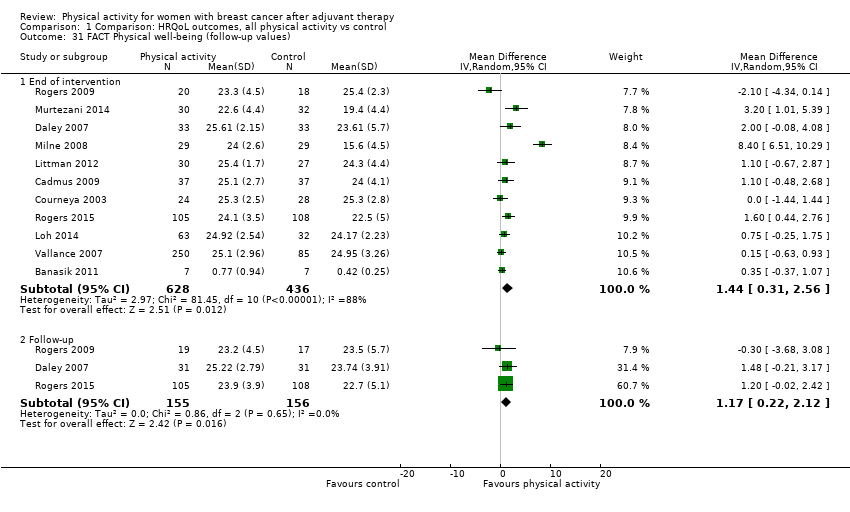
Comparison 1 Comparison: HRQoL outcomes, all physical activity vs control, Outcome 31 FACT Physical well‐being (follow‐up values).

Comparison 1 Comparison: HRQoL outcomes, all physical activity vs control, Outcome 32 FACT Physical well‐being (change values).
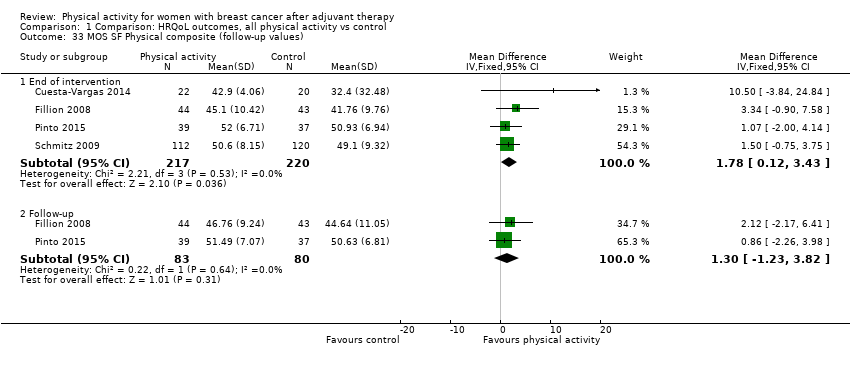
Comparison 1 Comparison: HRQoL outcomes, all physical activity vs control, Outcome 33 MOS SF Physical composite (follow‐up values).

Comparison 1 Comparison: HRQoL outcomes, all physical activity vs control, Outcome 34 MOS SF Physical composite (change values).
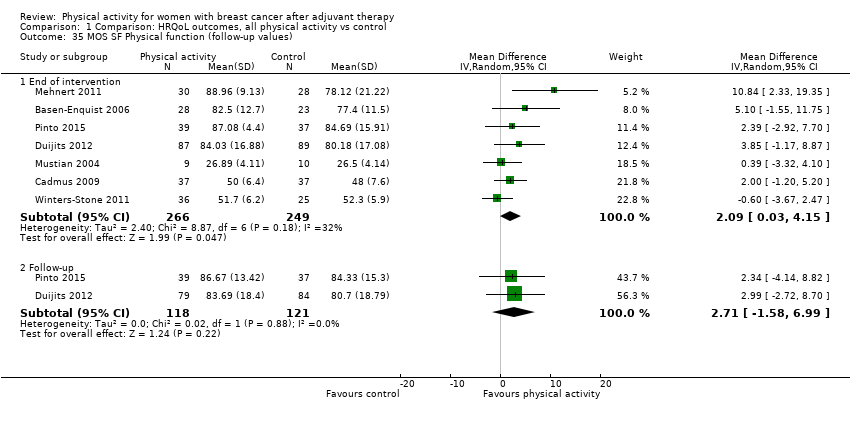
Comparison 1 Comparison: HRQoL outcomes, all physical activity vs control, Outcome 35 MOS SF Physical function (follow‐up values).

Comparison 1 Comparison: HRQoL outcomes, all physical activity vs control, Outcome 36 MOS SF Physical function (change values).
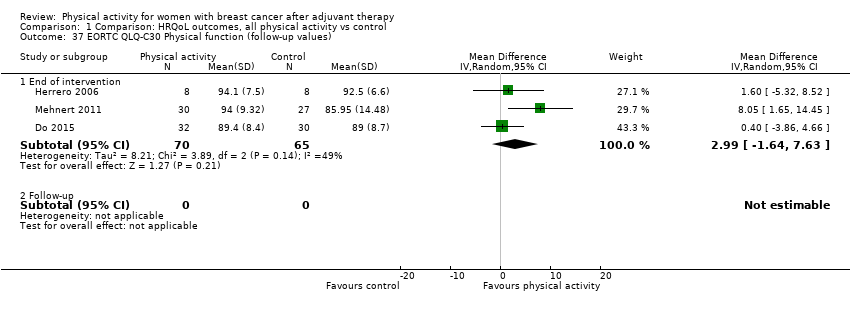
Comparison 1 Comparison: HRQoL outcomes, all physical activity vs control, Outcome 37 EORTC QLQ‐C30 Physical function (follow‐up values).
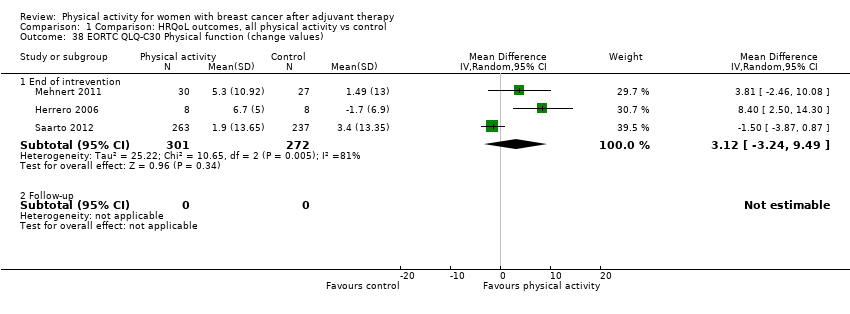
Comparison 1 Comparison: HRQoL outcomes, all physical activity vs control, Outcome 38 EORTC QLQ‐C30 Physical function (change values).

Comparison 1 Comparison: HRQoL outcomes, all physical activity vs control, Outcome 39 Body Esteem Scale ‐ Physical condition (follow‐up values).
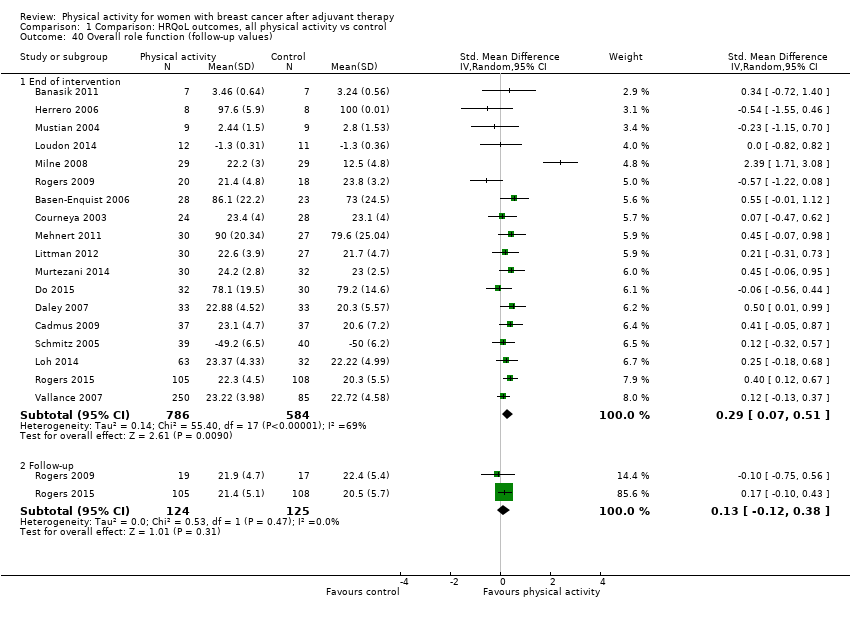
Comparison 1 Comparison: HRQoL outcomes, all physical activity vs control, Outcome 40 Overall role function (follow‐up values).

Comparison 1 Comparison: HRQoL outcomes, all physical activity vs control, Outcome 41 Overall role function (change values).

Comparison 1 Comparison: HRQoL outcomes, all physical activity vs control, Outcome 42 FACT Functional well‐being (follow‐up values).

Comparison 1 Comparison: HRQoL outcomes, all physical activity vs control, Outcome 43 FACT Functional well‐being (change values).
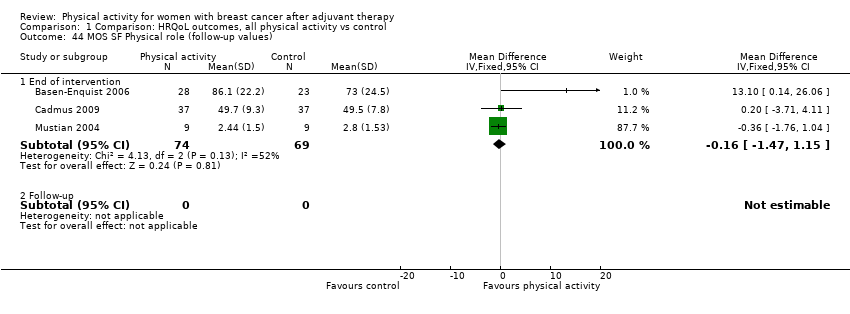
Comparison 1 Comparison: HRQoL outcomes, all physical activity vs control, Outcome 44 MOS SF Physical role (follow‐up values).
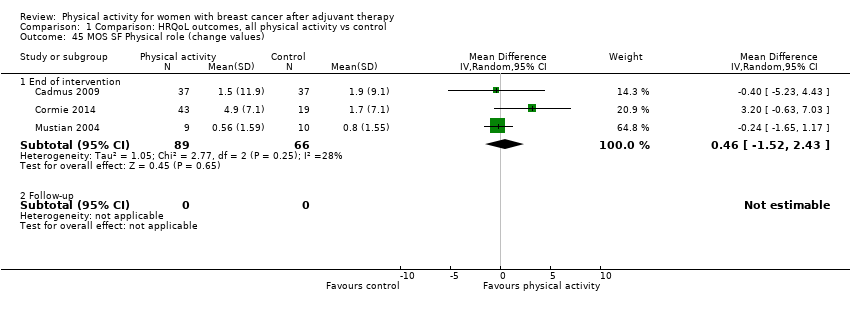
Comparison 1 Comparison: HRQoL outcomes, all physical activity vs control, Outcome 45 MOS SF Physical role (change values).

Comparison 1 Comparison: HRQoL outcomes, all physical activity vs control, Outcome 46 EORTC QLQ‐C30 Role function (follow‐up values).
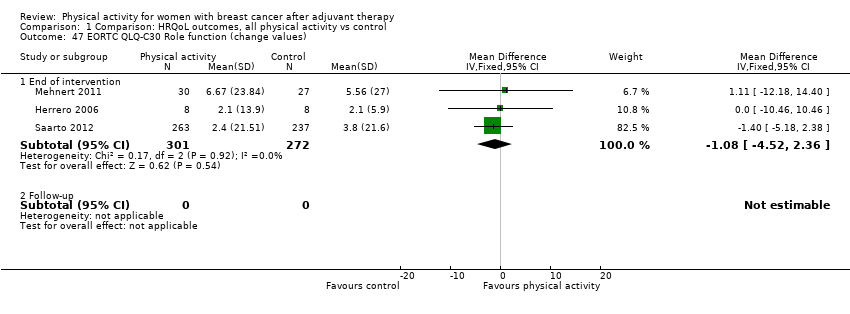
Comparison 1 Comparison: HRQoL outcomes, all physical activity vs control, Outcome 47 EORTC QLQ‐C30 Role function (change values).

Comparison 1 Comparison: HRQoL outcomes, all physical activity vs control, Outcome 48 Overall social well‐being/function (follow‐up values).
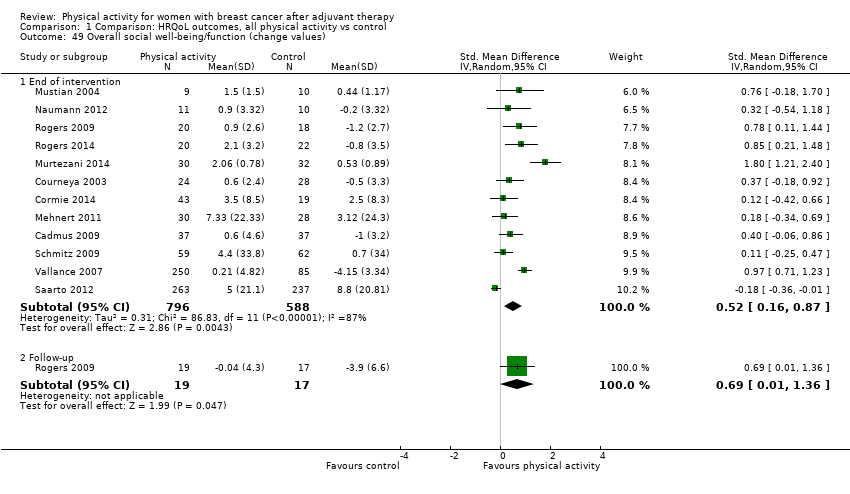
Comparison 1 Comparison: HRQoL outcomes, all physical activity vs control, Outcome 49 Overall social well‐being/function (change values).

Comparison 1 Comparison: HRQoL outcomes, all physical activity vs control, Outcome 50 FACT Social well‐being (follow‐up values).

Comparison 1 Comparison: HRQoL outcomes, all physical activity vs control, Outcome 51 FACT Social well‐being (change values).

Comparison 1 Comparison: HRQoL outcomes, all physical activity vs control, Outcome 52 MOS SF Social functioning (follow‐up values).

Comparison 1 Comparison: HRQoL outcomes, all physical activity vs control, Outcome 53 MOS SF Social functioning (change values).

Comparison 1 Comparison: HRQoL outcomes, all physical activity vs control, Outcome 54 EORTC QLQ‐C30 Social function (follow‐up values).

Comparison 1 Comparison: HRQoL outcomes, all physical activity vs control, Outcome 55 EORTC QLQ‐C30 Social function (change values).
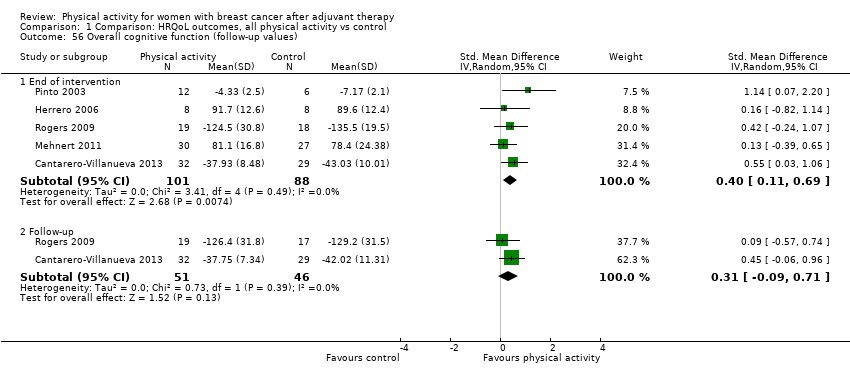
Comparison 1 Comparison: HRQoL outcomes, all physical activity vs control, Outcome 56 Overall cognitive function (follow‐up values).

Comparison 1 Comparison: HRQoL outcomes, all physical activity vs control, Outcome 57 Overall cognitive function (change values).

Comparison 1 Comparison: HRQoL outcomes, all physical activity vs control, Outcome 58 EORTC QLQ‐C30 Cognitive function (follow‐up values).

Comparison 1 Comparison: HRQoL outcomes, all physical activity vs control, Outcome 59 EORTC QLQ‐C30 Cognitive function (change values).
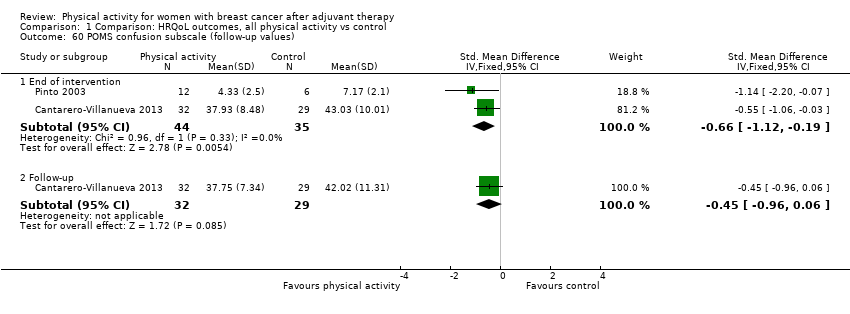
Comparison 1 Comparison: HRQoL outcomes, all physical activity vs control, Outcome 60 POMS confusion subscale (follow‐up values).

Comparison 1 Comparison: HRQoL outcomes, all physical activity vs control, Outcome 61 Overall general health (follow‐up values).

Comparison 1 Comparison: HRQoL outcomes, all physical activity vs control, Outcome 62 Overall general health (change values).

Comparison 1 Comparison: HRQoL outcomes, all physical activity vs control, Outcome 63 MOS SF General health (follow‐up values).

Comparison 1 Comparison: HRQoL outcomes, all physical activity vs control, Outcome 64 MOS SF General health (change values).

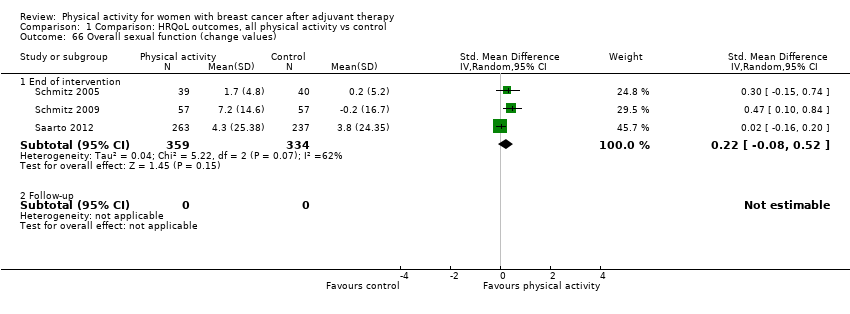
Comparison 1 Comparison: HRQoL outcomes, all physical activity vs control, Outcome 65 Overall sexual function (follow‐up values).
Comparison 1 Comparison: HRQoL outcomes, all physical activity vs control, Outcome 66 Overall sexual function (change values).

Comparison 1 Comparison: HRQoL outcomes, all physical activity vs control, Outcome 67 Body Esteem Scale ‐ sexual attractiveness (follow‐up values).

Comparison 1 Comparison: HRQoL outcomes, all physical activity vs control, Outcome 68 Overall sleep (follow‐up values).
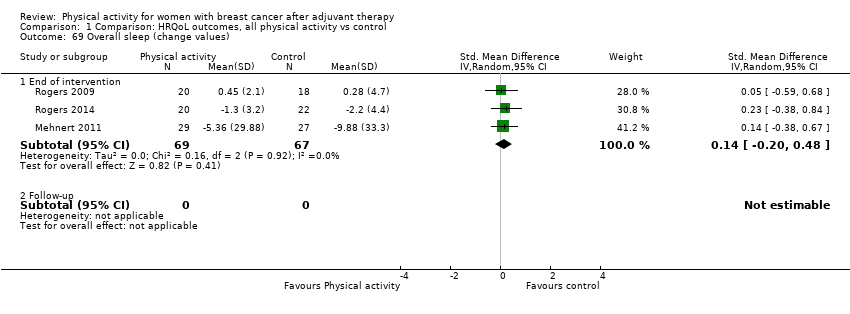
Comparison 1 Comparison: HRQoL outcomes, all physical activity vs control, Outcome 69 Overall sleep (change values).

Comparison 1 Comparison: HRQoL outcomes, all physical activity vs control, Outcome 70 PSQI Global sleep score (follow‐up values).
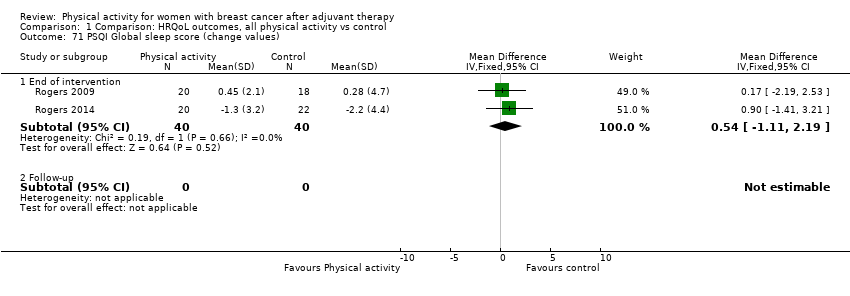
Comparison 1 Comparison: HRQoL outcomes, all physical activity vs control, Outcome 71 PSQI Global sleep score (change values).

Comparison 1 Comparison: HRQoL outcomes, all physical activity vs control, Outcome 72 PSQI sleep quality (follow‐up values).

Comparison 1 Comparison: HRQoL outcomes, all physical activity vs control, Outcome 73 PSQI sleep efficiency (follow‐up values).

Comparison 1 Comparison: HRQoL outcomes, all physical activity vs control, Outcome 74 PSQI sleep latency (follow‐up values).
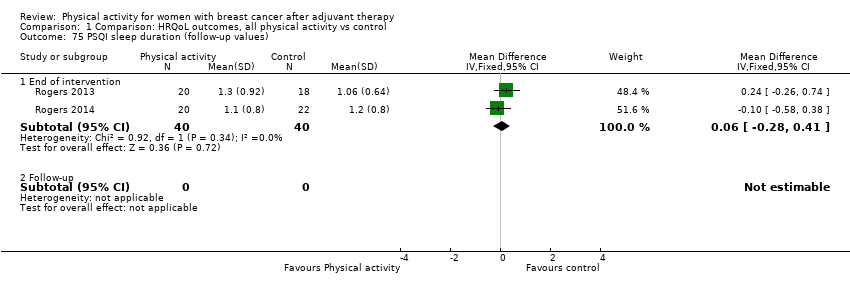
Comparison 1 Comparison: HRQoL outcomes, all physical activity vs control, Outcome 75 PSQI sleep duration (follow‐up values).
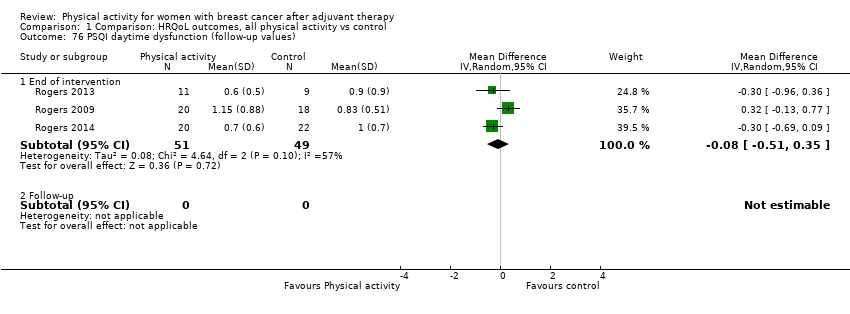
Comparison 1 Comparison: HRQoL outcomes, all physical activity vs control, Outcome 76 PSQI daytime dysfunction (follow‐up values).

Comparison 1 Comparison: HRQoL outcomes, all physical activity vs control, Outcome 77 PSQI medication use (follow‐up values).
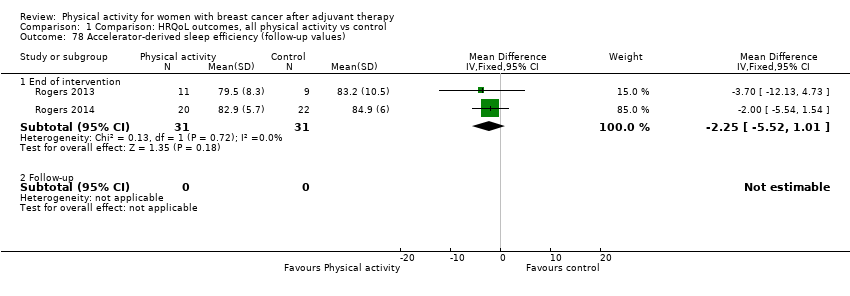
Comparison 1 Comparison: HRQoL outcomes, all physical activity vs control, Outcome 78 Accelerator‐derived sleep efficiency (follow‐up values).

Comparison 1 Comparison: HRQoL outcomes, all physical activity vs control, Outcome 79 Accelerator‐derived sleep latency (follow‐up values).

Comparison 2 Comparison: anxiety, all physical activity vs control, Outcome 1 Overall anxiety (follow‐up values).

Comparison 2 Comparison: anxiety, all physical activity vs control, Outcome 2 Overall anxiety (change values).

Comparison 2 Comparison: anxiety, all physical activity vs control, Outcome 3 POMS tension ‐ anxiety (follow‐up values).
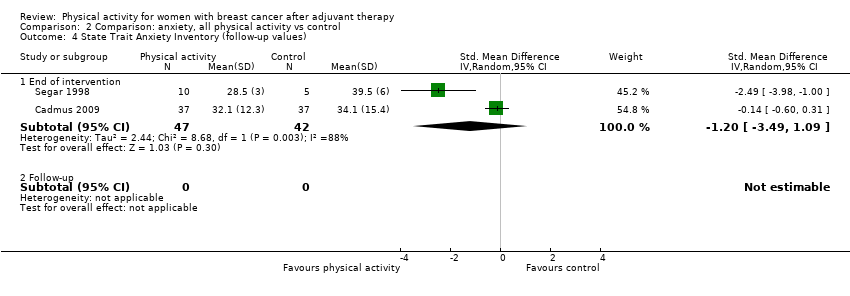
Comparison 2 Comparison: anxiety, all physical activity vs control, Outcome 4 State Trait Anxiety Inventory (follow‐up values).

Comparison 2 Comparison: anxiety, all physical activity vs control, Outcome 5 Cohen's Perceived Stress Scale.

Comparison 3 Comparison: depression, all physical activity vs control, Outcome 1 Overall depression (follow‐up values).
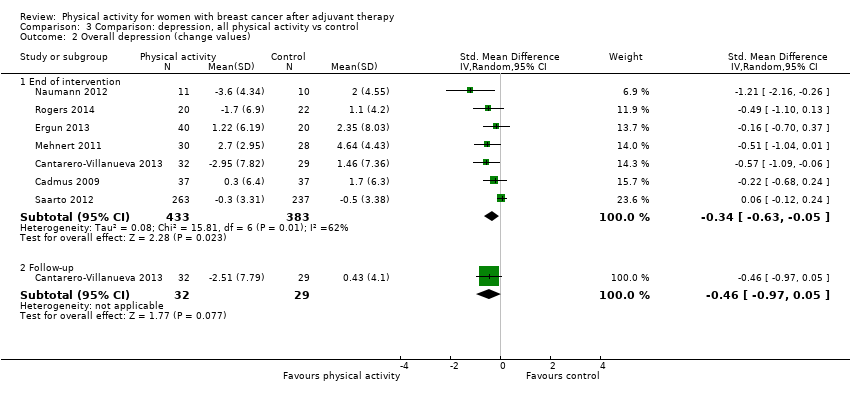
Comparison 3 Comparison: depression, all physical activity vs control, Outcome 2 Overall depression (change values).

Comparison 3 Comparison: depression, all physical activity vs control, Outcome 3 Beck Depression Inventory‐II (follow‐up values).

Comparison 3 Comparison: depression, all physical activity vs control, Outcome 4 Beck Depression Inventory‐II (change values).

Comparison 3 Comparison: depression, all physical activity vs control, Outcome 5 CES‐Depression scale (follow‐up values).

Comparison 3 Comparison: depression, all physical activity vs control, Outcome 6 POMS depression subscale (follow‐up values).

Comparison 3 Comparison: depression, all physical activity vs control, Outcome 7 POMS tension subscale (follow‐up values).
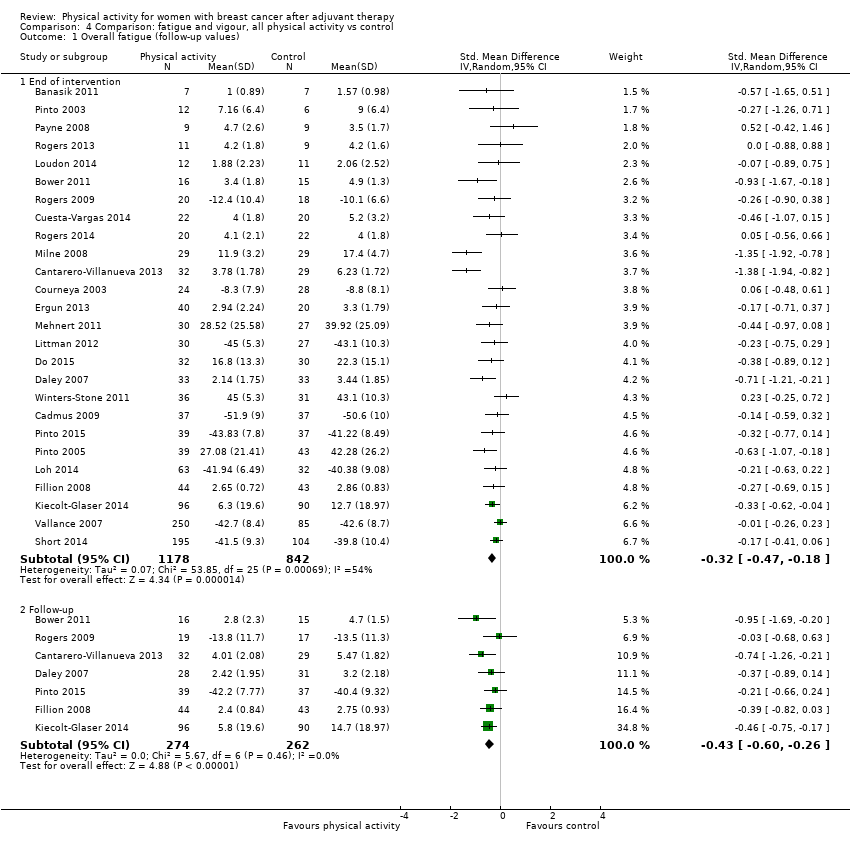
Comparison 4 Comparison: fatigue and vigour, all physical activity vs control, Outcome 1 Overall fatigue (follow‐up values).

Comparison 4 Comparison: fatigue and vigour, all physical activity vs control, Outcome 2 Overall fatigue (change values).
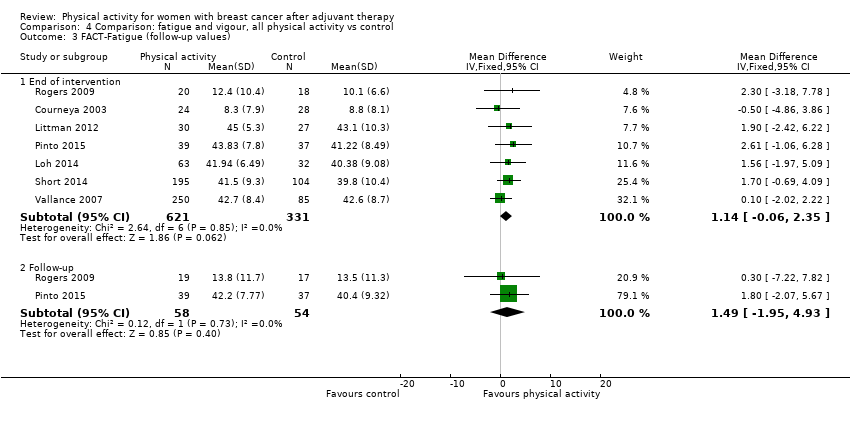
Comparison 4 Comparison: fatigue and vigour, all physical activity vs control, Outcome 3 FACT‐Fatigue (follow‐up values).

Comparison 4 Comparison: fatigue and vigour, all physical activity vs control, Outcome 4 FACT‐Fatigue (change values).
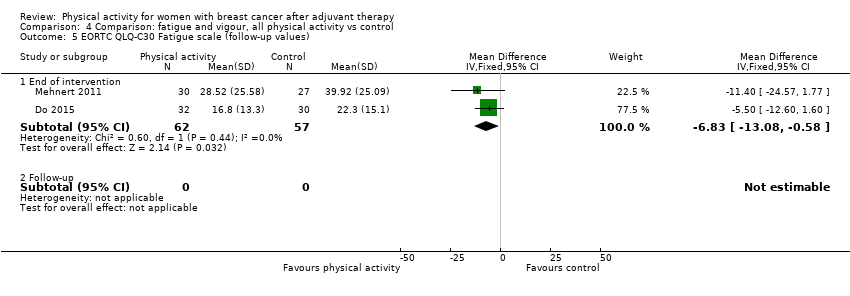
Comparison 4 Comparison: fatigue and vigour, all physical activity vs control, Outcome 5 EORTC QLQ‐C30 Fatigue scale (follow‐up values).

Comparison 4 Comparison: fatigue and vigour, all physical activity vs control, Outcome 6 EORTC QLQ‐C30 Fatigue scale (change values).
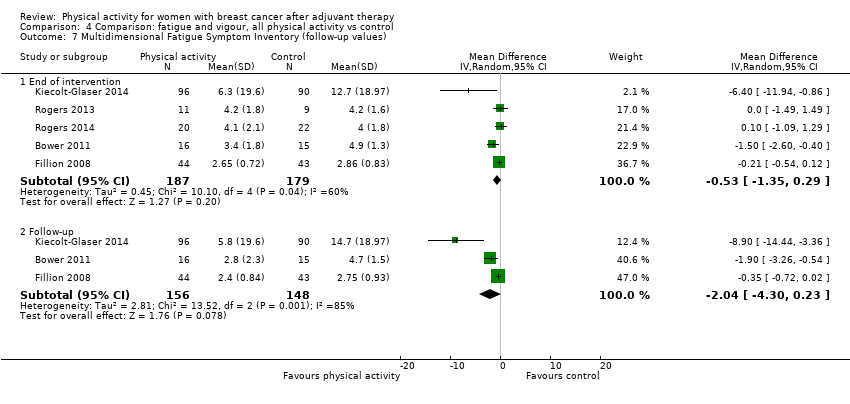
Comparison 4 Comparison: fatigue and vigour, all physical activity vs control, Outcome 7 Multidimensional Fatigue Symptom Inventory (follow‐up values).
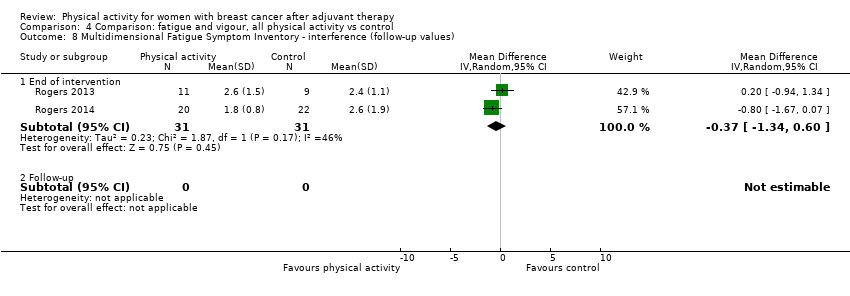
Comparison 4 Comparison: fatigue and vigour, all physical activity vs control, Outcome 8 Multidimensional Fatigue Symptom Inventory ‐ interference (follow‐up values).
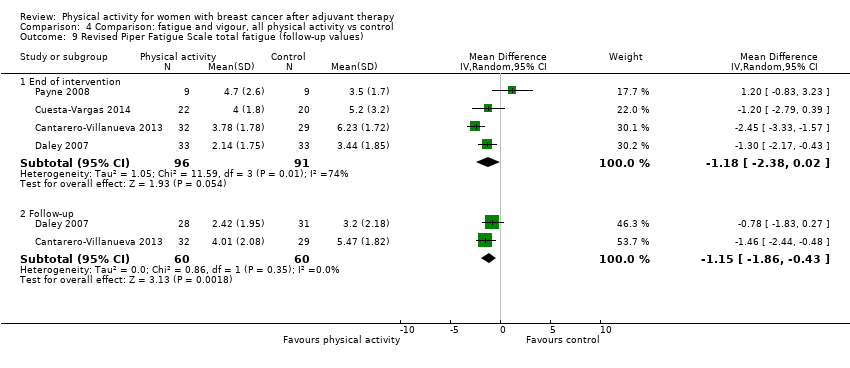
Comparison 4 Comparison: fatigue and vigour, all physical activity vs control, Outcome 9 Revised Piper Fatigue Scale total fatigue (follow‐up values).

Comparison 4 Comparison: fatigue and vigour, all physical activity vs control, Outcome 10 Revised Piper Fatigue Scale total fatigue (change values).

Comparison 4 Comparison: fatigue and vigour, all physical activity vs control, Outcome 11 Revised Piper Fatigue Scale behavioural/severity (follow‐up values).
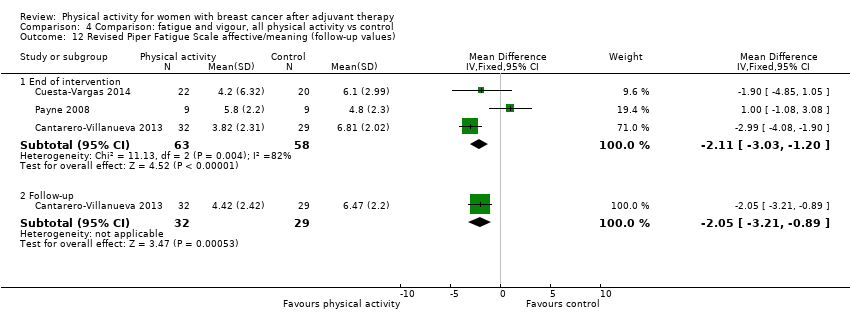
Comparison 4 Comparison: fatigue and vigour, all physical activity vs control, Outcome 12 Revised Piper Fatigue Scale affective/meaning (follow‐up values).
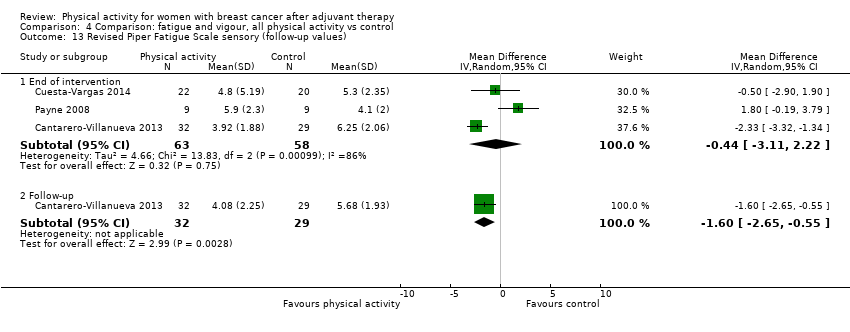
Comparison 4 Comparison: fatigue and vigour, all physical activity vs control, Outcome 13 Revised Piper Fatigue Scale sensory (follow‐up values).
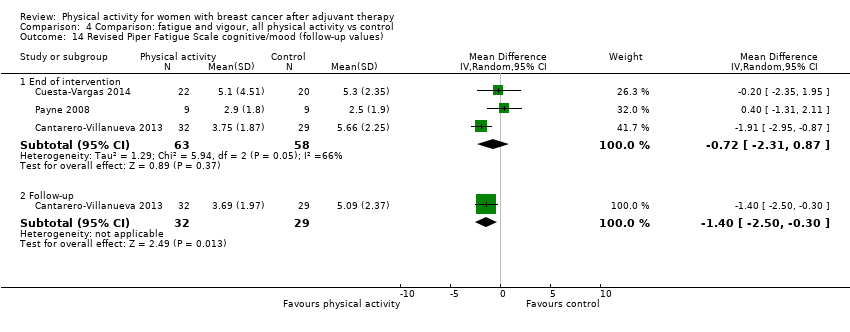
Comparison 4 Comparison: fatigue and vigour, all physical activity vs control, Outcome 14 Revised Piper Fatigue Scale cognitive/mood (follow‐up values).

Comparison 4 Comparison: fatigue and vigour, all physical activity vs control, Outcome 15 Schwartz Cancer Fatigue Scale (follow‐up values).

Comparison 4 Comparison: fatigue and vigour, all physical activity vs control, Outcome 16 POMS fatigue scale (follow‐up values).
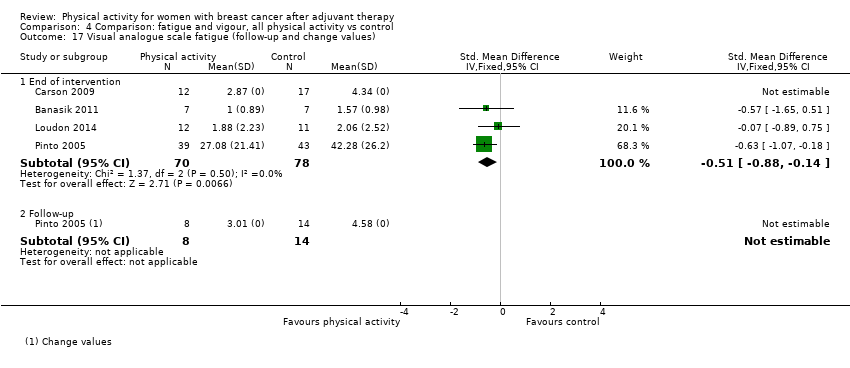
Comparison 4 Comparison: fatigue and vigour, all physical activity vs control, Outcome 17 Visual analogue scale fatigue (follow‐up and change values).
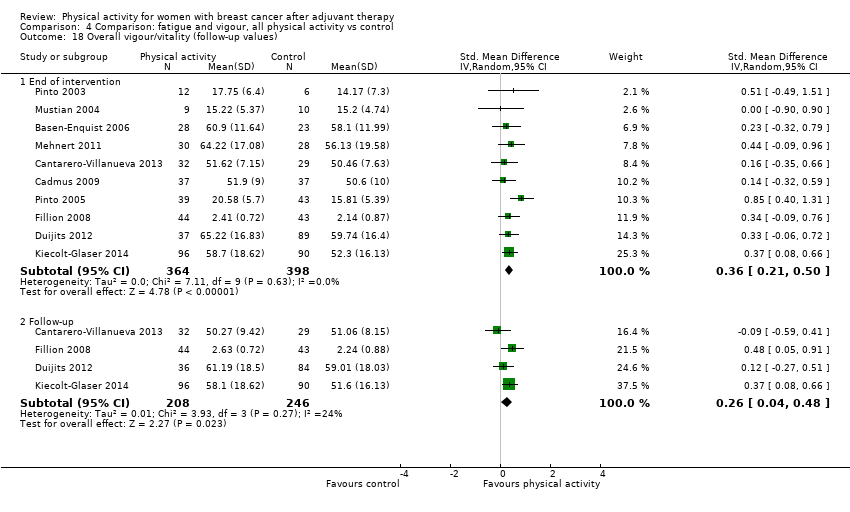
Comparison 4 Comparison: fatigue and vigour, all physical activity vs control, Outcome 18 Overall vigour/vitality (follow‐up values).

Comparison 4 Comparison: fatigue and vigour, all physical activity vs control, Outcome 19 Overall vigour/vitality (change values).
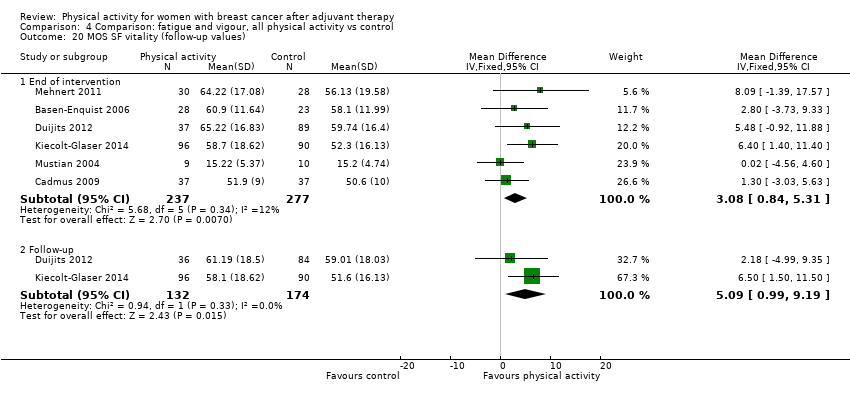
Comparison 4 Comparison: fatigue and vigour, all physical activity vs control, Outcome 20 MOS SF vitality (follow‐up values).
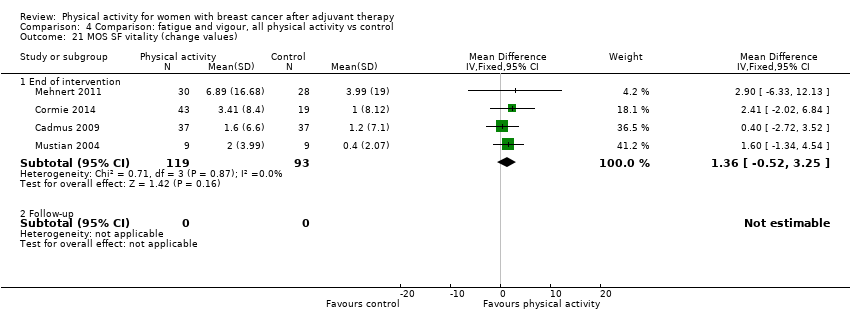
Comparison 4 Comparison: fatigue and vigour, all physical activity vs control, Outcome 21 MOS SF vitality (change values).
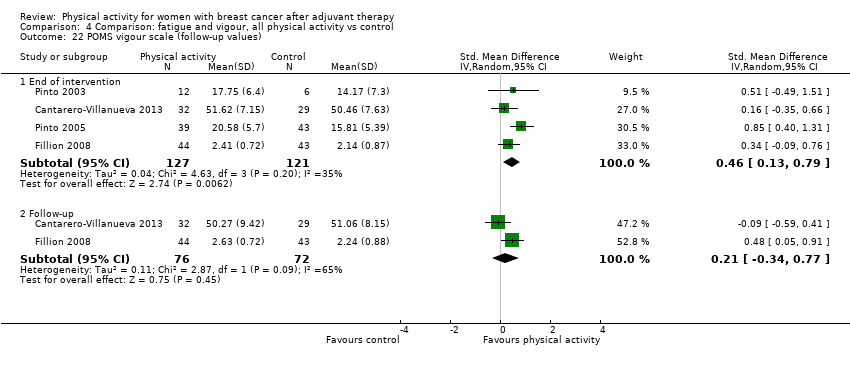
Comparison 4 Comparison: fatigue and vigour, all physical activity vs control, Outcome 22 POMS vigour scale (follow‐up values).

Comparison 4 Comparison: fatigue and vigour, all physical activity vs control, Outcome 23 POMS vigour scale (change values).

Comparison 5 Comparison: pain/disability, all physical activity vs control, Outcome 1 Overall pain/disability (follow‐up values).
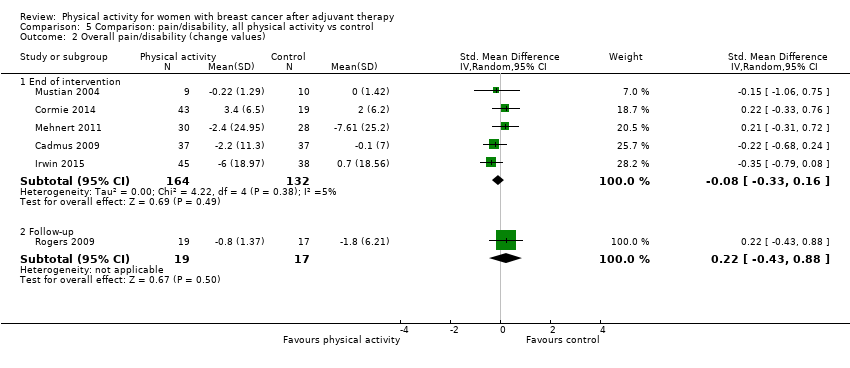
Comparison 5 Comparison: pain/disability, all physical activity vs control, Outcome 2 Overall pain/disability (change values).

Comparison 5 Comparison: pain/disability, all physical activity vs control, Outcome 3 Brief Pain Inventory severity score (change values).
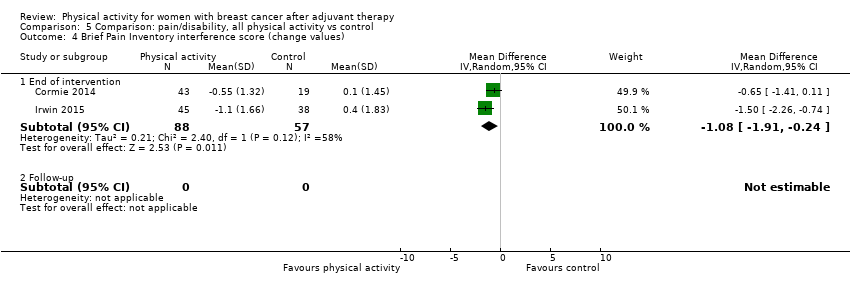
Comparison 5 Comparison: pain/disability, all physical activity vs control, Outcome 4 Brief Pain Inventory interference score (change values).

Comparison 5 Comparison: pain/disability, all physical activity vs control, Outcome 5 DASH (follow‐up and change values).

Comparison 5 Comparison: pain/disability, all physical activity vs control, Outcome 6 EORTC QLQ‐C30 Pain scale (follow‐up and change values).

Comparison 5 Comparison: pain/disability, all physical activity vs control, Outcome 7 MOS SF Pain (follow‐up values).

Comparison 5 Comparison: pain/disability, all physical activity vs control, Outcome 8 MOS SF Pain (change values).
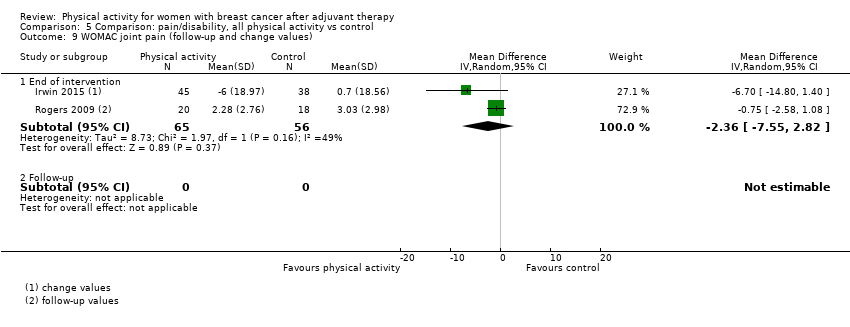
Comparison 5 Comparison: pain/disability, all physical activity vs control, Outcome 9 WOMAC joint pain (follow‐up and change values).

Comparison 5 Comparison: pain/disability, all physical activity vs control, Outcome 10 WOMAC physical dysfunction (follow‐up and change values).

Comparison 5 Comparison: pain/disability, all physical activity vs control, Outcome 11 WOMAC total score (follow‐up and change values).

Comparison 6 Comparison: self‐esteem, all physical activity vs control, Outcome 1 Overall self‐esteem/body image (follow‐up values).

Comparison 6 Comparison: self‐esteem, all physical activity vs control, Outcome 2 Overall self‐esteem/body image (change values).
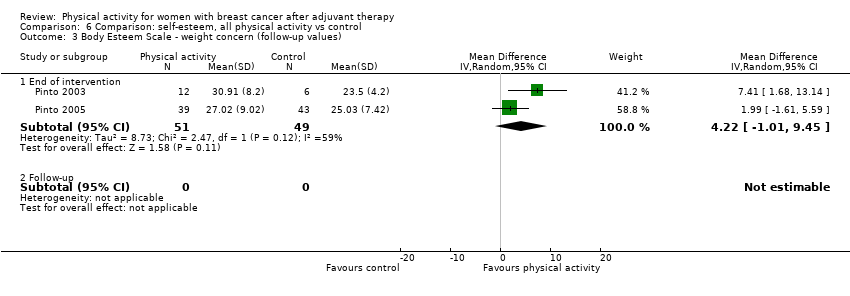
Comparison 6 Comparison: self‐esteem, all physical activity vs control, Outcome 3 Body Esteem Scale ‐ weight concern (follow‐up values).

Comparison 6 Comparison: self‐esteem, all physical activity vs control, Outcome 4 Physical self‐perception profile ‐ attractiveness of body (follow‐up values).

Comparison 6 Comparison: self‐esteem, all physical activity vs control, Outcome 5 Physical self‐perception profile ‐ attractiveness of body (change values).

Comparison 6 Comparison: self‐esteem, all physical activity vs control, Outcome 6 Rosenberg Self‐Esteem Scale (follow‐up values).
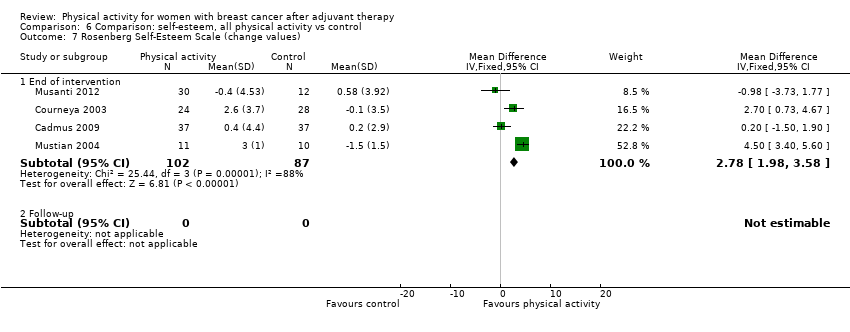
Comparison 6 Comparison: self‐esteem, all physical activity vs control, Outcome 7 Rosenberg Self‐Esteem Scale (change values).
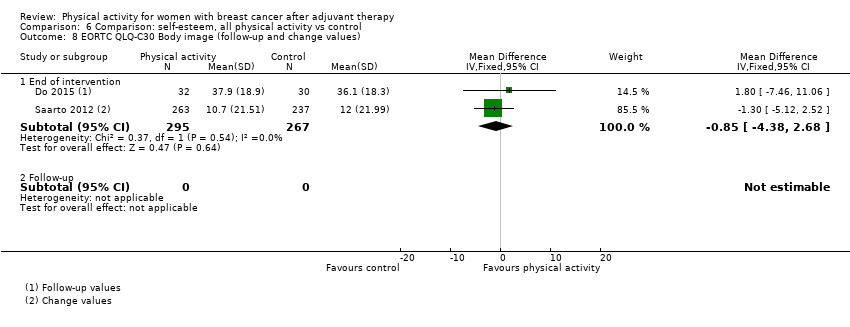
Comparison 6 Comparison: self‐esteem, all physical activity vs control, Outcome 8 EORTC QLQ‐C30 Body image (follow‐up and change values).
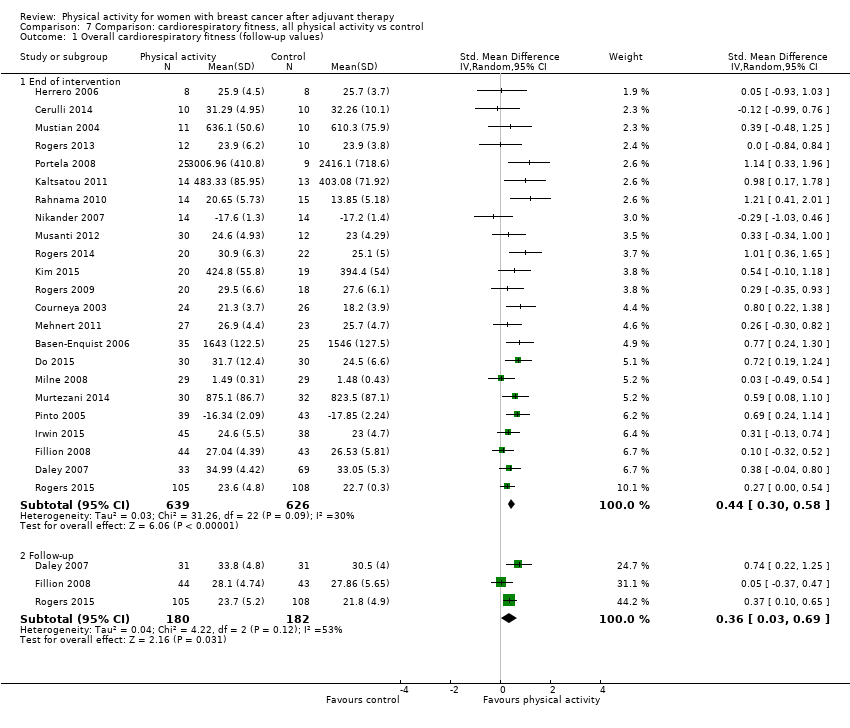
Comparison 7 Comparison: cardiorespiratory fitness, all physical activity vs control, Outcome 1 Overall cardiorespiratory fitness (follow‐up values).

Comparison 7 Comparison: cardiorespiratory fitness, all physical activity vs control, Outcome 2 Overall cardiorespiratory fitness (change values).

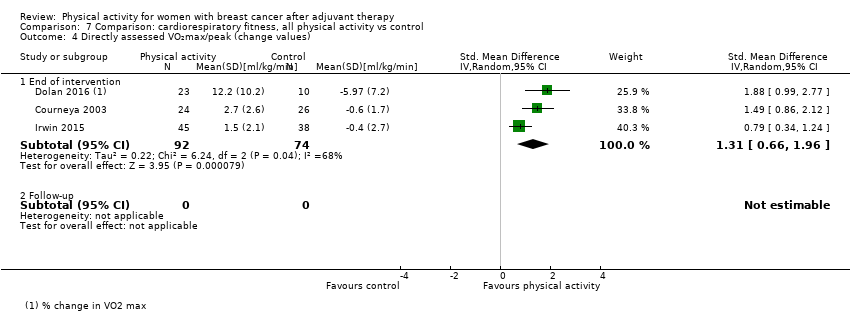
Comparison 7 Comparison: cardiorespiratory fitness, all physical activity vs control, Outcome 3 Directly assessed VO₂max/peak (follow‐up values).
Comparison 7 Comparison: cardiorespiratory fitness, all physical activity vs control, Outcome 4 Directly assessed VO₂max/peak (change values).
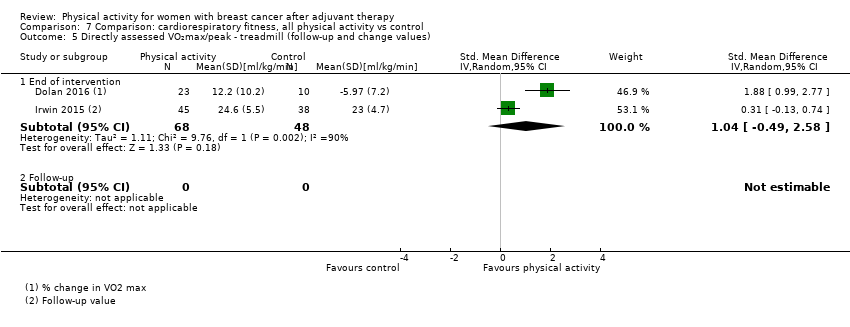
Comparison 7 Comparison: cardiorespiratory fitness, all physical activity vs control, Outcome 5 Directly assessed VO₂max/peak ‐ treadmill (follow‐up and change values).

Comparison 7 Comparison: cardiorespiratory fitness, all physical activity vs control, Outcome 6 Directly assessed VO₂max/peak ‐ cycle ergometer (follow‐up values).
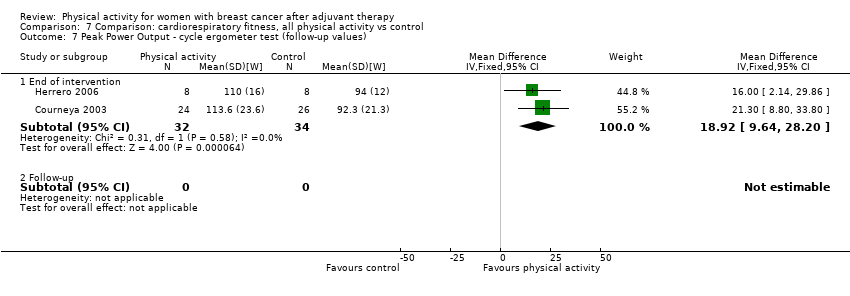
Comparison 7 Comparison: cardiorespiratory fitness, all physical activity vs control, Outcome 7 Peak Power Output ‐ cycle ergometer test (follow‐up values).
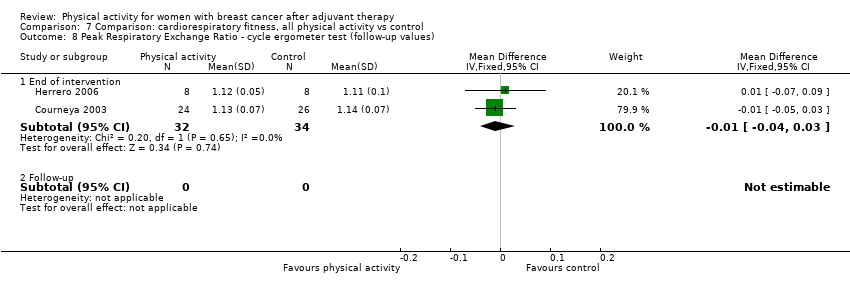
Comparison 7 Comparison: cardiorespiratory fitness, all physical activity vs control, Outcome 8 Peak Respiratory Exchange Ratio ‐ cycle ergometer test (follow‐up values).

Comparison 7 Comparison: cardiorespiratory fitness, all physical activity vs control, Outcome 9 Peak Heart Rate ‐ cycle ergometer test (follow‐up values).
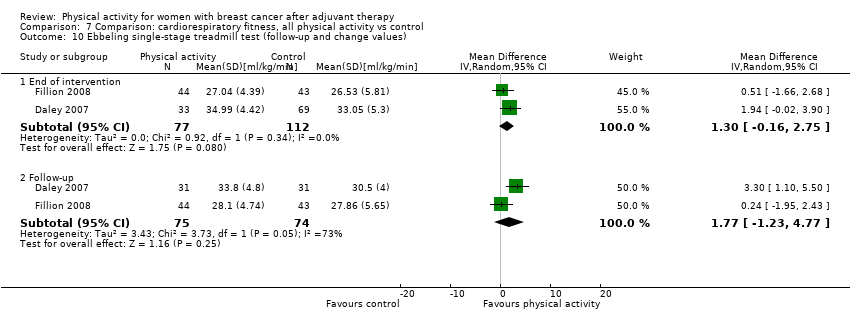
Comparison 7 Comparison: cardiorespiratory fitness, all physical activity vs control, Outcome 10 Ebbeling single‐stage treadmill test (follow‐up and change values).
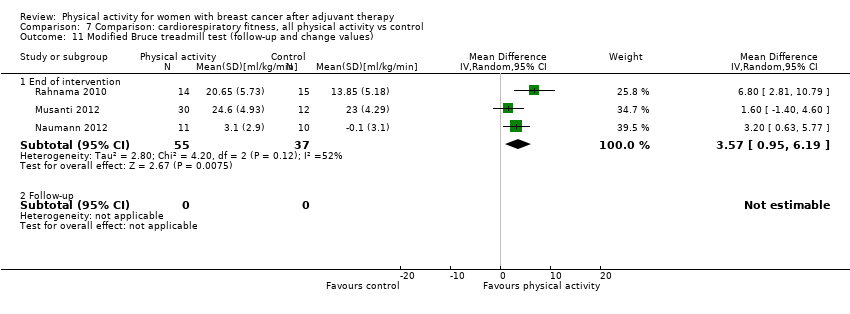
Comparison 7 Comparison: cardiorespiratory fitness, all physical activity vs control, Outcome 11 Modified Bruce treadmill test (follow‐up and change values).

Comparison 7 Comparison: cardiorespiratory fitness, all physical activity vs control, Outcome 12 Naughton submaximal treadmill test (follow‐up and change values).
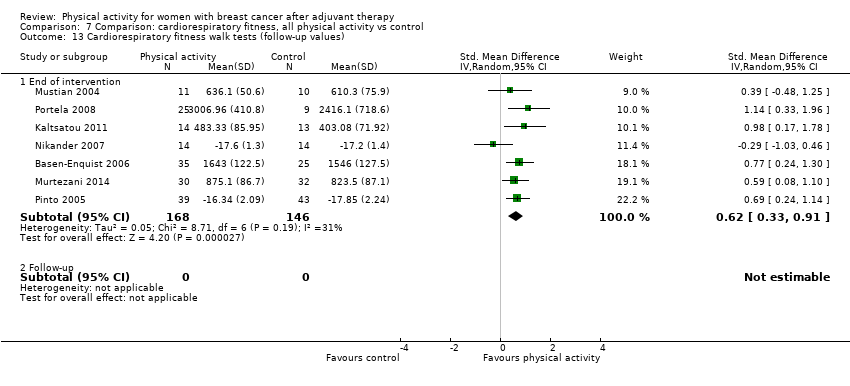
Comparison 7 Comparison: cardiorespiratory fitness, all physical activity vs control, Outcome 13 Cardiorespiratory fitness walk tests (follow‐up values).

Comparison 7 Comparison: cardiorespiratory fitness, all physical activity vs control, Outcome 14 Cardiorespiratory fitness walk tests (change values).
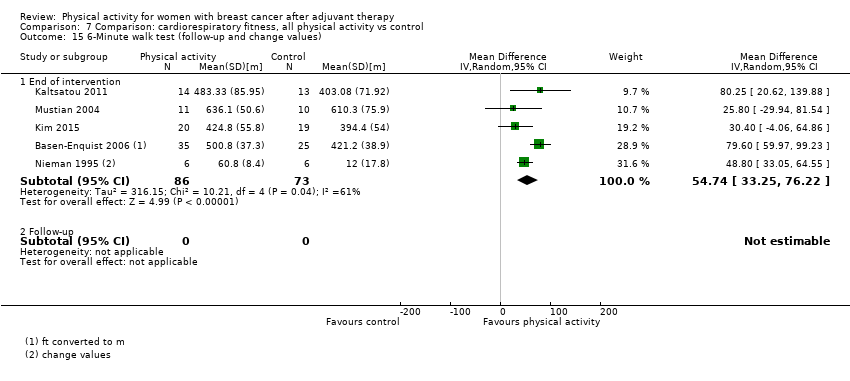
Comparison 7 Comparison: cardiorespiratory fitness, all physical activity vs control, Outcome 15 6‐Minute walk test (follow‐up and change values).
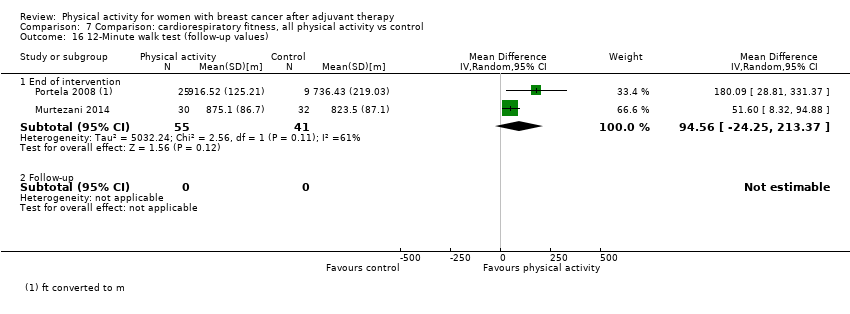
Comparison 7 Comparison: cardiorespiratory fitness, all physical activity vs control, Outcome 16 12‐Minute walk test (follow‐up values).

Comparison 7 Comparison: cardiorespiratory fitness, all physical activity vs control, Outcome 17 2‐Kilometer walk test (follow‐up and change values).

Comparison 7 Comparison: cardiorespiratory fitness, all physical activity vs control, Outcome 18 Resting Heart Rate (follow‐up values).

Comparison 7 Comparison: cardiorespiratory fitness, all physical activity vs control, Outcome 19 Resting Heart Rate (change values).

Comparison 7 Comparison: cardiorespiratory fitness, all physical activity vs control, Outcome 20 Resting Systolic Blood Pressure (follow‐up values).
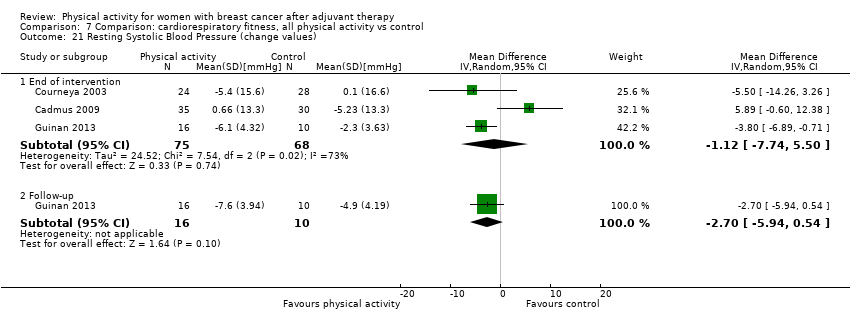
Comparison 7 Comparison: cardiorespiratory fitness, all physical activity vs control, Outcome 21 Resting Systolic Blood Pressure (change values).

Comparison 7 Comparison: cardiorespiratory fitness, all physical activity vs control, Outcome 22 Resting Diastolic Blood Pressure (follow‐up values).

Comparison 7 Comparison: cardiorespiratory fitness, all physical activity vs control, Outcome 23 Resting Diastolic Blood Pressure (change values).
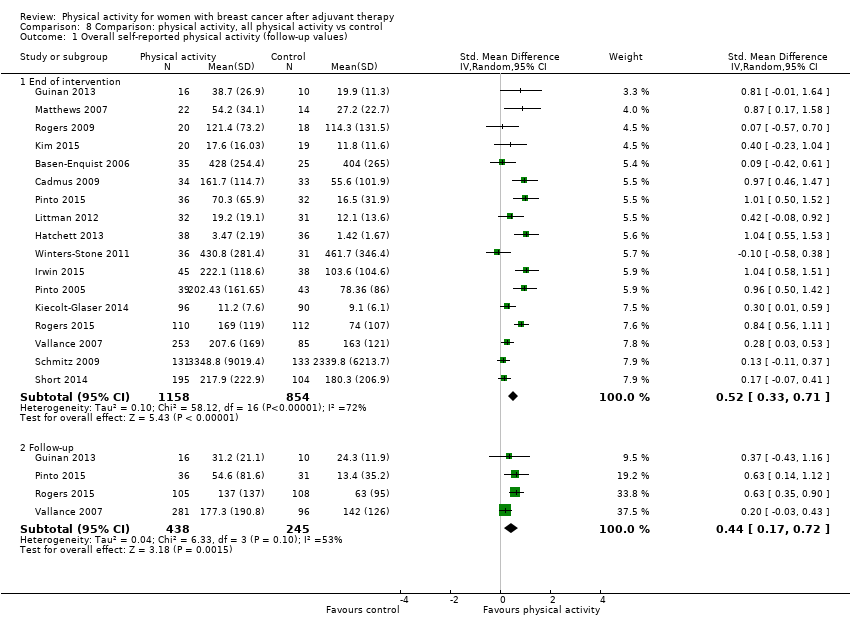
Comparison 8 Comparison: physical activity, all physical activity vs control, Outcome 1 Overall self‐reported physical activity (follow‐up values).
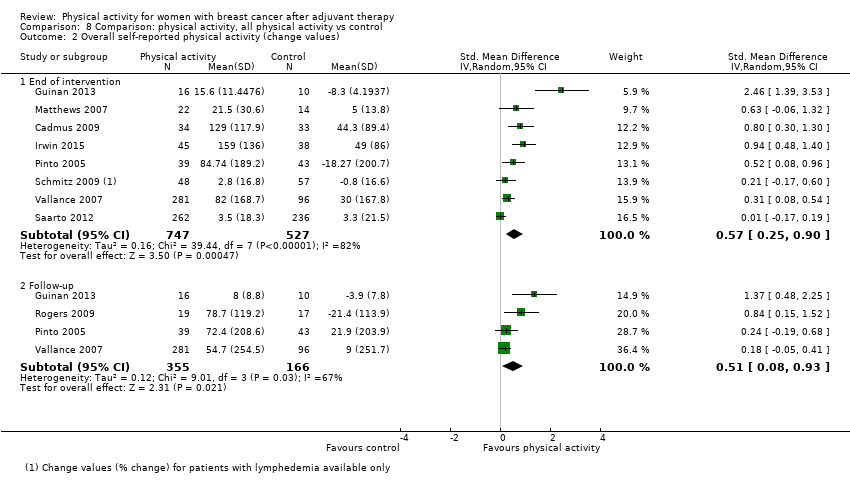
Comparison 8 Comparison: physical activity, all physical activity vs control, Outcome 2 Overall self‐reported physical activity (change values).
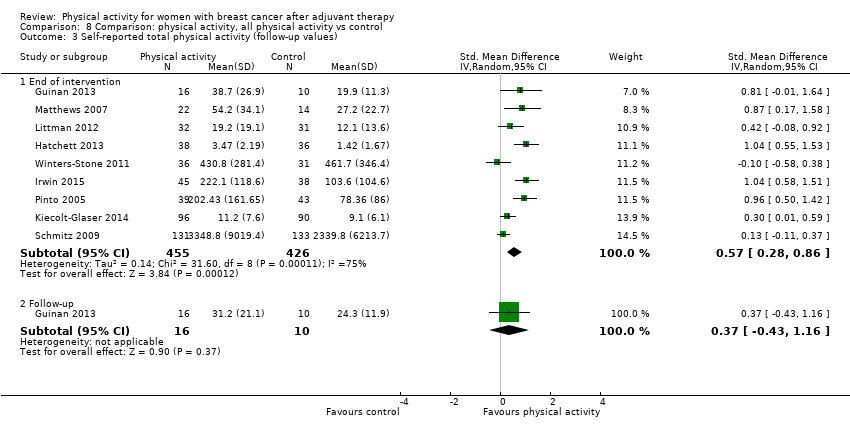
Comparison 8 Comparison: physical activity, all physical activity vs control, Outcome 3 Self‐reported total physical activity (follow‐up values).
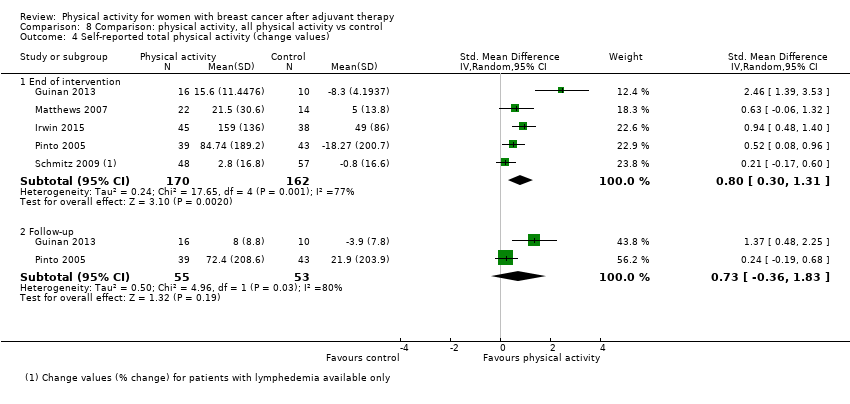
Comparison 8 Comparison: physical activity, all physical activity vs control, Outcome 4 Self‐reported total physical activity (change values).

Comparison 8 Comparison: physical activity, all physical activity vs control, Outcome 5 Self‐reported moderate physical activity (follow‐up values).
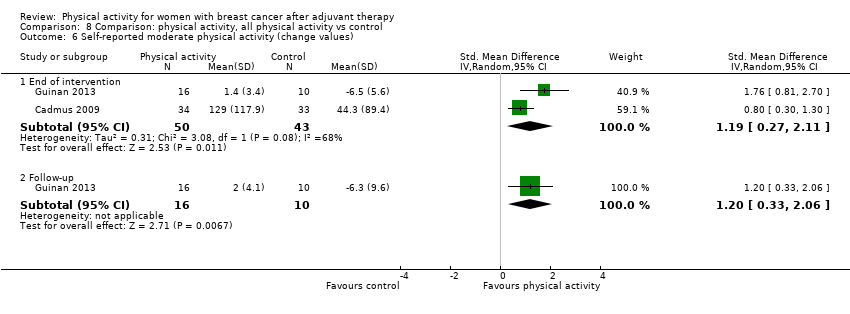
Comparison 8 Comparison: physical activity, all physical activity vs control, Outcome 6 Self‐reported moderate physical activity (change values).

Comparison 8 Comparison: physical activity, all physical activity vs control, Outcome 7 Self‐reported moderate‐vigorous physical activity (follow‐up values).

Comparison 8 Comparison: physical activity, all physical activity vs control, Outcome 8 Self‐reported moderate‐vigorous physical activity (change values).

Comparison 8 Comparison: physical activity, all physical activity vs control, Outcome 9 Self‐reported vigorous physical activity (follow‐up values).
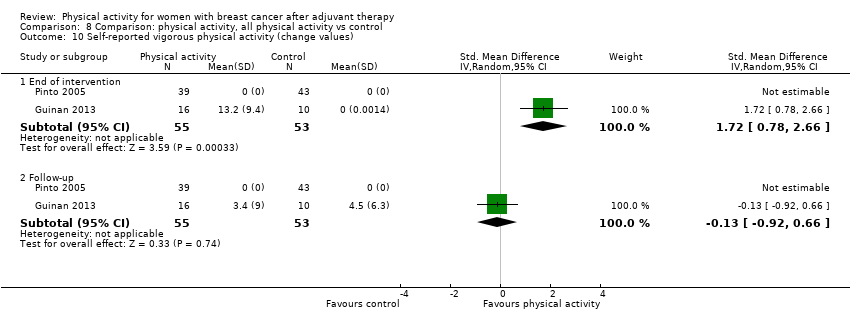
Comparison 8 Comparison: physical activity, all physical activity vs control, Outcome 10 Self‐reported vigorous physical activity (change values).

Comparison 8 Comparison: physical activity, all physical activity vs control, Outcome 11 Self‐reported walking (follow‐up values).
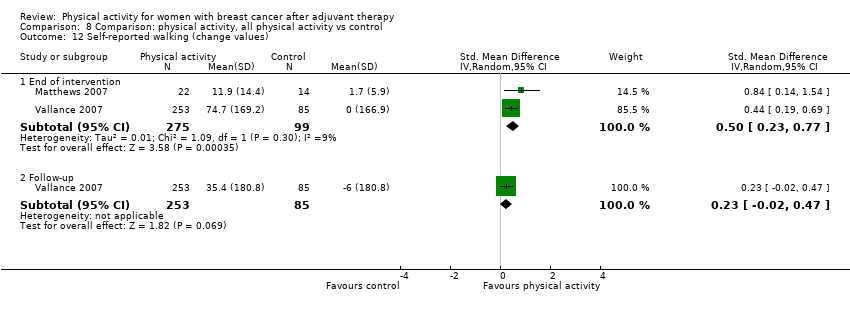
Comparison 8 Comparison: physical activity, all physical activity vs control, Outcome 12 Self‐reported walking (change values).

Comparison 8 Comparison: physical activity, all physical activity vs control, Outcome 13 7‐Day PAR self‐reported moderate physical activity (follow‐up values).

Comparison 8 Comparison: physical activity, all physical activity vs control, Outcome 14 7‐day PAR self‐reported moderate‐vigorous physical activity (follow‐up values).
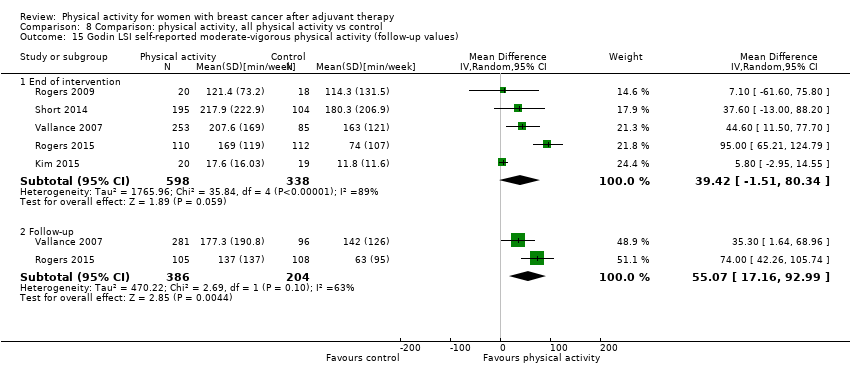
Comparison 8 Comparison: physical activity, all physical activity vs control, Outcome 15 Godin LSI self‐reported moderate‐vigorous physical activity (follow‐up values).

Comparison 8 Comparison: physical activity, all physical activity vs control, Outcome 16 Meeting recommended physical activity guidelines (follow‐up values).

Comparison 8 Comparison: physical activity, all physical activity vs control, Outcome 17 Overall objective physical activity (follow‐up values).

Comparison 8 Comparison: physical activity, all physical activity vs control, Outcome 18 Overall objective physical activity (change values).

Comparison 8 Comparison: physical activity, all physical activity vs control, Outcome 19 Objective moderate‐vigorous physical activity (follow‐up values).
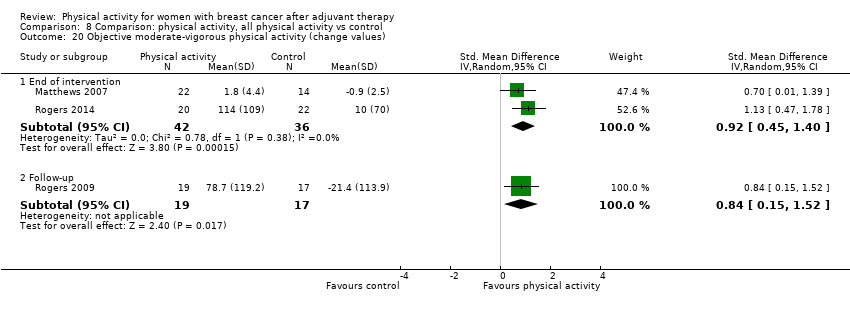
Comparison 8 Comparison: physical activity, all physical activity vs control, Outcome 20 Objective moderate‐vigorous physical activity (change values).
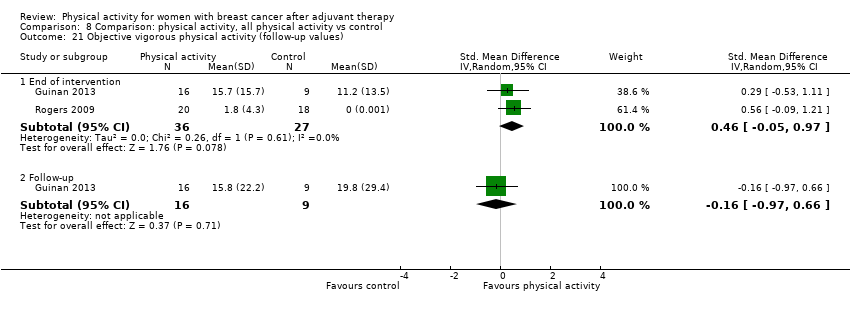
Comparison 8 Comparison: physical activity, all physical activity vs control, Outcome 21 Objective vigorous physical activity (follow‐up values).
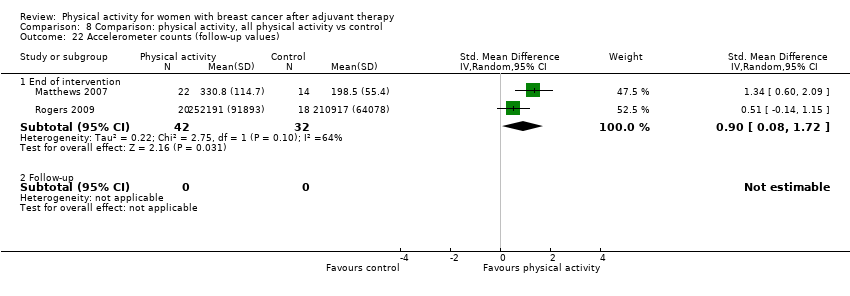
Comparison 8 Comparison: physical activity, all physical activity vs control, Outcome 22 Accelerometer counts (follow‐up values).
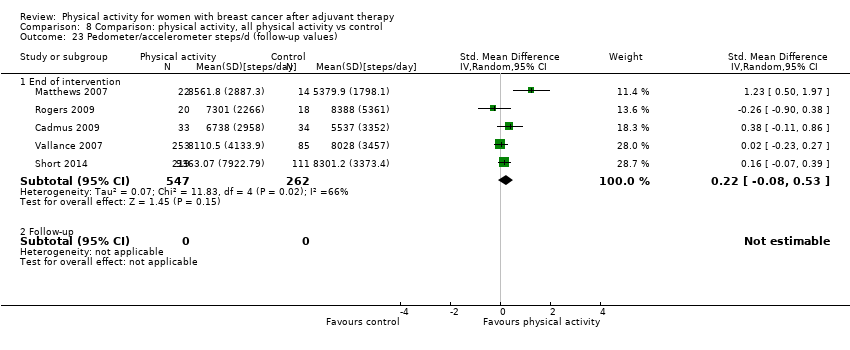
Comparison 8 Comparison: physical activity, all physical activity vs control, Outcome 23 Pedometer/accelerometer steps/d (follow‐up values).
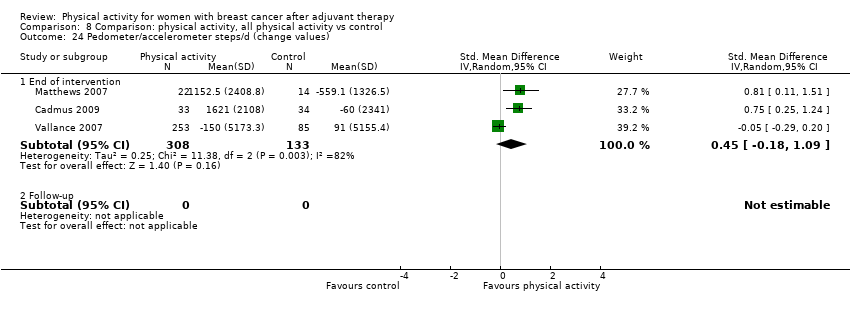
Comparison 8 Comparison: physical activity, all physical activity vs control, Outcome 24 Pedometer/accelerometer steps/d (change values).

Comparison 8 Comparison: physical activity, all physical activity vs control, Outcome 25 Overall sedentary behaviour (follow‐up values).

Comparison 8 Comparison: physical activity, all physical activity vs control, Outcome 26 Objective sedentary behaviour (follow‐up values).
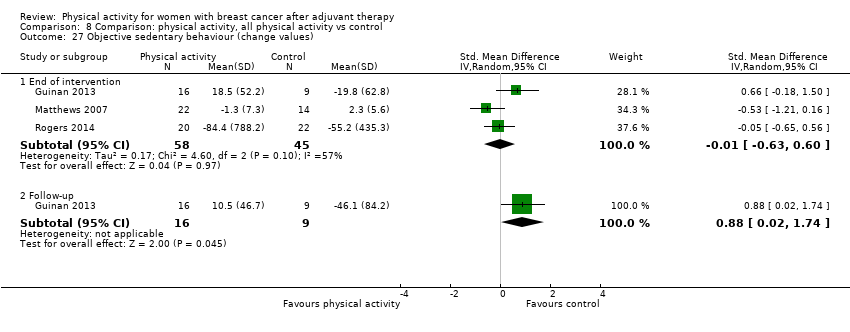
Comparison 8 Comparison: physical activity, all physical activity vs control, Outcome 27 Objective sedentary behaviour (change values).

Comparison 9 Comparison: anthropometric outcomes, all physical activity vs control, Outcome 1 Mass (follow‐up values).
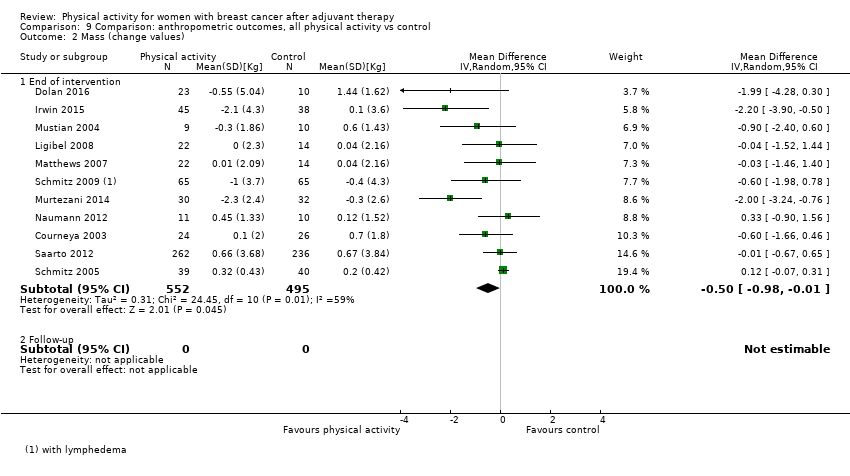
Comparison 9 Comparison: anthropometric outcomes, all physical activity vs control, Outcome 2 Mass (change values).
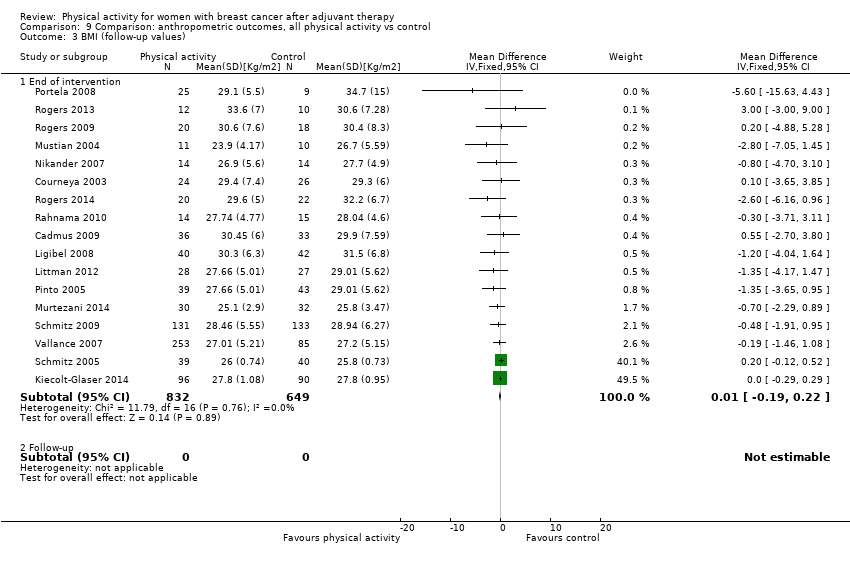
Comparison 9 Comparison: anthropometric outcomes, all physical activity vs control, Outcome 3 BMI (follow‐up values).

Comparison 9 Comparison: anthropometric outcomes, all physical activity vs control, Outcome 4 BMI (change values).

Comparison 9 Comparison: anthropometric outcomes, all physical activity vs control, Outcome 5 Overall body fat (follow‐up values).

Comparison 9 Comparison: anthropometric outcomes, all physical activity vs control, Outcome 6 Overall body fat (change values).

Comparison 9 Comparison: anthropometric outcomes, all physical activity vs control, Outcome 7 Percentage body fat ‐ DEXA (follow‐up values).

Comparison 9 Comparison: anthropometric outcomes, all physical activity vs control, Outcome 8 Percentage body fat ‐ DEXA (change values).

Comparison 9 Comparison: anthropometric outcomes, all physical activity vs control, Outcome 9 Percentage body fat ‐ BIA (follow‐up values).
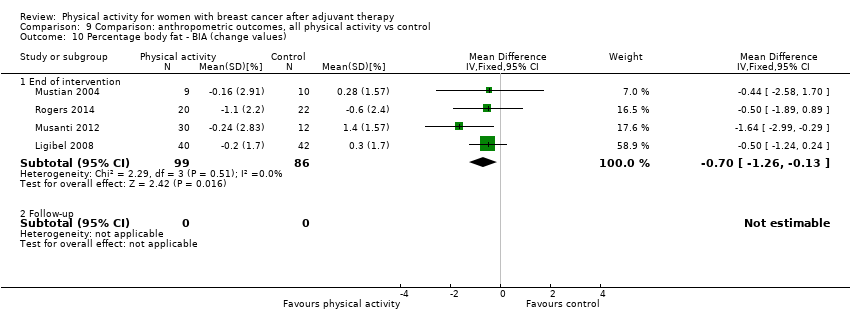
Comparison 9 Comparison: anthropometric outcomes, all physical activity vs control, Outcome 10 Percentage body fat ‐ BIA (change values).

Comparison 9 Comparison: anthropometric outcomes, all physical activity vs control, Outcome 11 Percentage body fat ‐ SKF (follow‐up values).

Comparison 9 Comparison: anthropometric outcomes, all physical activity vs control, Outcome 12 Fat mass (follow‐up values).
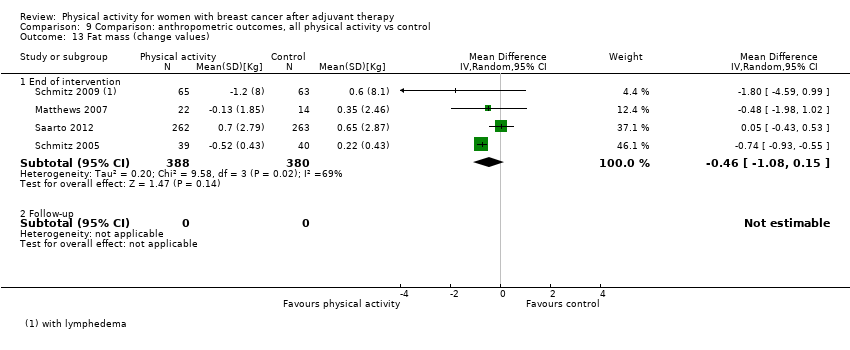
Comparison 9 Comparison: anthropometric outcomes, all physical activity vs control, Outcome 13 Fat mass (change values).

Comparison 9 Comparison: anthropometric outcomes, all physical activity vs control, Outcome 14 Fat mass ‐ DEXA (follow‐up values).

Comparison 9 Comparison: anthropometric outcomes, all physical activity vs control, Outcome 15 Fat mass ‐ DEXA (change values).

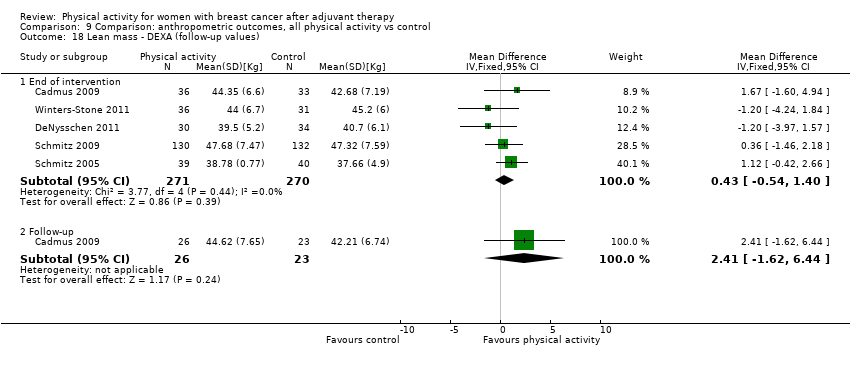
Comparison 9 Comparison: anthropometric outcomes, all physical activity vs control, Outcome 16 Lean mass (follow‐up values).

Comparison 9 Comparison: anthropometric outcomes, all physical activity vs control, Outcome 17 Lean mass (change values).
Comparison 9 Comparison: anthropometric outcomes, all physical activity vs control, Outcome 18 Lean mass ‐ DEXA (follow‐up values).
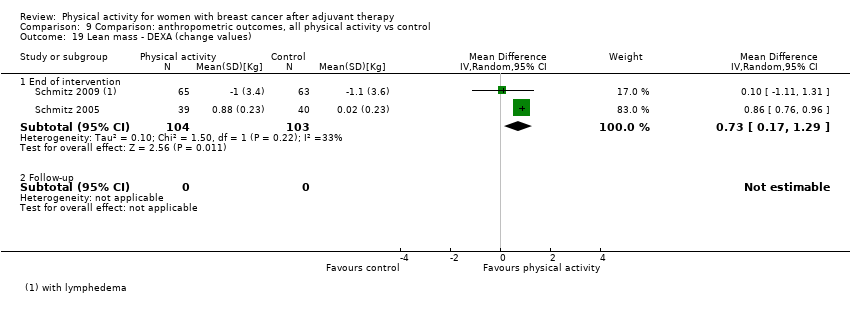
Comparison 9 Comparison: anthropometric outcomes, all physical activity vs control, Outcome 19 Lean mass ‐ DEXA (change values).

Comparison 9 Comparison: anthropometric outcomes, all physical activity vs control, Outcome 20 Waist‐to‐hip ratio (follow‐up values).

Comparison 9 Comparison: anthropometric outcomes, all physical activity vs control, Outcome 21 Waist‐to‐hip ratio (change values).

Comparison 9 Comparison: anthropometric outcomes, all physical activity vs control, Outcome 22 Waist circumference (follow‐up values).

Comparison 9 Comparison: anthropometric outcomes, all physical activity vs control, Outcome 23 Waist circumference (change values).

Comparison 9 Comparison: anthropometric outcomes, all physical activity vs control, Outcome 24 Hip circumference (follow‐up values).
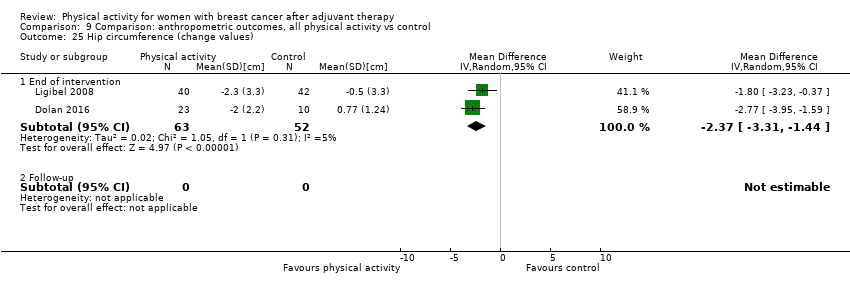
Comparison 9 Comparison: anthropometric outcomes, all physical activity vs control, Outcome 25 Hip circumference (change values).

Comparison 10 Comparison: muscular strength, all physical activity vs control, Outcome 1 Lower body strength (follow‐up values).

Comparison 10 Comparison: muscular strength, all physical activity vs control, Outcome 2 Lower body strength (change values).
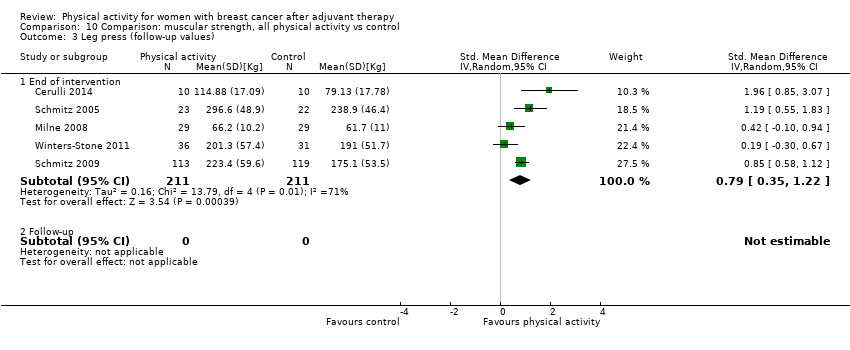
Comparison 10 Comparison: muscular strength, all physical activity vs control, Outcome 3 Leg press (follow‐up values).

Comparison 10 Comparison: muscular strength, all physical activity vs control, Outcome 4 Leg press (change values).

Comparison 10 Comparison: muscular strength, all physical activity vs control, Outcome 5 Back & leg strength (follow‐up values).

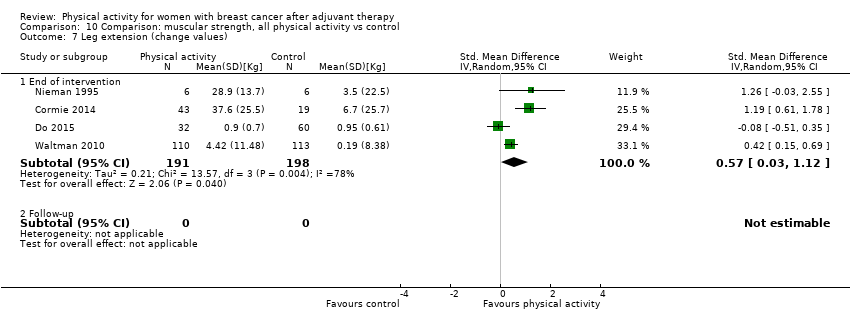
Comparison 10 Comparison: muscular strength, all physical activity vs control, Outcome 6 Leg extension (follow‐up values).
Comparison 10 Comparison: muscular strength, all physical activity vs control, Outcome 7 Leg extension (change values).

Comparison 10 Comparison: muscular strength, all physical activity vs control, Outcome 8 Hip extension (follow‐up values).

Comparison 10 Comparison: muscular strength, all physical activity vs control, Outcome 9 Hip flexion (follow‐up values).
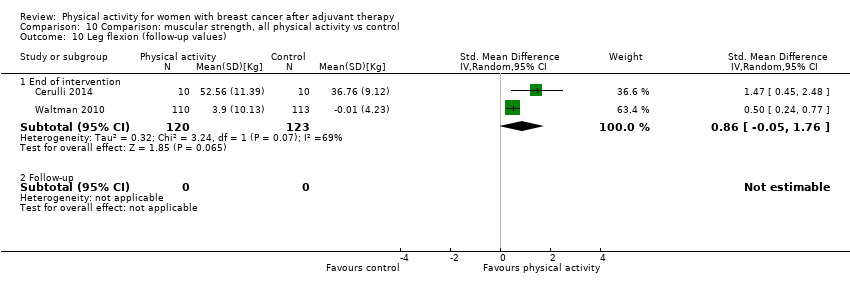
Comparison 10 Comparison: muscular strength, all physical activity vs control, Outcome 10 Leg flexion (follow‐up values).
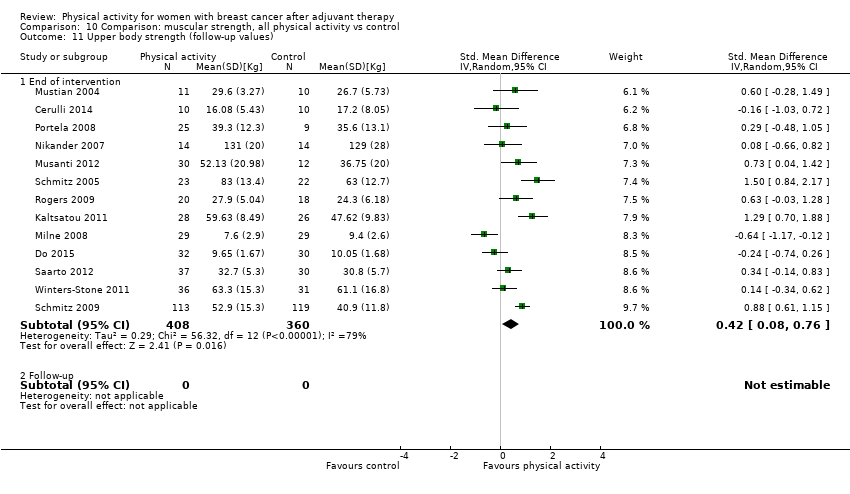
Comparison 10 Comparison: muscular strength, all physical activity vs control, Outcome 11 Upper body strength (follow‐up values).
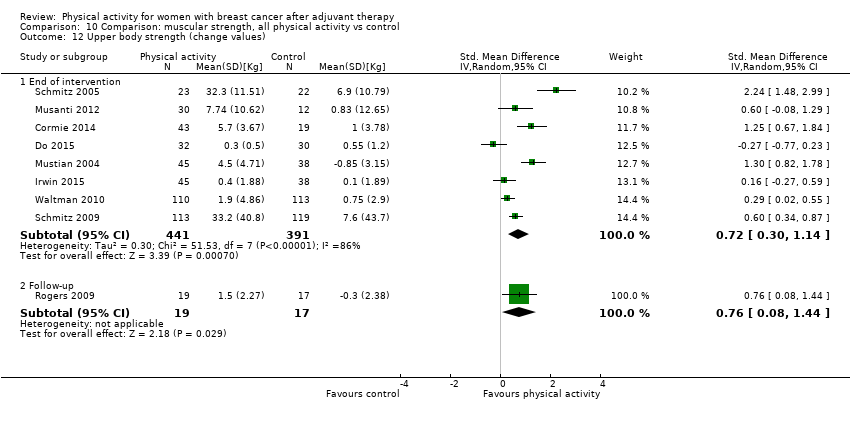
Comparison 10 Comparison: muscular strength, all physical activity vs control, Outcome 12 Upper body strength (change values).
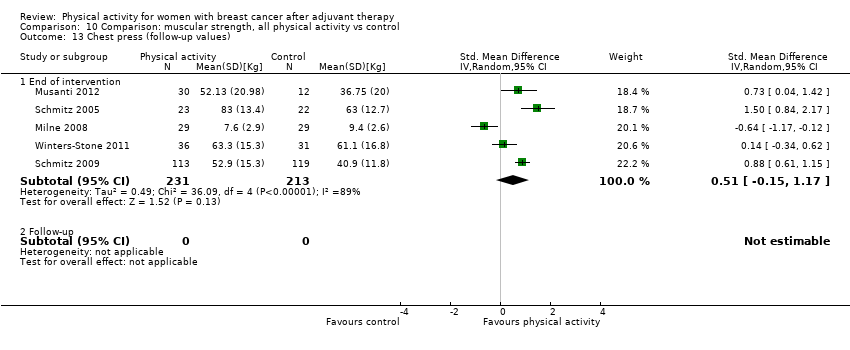
Comparison 10 Comparison: muscular strength, all physical activity vs control, Outcome 13 Chest press (follow‐up values).

Comparison 10 Comparison: muscular strength, all physical activity vs control, Outcome 14 Chest press (change values).

Comparison 10 Comparison: muscular strength, all physical activity vs control, Outcome 15 Grip strength (follow‐up).

Comparison 10 Comparison: muscular strength, all physical activity vs control, Outcome 16 Grip strength (change values).

Comparison 10 Comparison: muscular strength, all physical activity vs control, Outcome 17 Grip strength right hand (follow‐up).
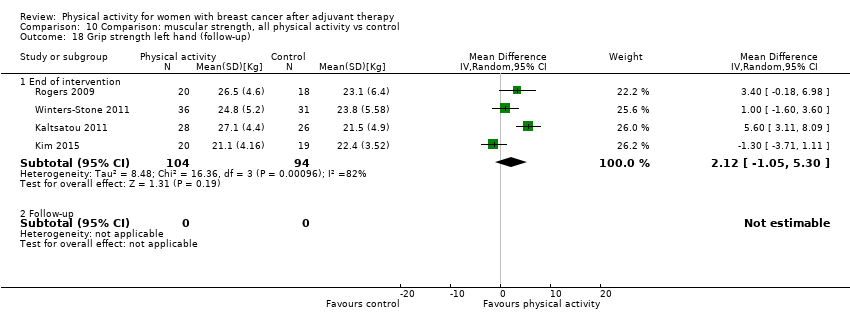
Comparison 10 Comparison: muscular strength, all physical activity vs control, Outcome 18 Grip strength left hand (follow‐up).

Comparison 10 Comparison: muscular strength, all physical activity vs control, Outcome 19 Elbow flexion (follow‐up values).
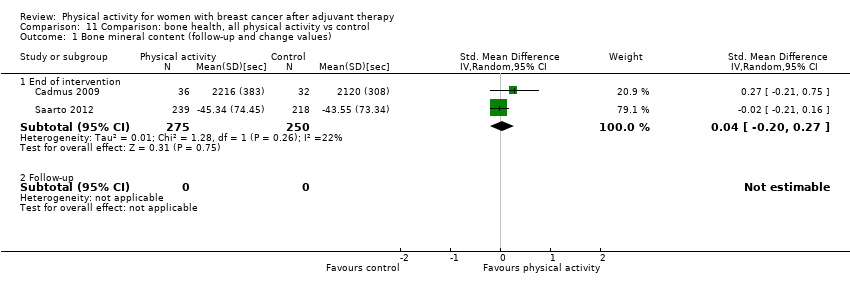
Comparison 11 Comparison: bone health, all physical activity vs control, Outcome 1 Bone mineral content (follow‐up and change values).
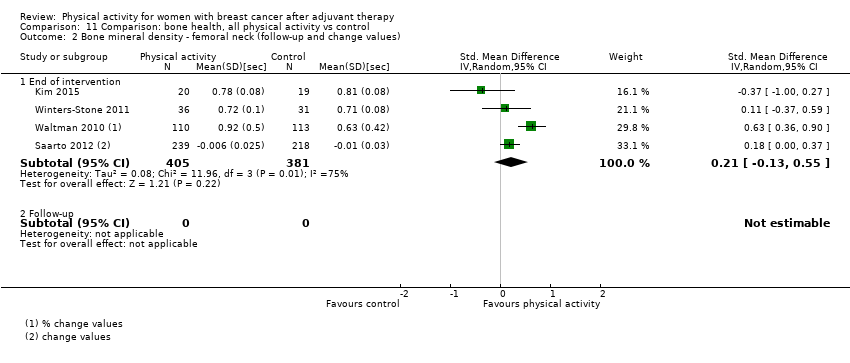
Comparison 11 Comparison: bone health, all physical activity vs control, Outcome 2 Bone mineral density ‐ femoral neck (follow‐up and change values).
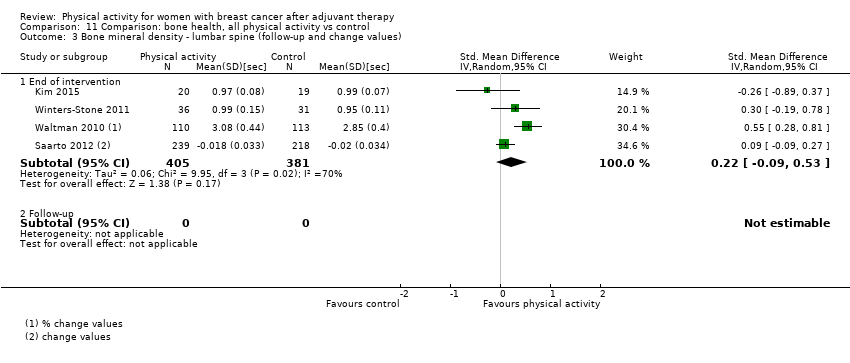
Comparison 11 Comparison: bone health, all physical activity vs control, Outcome 3 Bone mineral density ‐ lumbar spine (follow‐up and change values).

Comparison 11 Comparison: bone health, all physical activity vs control, Outcome 4 Bone mineral density ‐ total hip (follow‐up and change values).
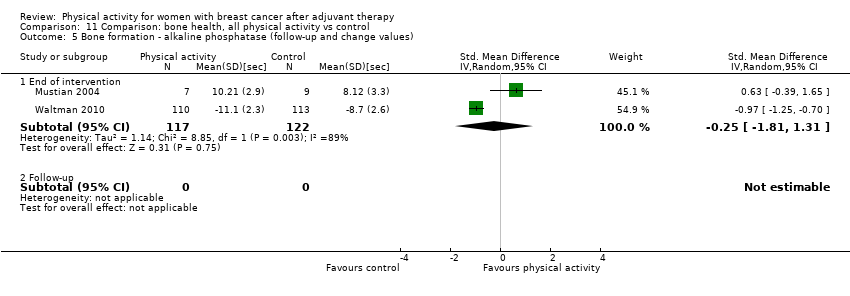
Comparison 11 Comparison: bone health, all physical activity vs control, Outcome 5 Bone formation ‐ alkaline phosphatase (follow‐up and change values).

Comparison 11 Comparison: bone health, all physical activity vs control, Outcome 6 Bone resorption ‐ serum NTx (follow‐up and change values).
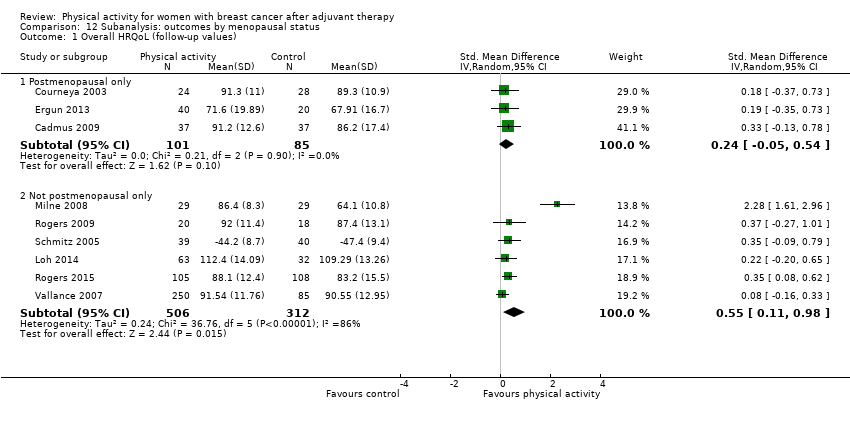
Comparison 12 Subanalysis: outcomes by menopausal status, Outcome 1 Overall HRQoL (follow‐up values).

Comparison 12 Subanalysis: outcomes by menopausal status, Outcome 2 Overall HRQoL (change values).
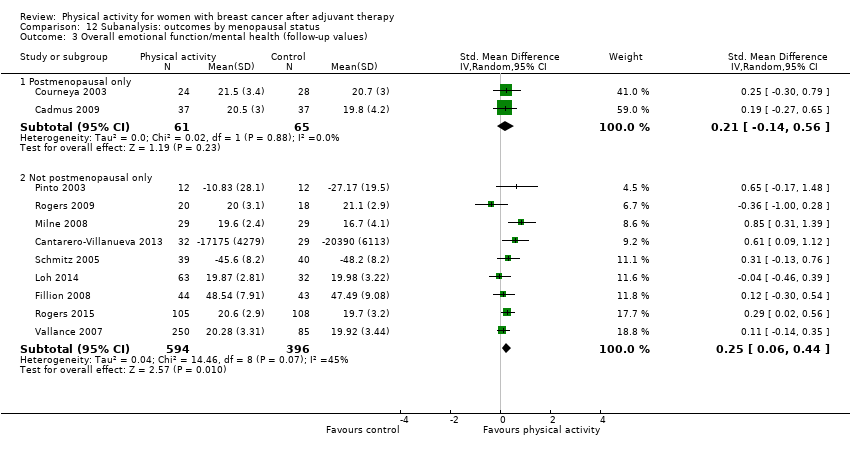
Comparison 12 Subanalysis: outcomes by menopausal status, Outcome 3 Overall emotional function/mental health (follow‐up values).

Comparison 12 Subanalysis: outcomes by menopausal status, Outcome 4 Overall emotional function/mental health (change values).
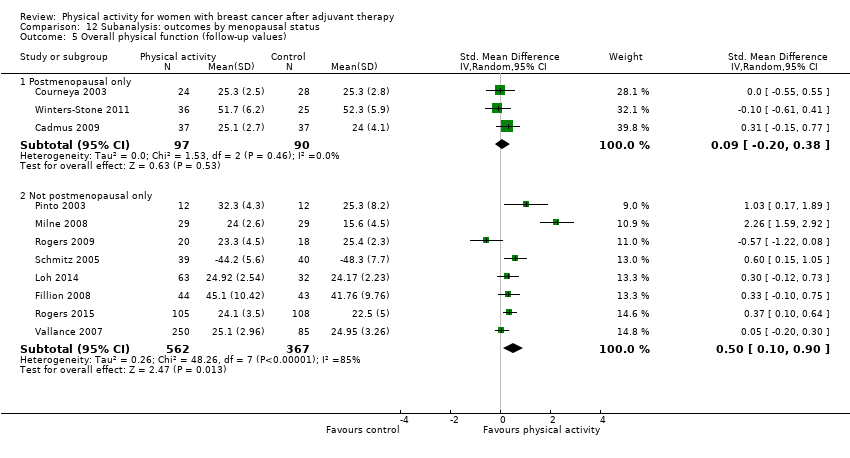
Comparison 12 Subanalysis: outcomes by menopausal status, Outcome 5 Overall physical function (follow‐up values).

Comparison 12 Subanalysis: outcomes by menopausal status, Outcome 6 Overall physical function (change values).

Comparison 12 Subanalysis: outcomes by menopausal status, Outcome 7 Overall role function (follow‐up values).
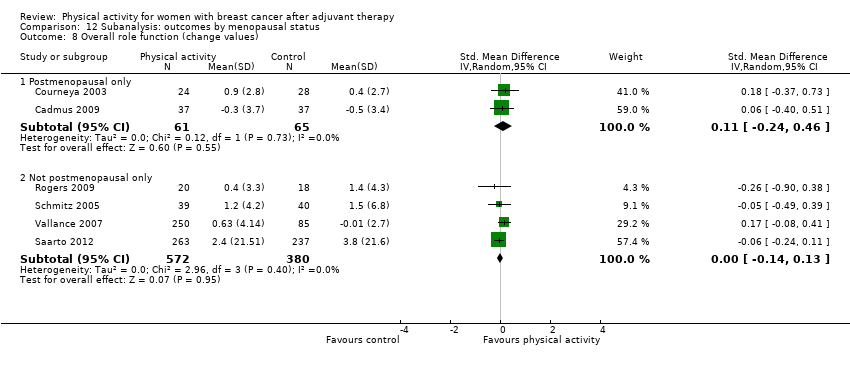
Comparison 12 Subanalysis: outcomes by menopausal status, Outcome 8 Overall role function (change values).

Comparison 12 Subanalysis: outcomes by menopausal status, Outcome 9 Overall social well‐being/function (follow‐up values).

Comparison 12 Subanalysis: outcomes by menopausal status, Outcome 10 Overall social well‐being/function (change values).

Comparison 12 Subanalysis: outcomes by menopausal status, Outcome 11 Overall cognitive function (follow‐up values).
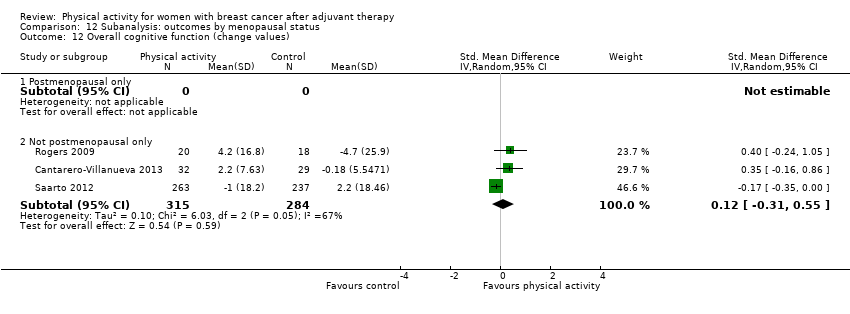
Comparison 12 Subanalysis: outcomes by menopausal status, Outcome 12 Overall cognitive function (change values).
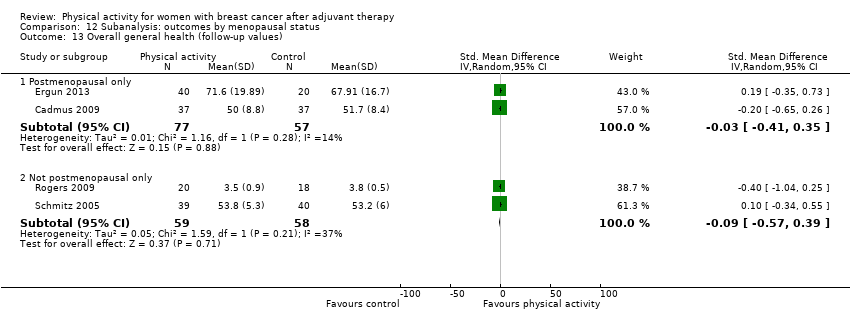
Comparison 12 Subanalysis: outcomes by menopausal status, Outcome 13 Overall general health (follow‐up values).

Comparison 12 Subanalysis: outcomes by menopausal status, Outcome 14 Overall general health (change values).

Comparison 12 Subanalysis: outcomes by menopausal status, Outcome 15 Overall sexual function (follow‐up values).

Comparison 12 Subanalysis: outcomes by menopausal status, Outcome 16 Overall sexual function (change values).

Comparison 12 Subanalysis: outcomes by menopausal status, Outcome 17 Overall sleep (follow‐up values).

Comparison 12 Subanalysis: outcomes by menopausal status, Outcome 18 Overall sleep (change values).
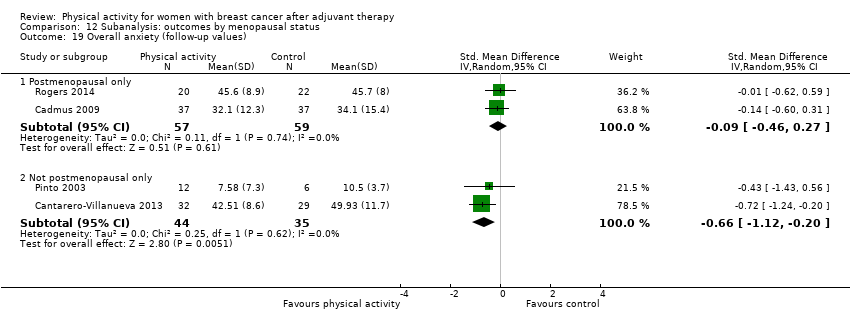
Comparison 12 Subanalysis: outcomes by menopausal status, Outcome 19 Overall anxiety (follow‐up values).

Comparison 12 Subanalysis: outcomes by menopausal status, Outcome 20 Overall anxiety (change values).
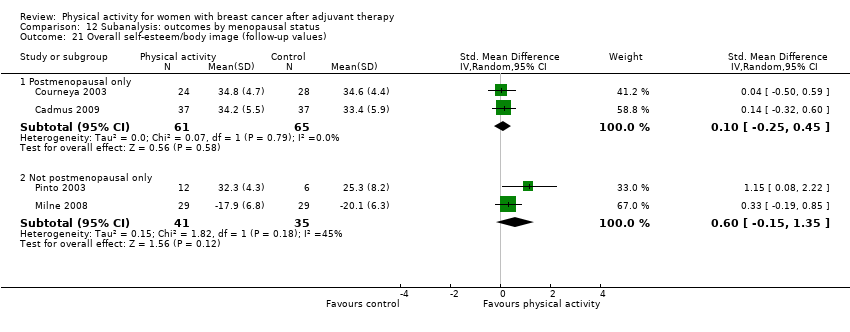
Comparison 12 Subanalysis: outcomes by menopausal status, Outcome 21 Overall self‐esteem/body image (follow‐up values).
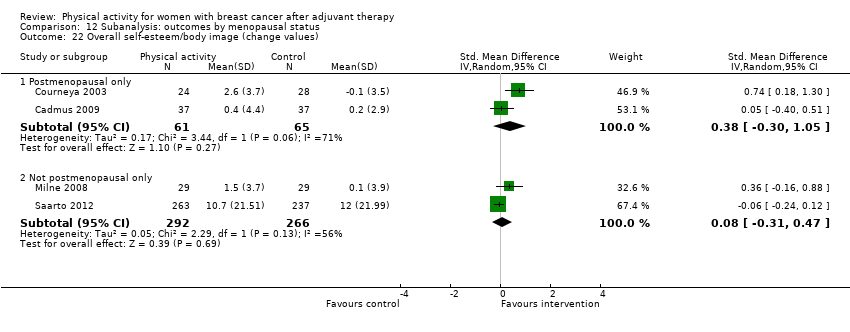
Comparison 12 Subanalysis: outcomes by menopausal status, Outcome 22 Overall self‐esteem/body image (change values).
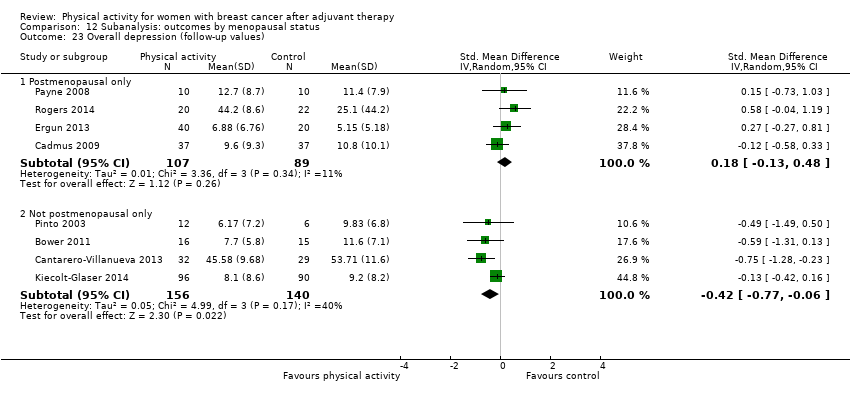
Comparison 12 Subanalysis: outcomes by menopausal status, Outcome 23 Overall depression (follow‐up values).
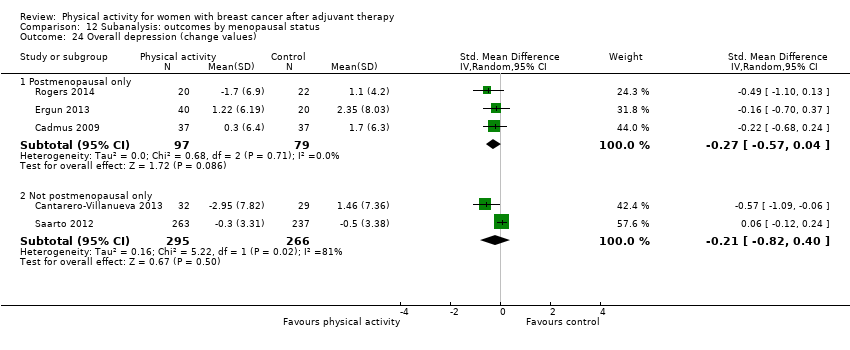
Comparison 12 Subanalysis: outcomes by menopausal status, Outcome 24 Overall depression (change values).
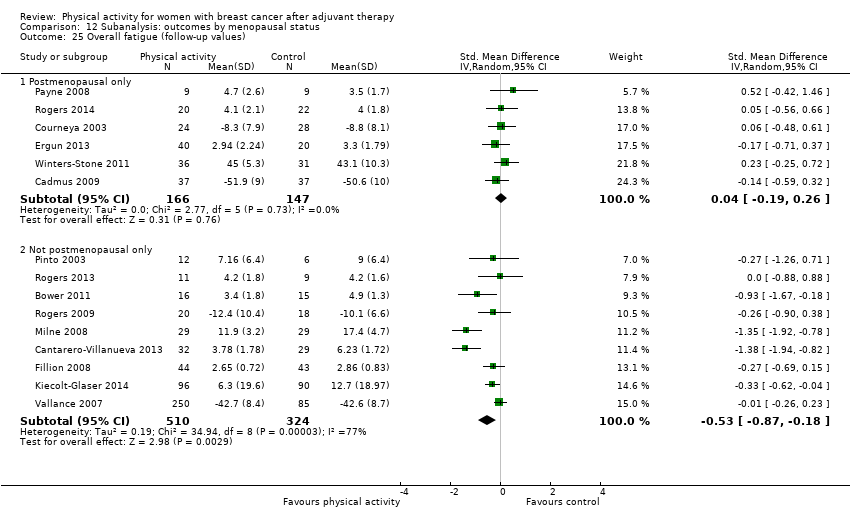
Comparison 12 Subanalysis: outcomes by menopausal status, Outcome 25 Overall fatigue (follow‐up values).

Comparison 12 Subanalysis: outcomes by menopausal status, Outcome 26 Overall fatigue (change values).

Comparison 12 Subanalysis: outcomes by menopausal status, Outcome 27 Overall pain/disability (follow‐up values).

Comparison 12 Subanalysis: outcomes by menopausal status, Outcome 28 Overall pain/disability (change values).

Comparison 12 Subanalysis: outcomes by menopausal status, Outcome 29 Overall cardiorespiratory fitness (follow‐up values).
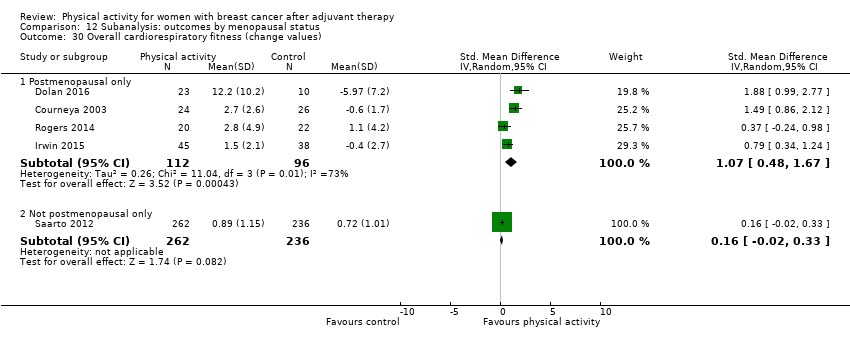
Comparison 12 Subanalysis: outcomes by menopausal status, Outcome 30 Overall cardiorespiratory fitness (change values).

Comparison 12 Subanalysis: outcomes by menopausal status, Outcome 31 Overall self‐reported physical activity (follow‐up values).

Comparison 12 Subanalysis: outcomes by menopausal status, Outcome 32 Overall self‐reported physical activity (change values).
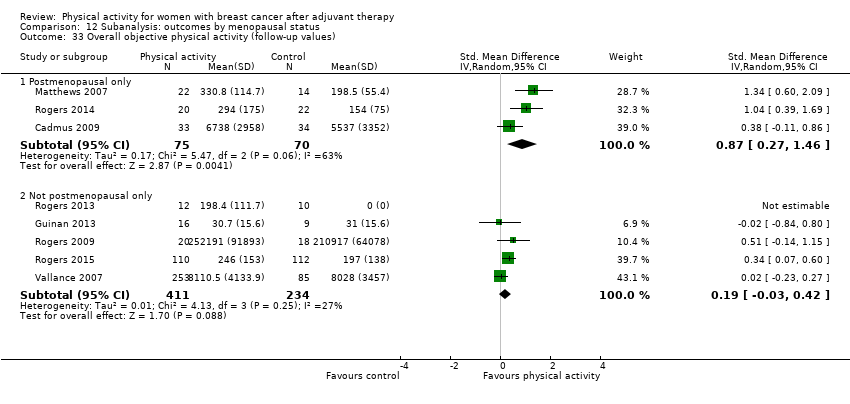
Comparison 12 Subanalysis: outcomes by menopausal status, Outcome 33 Overall objective physical activity (follow‐up values).
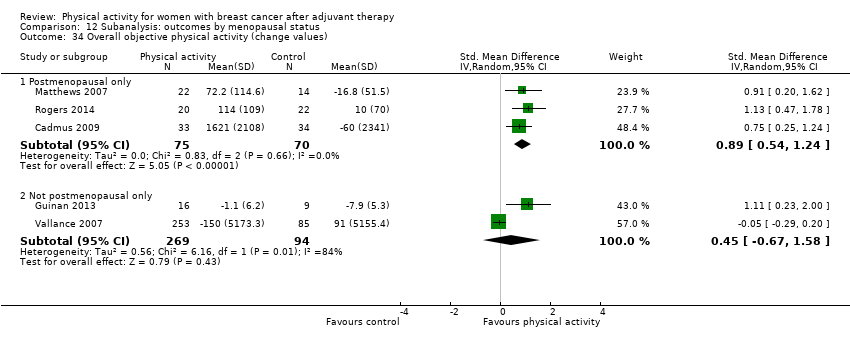
Comparison 12 Subanalysis: outcomes by menopausal status, Outcome 34 Overall objective physical activity (change values).

Comparison 12 Subanalysis: outcomes by menopausal status, Outcome 35 Mass (follow‐up values).

Comparison 12 Subanalysis: outcomes by menopausal status, Outcome 36 Mass (change values).
Comparison 12 Subanalysis: outcomes by menopausal status, Outcome 37 BMI (follow‐up values).

Comparison 12 Subanalysis: outcomes by menopausal status, Outcome 38 BMI (change values).
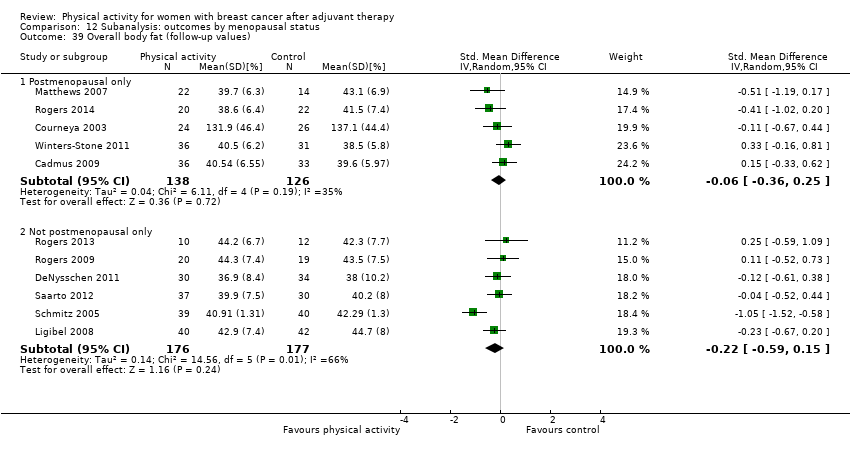
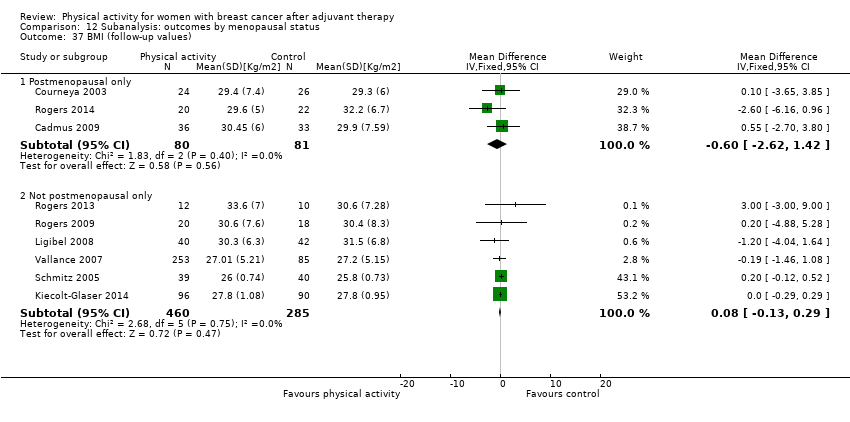
Comparison 12 Subanalysis: outcomes by menopausal status, Outcome 39 Overall body fat (follow‐up values).

Comparison 12 Subanalysis: outcomes by menopausal status, Outcome 40 Overall body fat (change values).

Comparison 12 Subanalysis: outcomes by menopausal status, Outcome 41 Lower body strength (follow‐up values).
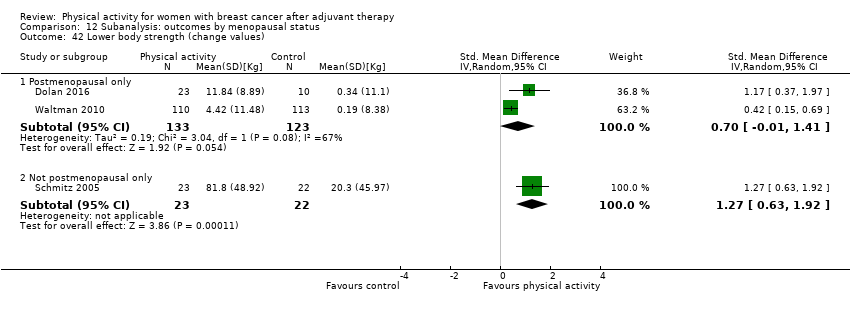
Comparison 12 Subanalysis: outcomes by menopausal status, Outcome 42 Lower body strength (change values).

Comparison 12 Subanalysis: outcomes by menopausal status, Outcome 43 Upper body strength (follow‐up values).
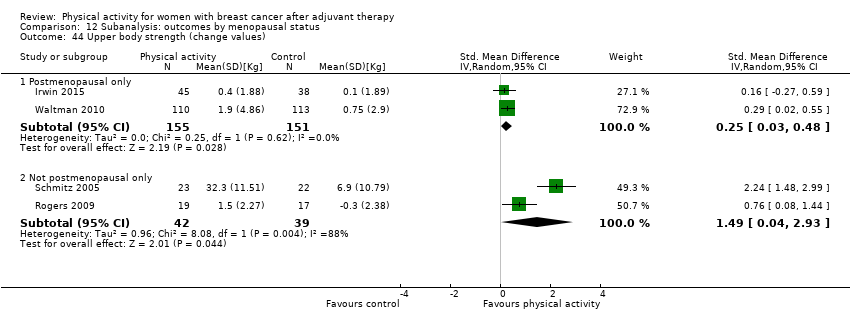
Comparison 12 Subanalysis: outcomes by menopausal status, Outcome 44 Upper body strength (change values).

Comparison 12 Subanalysis: outcomes by menopausal status, Outcome 45 Bone mineral density ‐ femoral neck (follow‐up and change values).

Comparison 12 Subanalysis: outcomes by menopausal status, Outcome 46 Bone mineral density ‐ lumbar spine (follow‐up and change values).

Comparison 13 Subanalysis: outcomes by mode of physical activity intervention, Outcome 1 Overall HRQoL (follow‐up values).
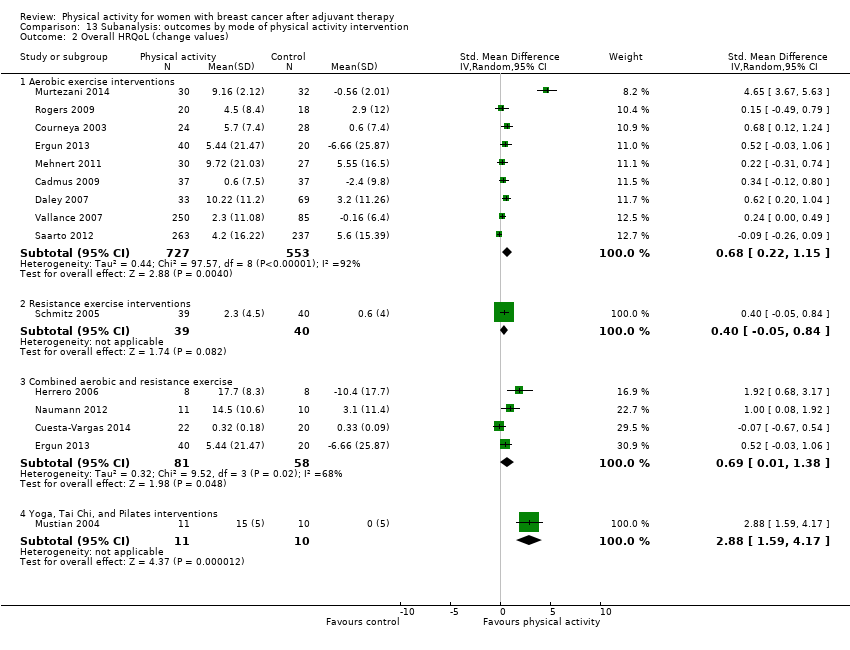
Comparison 13 Subanalysis: outcomes by mode of physical activity intervention, Outcome 2 Overall HRQoL (change values).
Comparison 13 Subanalysis: outcomes by mode of physical activity intervention, Outcome 3 Overall emotional function/mental health (follow‐up values).

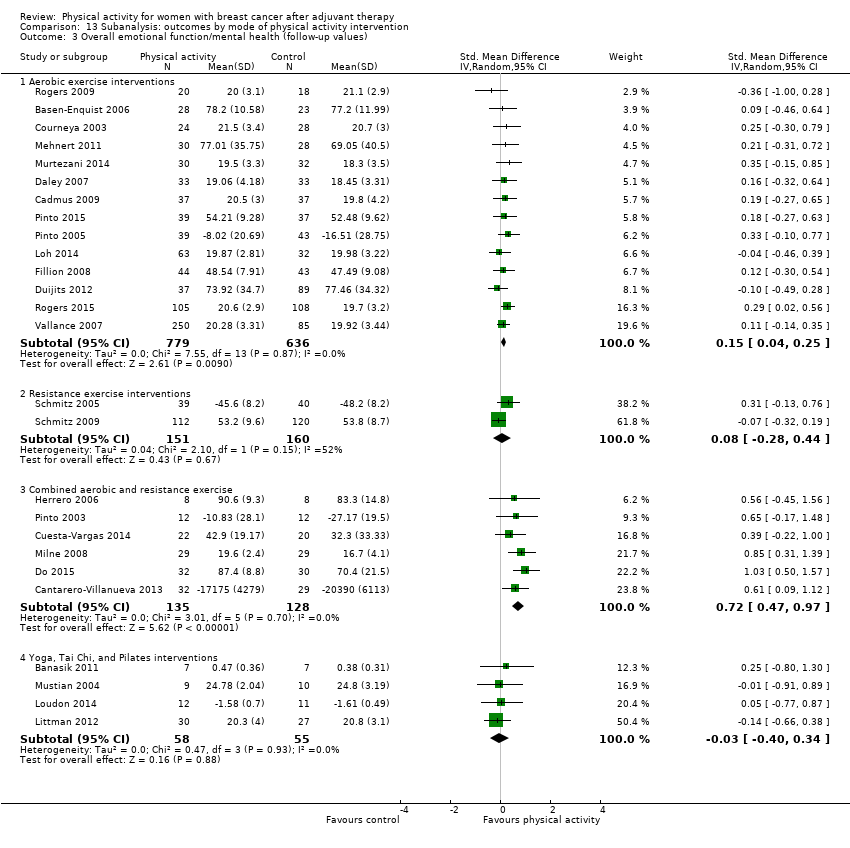
Comparison 13 Subanalysis: outcomes by mode of physical activity intervention, Outcome 4 Overall emotional function/mental health (change values).

Comparison 13 Subanalysis: outcomes by mode of physical activity intervention, Outcome 5 Overall physical function (follow‐up values).

Comparison 13 Subanalysis: outcomes by mode of physical activity intervention, Outcome 6 Overall physical function (change values).
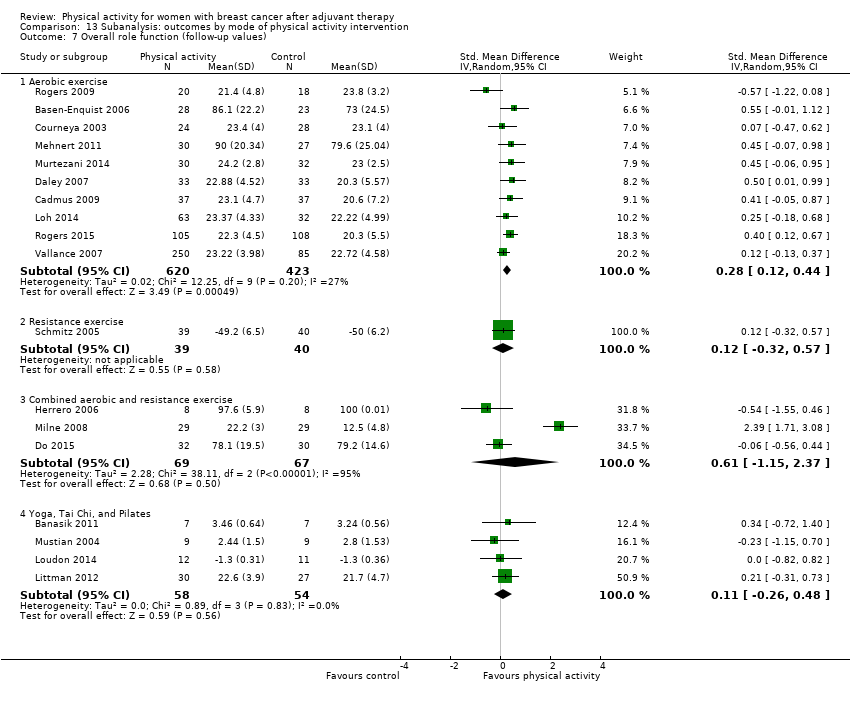
Comparison 13 Subanalysis: outcomes by mode of physical activity intervention, Outcome 7 Overall role function (follow‐up values).
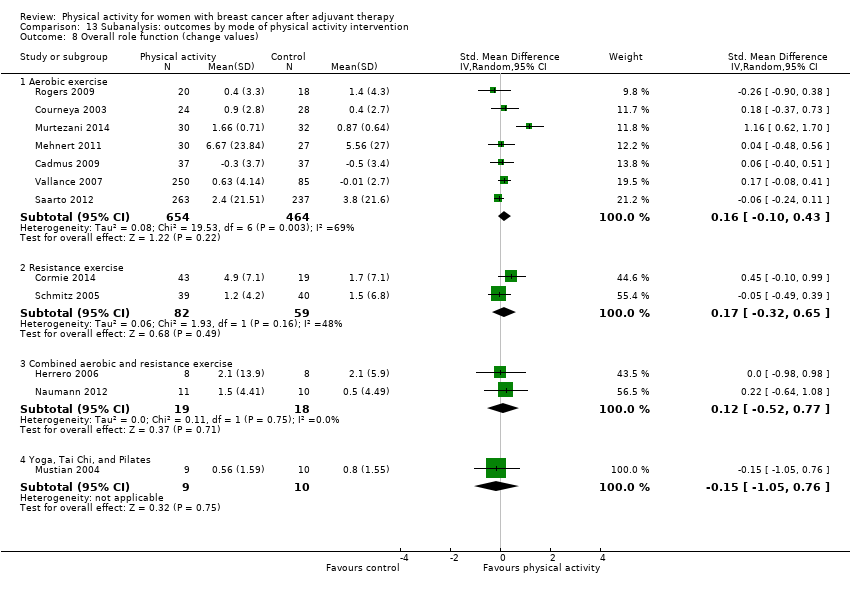
Comparison 13 Subanalysis: outcomes by mode of physical activity intervention, Outcome 8 Overall role function (change values).

Comparison 13 Subanalysis: outcomes by mode of physical activity intervention, Outcome 9 Overall social well‐being/function (follow‐up values).

Comparison 13 Subanalysis: outcomes by mode of physical activity intervention, Outcome 10 Overall social well‐being/function (change values).

Comparison 13 Subanalysis: outcomes by mode of physical activity intervention, Outcome 11 Overall cognitive function (follow‐up values).

Comparison 13 Subanalysis: outcomes by mode of physical activity intervention, Outcome 12 Overall cognitive function (change values).
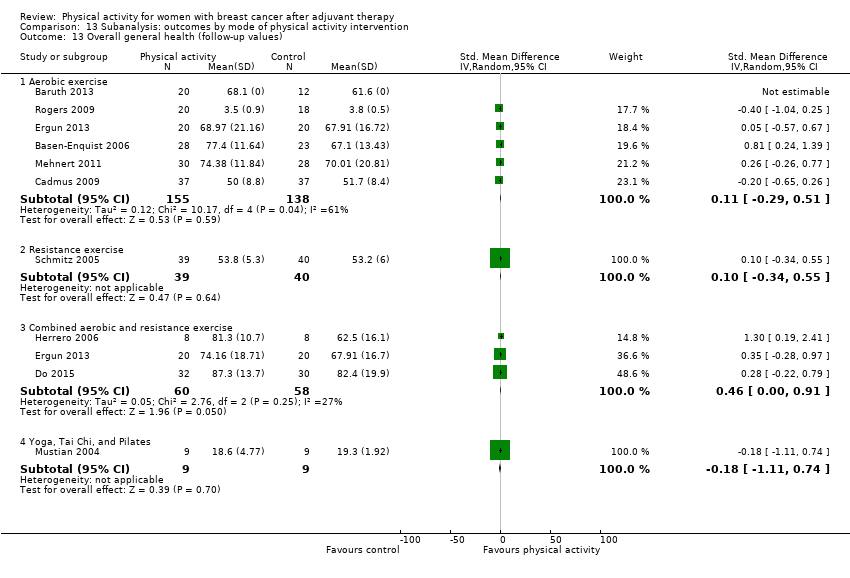
Comparison 13 Subanalysis: outcomes by mode of physical activity intervention, Outcome 13 Overall general health (follow‐up values).

Comparison 13 Subanalysis: outcomes by mode of physical activity intervention, Outcome 14 Overall general health (change values).

Comparison 13 Subanalysis: outcomes by mode of physical activity intervention, Outcome 15 Overall sexual function (follow‐up values).
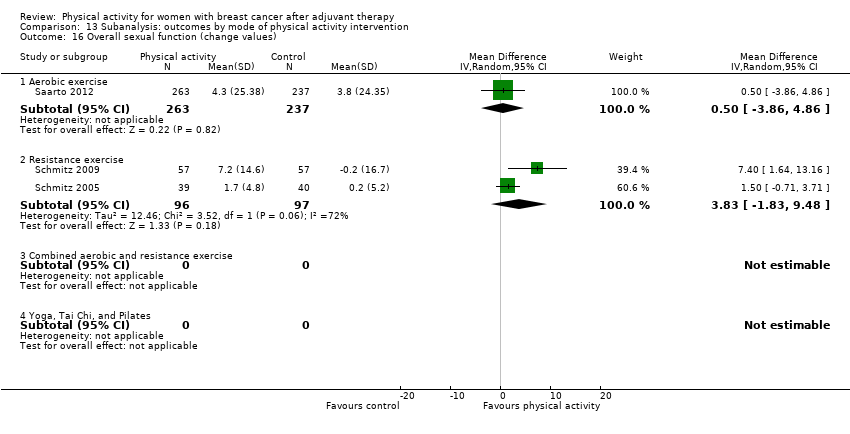
Comparison 13 Subanalysis: outcomes by mode of physical activity intervention, Outcome 16 Overall sexual function (change values).
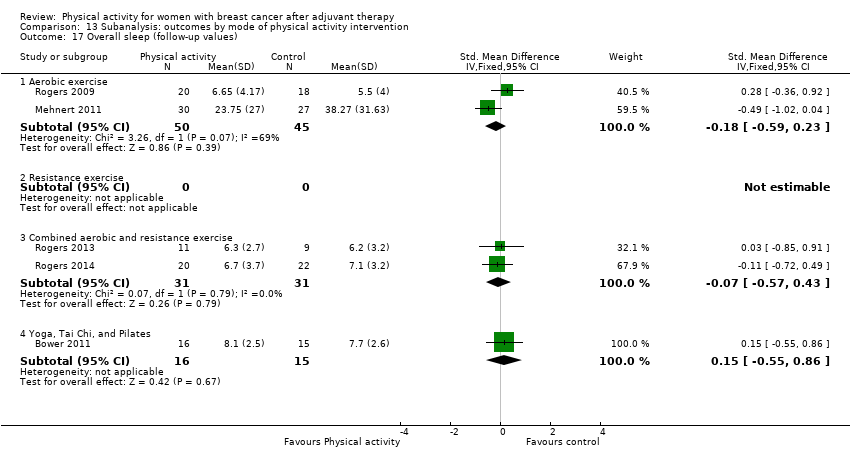
Comparison 13 Subanalysis: outcomes by mode of physical activity intervention, Outcome 17 Overall sleep (follow‐up values).

Comparison 13 Subanalysis: outcomes by mode of physical activity intervention, Outcome 18 Overall sleep (change values).

Comparison 13 Subanalysis: outcomes by mode of physical activity intervention, Outcome 19 Overall anxiety (follow‐up values).
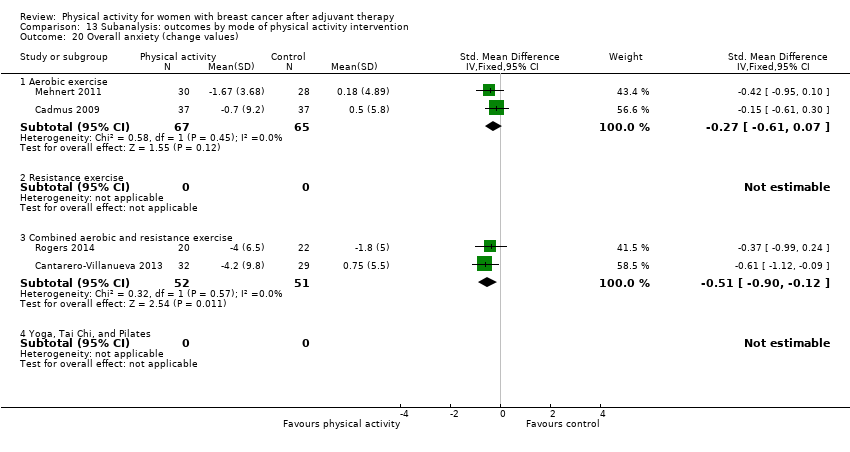
Comparison 13 Subanalysis: outcomes by mode of physical activity intervention, Outcome 20 Overall anxiety (change values).
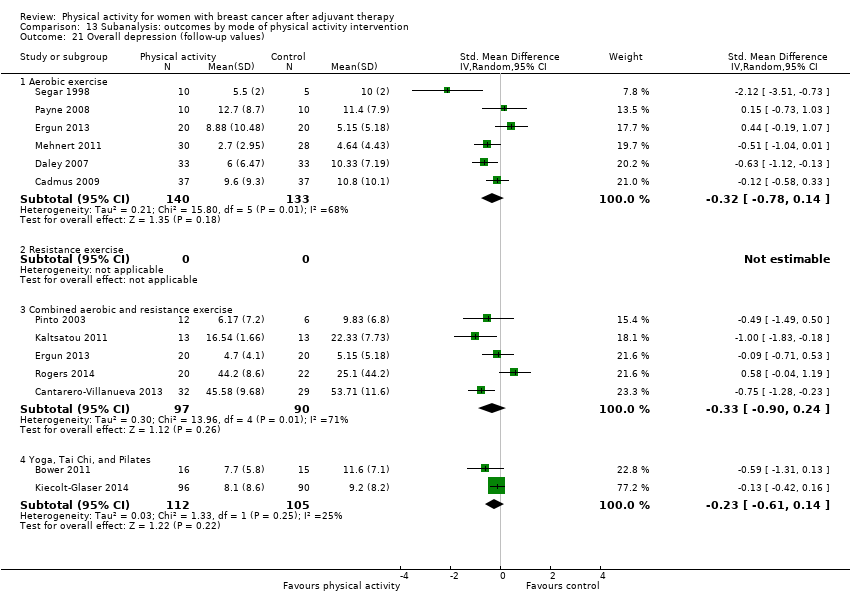
Comparison 13 Subanalysis: outcomes by mode of physical activity intervention, Outcome 21 Overall depression (follow‐up values).
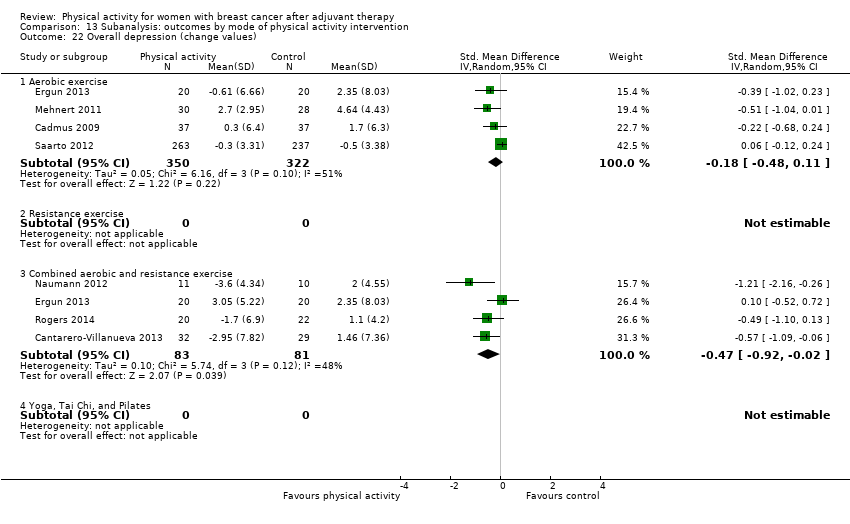
Comparison 13 Subanalysis: outcomes by mode of physical activity intervention, Outcome 22 Overall depression (change values).

Comparison 13 Subanalysis: outcomes by mode of physical activity intervention, Outcome 23 Overall fatigue (follow‐up values).

Comparison 13 Subanalysis: outcomes by mode of physical activity intervention, Outcome 24 Overall fatigue (change values).

Comparison 13 Subanalysis: outcomes by mode of physical activity intervention, Outcome 25 Overall pain/disability (follow‐up values).
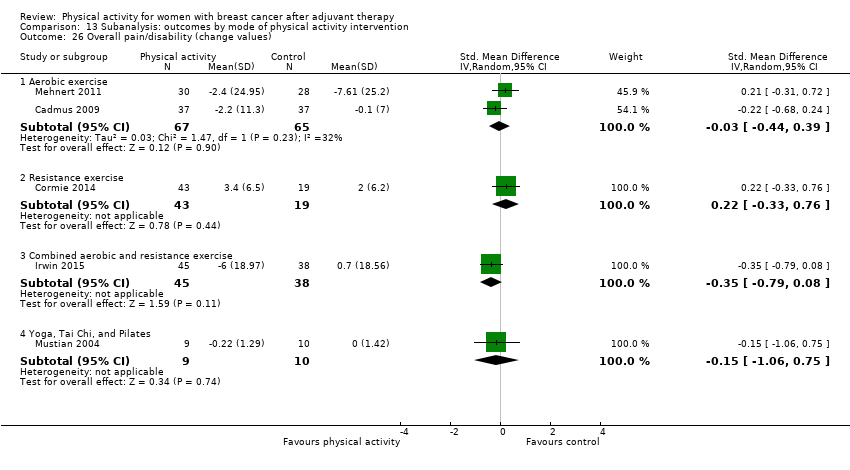
Comparison 13 Subanalysis: outcomes by mode of physical activity intervention, Outcome 26 Overall pain/disability (change values).

Comparison 13 Subanalysis: outcomes by mode of physical activity intervention, Outcome 27 Overall self‐esteem/body image (follow‐up values).
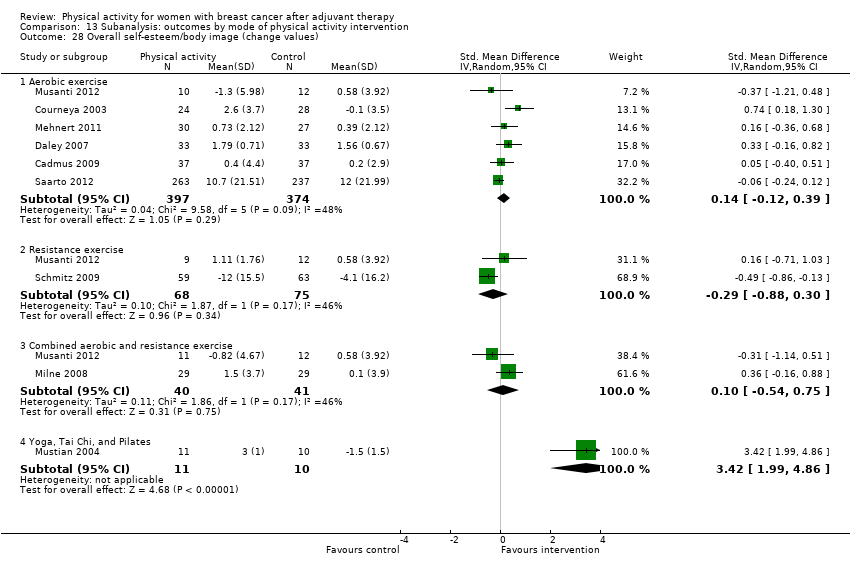
Comparison 13 Subanalysis: outcomes by mode of physical activity intervention, Outcome 28 Overall self‐esteem/body image (change values).
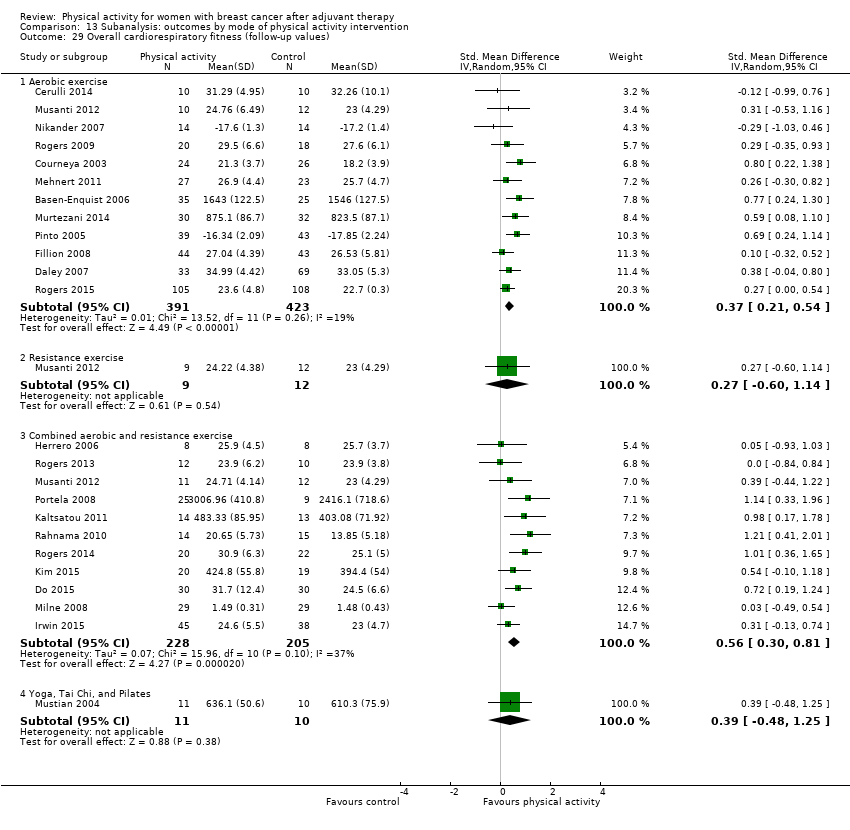
Comparison 13 Subanalysis: outcomes by mode of physical activity intervention, Outcome 29 Overall cardiorespiratory fitness (follow‐up values).

Comparison 13 Subanalysis: outcomes by mode of physical activity intervention, Outcome 30 Overall cardiorespiratory fitness (change values).
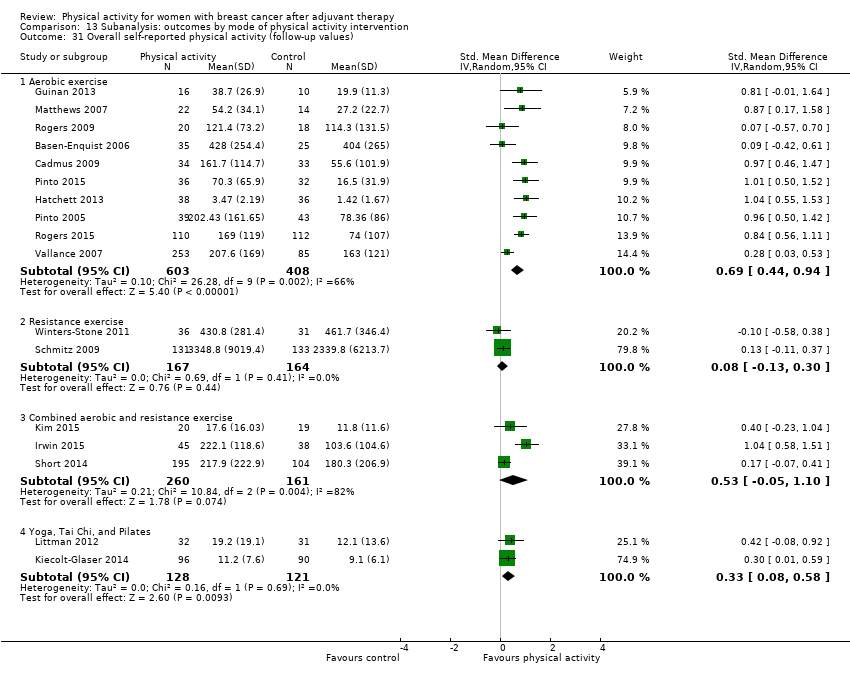
Comparison 13 Subanalysis: outcomes by mode of physical activity intervention, Outcome 31 Overall self‐reported physical activity (follow‐up values).

Comparison 13 Subanalysis: outcomes by mode of physical activity intervention, Outcome 32 Overall self‐reported physical activity (change values).
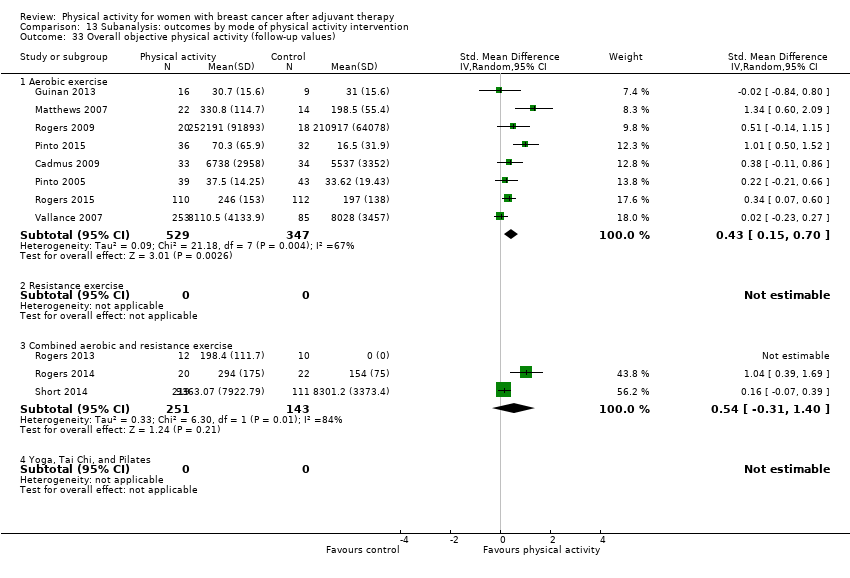
Comparison 13 Subanalysis: outcomes by mode of physical activity intervention, Outcome 33 Overall objective physical activity (follow‐up values).

Comparison 13 Subanalysis: outcomes by mode of physical activity intervention, Outcome 34 Overall objective physical activity (change values).
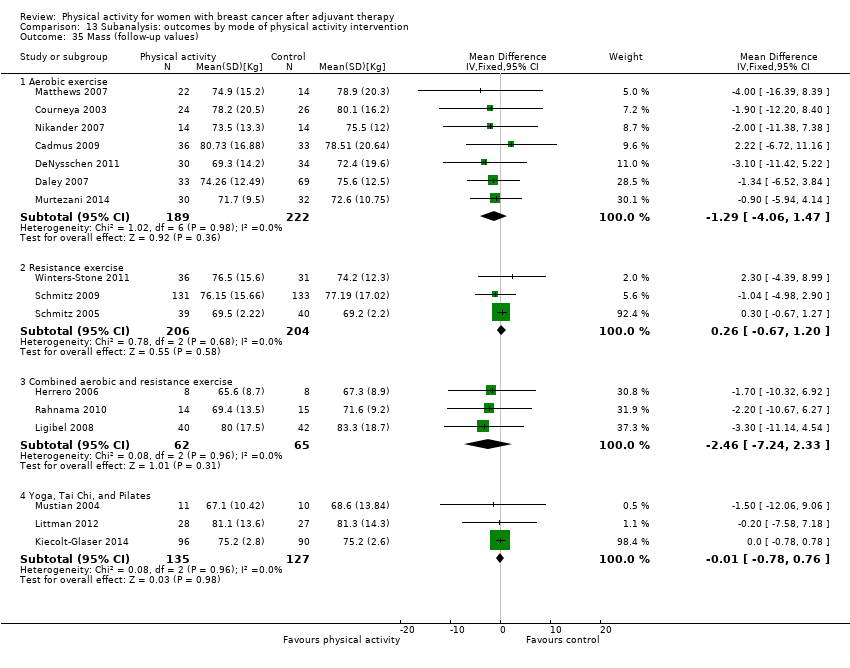
Comparison 13 Subanalysis: outcomes by mode of physical activity intervention, Outcome 35 Mass (follow‐up values).
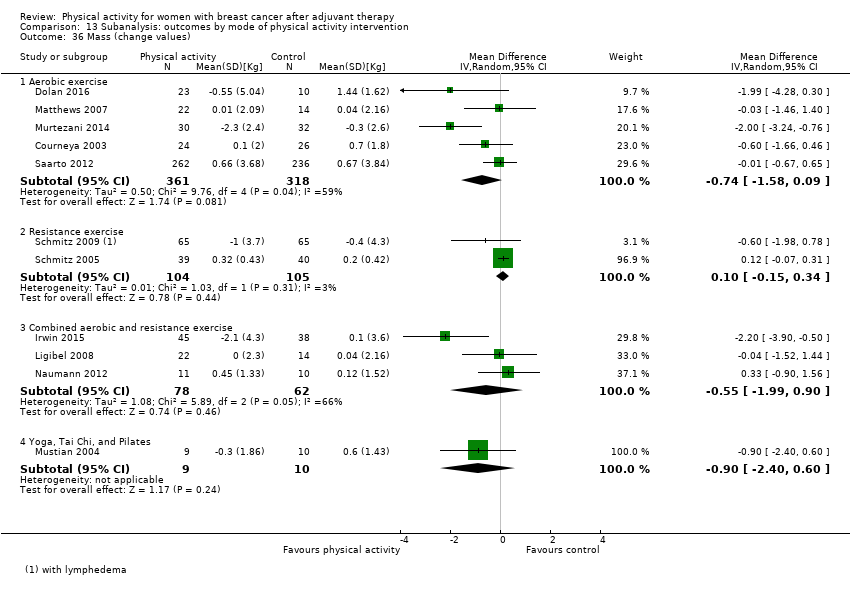
Comparison 13 Subanalysis: outcomes by mode of physical activity intervention, Outcome 36 Mass (change values).

Comparison 13 Subanalysis: outcomes by mode of physical activity intervention, Outcome 37 BMI (follow‐up values).

Comparison 13 Subanalysis: outcomes by mode of physical activity intervention, Outcome 38 BMI (change values).

Comparison 13 Subanalysis: outcomes by mode of physical activity intervention, Outcome 39 Overall body fat (follow‐up values).
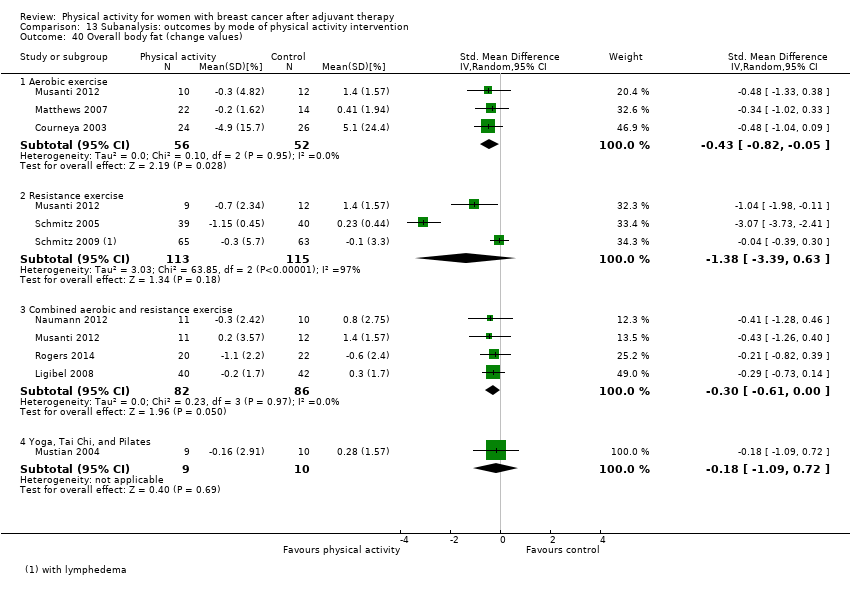
Comparison 13 Subanalysis: outcomes by mode of physical activity intervention, Outcome 40 Overall body fat (change values).

Comparison 13 Subanalysis: outcomes by mode of physical activity intervention, Outcome 41 Lower body strength (follow‐up values).

Comparison 13 Subanalysis: outcomes by mode of physical activity intervention, Outcome 42 Lower body strength (change values).
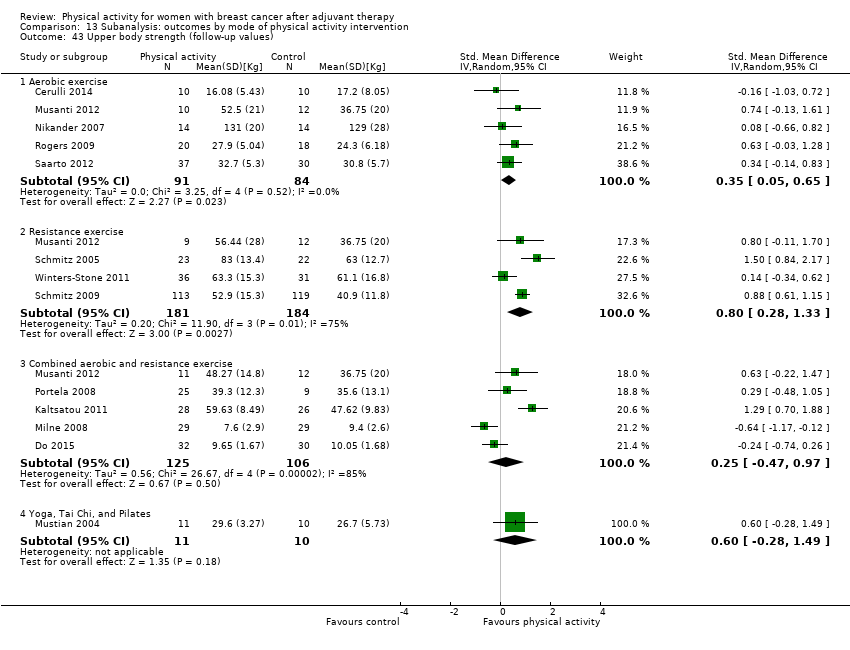
Comparison 13 Subanalysis: outcomes by mode of physical activity intervention, Outcome 43 Upper body strength (follow‐up values).

Comparison 13 Subanalysis: outcomes by mode of physical activity intervention, Outcome 44 Upper body strength (change values).
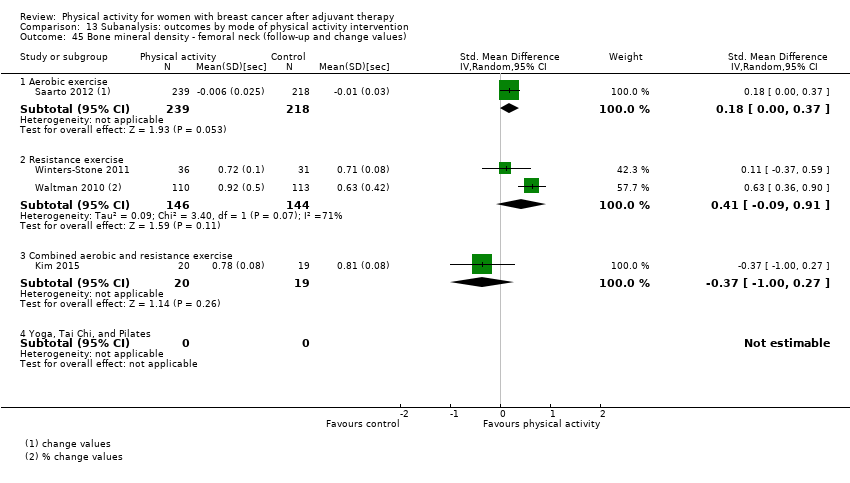
Comparison 13 Subanalysis: outcomes by mode of physical activity intervention, Outcome 45 Bone mineral density ‐ femoral neck (follow‐up and change values).

Comparison 13 Subanalysis: outcomes by mode of physical activity intervention, Outcome 46 Bone mineral density ‐ lumbar spine (follow‐up and change values).

Comparison 13 Subanalysis: outcomes by mode of physical activity intervention, Outcome 47 Bone mineral density ‐ total hip (follow‐up and change values).
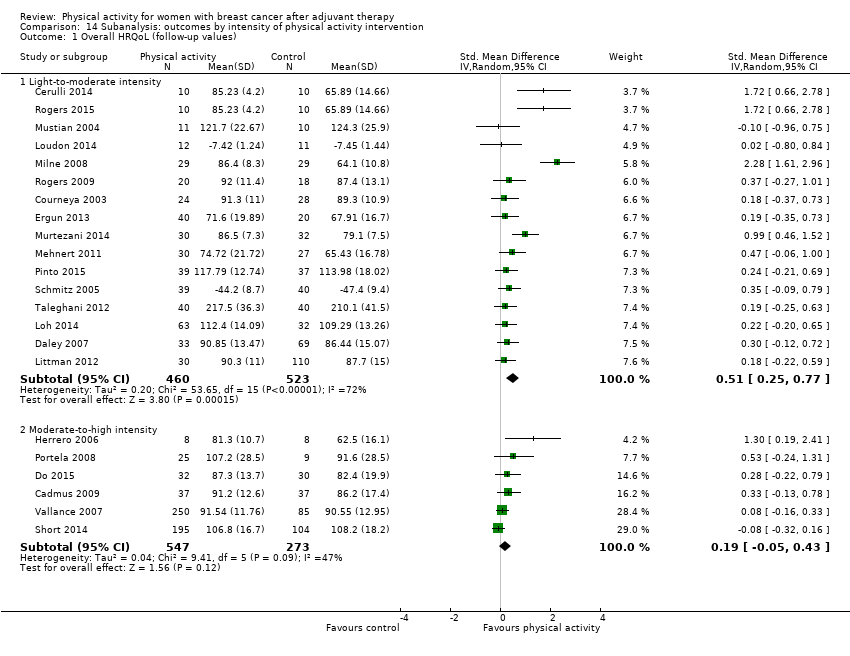
Comparison 14 Subanalysis: outcomes by intensity of physical activity intervention, Outcome 1 Overall HRQoL (follow‐up values).
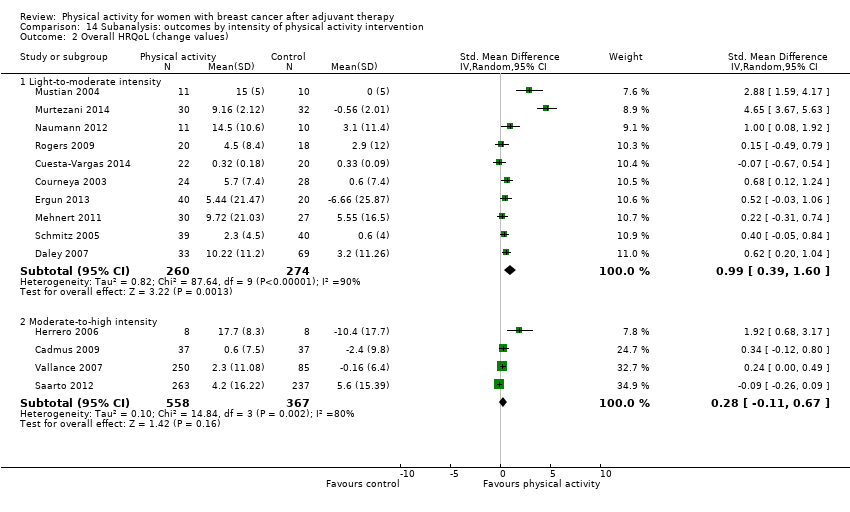
Comparison 14 Subanalysis: outcomes by intensity of physical activity intervention, Outcome 2 Overall HRQoL (change values).

Comparison 14 Subanalysis: outcomes by intensity of physical activity intervention, Outcome 3 Overall emotional function/mental health (follow‐up values).

Comparison 14 Subanalysis: outcomes by intensity of physical activity intervention, Outcome 4 Overall emotional function/mental health (change values).
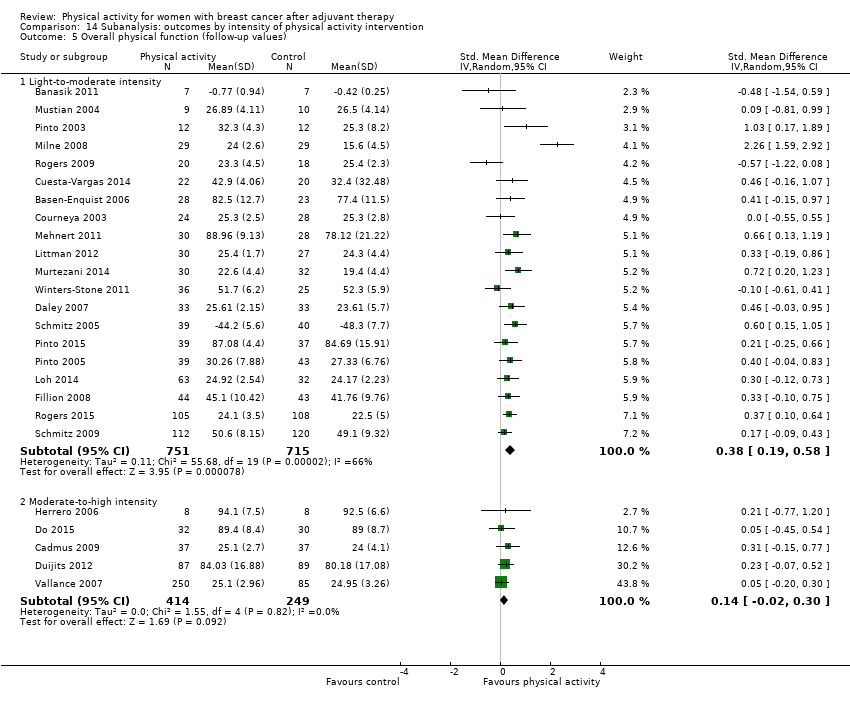
Comparison 14 Subanalysis: outcomes by intensity of physical activity intervention, Outcome 5 Overall physical function (follow‐up values).

Comparison 14 Subanalysis: outcomes by intensity of physical activity intervention, Outcome 6 Overall physical function (change values).

Comparison 14 Subanalysis: outcomes by intensity of physical activity intervention, Outcome 7 Overall role function (follow‐up values).

Comparison 14 Subanalysis: outcomes by intensity of physical activity intervention, Outcome 8 Overall role function (change values).

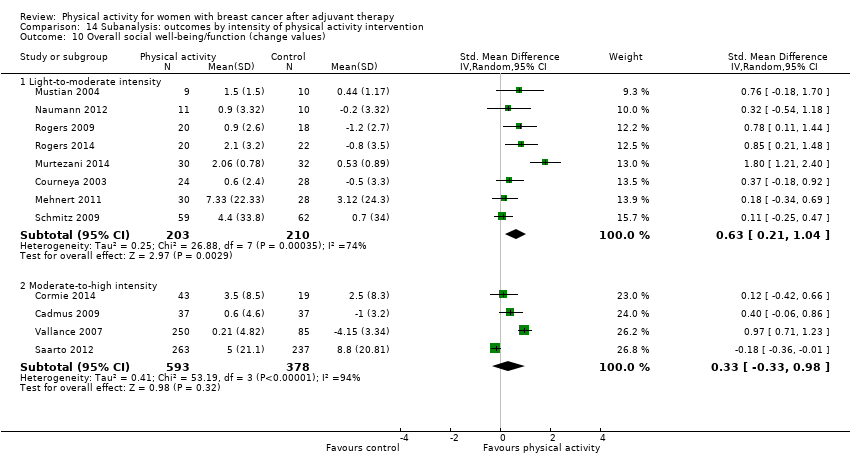
Comparison 14 Subanalysis: outcomes by intensity of physical activity intervention, Outcome 9 Overall social well‐being/function (follow‐up values).
Comparison 14 Subanalysis: outcomes by intensity of physical activity intervention, Outcome 10 Overall social well‐being/function (change values).

Comparison 14 Subanalysis: outcomes by intensity of physical activity intervention, Outcome 11 Overall cognitive function (follow‐up values).
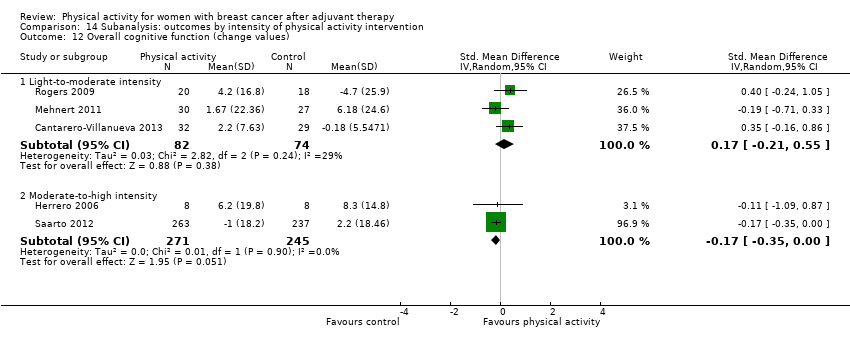
Comparison 14 Subanalysis: outcomes by intensity of physical activity intervention, Outcome 12 Overall cognitive function (change values).

Comparison 14 Subanalysis: outcomes by intensity of physical activity intervention, Outcome 13 Overall general health (follow‐up values).
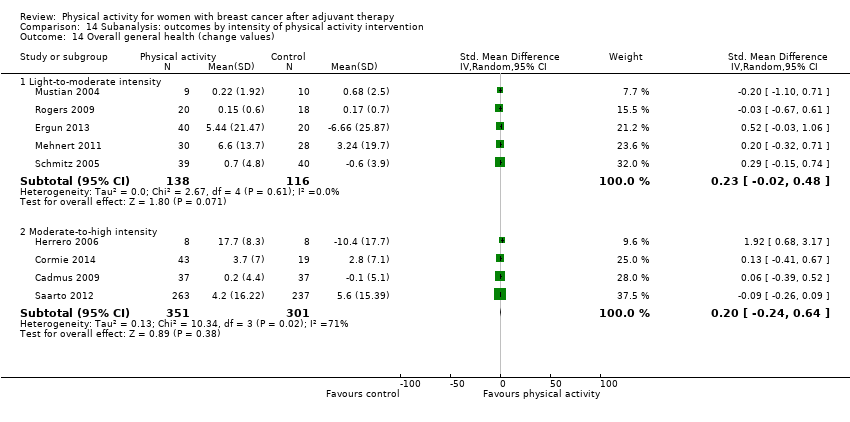
Comparison 14 Subanalysis: outcomes by intensity of physical activity intervention, Outcome 14 Overall general health (change values).
Comparison 14 Subanalysis: outcomes by intensity of physical activity intervention, Outcome 15 Overall sexual function (follow‐up values).

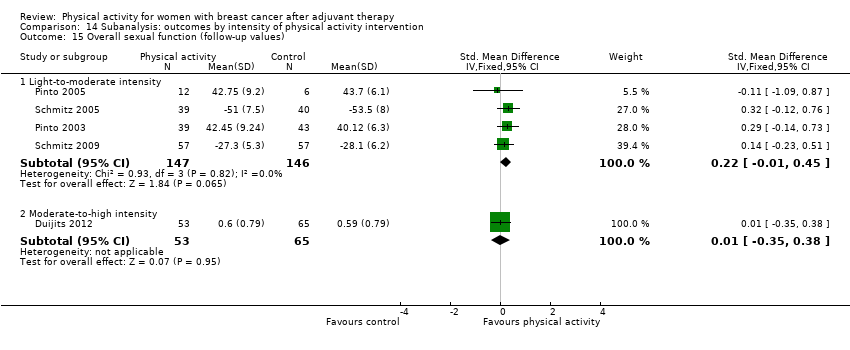
Comparison 14 Subanalysis: outcomes by intensity of physical activity intervention, Outcome 16 Overall sexual function (change values).
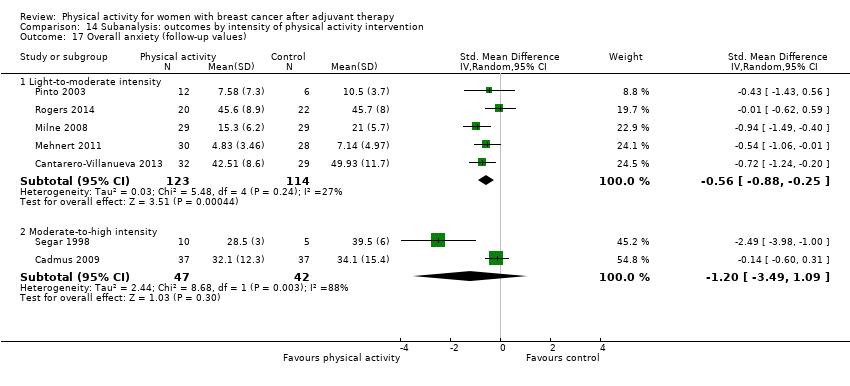
Comparison 14 Subanalysis: outcomes by intensity of physical activity intervention, Outcome 17 Overall anxiety (follow‐up values).
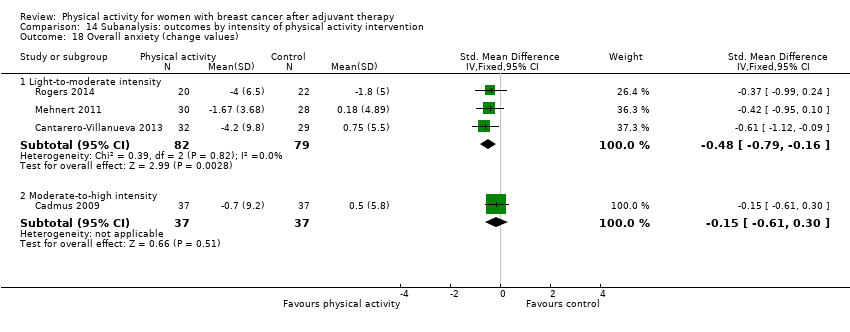
Comparison 14 Subanalysis: outcomes by intensity of physical activity intervention, Outcome 18 Overall anxiety (change values).

Comparison 14 Subanalysis: outcomes by intensity of physical activity intervention, Outcome 19 Overall depression (follow‐up values).

Comparison 14 Subanalysis: outcomes by intensity of physical activity intervention, Outcome 20 Overall depression (change values).

Comparison 14 Subanalysis: outcomes by intensity of physical activity intervention, Outcome 21 Overall fatigue (follow‐up values).

Comparison 14 Subanalysis: outcomes by intensity of physical activity intervention, Outcome 22 Overall fatigue (change values).

Comparison 14 Subanalysis: outcomes by intensity of physical activity intervention, Outcome 23 Overall pain/disability (follow‐up values).

Comparison 14 Subanalysis: outcomes by intensity of physical activity intervention, Outcome 24 Overall pain/disability (change values).

Comparison 14 Subanalysis: outcomes by intensity of physical activity intervention, Outcome 25 Overall self‐esteem/body image (follow‐up values).

Comparison 14 Subanalysis: outcomes by intensity of physical activity intervention, Outcome 26 Overall self‐esteem/body image (change values).
Comparison 14 Subanalysis: outcomes by intensity of physical activity intervention, Outcome 27 Overall cardiorespiratory fitness (follow‐up values).

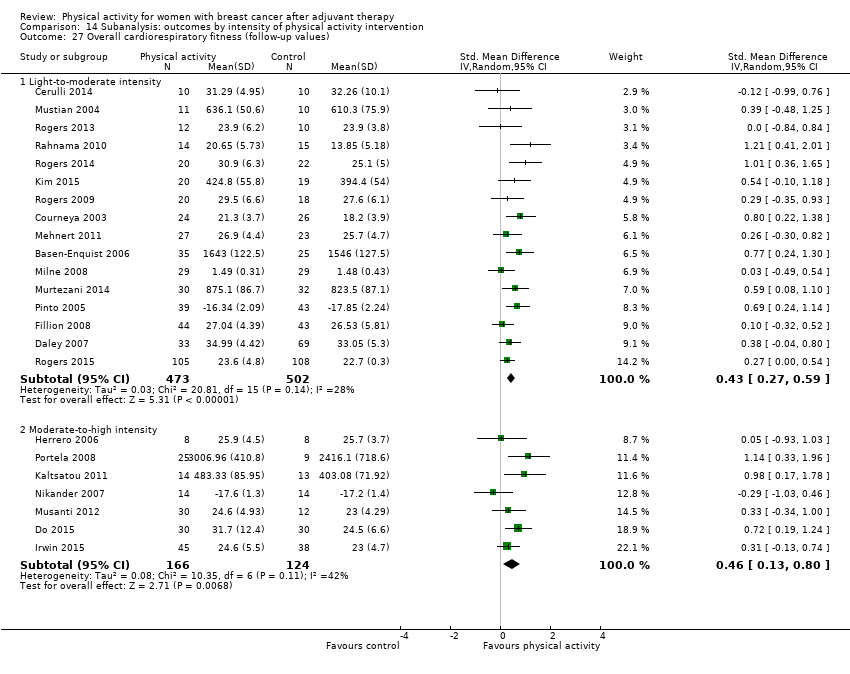
Comparison 14 Subanalysis: outcomes by intensity of physical activity intervention, Outcome 28 Overall cardiorespiratory fitness (change values).
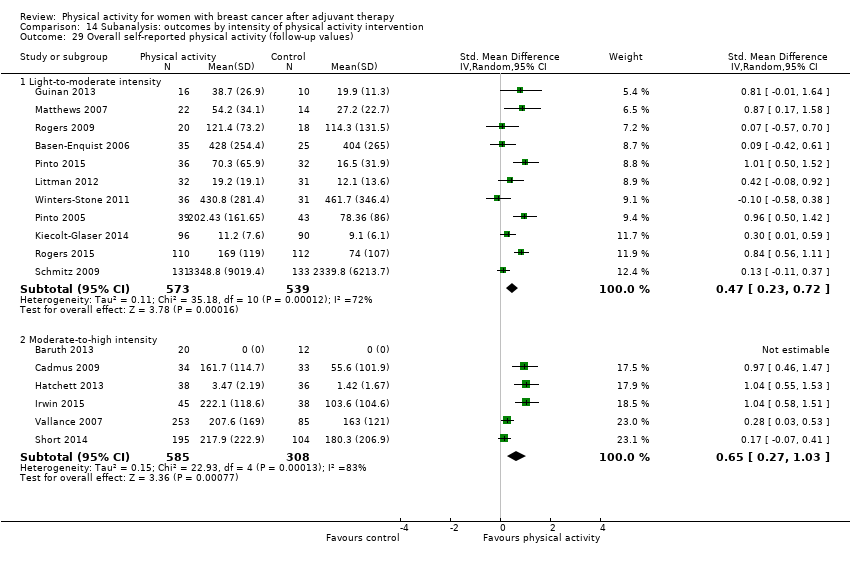
Comparison 14 Subanalysis: outcomes by intensity of physical activity intervention, Outcome 29 Overall self‐reported physical activity (follow‐up values).

Comparison 14 Subanalysis: outcomes by intensity of physical activity intervention, Outcome 30 Overall self‐reported physical activity (change values).
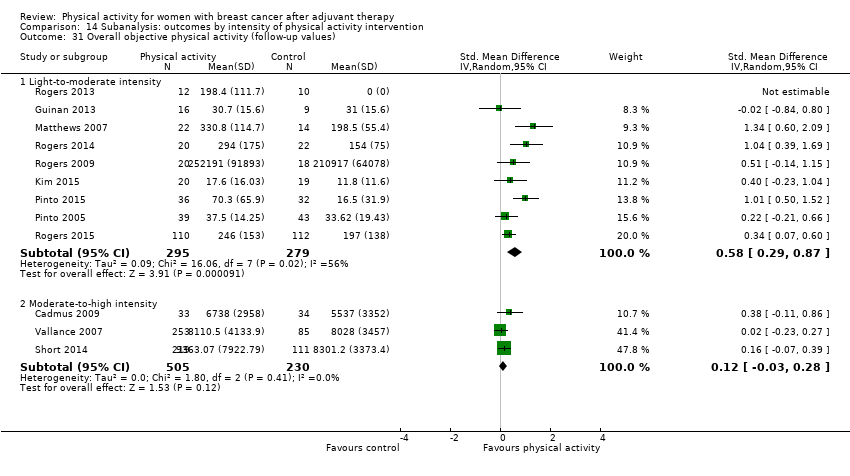
Comparison 14 Subanalysis: outcomes by intensity of physical activity intervention, Outcome 31 Overall objective physical activity (follow‐up values).

Comparison 14 Subanalysis: outcomes by intensity of physical activity intervention, Outcome 32 Overall objective physical activity (change values).

Comparison 14 Subanalysis: outcomes by intensity of physical activity intervention, Outcome 33 Mass (follow‐up values).

Comparison 14 Subanalysis: outcomes by intensity of physical activity intervention, Outcome 34 Mass (change values).

Comparison 14 Subanalysis: outcomes by intensity of physical activity intervention, Outcome 35 BMI (follow‐up values).

Comparison 14 Subanalysis: outcomes by intensity of physical activity intervention, Outcome 36 BMI (change values).

Comparison 14 Subanalysis: outcomes by intensity of physical activity intervention, Outcome 37 Overall body fat (follow‐up values).

Comparison 14 Subanalysis: outcomes by intensity of physical activity intervention, Outcome 38 Overall body fat (change values).

Comparison 14 Subanalysis: outcomes by intensity of physical activity intervention, Outcome 39 Lower body strength (follow‐up values).

Comparison 14 Subanalysis: outcomes by intensity of physical activity intervention, Outcome 40 Lower body strength (change values).
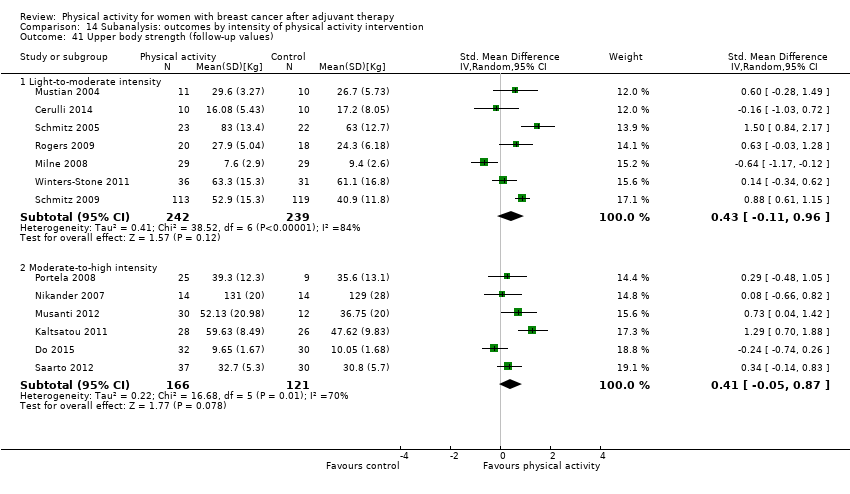
Comparison 14 Subanalysis: outcomes by intensity of physical activity intervention, Outcome 41 Upper body strength (follow‐up values).
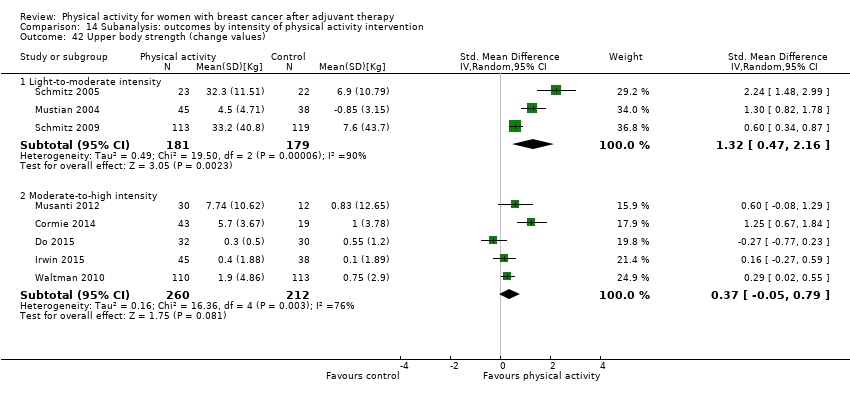
Comparison 14 Subanalysis: outcomes by intensity of physical activity intervention, Outcome 42 Upper body strength (change values).
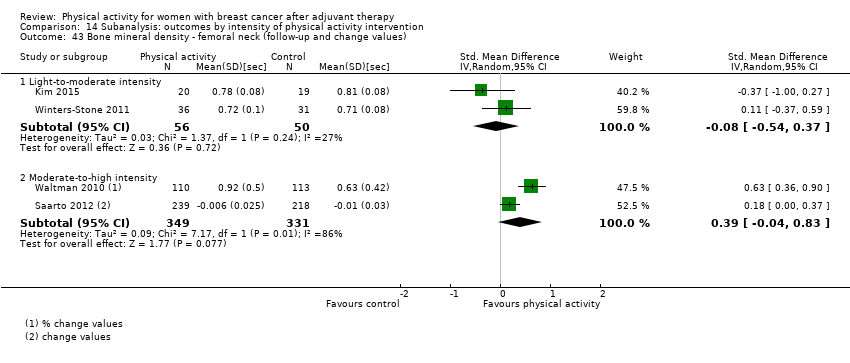
Comparison 14 Subanalysis: outcomes by intensity of physical activity intervention, Outcome 43 Bone mineral density ‐ femoral neck (follow‐up and change values).
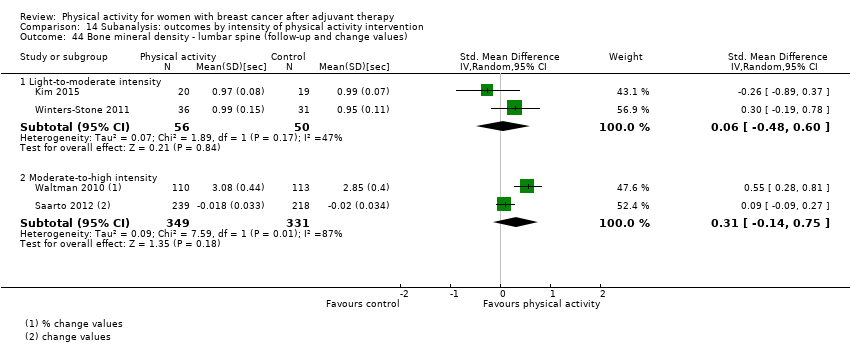
Comparison 14 Subanalysis: outcomes by intensity of physical activity intervention, Outcome 44 Bone mineral density ‐ lumbar spine (follow‐up and change values).

Comparison 14 Subanalysis: outcomes by intensity of physical activity intervention, Outcome 45 Bone mineral density ‐ total hip (follow‐up and change values).

Comparison 15 Subanalysis: outcomes by duration of physical activity intervention, Outcome 1 Overall HRQoL (follow‐up values).

Comparison 15 Subanalysis: outcomes by duration of physical activity intervention, Outcome 2 Overall HRQoL (change values).

Comparison 15 Subanalysis: outcomes by duration of physical activity intervention, Outcome 3 Overall emotional function/mental health (follow‐up values).
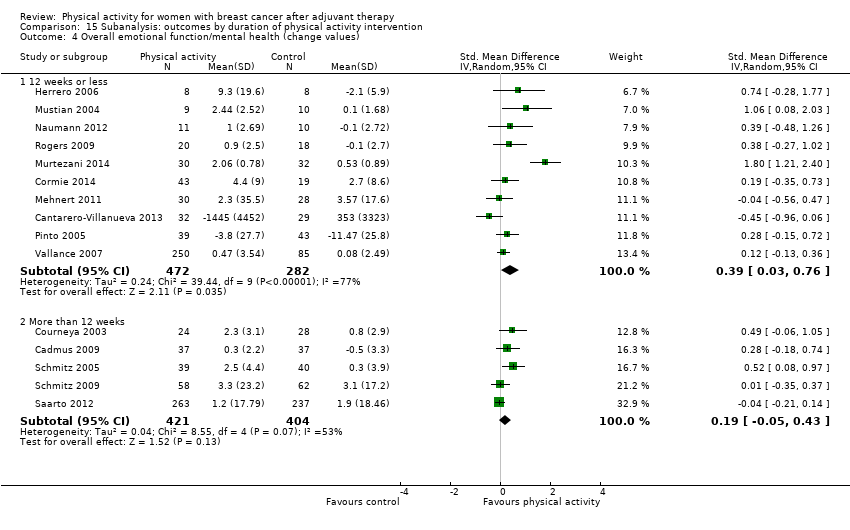
Comparison 15 Subanalysis: outcomes by duration of physical activity intervention, Outcome 4 Overall emotional function/mental health (change values).
Comparison 15 Subanalysis: outcomes by duration of physical activity intervention, Outcome 5 Overall physical function (follow‐up values).

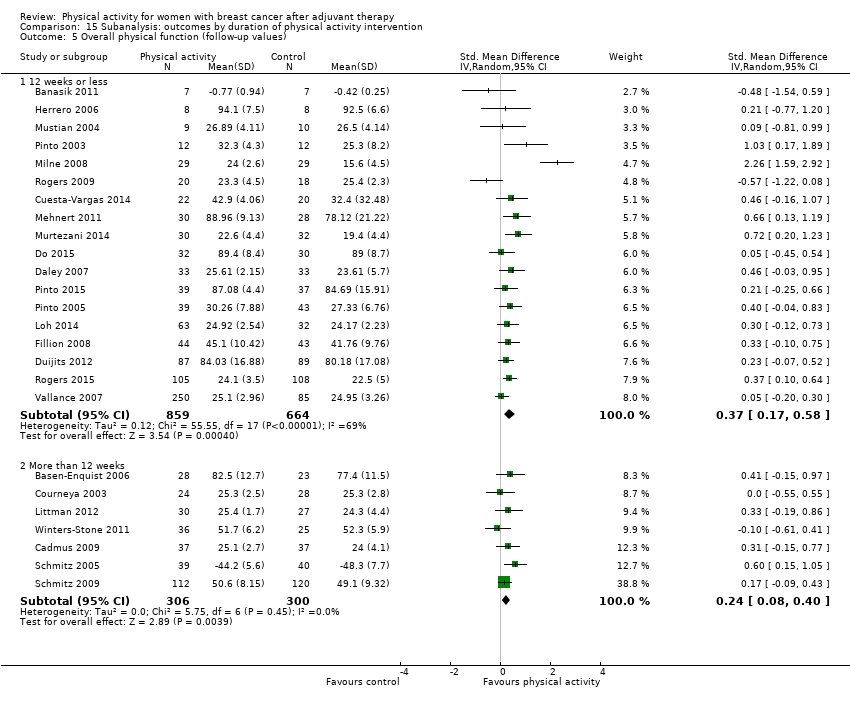
Comparison 15 Subanalysis: outcomes by duration of physical activity intervention, Outcome 6 Overall physical function (change values).

Comparison 15 Subanalysis: outcomes by duration of physical activity intervention, Outcome 7 Overall role function (follow‐up values).

Comparison 15 Subanalysis: outcomes by duration of physical activity intervention, Outcome 8 Overall role function (change values).

Comparison 15 Subanalysis: outcomes by duration of physical activity intervention, Outcome 9 Overall social well‐being/function (follow‐up values).

Comparison 15 Subanalysis: outcomes by duration of physical activity intervention, Outcome 10 Overall social well‐being/function (change values).

Comparison 15 Subanalysis: outcomes by duration of physical activity intervention, Outcome 11 Overall cognitive function (follow‐up values).

Comparison 15 Subanalysis: outcomes by duration of physical activity intervention, Outcome 12 Overall cognitive function (change values).

Comparison 15 Subanalysis: outcomes by duration of physical activity intervention, Outcome 13 Overall general health (follow‐up values).

Comparison 15 Subanalysis: outcomes by duration of physical activity intervention, Outcome 14 Overall general health (change values).

Comparison 15 Subanalysis: outcomes by duration of physical activity intervention, Outcome 15 Overall sexual function (follow‐up values).
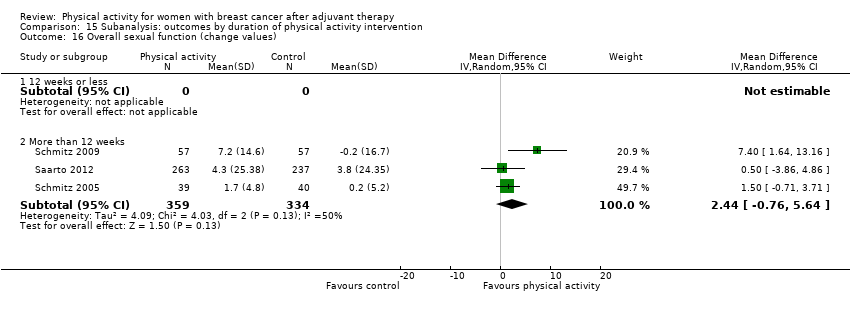
Comparison 15 Subanalysis: outcomes by duration of physical activity intervention, Outcome 16 Overall sexual function (change values).
Comparison 15 Subanalysis: outcomes by duration of physical activity intervention, Outcome 17 Overall sleep (follow‐up values).
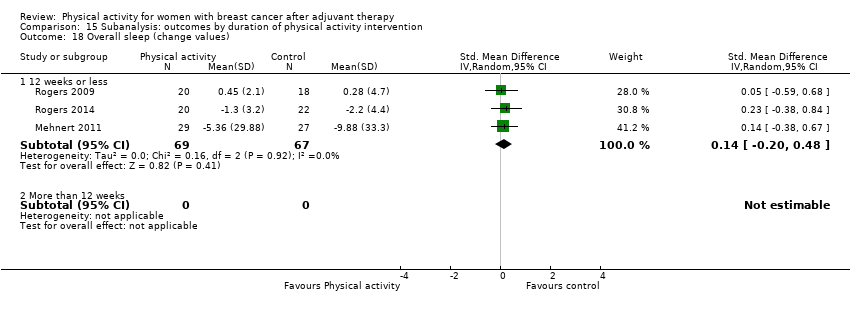
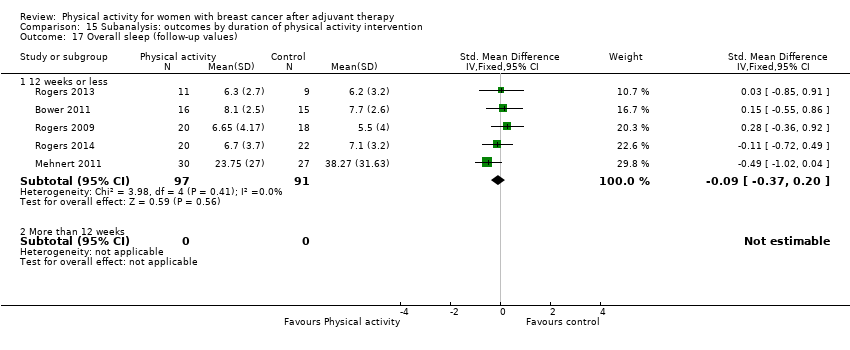
Comparison 15 Subanalysis: outcomes by duration of physical activity intervention, Outcome 18 Overall sleep (change values).
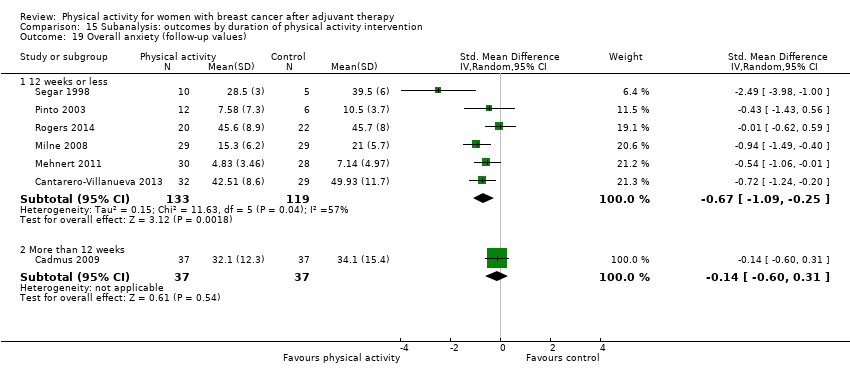
Comparison 15 Subanalysis: outcomes by duration of physical activity intervention, Outcome 19 Overall anxiety (follow‐up values).
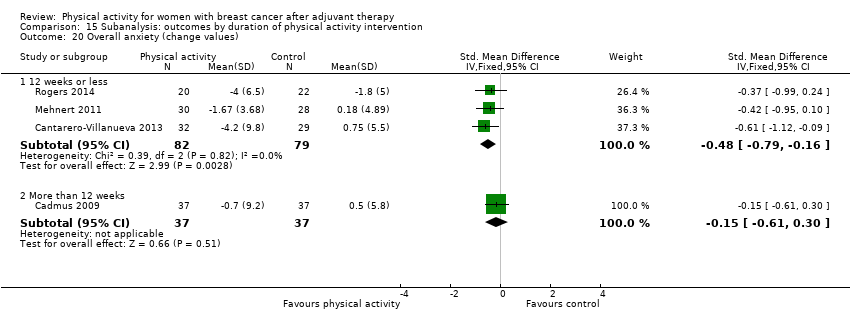
Comparison 15 Subanalysis: outcomes by duration of physical activity intervention, Outcome 20 Overall anxiety (change values).

Comparison 15 Subanalysis: outcomes by duration of physical activity intervention, Outcome 21 Overall depression (follow‐up values).

Comparison 15 Subanalysis: outcomes by duration of physical activity intervention, Outcome 22 Overall depression (change values).
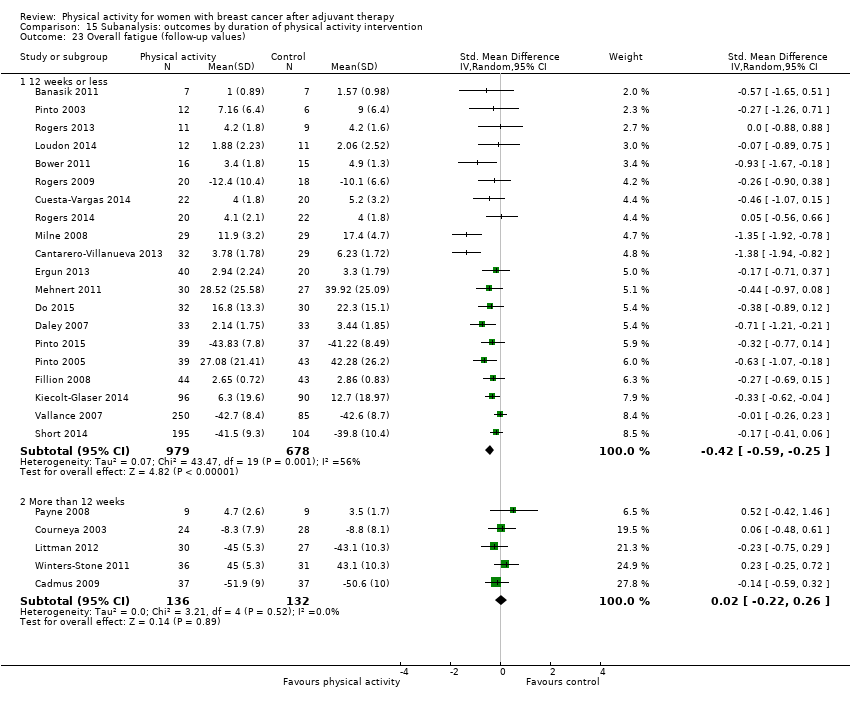
Comparison 15 Subanalysis: outcomes by duration of physical activity intervention, Outcome 23 Overall fatigue (follow‐up values).

Comparison 15 Subanalysis: outcomes by duration of physical activity intervention, Outcome 24 Overall fatigue (change values).

Comparison 15 Subanalysis: outcomes by duration of physical activity intervention, Outcome 25 Overall pain/disability (follow‐up values).
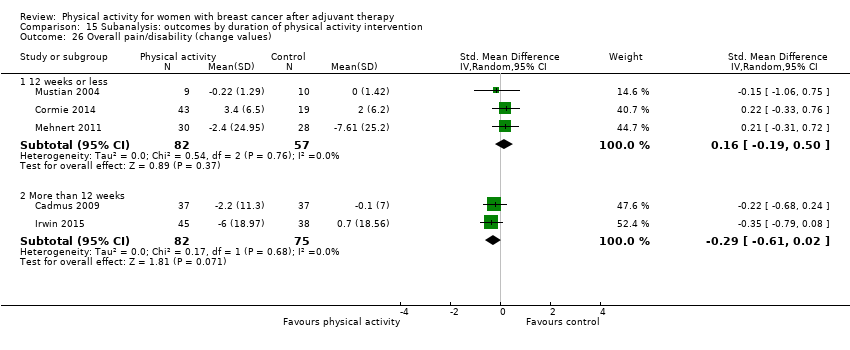
Comparison 15 Subanalysis: outcomes by duration of physical activity intervention, Outcome 26 Overall pain/disability (change values).

Comparison 15 Subanalysis: outcomes by duration of physical activity intervention, Outcome 27 Overall self‐esteem/body image (follow‐up values).

Comparison 15 Subanalysis: outcomes by duration of physical activity intervention, Outcome 28 Overall self‐esteem/body image (change values).

Comparison 15 Subanalysis: outcomes by duration of physical activity intervention, Outcome 29 Overall cardiorespiratory fitness (follow‐up values).
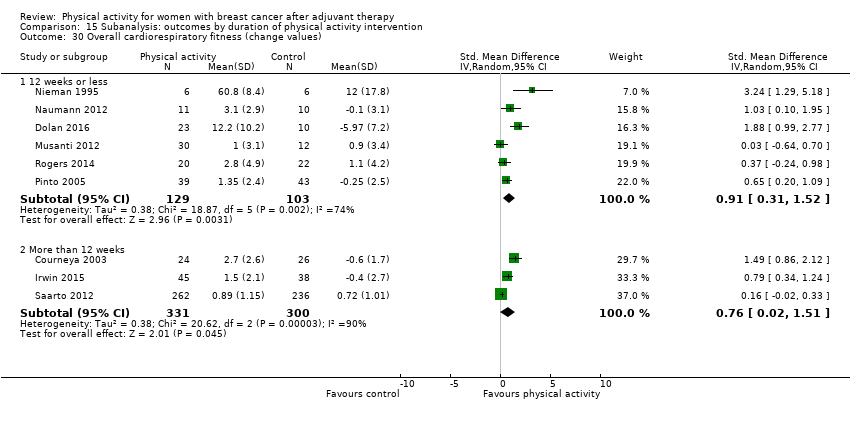
Comparison 15 Subanalysis: outcomes by duration of physical activity intervention, Outcome 30 Overall cardiorespiratory fitness (change values).
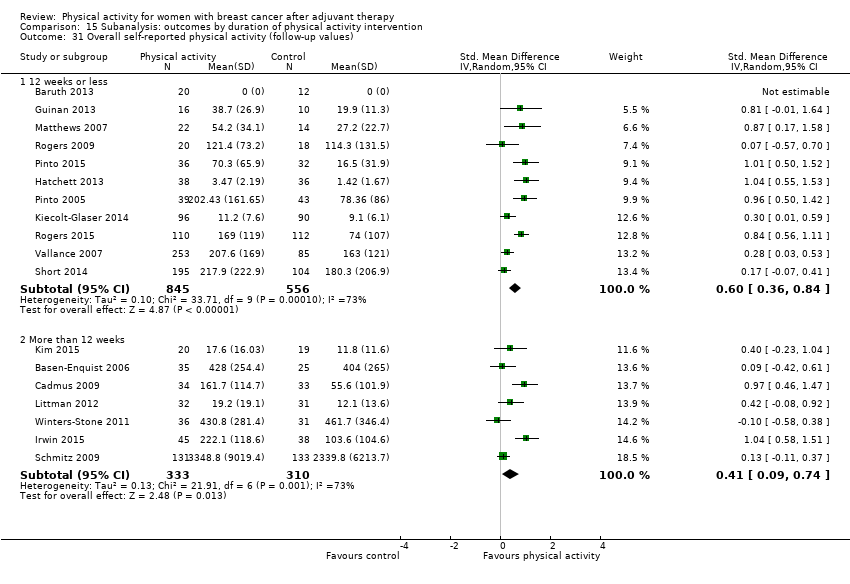
Comparison 15 Subanalysis: outcomes by duration of physical activity intervention, Outcome 31 Overall self‐reported physical activity (follow‐up values).
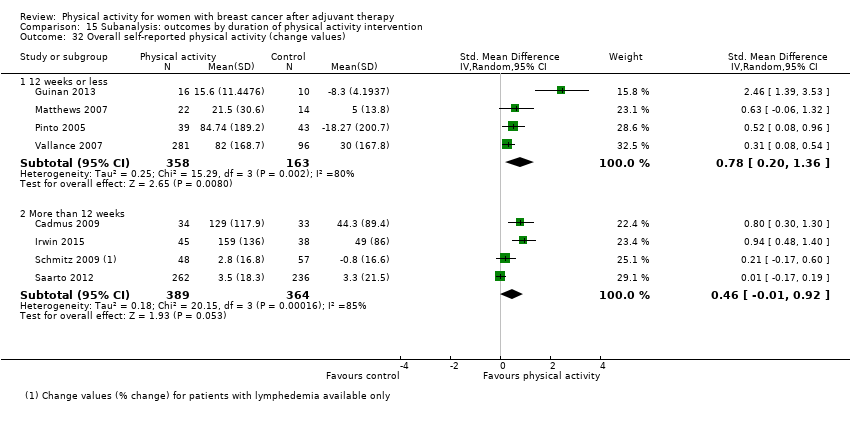
Comparison 15 Subanalysis: outcomes by duration of physical activity intervention, Outcome 32 Overall self‐reported physical activity (change values).
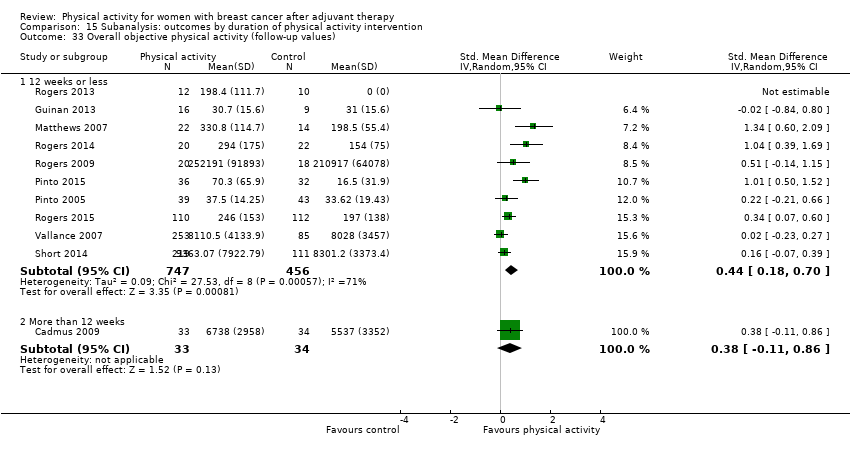
Comparison 15 Subanalysis: outcomes by duration of physical activity intervention, Outcome 33 Overall objective physical activity (follow‐up values).
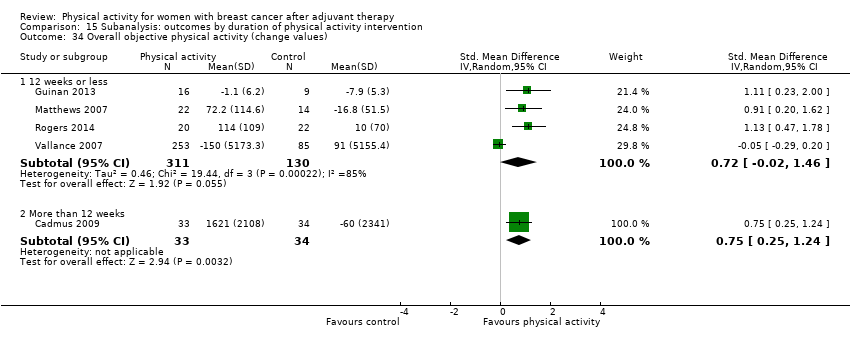
Comparison 15 Subanalysis: outcomes by duration of physical activity intervention, Outcome 34 Overall objective physical activity (change values).
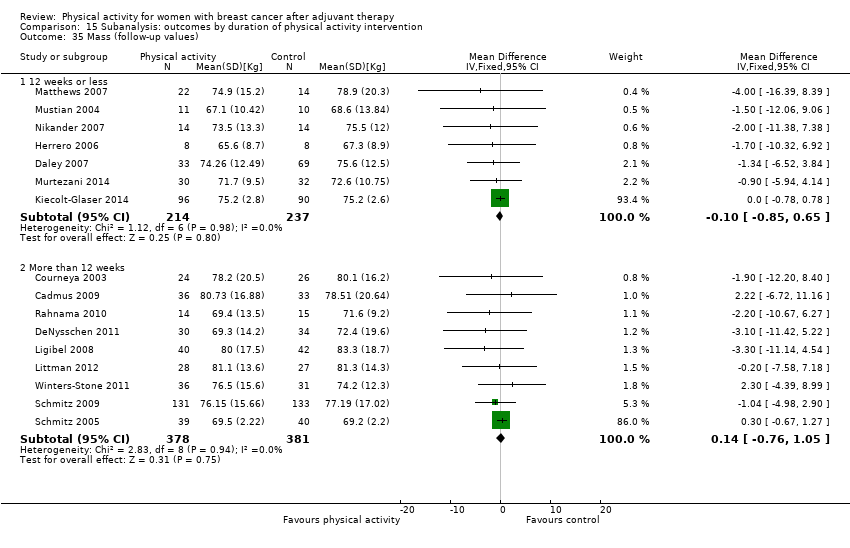
Comparison 15 Subanalysis: outcomes by duration of physical activity intervention, Outcome 35 Mass (follow‐up values).

Comparison 15 Subanalysis: outcomes by duration of physical activity intervention, Outcome 36 Mass (change values).

Comparison 15 Subanalysis: outcomes by duration of physical activity intervention, Outcome 37 BMI (follow‐up values).
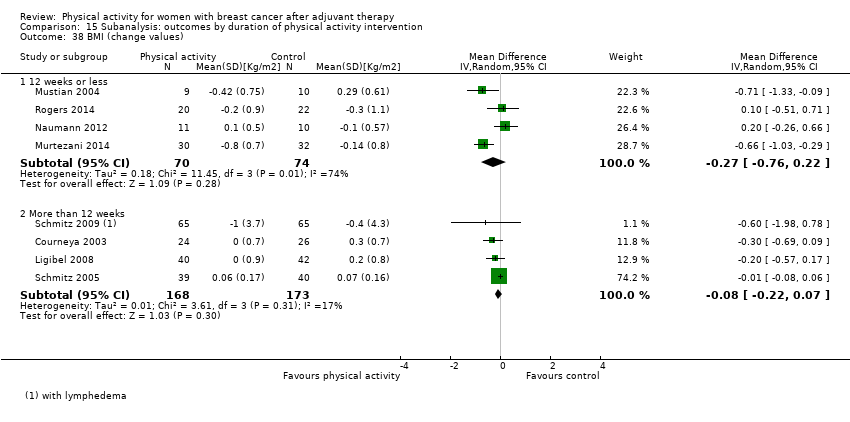
Comparison 15 Subanalysis: outcomes by duration of physical activity intervention, Outcome 38 BMI (change values).
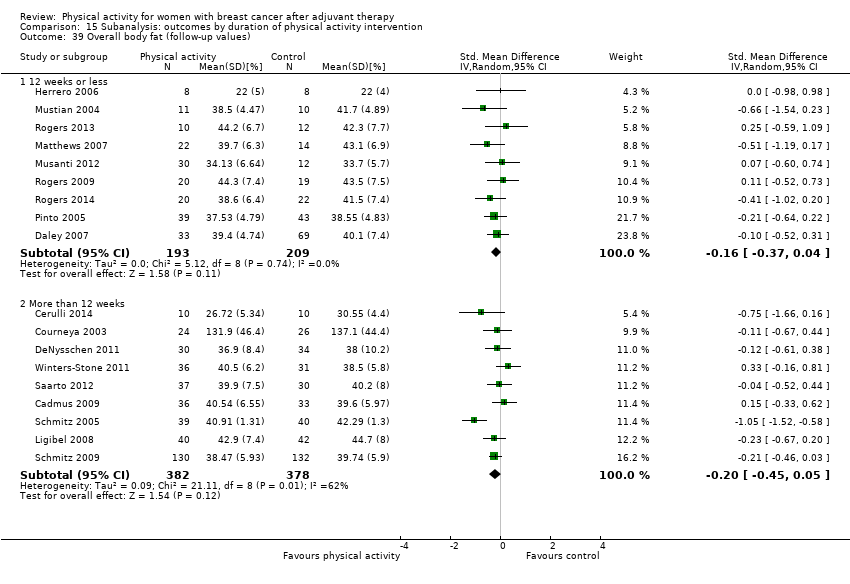
Comparison 15 Subanalysis: outcomes by duration of physical activity intervention, Outcome 39 Overall body fat (follow‐up values).
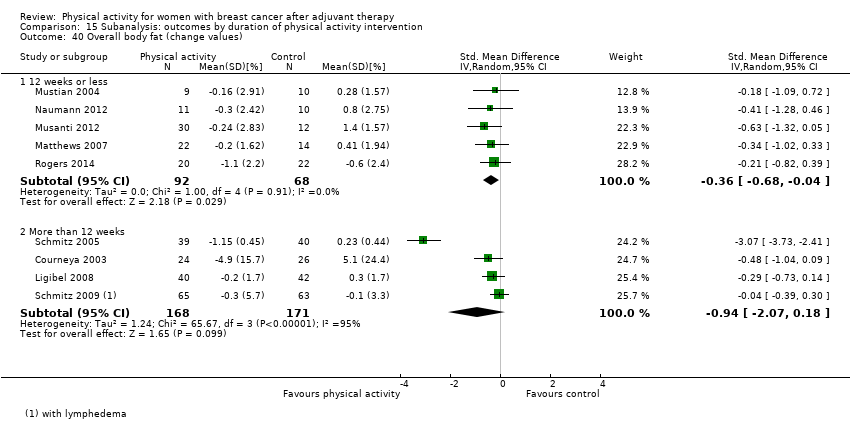
Comparison 15 Subanalysis: outcomes by duration of physical activity intervention, Outcome 40 Overall body fat (change values).
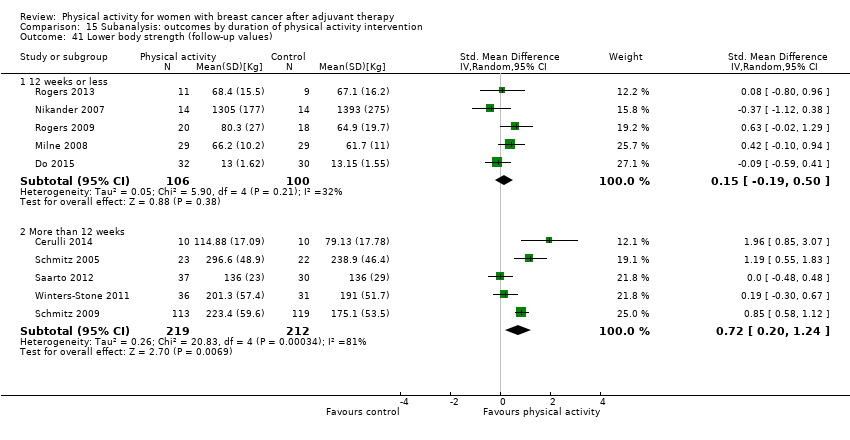
Comparison 15 Subanalysis: outcomes by duration of physical activity intervention, Outcome 41 Lower body strength (follow‐up values).

Comparison 15 Subanalysis: outcomes by duration of physical activity intervention, Outcome 42 Lower body strength (change values).
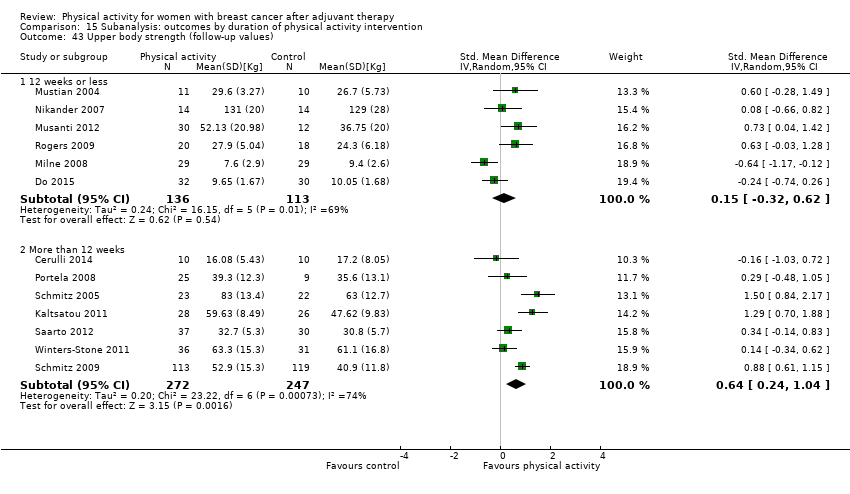
Comparison 15 Subanalysis: outcomes by duration of physical activity intervention, Outcome 43 Upper body strength (follow‐up values).
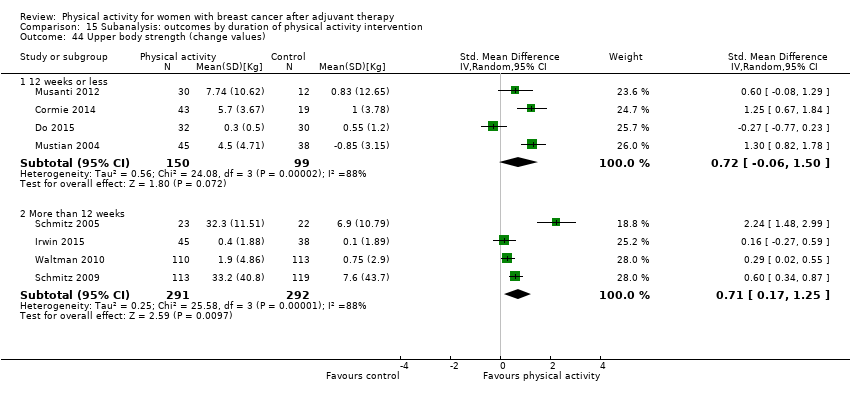
Comparison 15 Subanalysis: outcomes by duration of physical activity intervention, Outcome 44 Upper body strength (change values).

Comparison 16 Subanalysis: outcomes by format of intervention, Outcome 1 Overall HRQoL (follow‐up values).

Comparison 16 Subanalysis: outcomes by format of intervention, Outcome 2 Overall HRQoL (change values).
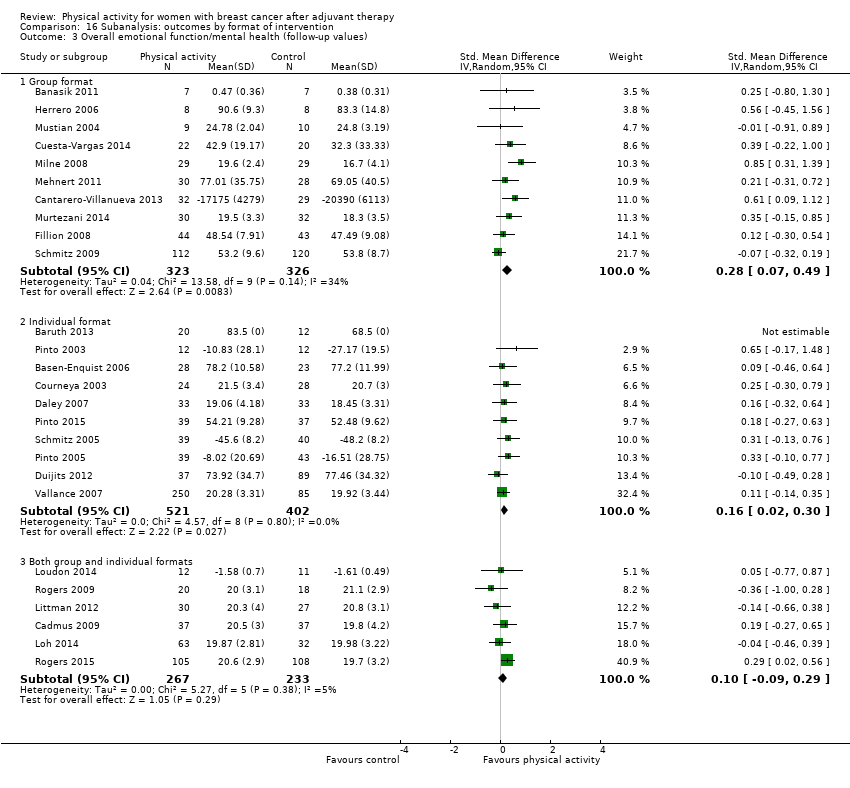
Comparison 16 Subanalysis: outcomes by format of intervention, Outcome 3 Overall emotional function/mental health (follow‐up values).

Comparison 16 Subanalysis: outcomes by format of intervention, Outcome 4 Overall emotional function/mental health (change values).
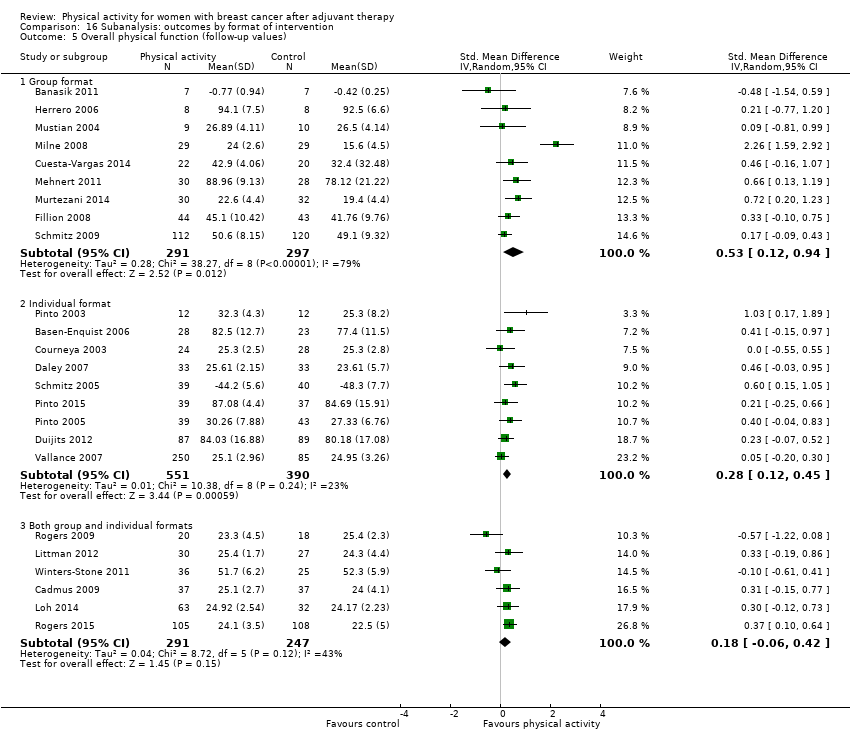
Comparison 16 Subanalysis: outcomes by format of intervention, Outcome 5 Overall physical function (follow‐up values).

Comparison 16 Subanalysis: outcomes by format of intervention, Outcome 6 Overall physical function (change values).
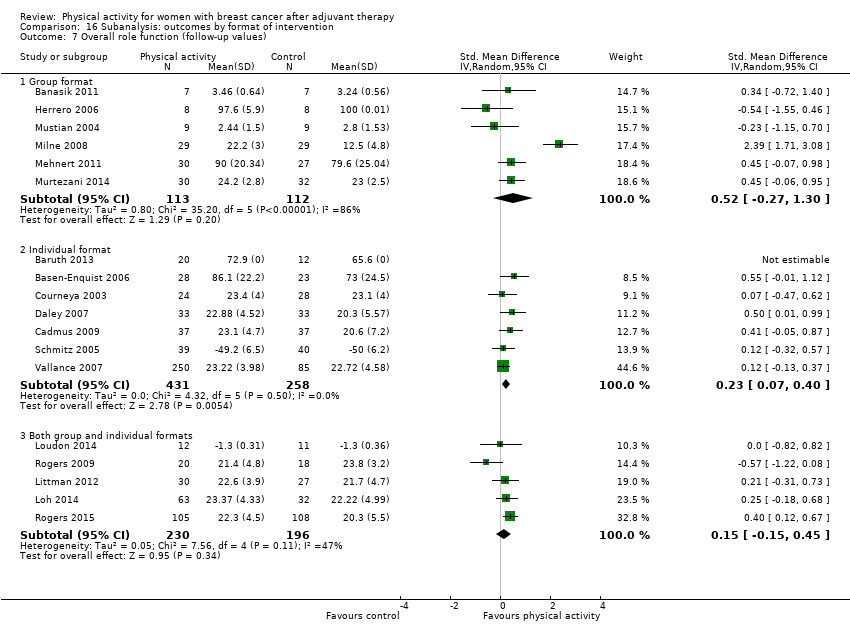
Comparison 16 Subanalysis: outcomes by format of intervention, Outcome 7 Overall role function (follow‐up values).

Comparison 16 Subanalysis: outcomes by format of intervention, Outcome 8 Overall role function (change values).
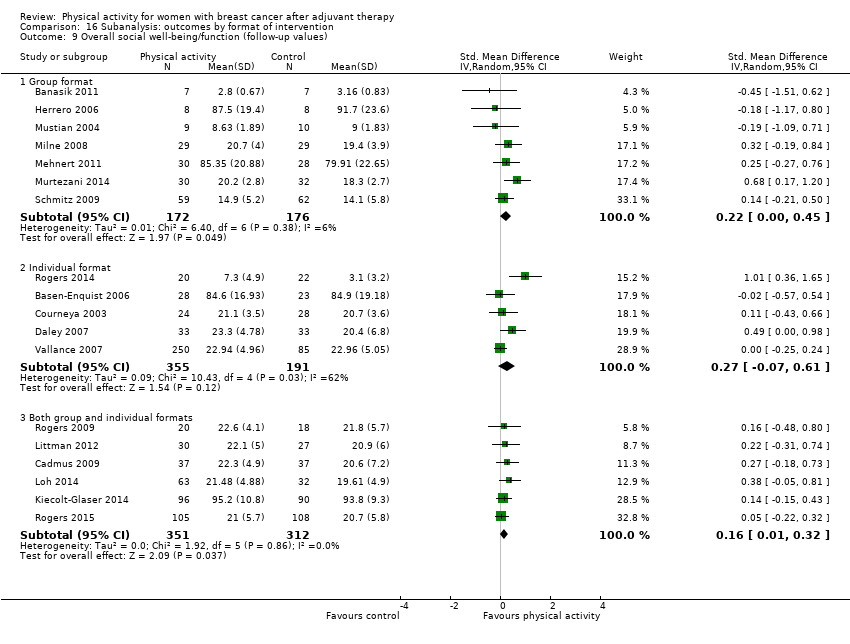
Comparison 16 Subanalysis: outcomes by format of intervention, Outcome 9 Overall social well‐being/function (follow‐up values).

Comparison 16 Subanalysis: outcomes by format of intervention, Outcome 10 Overall social well‐being/function (change values).

Comparison 16 Subanalysis: outcomes by format of intervention, Outcome 11 Overall cognitive function (follow‐up values).

Comparison 16 Subanalysis: outcomes by format of intervention, Outcome 12 Overall cognitive function (change values).

Comparison 16 Subanalysis: outcomes by format of intervention, Outcome 13 Overall general health (follow‐up values).
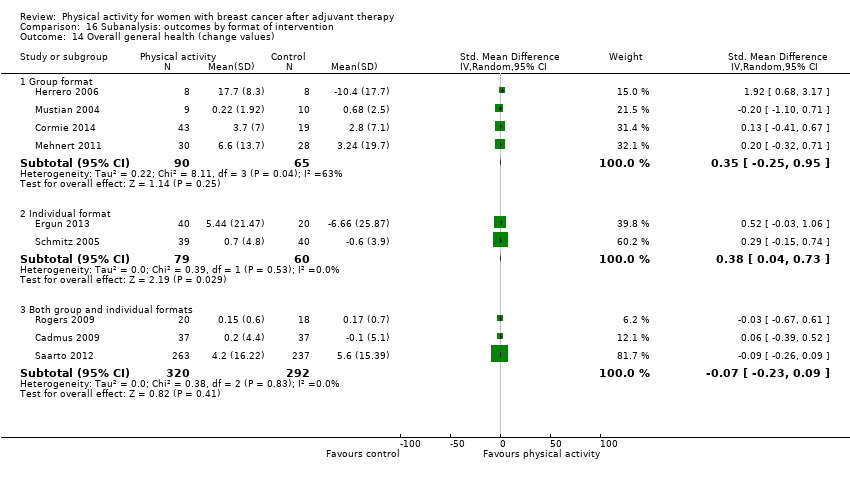
Comparison 16 Subanalysis: outcomes by format of intervention, Outcome 14 Overall general health (change values).

Comparison 16 Subanalysis: outcomes by format of intervention, Outcome 15 Overall sexual function (follow‐up values).

Comparison 16 Subanalysis: outcomes by format of intervention, Outcome 16 Overall sleep (follow‐up values).
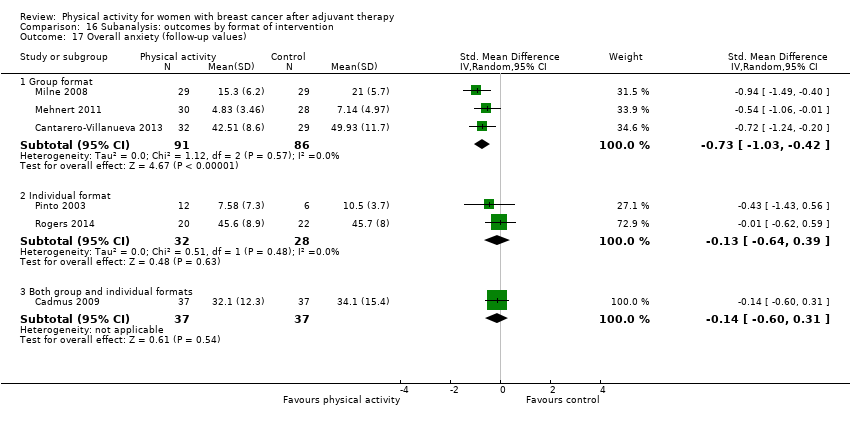
Comparison 16 Subanalysis: outcomes by format of intervention, Outcome 17 Overall anxiety (follow‐up values).

Comparison 16 Subanalysis: outcomes by format of intervention, Outcome 18 Overall anxiety (change values).

Comparison 16 Subanalysis: outcomes by format of intervention, Outcome 19 Overall depression (change values).
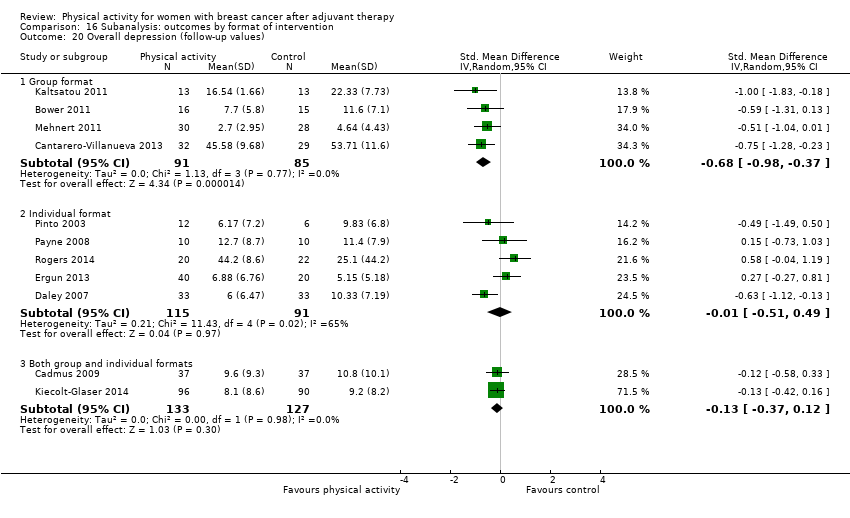
Comparison 16 Subanalysis: outcomes by format of intervention, Outcome 20 Overall depression (follow‐up values).

Comparison 16 Subanalysis: outcomes by format of intervention, Outcome 21 Overall fatigue (follow‐up values).
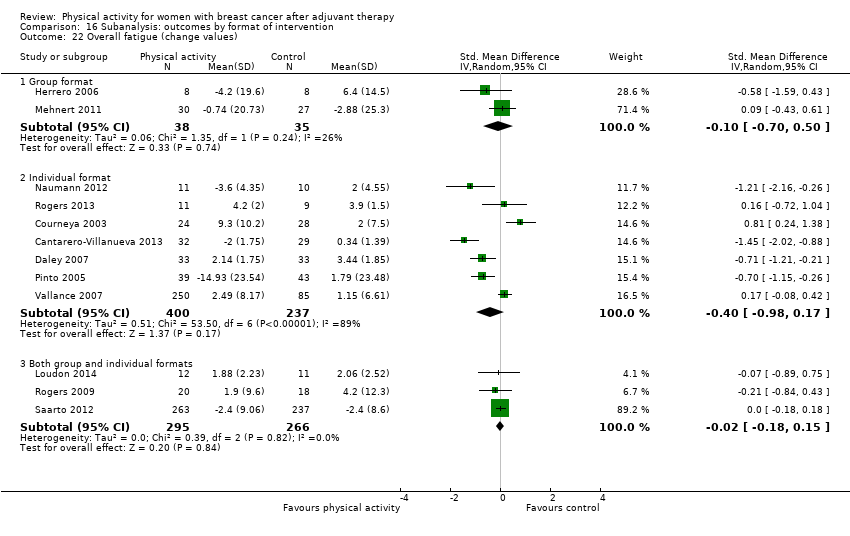
Comparison 16 Subanalysis: outcomes by format of intervention, Outcome 22 Overall fatigue (change values).
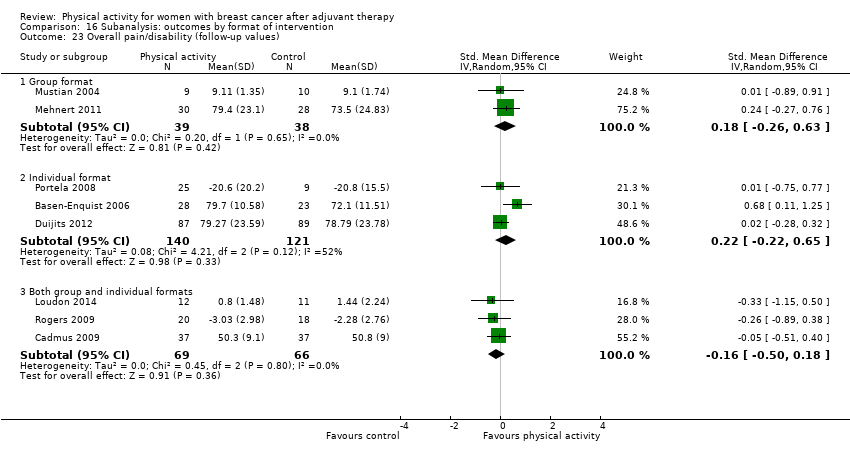
Comparison 16 Subanalysis: outcomes by format of intervention, Outcome 23 Overall pain/disability (follow‐up values).
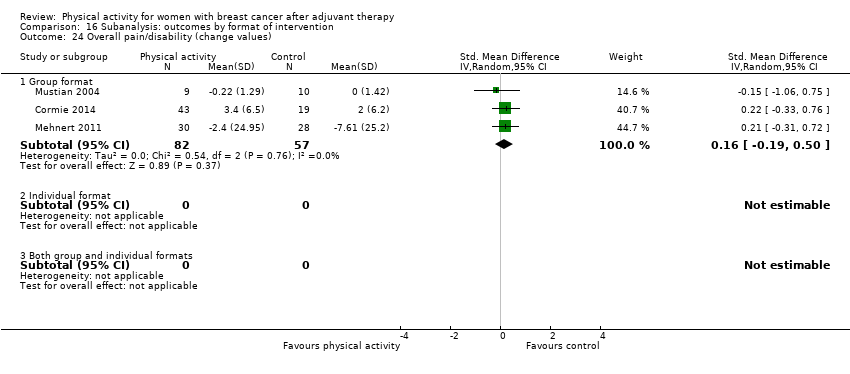
Comparison 16 Subanalysis: outcomes by format of intervention, Outcome 24 Overall pain/disability (change values).

Comparison 16 Subanalysis: outcomes by format of intervention, Outcome 25 Overall self‐esteem/body image (follow‐up values).
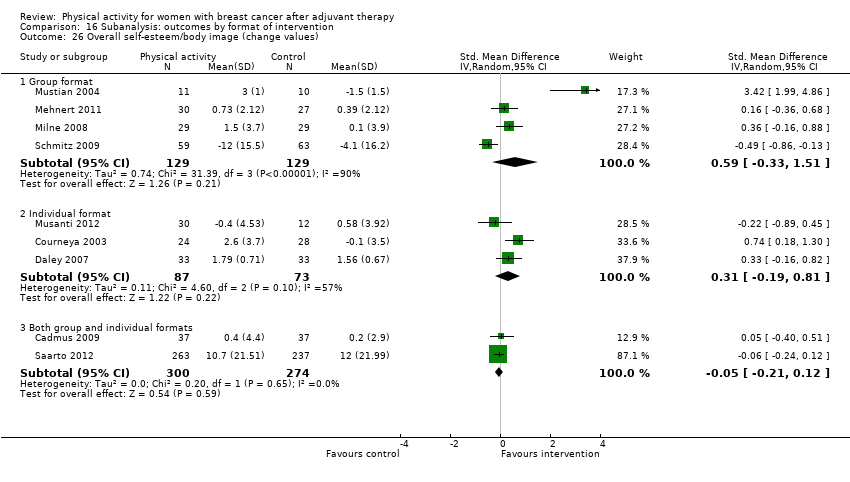
Comparison 16 Subanalysis: outcomes by format of intervention, Outcome 26 Overall self‐esteem/body image (change values).

Comparison 16 Subanalysis: outcomes by format of intervention, Outcome 27 Overall cardiorespiratory fitness (follow‐up values).
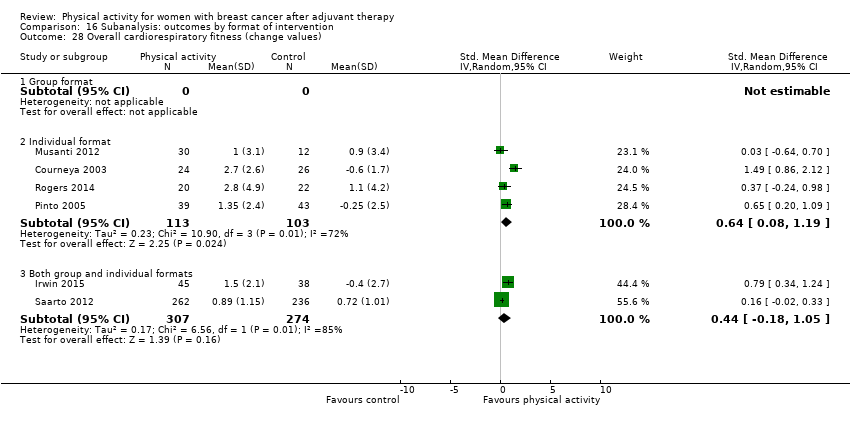
Comparison 16 Subanalysis: outcomes by format of intervention, Outcome 28 Overall cardiorespiratory fitness (change values).
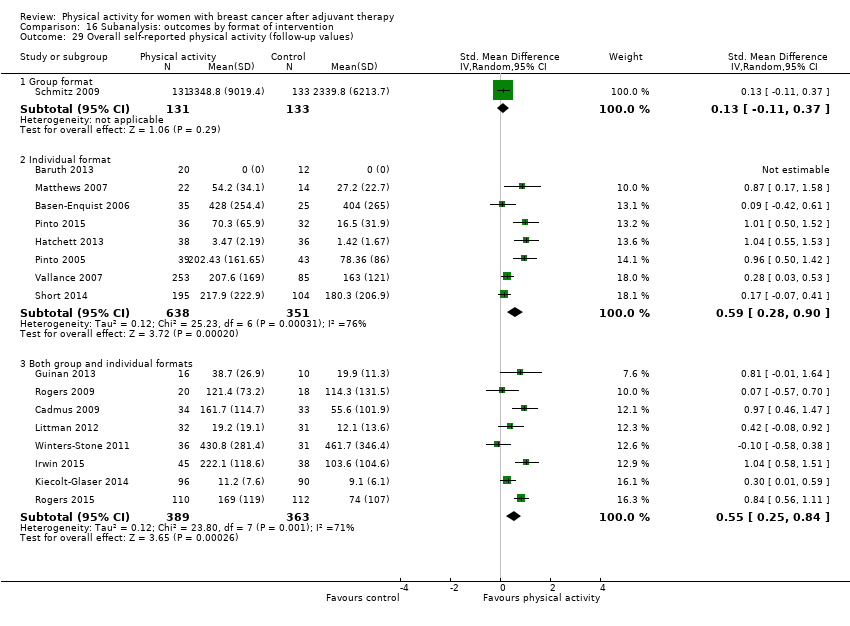
Comparison 16 Subanalysis: outcomes by format of intervention, Outcome 29 Overall self‐reported physical activity (follow‐up values).

Comparison 16 Subanalysis: outcomes by format of intervention, Outcome 30 Overall self‐reported physical activity (change values).
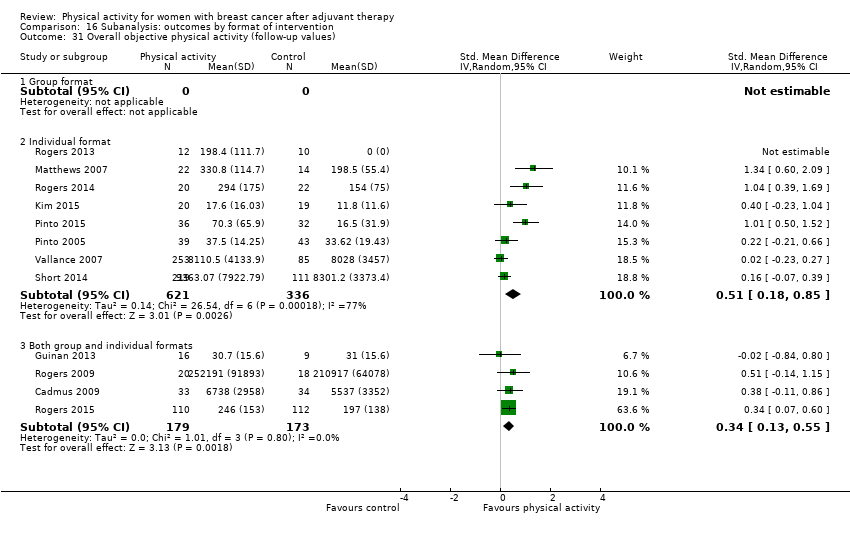
Comparison 16 Subanalysis: outcomes by format of intervention, Outcome 31 Overall objective physical activity (follow‐up values).
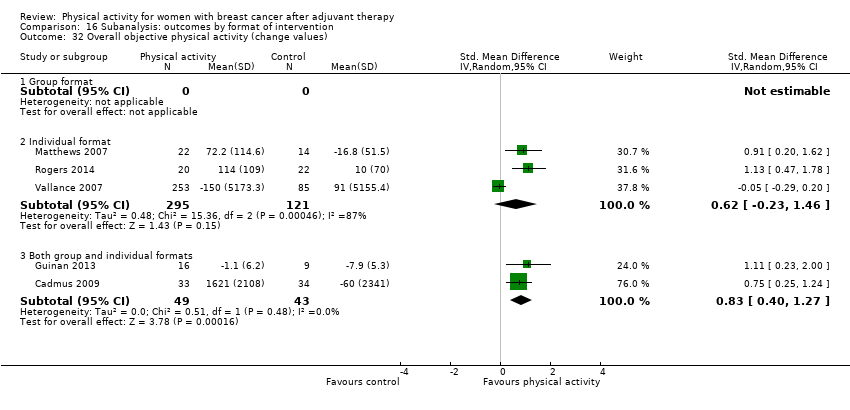
Comparison 16 Subanalysis: outcomes by format of intervention, Outcome 32 Overall objective physical activity (change values).
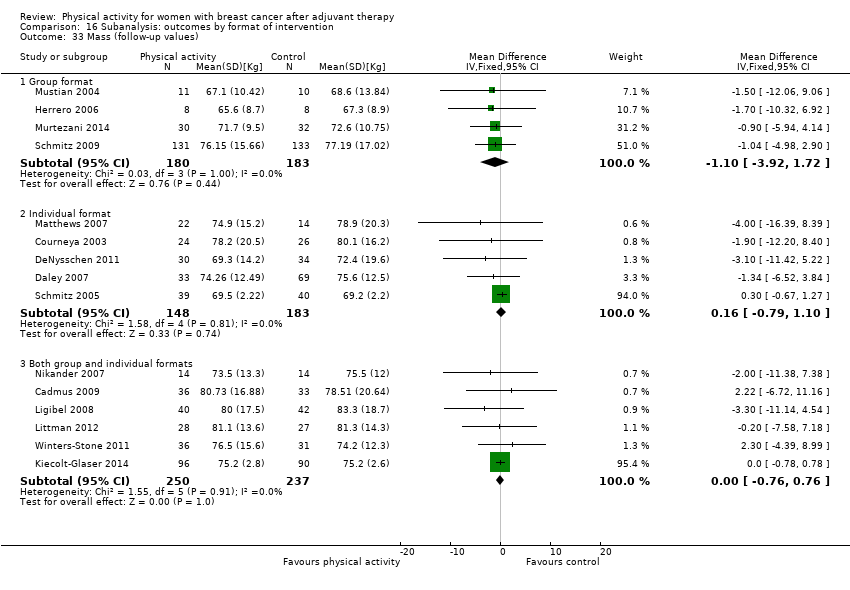
Comparison 16 Subanalysis: outcomes by format of intervention, Outcome 33 Mass (follow‐up values).

Comparison 16 Subanalysis: outcomes by format of intervention, Outcome 34 Mass (change values).

Comparison 16 Subanalysis: outcomes by format of intervention, Outcome 35 BMI (follow‐up values).

Comparison 16 Subanalysis: outcomes by format of intervention, Outcome 36 BMI (change values).

Comparison 16 Subanalysis: outcomes by format of intervention, Outcome 37 Overall body fat (follow‐up values).
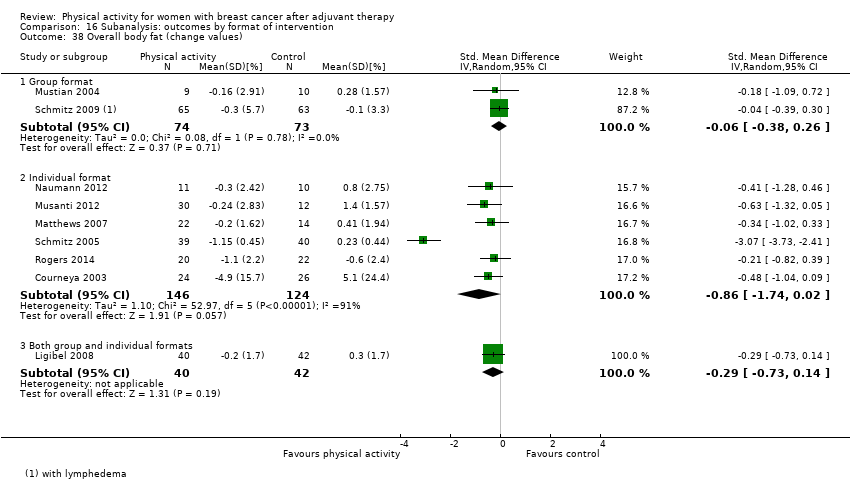
Comparison 16 Subanalysis: outcomes by format of intervention, Outcome 38 Overall body fat (change values).
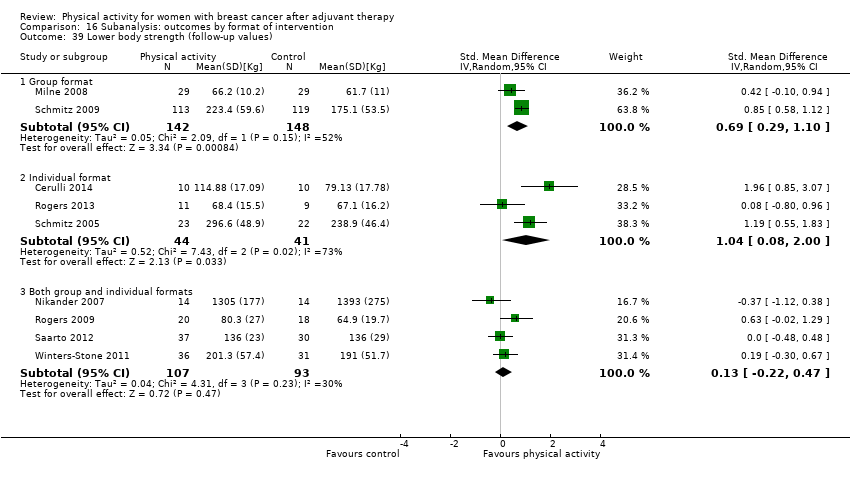
Comparison 16 Subanalysis: outcomes by format of intervention, Outcome 39 Lower body strength (follow‐up values).

Comparison 16 Subanalysis: outcomes by format of intervention, Outcome 40 Lower body strength (change values).
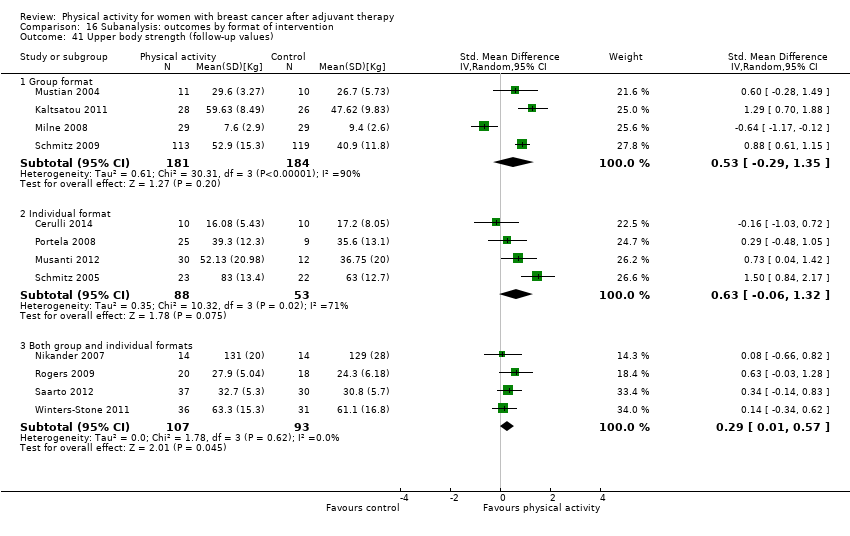
Comparison 16 Subanalysis: outcomes by format of intervention, Outcome 41 Upper body strength (follow‐up values).

Comparison 16 Subanalysis: outcomes by format of intervention, Outcome 42 Upper body strength (change values).

Comparison 16 Subanalysis: outcomes by format of intervention, Outcome 43 Bone mineral density ‐ femoral neck (follow‐up and change values).

Comparison 16 Subanalysis: outcomes by format of intervention, Outcome 44 Bone mineral density ‐ lumbar spine (follow‐up and change values).

Comparison 16 Subanalysis: outcomes by format of intervention, Outcome 45 Bone mineral density ‐ total hip (follow‐up and change values).

Comparison 17 Subanalysis: outcomes by setting of intervention, Outcome 1 Overall HRQoL (follow‐up values).

Comparison 17 Subanalysis: outcomes by setting of intervention, Outcome 2 Overall HRQoL (change values).
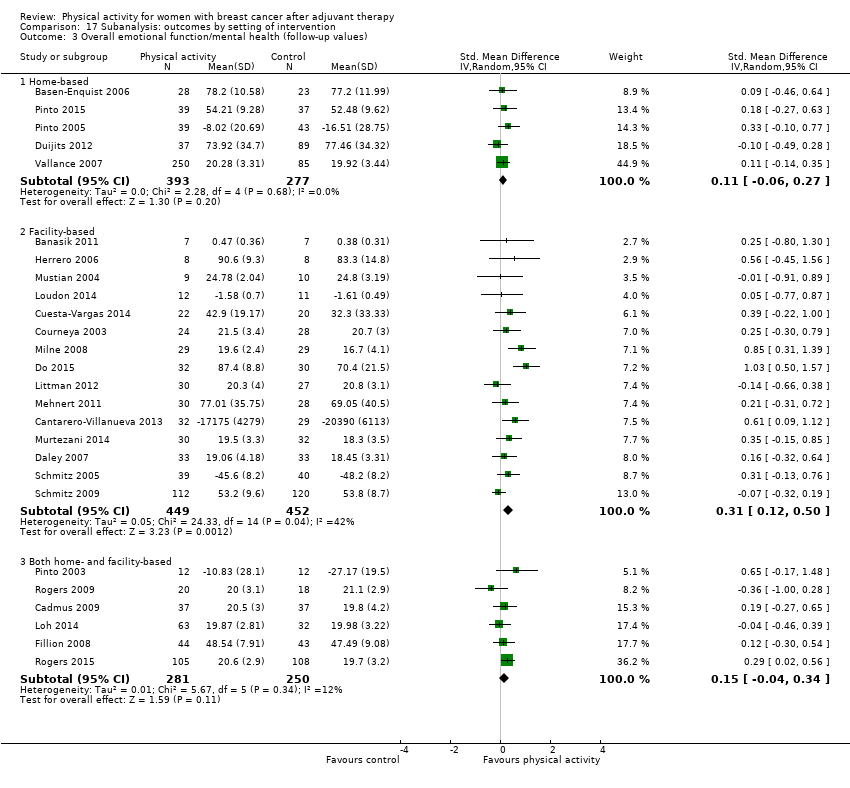
Comparison 17 Subanalysis: outcomes by setting of intervention, Outcome 3 Overall emotional function/mental health (follow‐up values).
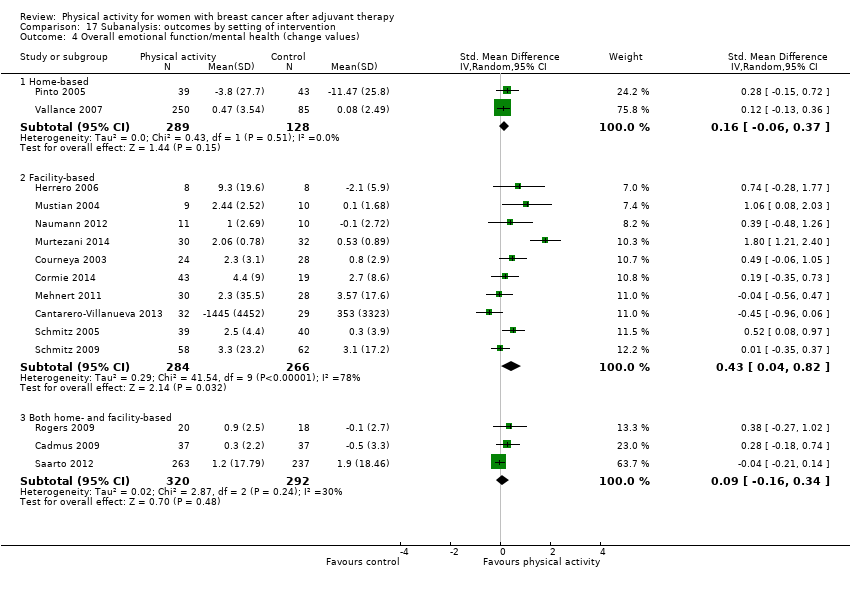
Comparison 17 Subanalysis: outcomes by setting of intervention, Outcome 4 Overall emotional function/mental health (change values).
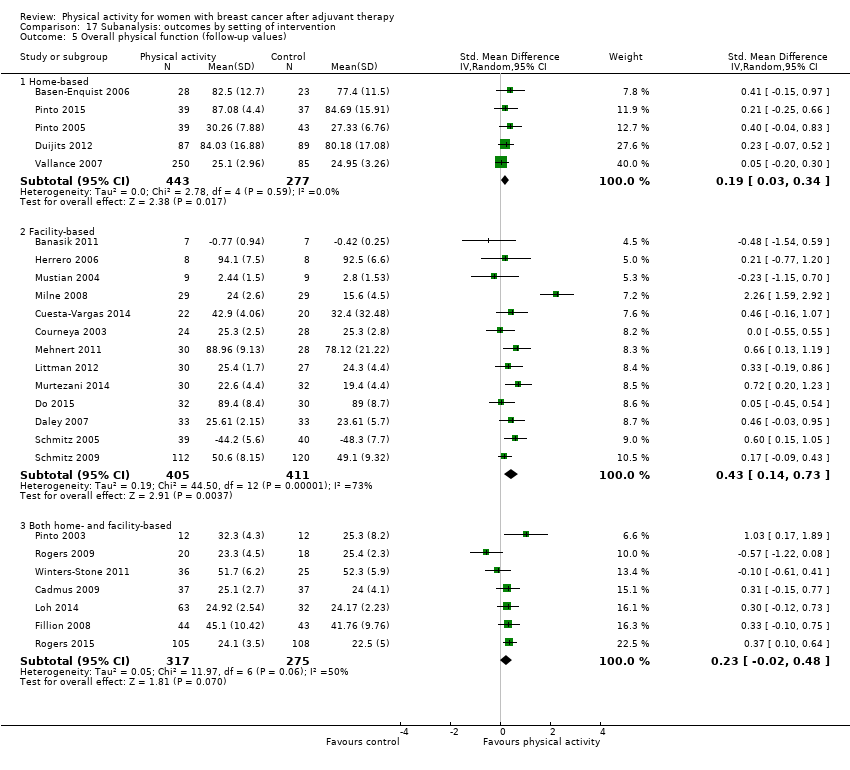
Comparison 17 Subanalysis: outcomes by setting of intervention, Outcome 5 Overall physical function (follow‐up values).

Comparison 17 Subanalysis: outcomes by setting of intervention, Outcome 6 Overall physical function (change values).

Comparison 17 Subanalysis: outcomes by setting of intervention, Outcome 7 Overall role function (follow‐up values).
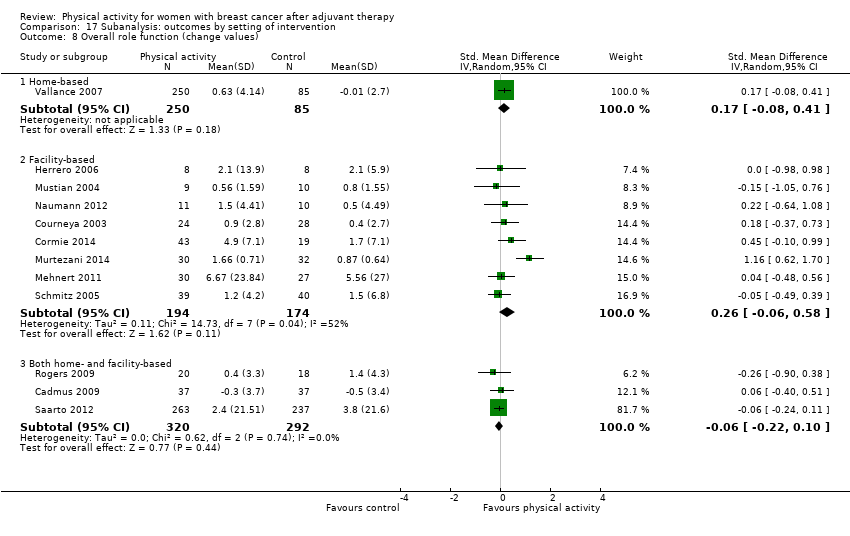
Comparison 17 Subanalysis: outcomes by setting of intervention, Outcome 8 Overall role function (change values).
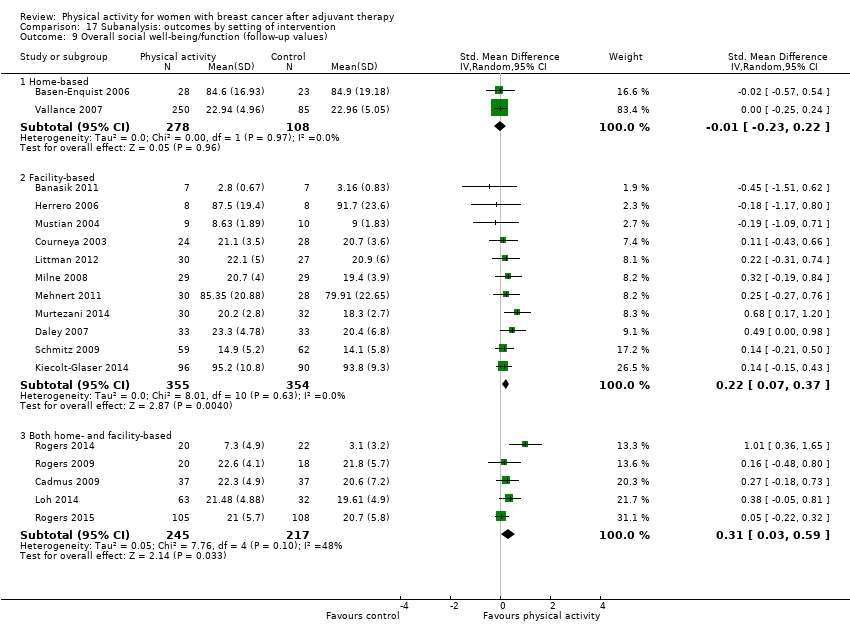
Comparison 17 Subanalysis: outcomes by setting of intervention, Outcome 9 Overall social well‐being/function (follow‐up values).
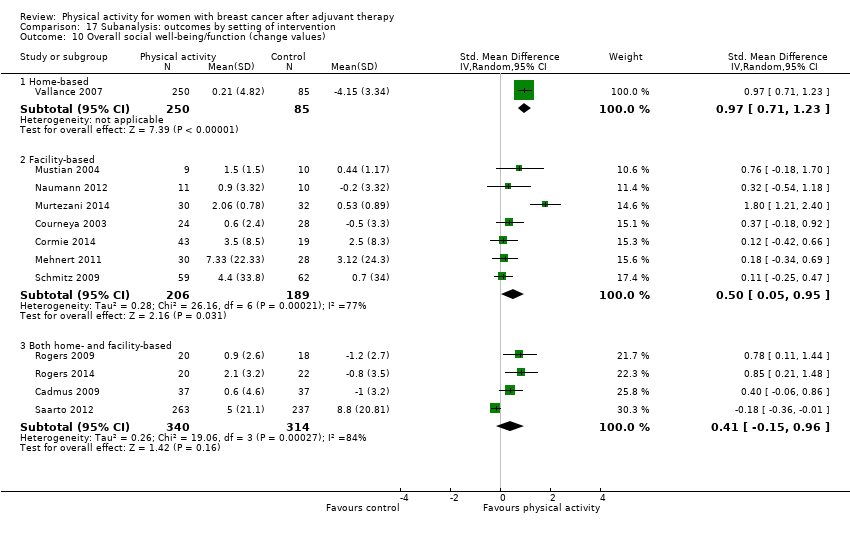
Comparison 17 Subanalysis: outcomes by setting of intervention, Outcome 10 Overall social well‐being/function (change values).

Comparison 17 Subanalysis: outcomes by setting of intervention, Outcome 11 Overall cognitive function (follow‐up values).

Comparison 17 Subanalysis: outcomes by setting of intervention, Outcome 12 Overall cognitive function (change values).
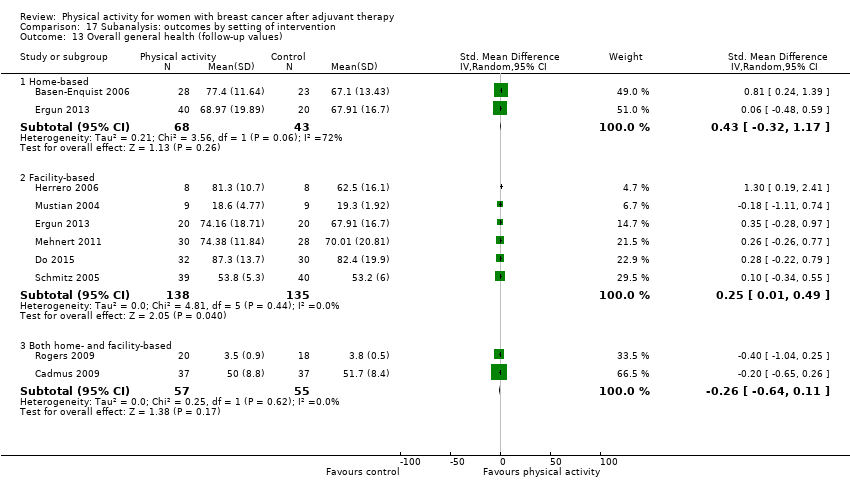
Comparison 17 Subanalysis: outcomes by setting of intervention, Outcome 13 Overall general health (follow‐up values).

Comparison 17 Subanalysis: outcomes by setting of intervention, Outcome 14 Overall general health (change values).

Comparison 17 Subanalysis: outcomes by setting of intervention, Outcome 15 Overall sexual function (follow‐up values).

Comparison 17 Subanalysis: outcomes by setting of intervention, Outcome 16 Overall sexual function (change values).

Comparison 17 Subanalysis: outcomes by setting of intervention, Outcome 17 Overall sleep (follow‐up values).
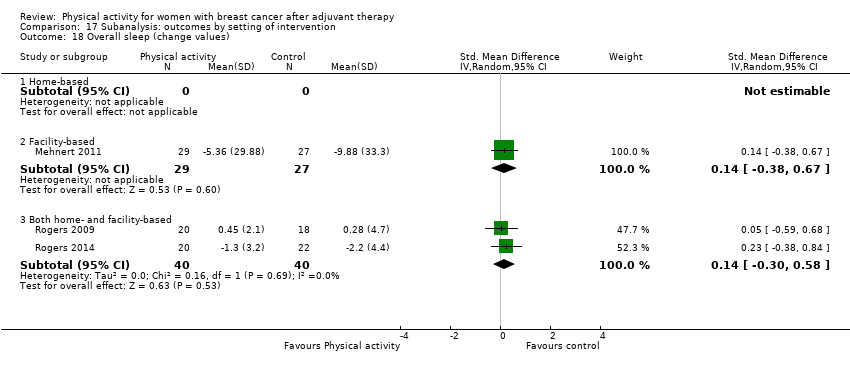
Comparison 17 Subanalysis: outcomes by setting of intervention, Outcome 18 Overall sleep (change values).
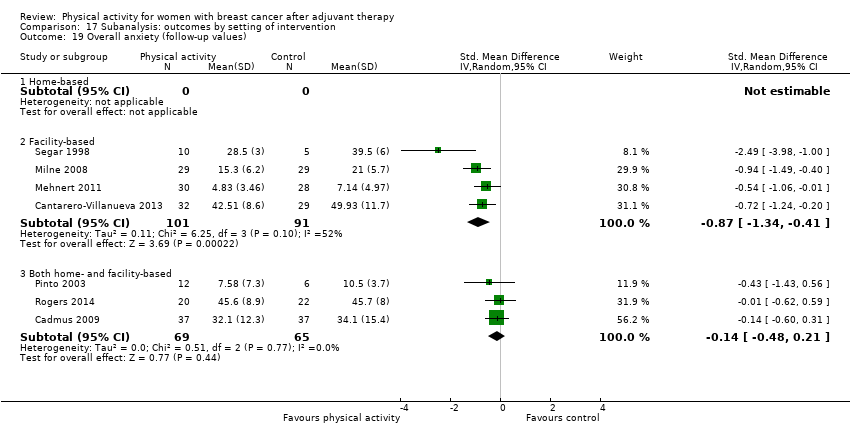
Comparison 17 Subanalysis: outcomes by setting of intervention, Outcome 19 Overall anxiety (follow‐up values).
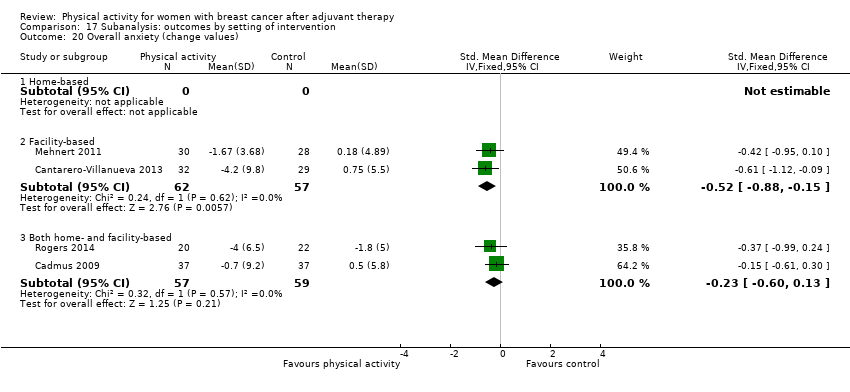
Comparison 17 Subanalysis: outcomes by setting of intervention, Outcome 20 Overall anxiety (change values).
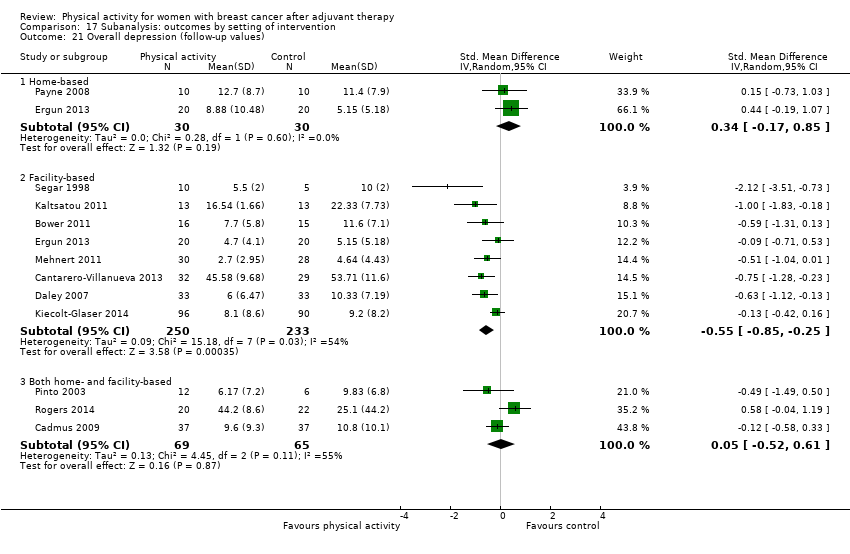
Comparison 17 Subanalysis: outcomes by setting of intervention, Outcome 21 Overall depression (follow‐up values).
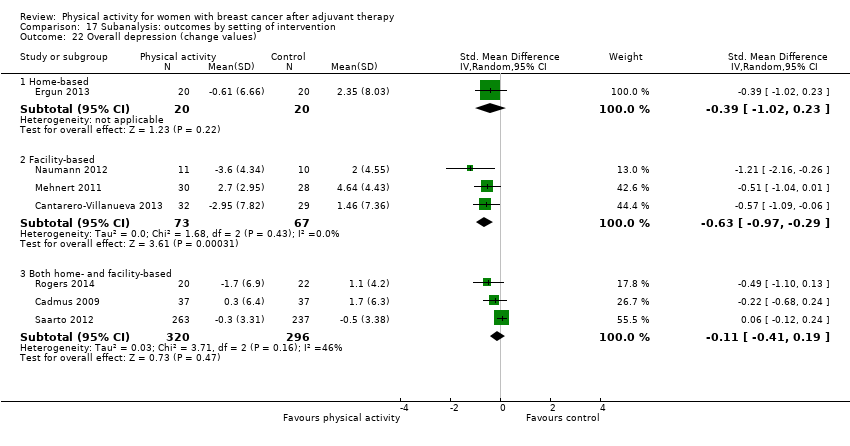
Comparison 17 Subanalysis: outcomes by setting of intervention, Outcome 22 Overall depression (change values).

Comparison 17 Subanalysis: outcomes by setting of intervention, Outcome 23 Overall fatigue (follow‐up values).

Comparison 17 Subanalysis: outcomes by setting of intervention, Outcome 24 Overall fatigue (change values).
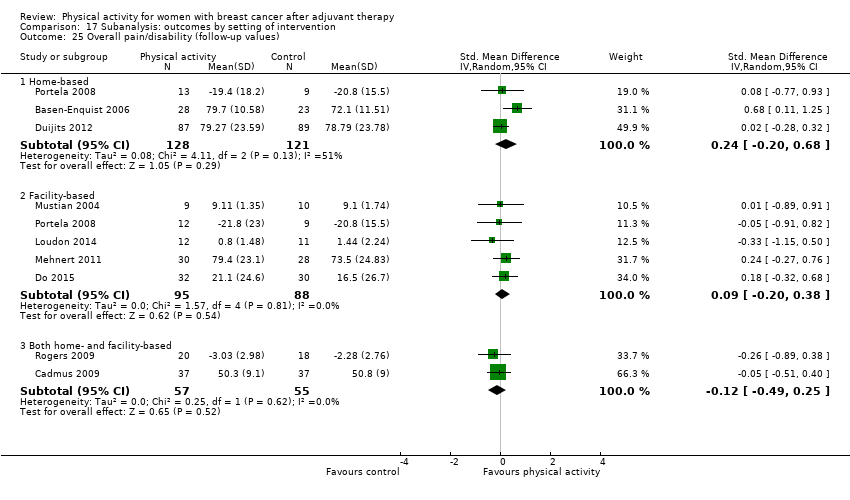
Comparison 17 Subanalysis: outcomes by setting of intervention, Outcome 25 Overall pain/disability (follow‐up values).
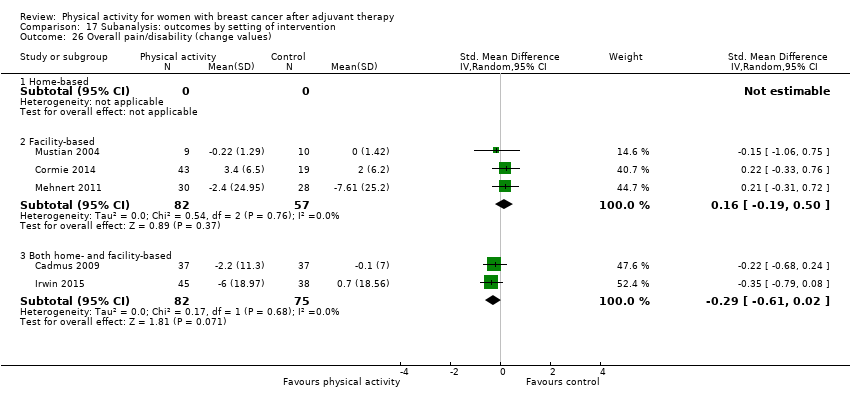
Comparison 17 Subanalysis: outcomes by setting of intervention, Outcome 26 Overall pain/disability (change values).
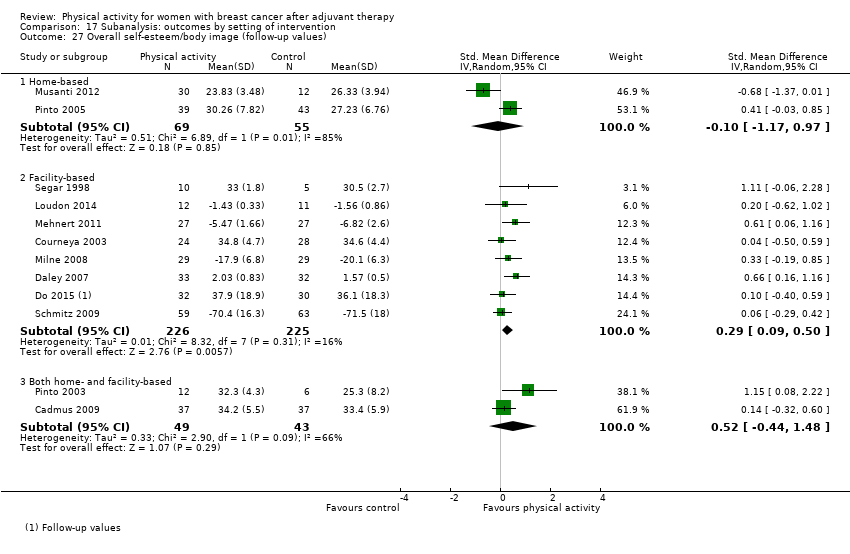
Comparison 17 Subanalysis: outcomes by setting of intervention, Outcome 27 Overall self‐esteem/body image (follow‐up values).
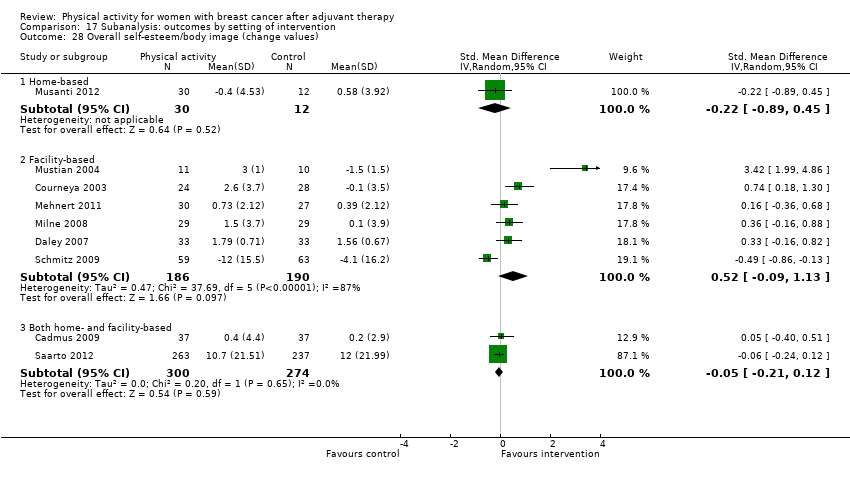
Comparison 17 Subanalysis: outcomes by setting of intervention, Outcome 28 Overall self‐esteem/body image (change values).

Comparison 17 Subanalysis: outcomes by setting of intervention, Outcome 29 Overall cardiorespiratory fitness (follow‐up values).

Comparison 17 Subanalysis: outcomes by setting of intervention, Outcome 30 Overall cardiorespiratory fitness (change values).

Comparison 17 Subanalysis: outcomes by setting of intervention, Outcome 31 Overall self‐reported physical activity (follow‐up values).
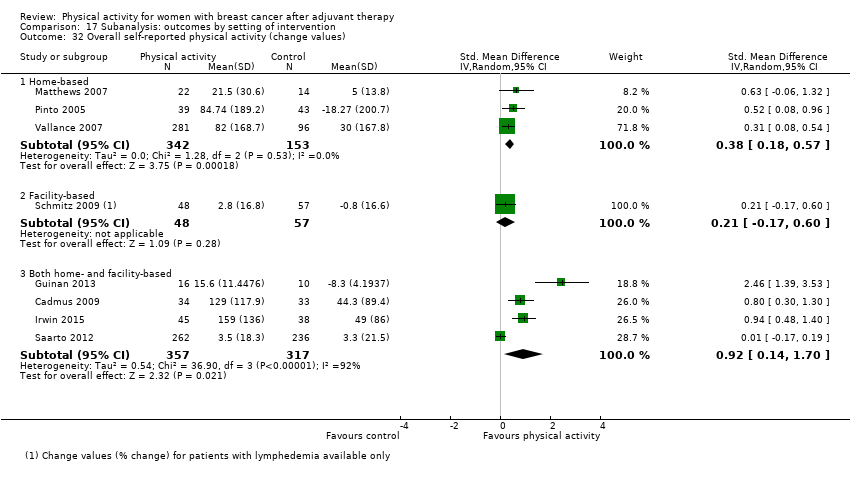
Comparison 17 Subanalysis: outcomes by setting of intervention, Outcome 32 Overall self‐reported physical activity (change values).
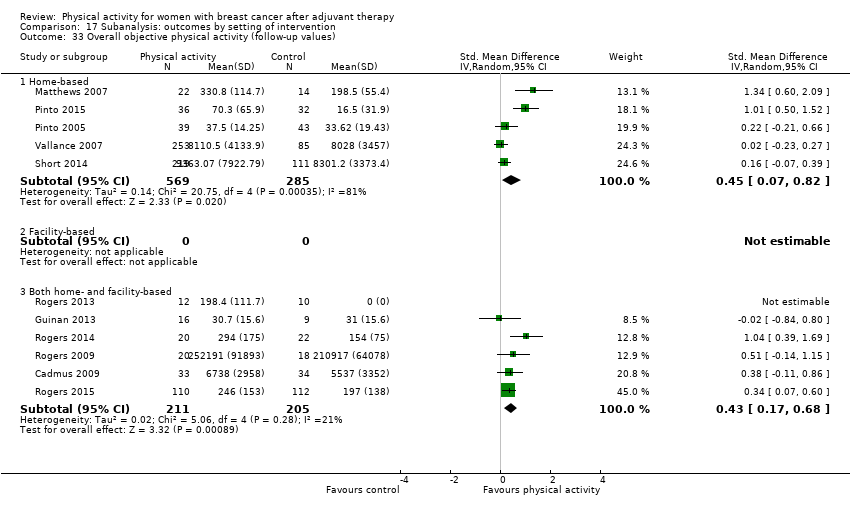
Comparison 17 Subanalysis: outcomes by setting of intervention, Outcome 33 Overall objective physical activity (follow‐up values).

Comparison 17 Subanalysis: outcomes by setting of intervention, Outcome 34 Overall objective physical activity (change values).
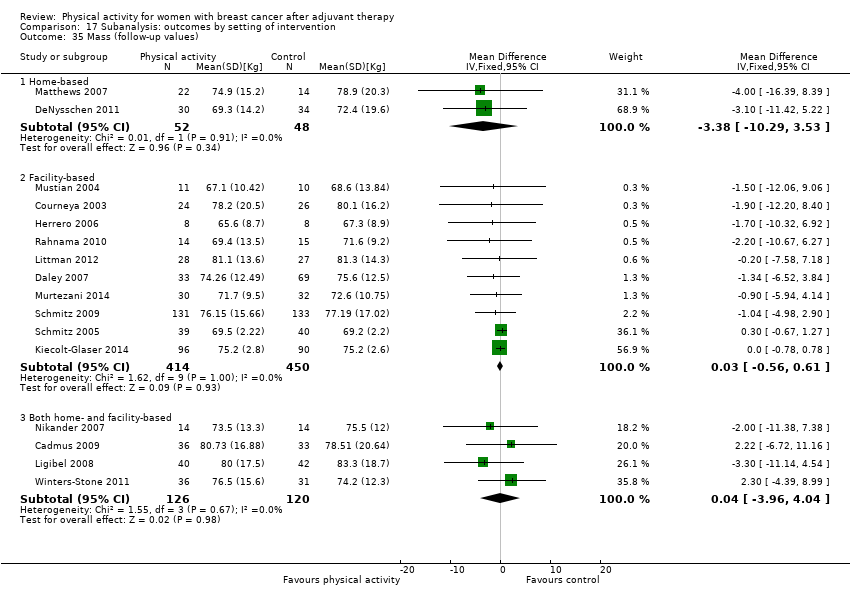
Comparison 17 Subanalysis: outcomes by setting of intervention, Outcome 35 Mass (follow‐up values).

Comparison 17 Subanalysis: outcomes by setting of intervention, Outcome 36 Mass (change values).
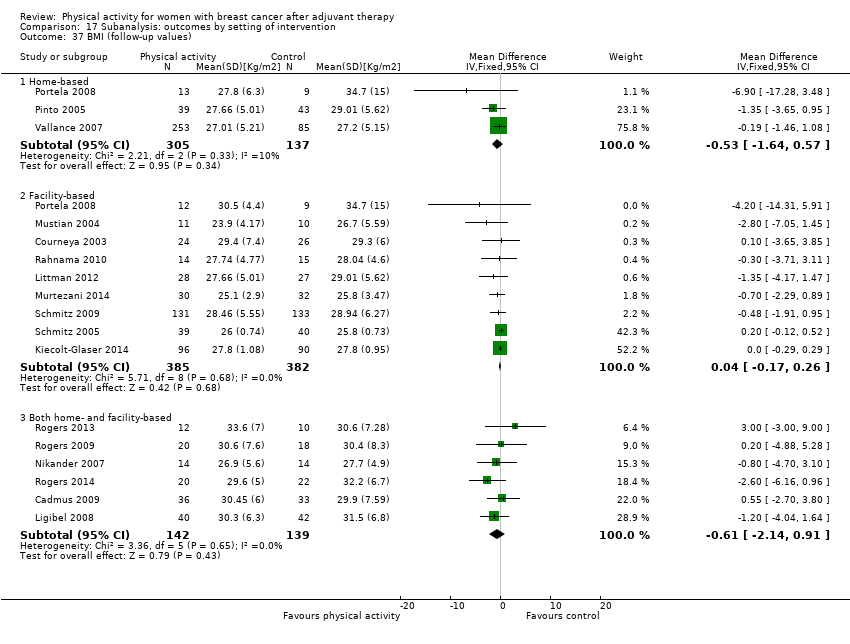
Comparison 17 Subanalysis: outcomes by setting of intervention, Outcome 37 BMI (follow‐up values).

Comparison 17 Subanalysis: outcomes by setting of intervention, Outcome 38 BMI (change values).
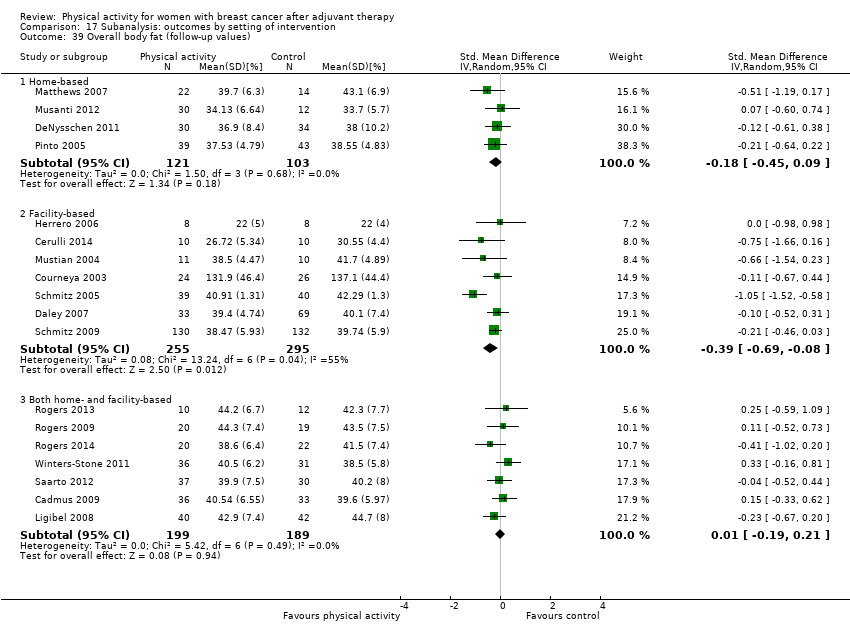
Comparison 17 Subanalysis: outcomes by setting of intervention, Outcome 39 Overall body fat (follow‐up values).

Comparison 17 Subanalysis: outcomes by setting of intervention, Outcome 40 Overall body fat (change values).
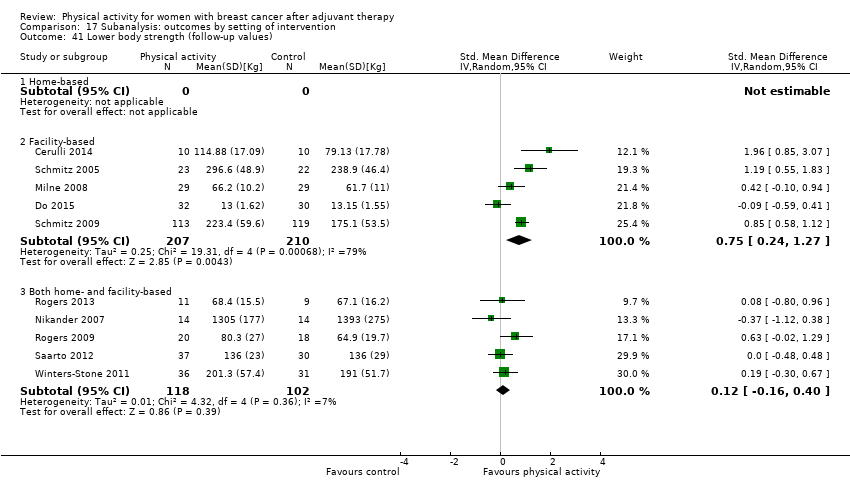
Comparison 17 Subanalysis: outcomes by setting of intervention, Outcome 41 Lower body strength (follow‐up values).

Comparison 17 Subanalysis: outcomes by setting of intervention, Outcome 42 Lower body strength (change values).

Comparison 17 Subanalysis: outcomes by setting of intervention, Outcome 43 Upper body strength (follow‐up values).
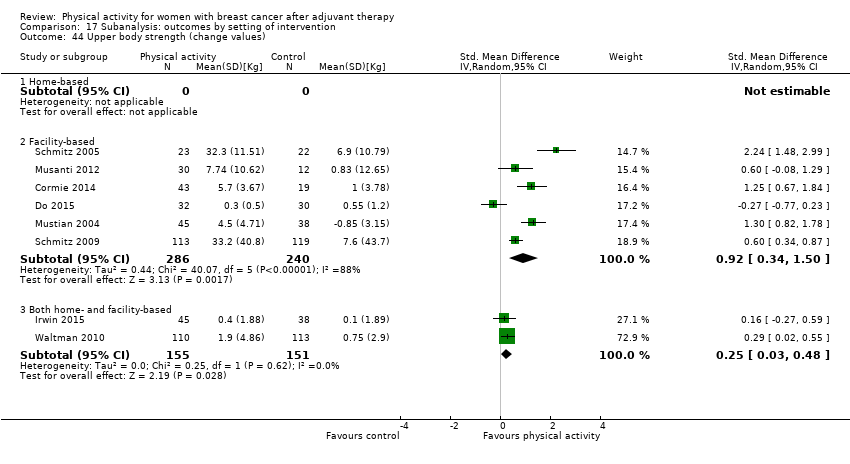
Comparison 17 Subanalysis: outcomes by setting of intervention, Outcome 44 Upper body strength (change values).

Comparison 17 Subanalysis: outcomes by setting of intervention, Outcome 45 Bone mineral density ‐ femoral neck (follow‐up and change values).
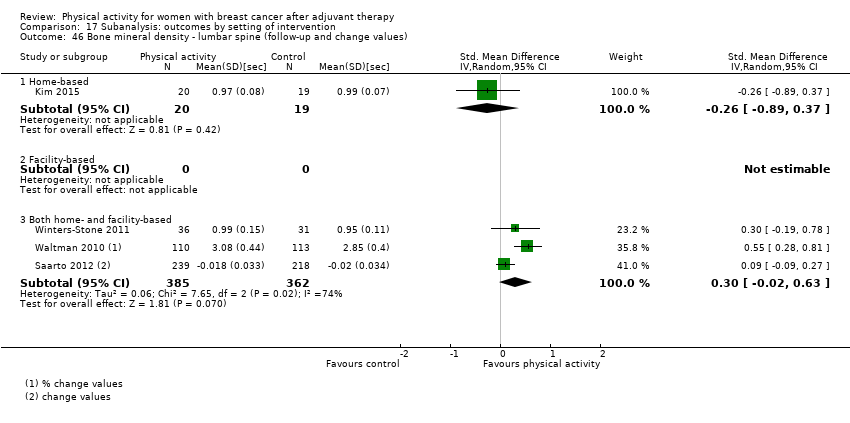
Comparison 17 Subanalysis: outcomes by setting of intervention, Outcome 46 Bone mineral density ‐ lumbar spine (follow‐up and change values).
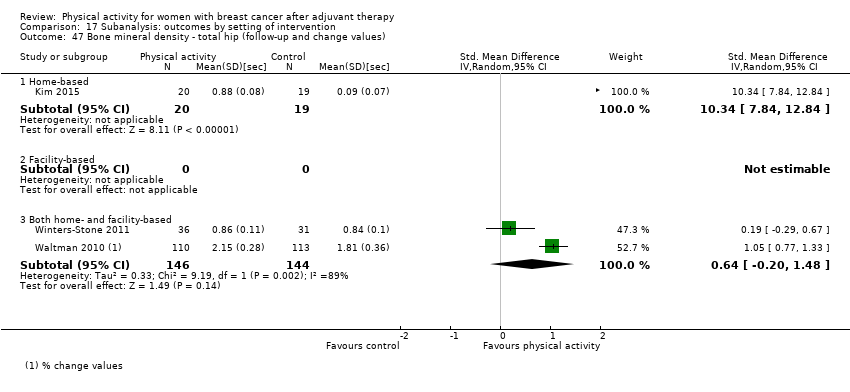
Comparison 17 Subanalysis: outcomes by setting of intervention, Outcome 47 Bone mineral density ‐ total hip (follow‐up and change values).
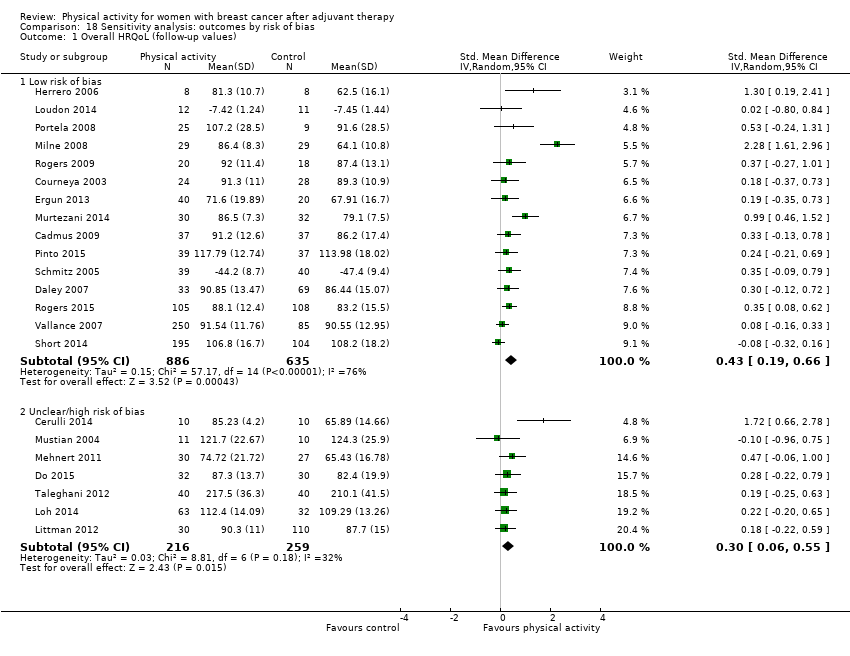
Comparison 18 Sensitivity analysis: outcomes by risk of bias, Outcome 1 Overall HRQoL (follow‐up values).
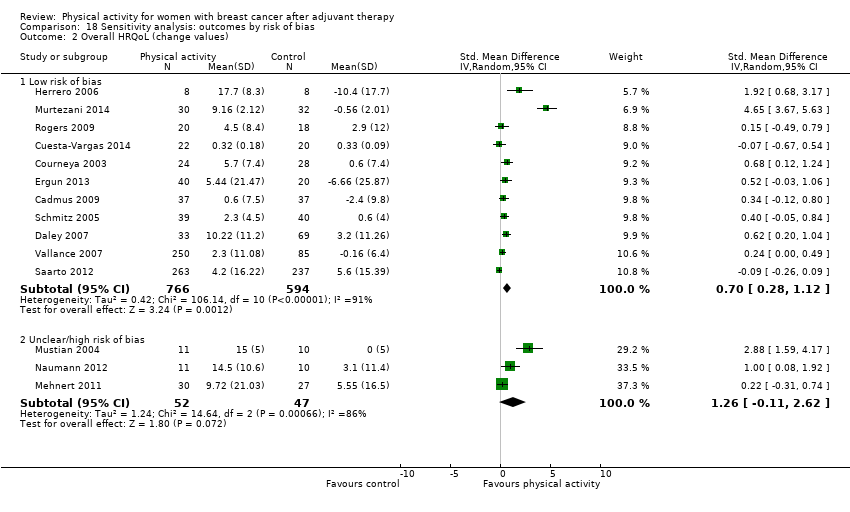
Comparison 18 Sensitivity analysis: outcomes by risk of bias, Outcome 2 Overall HRQoL (change values).
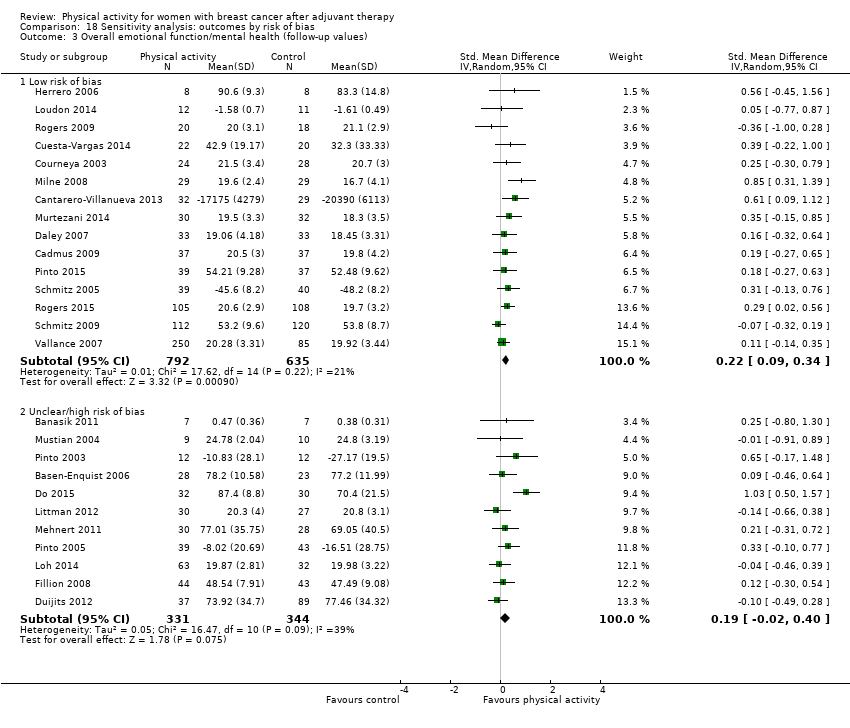
Comparison 18 Sensitivity analysis: outcomes by risk of bias, Outcome 3 Overall emotional function/mental health (follow‐up values).

Comparison 18 Sensitivity analysis: outcomes by risk of bias, Outcome 4 Overall emotional function/mental health (change values).
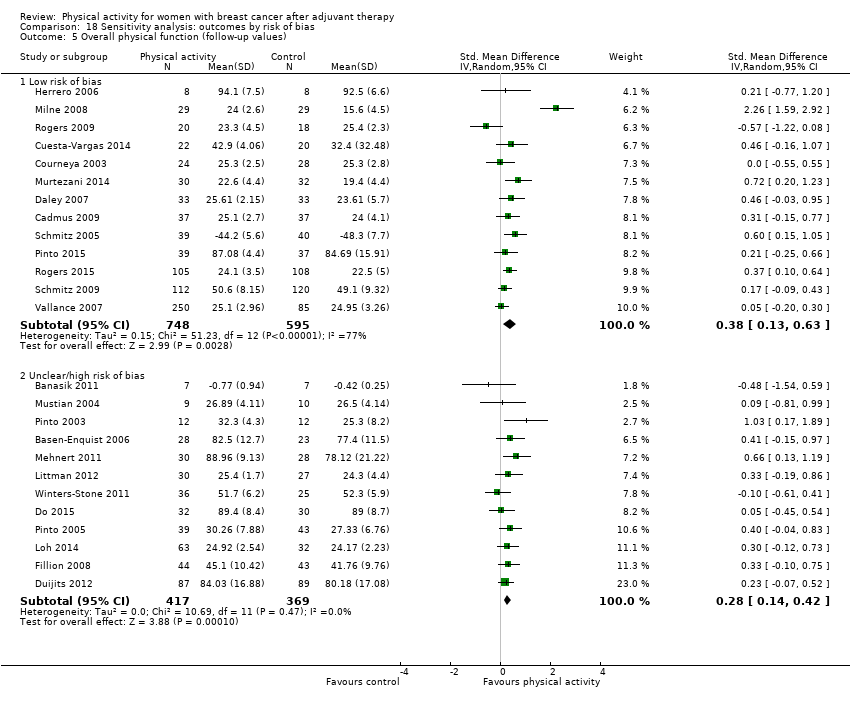
Comparison 18 Sensitivity analysis: outcomes by risk of bias, Outcome 5 Overall physical function (follow‐up values).

Comparison 18 Sensitivity analysis: outcomes by risk of bias, Outcome 6 Overall physical function (change values).
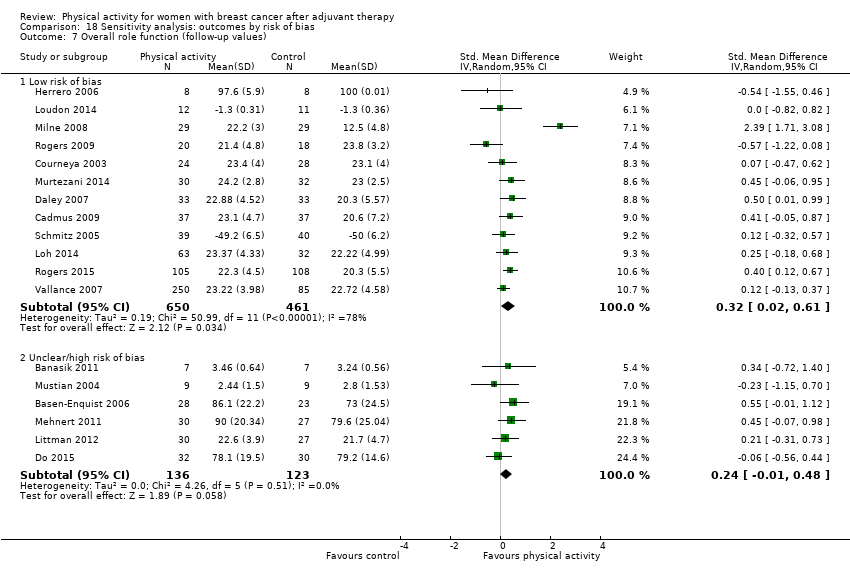
Comparison 18 Sensitivity analysis: outcomes by risk of bias, Outcome 7 Overall role function (follow‐up values).

Comparison 18 Sensitivity analysis: outcomes by risk of bias, Outcome 8 Overall role function (change values).

Comparison 18 Sensitivity analysis: outcomes by risk of bias, Outcome 9 Overall social well‐being/function (follow‐up values).

Comparison 18 Sensitivity analysis: outcomes by risk of bias, Outcome 10 Overall social well‐being/function (change values).

Comparison 18 Sensitivity analysis: outcomes by risk of bias, Outcome 11 Overall cognitive function (follow‐up values).

Comparison 18 Sensitivity analysis: outcomes by risk of bias, Outcome 12 Overall cognitive function (change values).

Comparison 18 Sensitivity analysis: outcomes by risk of bias, Outcome 13 Overall general health (follow‐up values).

Comparison 18 Sensitivity analysis: outcomes by risk of bias, Outcome 14 Overall general health (change values).

Comparison 18 Sensitivity analysis: outcomes by risk of bias, Outcome 15 Overall sexual function (follow‐up values).

Comparison 18 Sensitivity analysis: outcomes by risk of bias, Outcome 16 Overall sexual function (change values).

Comparison 18 Sensitivity analysis: outcomes by risk of bias, Outcome 17 Overall sleep (follow‐up values).
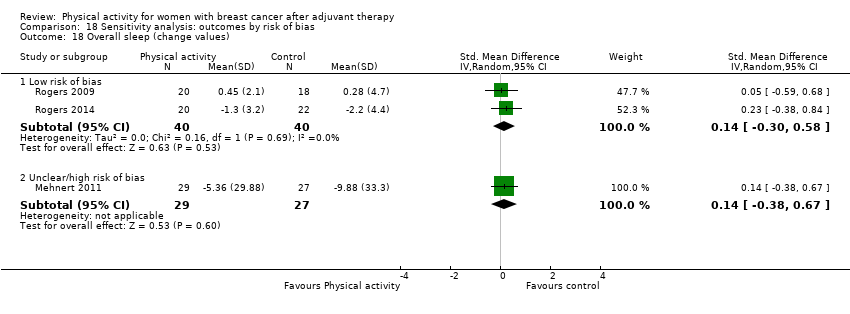
Comparison 18 Sensitivity analysis: outcomes by risk of bias, Outcome 18 Overall sleep (change values).

Comparison 18 Sensitivity analysis: outcomes by risk of bias, Outcome 19 Overall anxiety (follow‐up values).
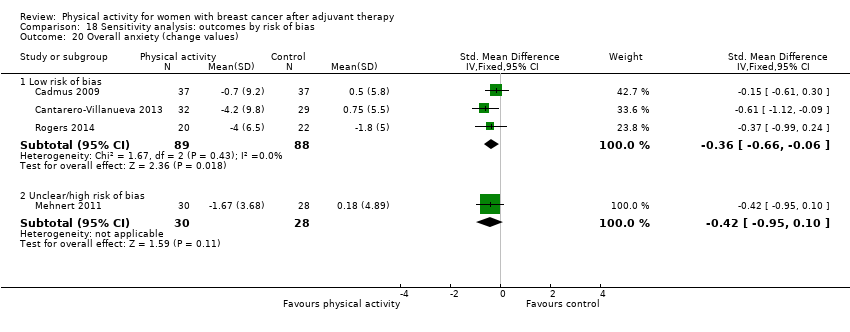
Comparison 18 Sensitivity analysis: outcomes by risk of bias, Outcome 20 Overall anxiety (change values).

Comparison 18 Sensitivity analysis: outcomes by risk of bias, Outcome 21 Overall self‐esteem/body image (follow‐up values).

Comparison 18 Sensitivity analysis: outcomes by risk of bias, Outcome 22 Overall self‐esteem/body image (change values).
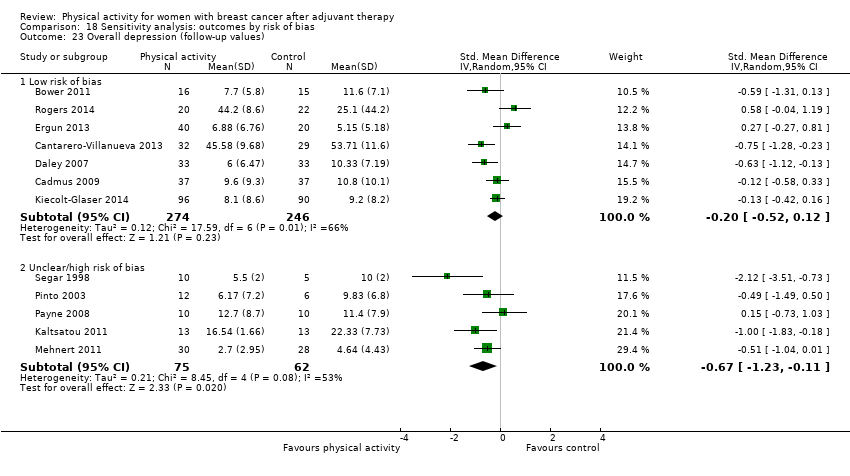
Comparison 18 Sensitivity analysis: outcomes by risk of bias, Outcome 23 Overall depression (follow‐up values).

Comparison 18 Sensitivity analysis: outcomes by risk of bias, Outcome 24 Overall depression (change values).

Comparison 18 Sensitivity analysis: outcomes by risk of bias, Outcome 25 Overall fatigue (follow‐up values).

Comparison 18 Sensitivity analysis: outcomes by risk of bias, Outcome 26 Overall fatigue (change values).
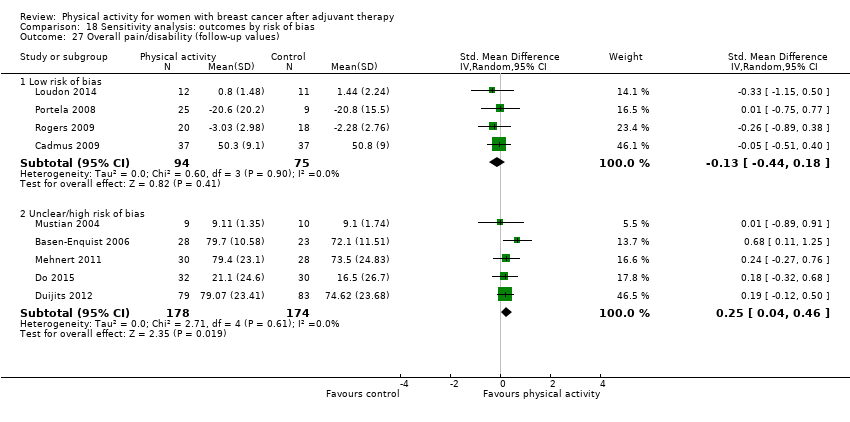
Comparison 18 Sensitivity analysis: outcomes by risk of bias, Outcome 27 Overall pain/disability (follow‐up values).
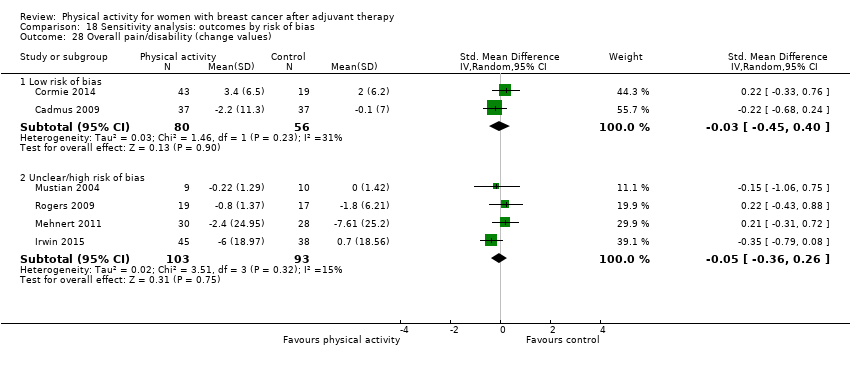
Comparison 18 Sensitivity analysis: outcomes by risk of bias, Outcome 28 Overall pain/disability (change values).

Comparison 18 Sensitivity analysis: outcomes by risk of bias, Outcome 29 Overall cardiorespiratory fitness (follow‐up values).

Comparison 18 Sensitivity analysis: outcomes by risk of bias, Outcome 30 Overall cardiorespiratory fitness (change values).

Comparison 18 Sensitivity analysis: outcomes by risk of bias, Outcome 31 Overall self‐reported physical activity (follow‐up values).

Comparison 18 Sensitivity analysis: outcomes by risk of bias, Outcome 32 Overall self‐reported physical activity (change values).
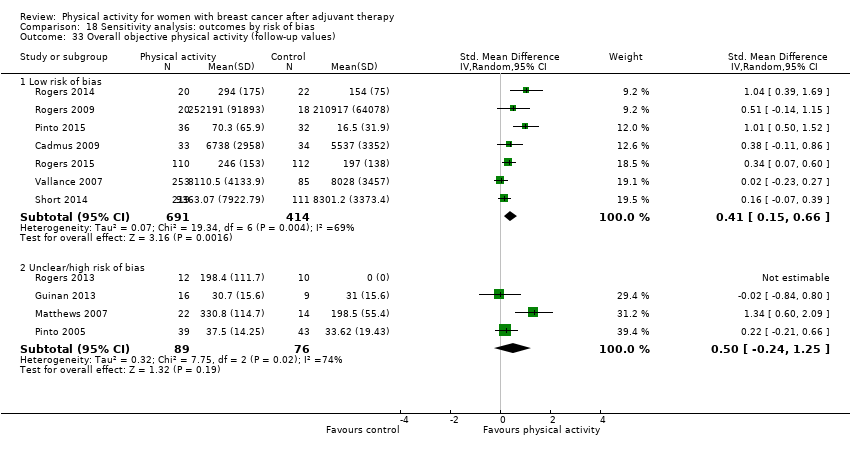
Comparison 18 Sensitivity analysis: outcomes by risk of bias, Outcome 33 Overall objective physical activity (follow‐up values).

Comparison 18 Sensitivity analysis: outcomes by risk of bias, Outcome 34 Overall objective physical activity (change values).
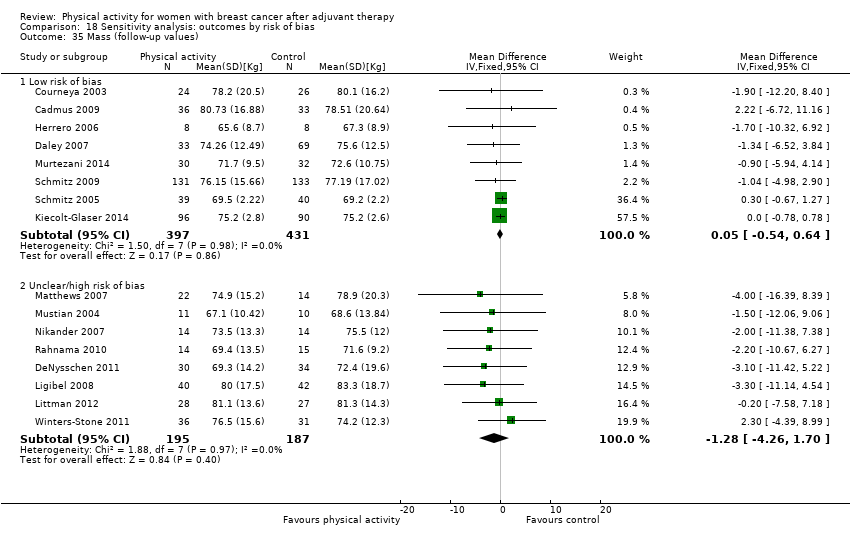
Comparison 18 Sensitivity analysis: outcomes by risk of bias, Outcome 35 Mass (follow‐up values).
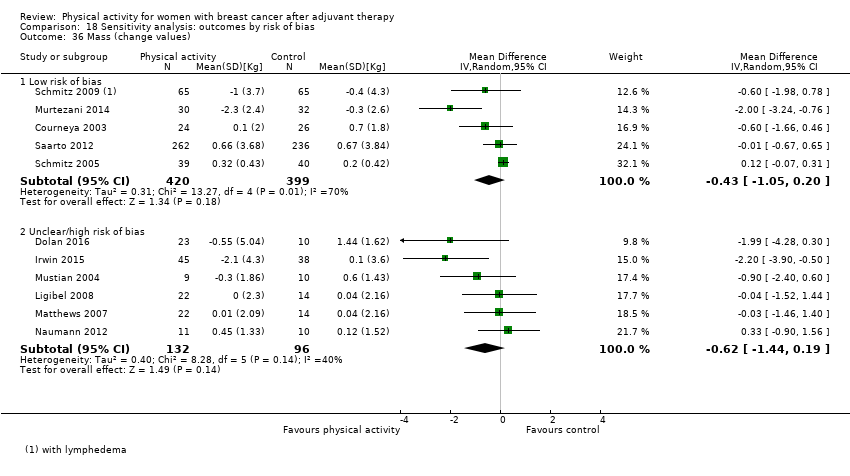
Comparison 18 Sensitivity analysis: outcomes by risk of bias, Outcome 36 Mass (change values).

Comparison 18 Sensitivity analysis: outcomes by risk of bias, Outcome 37 BMI (follow‐up values).

Comparison 18 Sensitivity analysis: outcomes by risk of bias, Outcome 38 BMI (change values).
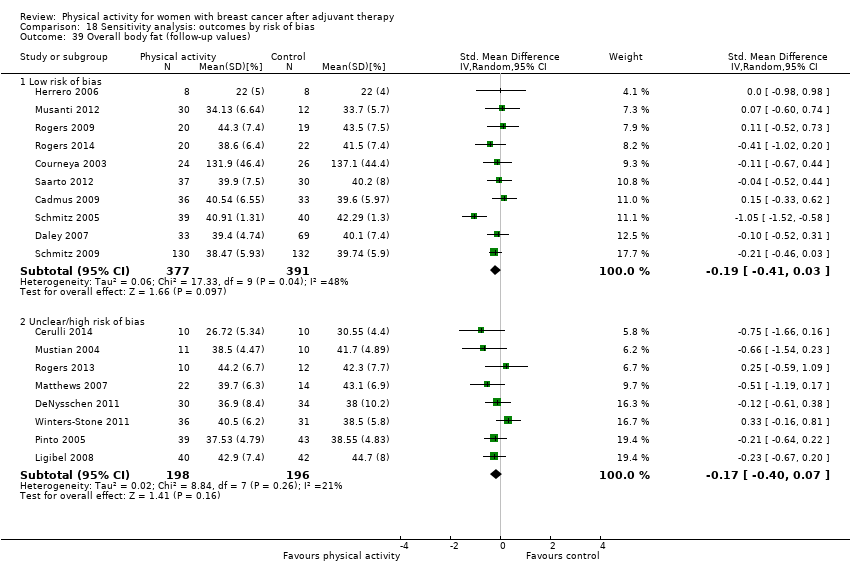
Comparison 18 Sensitivity analysis: outcomes by risk of bias, Outcome 39 Overall body fat (follow‐up values).
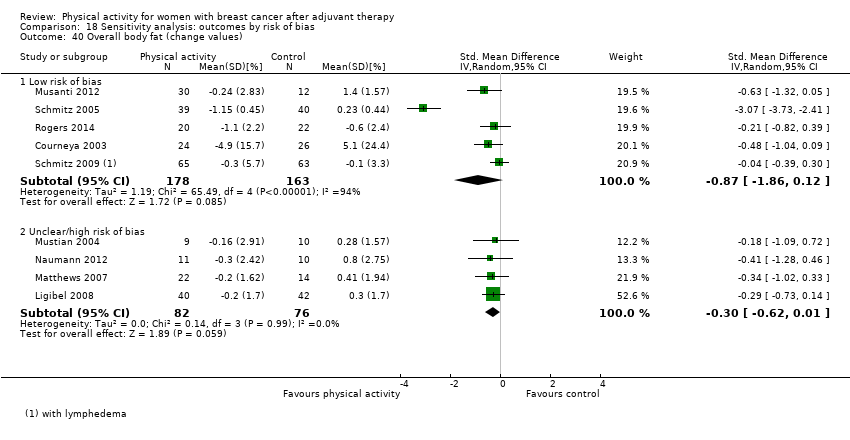
Comparison 18 Sensitivity analysis: outcomes by risk of bias, Outcome 40 Overall body fat (change values).

Comparison 18 Sensitivity analysis: outcomes by risk of bias, Outcome 41 Lower body strength (follow‐up values).

Comparison 18 Sensitivity analysis: outcomes by risk of bias, Outcome 42 Lower body strength (change values).

Comparison 18 Sensitivity analysis: outcomes by risk of bias, Outcome 43 Upper body strength (follow‐up values).
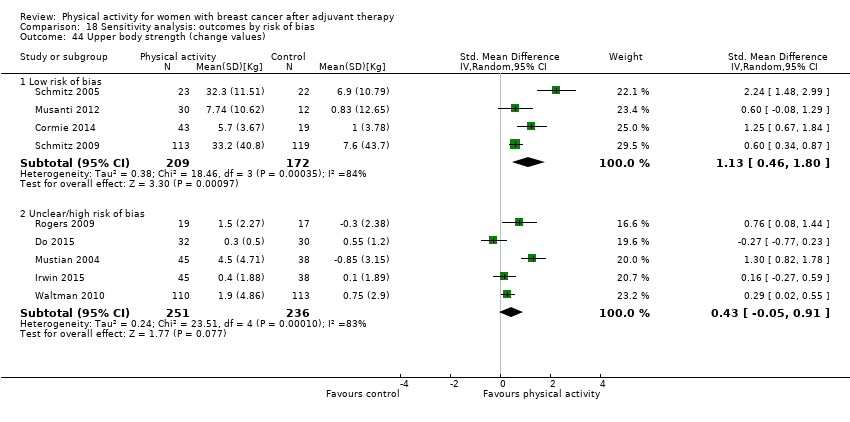
Comparison 18 Sensitivity analysis: outcomes by risk of bias, Outcome 44 Upper body strength (change values).

Comparison 18 Sensitivity analysis: outcomes by risk of bias, Outcome 45 Bone mineral density ‐ femoral neck (follow‐up and change values).

Comparison 18 Sensitivity analysis: outcomes by risk of bias, Outcome 46 Bone mineral density ‐ lumbar spine (follow‐up and change values).
| Physical activity versus control for women with breast cancer after adjuvant therapy | |||||
| Patient or population: women with breast cancer after adjuvant therapy | |||||
| Outcomes | Illustrative comparative risks* (95% CI) | No. of participants | Quality of the evidence | Comments | |
| Assumed risk | Corresponding risk | ||||
| Control | Physical activity | ||||
| HRQoL at end of intervention follow‐up | Mean HRQoL at end of intervention follow‐up ranged across control groups from | Mean HRQoL at end of intervention follow‐up in the intervention groups was | 1996 | ⊕⊕⊝⊝ | SMD 0.39 (0.21 to 0.57) re‐expressed using FACT‐G (0 to 104 scale); the intervention mean HRQoL was 5.9 (3.2 to 8.6) points higher than control (MID 5 to 6 points). |
| Emotional function/mental health at end of intervention follow‐up | Mean emotional function/mental health at end of intervention follow‐up ranged across control groups from | Mean emotional function/mental health at end of intervention follow‐up in the intervention groups was | 2102 | ⊕⊕⊕⊝ | SMD 0.21 (0.10 to 0.32) re‐expressed using FACT‐EBW (0 to 24 scale); the intervention mean emotion function was 0.7 (0.3 to 1.0) points higher than control (MID 2 points). |
| Perceived physical function at end of intervention follow‐up | Mean physical function at end of intervention follow‐up ranged across control groups from | Mean physical function at end of intervention follow‐up in the intervention groups was | 2129 | ⊕⊕⊕⊝ | SMD 0.33 (0.18 to 0.49) re‐expressed using FACT‐PBW (0 to 28 scale); the intervention mean physical function was 1.7 (0.9 to 2.5) points higher than control (MID 2 points). |
| Anxiety at end of intervention follow‐up | Mean anxiety at end of intervention follow‐up ranged across control groups from | Mean anxiety at end of intervention follow‐up in the intervention groups was | 326 | ⊕⊝⊝⊝ | SMD ‐0.57 (‐0.95 to ‐0.19) re‐expressed using PROMIS (0 to 9 scale); the intervention mean anxiety was 1.9 (3.2 to 0.6) points lower than control (MID 3 to 4.5 points). |
| Depression at end of intervention follow‐up | Mean depression at end of intervention follow‐up ranged across control groups from | Mean depression at end of intervention follow‐up in the intervention groups was | 657 | ⊕⊕⊝⊝ | SMD ‐0.34 (‐0.62 to ‐0.05) re‐expressed using BDI‐II (0 to 63 scale); the intervention mean depression was 3.8 (7.0 to 0.6) % lower than control (MID 18%). |
| Fatigue at end of intervention follow‐up | Mean fatigue at end of intervention follow‐up ranged across control groups from | Mean fatigue at end of intervention follow‐up in the intervention groups was | 2020 | ⊕⊕⊕⊝ | SMD ‐0.32 (‐0.47 to ‐0.18) re‐expressed using FACT‐F (0 to 52 scale); the intervention mean fatigue was 2.8 (4.1 to 1.6) points lower than control (MID 3 points). |
| Cardiorespiratory fitness at end of intervention follow‐up | Mean cardiorespiratory fitness at end of intervention follow‐up ranged across control groups from | Mean cardiorespiratory fitness at end of intervention follow‐up in the intervention groups was | 1265 | ⊕⊕⊕⊝ | SMD 0.44 (0.30 to 0.58) re‐expressed as VO₂max (mL/kg/min); the intervention mean was 2.1 (1.4 to 2.7) mL/kg/min higher than control (MID 3.5 mL/kg/min). |
| *The basis for the assumed risk (e.g. median control group risk across studies) is provided in footnotes. The corresponding risk (and its 95% confidence interval) is based on the assumed risk in the comparison group and the relative effect of the intervention (and its 95% CI). | |||||
| GRADE Working Group grades of evidence. | |||||
| aAs a rule of thumb, 0.2 SD represents a small effect, 0.5 SD a moderate effect, and 0.8 SD a large effect. cAll trials lacked blinding of participants (performance bias), and most trials lacked blinding of outcome assessors (detection bias) and had incomplete outcome reporting and/or high attrition (attrition bias), but most were at a low risk of selection bias, reporting bias, and other bias, and therefore, we did not downgraded based on risk of bias. | |||||
| Physical activity versus control for women with breast cancer after adjuvant therapy | |||||
| Patient or population: women with breast cancer after adjuvant therapy | |||||
| Outcomes | Illustrative comparative risks* (95% CI) | No. of participants | Quality of the evidence | Comments | |
| Assumed risk | Corresponding risk | ||||
| Control | Physical activity | ||||
| HRQoL change from baseline to end of intervention | Mean HRQoL change from baseline to end of intervention ranged across control groups from | Mean HRQoL change from baseline to end of intervention in the intervention groups was | 1459 | ⊕⊕⊝⊝ | SMD 0.78 (0.39 to 1.17) re‐expressed using FACT‐G (0 to 104 scale); the intervention mean change was 5.0 (2.5 to 7.5) points higher than control (MID 5 to 6 points) |
| Emotional function/mental health change from baseline to end of intervention | Mean emotional function/mental health change from baseline to end of intervention ranged across control groups from | Mean emotional function/mental health change from baseline to end of intervention in the intervention groups was | 1579 | ⊕⊕⊕⊝ | SMD 0.31 (0.09 to 0.53) re‐expressed using FACT‐EBW (0 to 24 scale); the intervention mean change was 0.8 (0.2 to 1.3) points higher than control (MID 2 points). |
| Perceived physical function change from baseline to end of intervention | Mean physical function change from baseline to end of intervention ranged across control groups from | Mean physical function change from baseline to end of intervention in the intervention groups was | 1433 | ⊕⊕⊕⊝ | SMD 0.60 (0.23 to 0.97) re‐expressed using FACT‐PBW (0 to 28 scale); the intervention mean change was 1.3 (0.5 to 2.1) points higher than control (MID 2 points). |
| Anxiety change from baseline to end of intervention | Mean anxiety change from baseline to end of intervention ranged across control groups from | Mean anxiety change from baseline to end of intervention in the intervention groups was | 235 | ⊕⊕⊝⊝ | SMD ‐0.37 (‐0.63 to ‐0.12) re‐expressed using PROMIS (0 to 9 scale); the intervention mean change was 4.6 (7.6 to 1.5) points lower than control (MID 3 to 4.5 points). |
| Depression change from baseline to end of intervention | Mean depression change from baseline to end of intervention ranged across control groups from | Mean depression change from baseline to end of intervention in the intervention groups was | 816 | ⊕⊝⊝⊝ very lowc,g | SMD ‐0.34 (‐0.63 to ‐0.05) re‐expressed using BDI‐II (0 to 63 scale); the intervention mean change was 2.5 (4.6 to 0.4) % lower than control (MID 18%). |
| Fatigue change from baseline to end of intervention | Mean fatigue change from baseline to end of intervention ranged across control groups from | Mean fatigue change from baseline to end of intervention in the intervention groups was | 1289 | ⊕⊕⊝⊝ | SMD ‐0.3 (‐0.61 to 0) re‐expressed using FACT‐F (0 to 52 scale); the intervention mean change was 2.6 (5.2 to 0) points lower than control (MID 3 units). |
| Cardiorespiratory fitness change from baseline to end of intervention | Mean cardiorespiratory fitness change from baseline to end of intervention ranged across control groups from | Mean cardiorespiratory fitness change from baseline to end of intervention in the intervention groups was | 863 | ⊕⊝⊝⊝ | SMD 0.83 (0.4 to 1.27) re‐expressed using VO₂max (mL/kg/min); the intervention mean change was 2.3 (1.1 to 3.4) mL/kg/min higher than control (MID 3.5 mL/kg/min). |
| *The basis for the assumed risk (e.g. median control group risk across studies) is provided in footnotes. The corresponding risk (and its 95% confidence interval) is based on the assumed risk in the comparison group and the relative effect of the intervention (and its 95% CI). | |||||
| GRADE Working Group grades of evidence. | |||||
| aAs a rule of thumb, 0.2 SD represents a small effect, 0.5 SD a moderate effect, and 0.8 SD a large effect. | |||||
| QoL domain and instrument name | Direction of response | Trials using this scale |
| Cognitive function | ||
| Cognitive problems ‐ Breast Cancer Prevention Trial (BCPT) Symptom Checklist | Higher score indicates worse status. | |
| Cognitive function ‐ European Organization for Research and Treatment of Cancer Quality of Life Questionnaire‐C30 (EORTC QLQ‐C30) | Higher score indicates better status. | |
| Cognitive function ‐ Functional Assessment of Cancer Therapy‐Cognitive (FACT‐C) | Higher score indicates worse status. | |
| Confusion ‐ Profile of Mood States (POMS) | Higher score indicates worse status. | |
| Emotional function/mental health | ||
| Psychosocial global score ‐ Cancer Rehabilitation Evaluation System Short Form (CARES‐SF) | Higher score indicates worse status. | |
| Emotional function ‐ EORTC QLQ‐C30 | Higher score indicates better status. | |
| Emotional well‐being ‐ FACT‐General (FACT‐G) | Higher score indicates better status. | Banasik 2011; Cadmus 2009; Courneya 2003; Daley 2007; Littman 2012; Loh 2014; Milne 2008; Murtezani 2014; Naumann 2012; Rogers 2009; Rogers 2015; Vallance 2007 |
| Emotions ‐ Lymphedema Quality of Life Tool (LYMQOL) | Higher score indicates worse status. | |
| Mental composite ‐ Medical Outcomes Study Short Form‐12 (MOS SF‐12) and MOS SF‐36 | Higher score indicates better status. | SF‐12: Cuesta‐Vargas 2014; Fillion 2008 SF‐36: (Cormie 2014; Kiecolt‐Glaser 2014; Pinto 2015; Schmitz 2009 |
| Mental health ‐ MOS SF‐12 | Higher score indicates better status. | Baruth 2013; Basen‐Enquist 2006; Cadmus 2009; Cormie 2014; Duijits 2012; Kiecolt‐Glaser 2014; McKenzie 2003; Mehnert 2011; Pinto 2015 |
| Role emotion ‐ MOS SF‐36 | Higher score indicates better status. | Baruth 2013; Basen‐Enquist 2006; Cadmus 2009; Cormie 2014; Duijits 2012; Kiecolt‐Glaser 2014; McKenzie 2003; Mehnert 2011 |
| Positive and Negative Affect Scale (PANAS) | Higher score indicates better status. | |
| Total mood disturbance score ‐ POMS | Higher score indicates worse status. | |
| Anxiety and depression ‐ POMS | Higher score indicates worse status. | |
| Anger ‐ POMS | Higher score indicates worse status. | |
| General health perspective | ||
| Global health ‐ EORTC QLQ‐C30 | Higher score indicates better status. | Do 2015; Ergun 2013; Herrero 2006; Mehnert 2011; Saarto 2012 |
| Current health ‐ International Breast Cancer Study Group (IBCSG) | Higher score indicates better status. | |
| General health ‐ MOS SF‐36 | Higher score indicates better status. | Baruth 2013; Basen‐Enquist 2006; Cadmus 2009; Cormie 2014; Duijits 2012; Kiecolt‐Glaser 2014; McKenzie 2003; Mehnert 2011; Mustian 2004 |
| Single question on perceived general health | Higher score indicates better status. | |
| Perceived physical function | ||
| Physical condition ‐ Body Esteem Scale (BES) | Higher score indicates better status. | |
| Physical strength ‐ Body Image and Relationships Scale (BIRS) | Higher score indicates worse status. | |
| Physical global ‐ CARES‐SF | Higher score indicates worse status. | |
| Physical function ‐ EORTC QLQ‐C30 | Higher score indicates better status. | |
| Physical well‐being ‐ FACT‐G | Higher score indicates better status. | Banasik 2011; Cadmus 2009; Courneya 2003; Daley 2007; Littman 2012; Loh 2014; Milne 2008; Murtezani 2014; Naumann 2012; Rogers 2009; Rogers 2015; Vallance 2007 |
| Physical well‐being ‐ IBCSG | Higher score indicates better status. | |
| Physical function ‐ MOS SF‐12 | Higher score indicates better status. | |
| Physical function composite score ‐ MOS SF‐36 | Higher score indicates better status. | Baruth 2013; Cormie 2014; Duijits 2012; McKenzie 2003; Mehnert 2011; Mustian 2004; Schmitz 2009; Winters‐Stone 2011 |
| Role function | ||
| Marital global score ‐ CARES‐SF | Higher score indicates worse status. | |
| Role function ‐ EORTC QLQ‐C30 | Higher score indicates better status. | |
| Functional well‐being ‐ FACT‐G | Higher score indicates better status. | Banasik 2011; Cadmus 2009; Courneya 2003; Daley 2007; Littman 2012; Loh 2014; Milne 2008; Murtezani 2014; Naumann 2012; Rogers 2009; Rogers 2015; Vallance 2007 |
| Function ‐ LYMQOL | Higher score indicates worse status. | |
| Physical role function ‐ MOS SF‐36 | Higher score indicates better status. | Baruth 2013; Basen‐Enquist 2006; Cadmus 2009; Cormie 2014; Duijits 2012; Kiecolt‐Glaser 2014; McKenzie 2003; Mehnert 2011; Mustian 2004 |
| Sexuality | ||
| Sexual attractiveness ‐ BES | Higher score indicates better status. | |
| Appearance and sexuality ‐ BIRS | Higher score indicates worse status. | |
| Sexual function and sexual enjoyment ‐ EORTC QLQ‐C30 | Higher score indicates better status. | |
| Sexual global ‐ CARES‐SF | Higher score indicates worse status. | |
| Sexual functioning ‐ Sexual Activity Questionnaire | Higher score indicates better status. | |
| Sleep | ||
| Pittsburgh Sleep Quality Index (PSI) | Higher score indicates worse status. | Bower 2011; Carson 2009; Kiecolt‐Glaser 2014; Payne 2008; Rogers 2009; Rogers 2013; Rogers 2014 |
| Sleep disturbance (0 to 9 scale) | Higher score indicates higher disturbance. | |
| Sleep objectively via accelerometers | Higher sleep time and efficiency indicate better status. | |
| Social function | ||
| Social functioning ‐ BIRS | Higher score indicates worse status. | |
| Body Image Questionnaire (BIQ) | Higher score indicates worse status. | |
| Social function ‐ EORTC QLQ‐C30 | Higher score indicates better status. | |
| Social well‐being ‐ FACT‐G | Higher score indicates better status. | Banasik 2011; Cadmus 2009; Courneya 2003; Daley 2007; Littman 2012; Loh 2014; Milne 2008; Murtezani 2014; Naumann 2012; Rogers 2009; Rogers 2015; Vallance 2007 |
| Social support ‐ IBCSG | Higher score indicates better status. | |
| Social functioning ‐ MOS SF‐36 | Higher score indicates better status. | Baruth 2013; Basen‐Enquist 2006; Cadmus 2009; Cormie 2014; Duijits 2012; Kiecolt‐Glaser 2014; McKenzie 2003; Mehnert 2011; Mustian 2004 |
| Social Barriers Scale | Higher score indicates better status. | |
| Other psychological outcomes | ||
| Anxiety | ||
| Depression and Anxiety Stress Scale‐21 (DASS‐21) | Higher score indicates worse status. | |
| Hospital Anxiety and Depression scale (HADS) | Higher score indicates worse status. | |
| Tension‐anxiety ‐ POMS | Higher score indicates worse status. | |
| Anxiety ‐ Patient Reported Outcomes Measurement Information System (PROMIS) | Higher score indicates worse status. | |
| Social Physique Anxiety Scale‐7 (SPAS‐7) | Higher score indicates worse status. | |
| State‐Trait Anxiety Index (STAI) | Higher score indicates worse status. | |
| Cohen’s 10‐item perceived stress scale | Higher score indicates worse status. | |
| Symptoms of Stress Inventory (SOSI) | Higher score indicates worse status. | |
| Depression | ||
| Beck Depression Inventory (BDI) | Higher score indicates worse status. | Bower 2011; Daley 2007; Ergun 2013; Kaltsatou 2011; Naumann 2012; Saarto 2012; Segar 1998 |
| Centres for Epidemiological Studies Depression scale (CES‐D) | Higher score indicates worse status. | |
| DASS‐21 | Higher score indicates worse status. | |
| HADS | Higher score indicates worse status. | |
| Depression subscale ‐ POMS | Higher score indicates worse status. | |
| Depression ‐ PROMIS | Higher score indicates worse status. | |
| Fatigue | ||
| Brief Fatigue Inventory | Higher score indicates worse status. | |
| Fatigue subscale ‐ FACT‐F | Higher score indicates better status. | Baruth 2013; Courneya 2003; Littman 2012; Loh 2014; Peppone 2015; Rogers 2009; Saarto 2012; Short 2014; Vallance 2007 |
| Likert scale responses to fatigue‐related items (0 to 4) | Higher score indicates worse status. | |
| Linear visual analogue scale (VAS) for fatigue (0 to 10) | Higher score indicates worse status. | |
| Multidimensional Fatigue Symptom Inventory (MFSI) | Higher score indicates worse status. | Bower 2011; Fillion 2008; Heim 2007; Peppone 2015; Rogers 2013; Rogers 2014 |
| Fatigue subscale ‐ POMS | Higher score indicates worse status. | |
| Fatigue ‐ PROMIS | Higher score indicates worse status. | |
| Revised Piper Fatigue Scale (PFS) | Higher score indicates worse status. | Cantarero‐Villanueva 2013; Cuesta‐Vargas 2014; Daley 2007; Musanti 2012; Naumann 2012; Payne 2008 |
| Schwartz Cancer Fatigue Scale (SCFS) | Higher score indicates worse status. | |
| Fatigue 0 to 9 scale | Higher score indicates worse status. | |
| Happiness/satisfaction with life | ||
| 2‐Item Fordyce Happiness Measure | Higher score indicates better status. | |
| Happiness measure | Higher score indicates better status. | |
| Life Satisfaction Inventory (LSI) | Higher score indicates better status. | |
| Satisfaction With Life Scale (SWLS) | Higher score indicates better status. | |
| Pain/disability | ||
| Brief Pain Inventory (BPI) | Higher score indicates worse status. | |
| Disabilities of the Arm, Shoulder, and Hand (DASH) | Higher score indicates worse status. | |
| Pain subscale ‐ EORTC QLQ‐C30 | Higher score indicates worse status. | |
| Pain scale ‐ MOS SF‐36 | Higher score indicates better status. | Baruth 2013; Basen‐Enquist 2006; Cadmus 2009; Cormie 2014; Duijits 2012; Mehnert 2011; Mustian 2004 |
| University of Rochester Cancer Center Symptom Inventory (URCC SI) | Higher score indicates worse status. | |
| Pain VAS 0 to 10 | Higher score indicates worse status. | |
| 5‐Point Likert scale version of 24‐item Western Ontario and McMaster Universities Osteoarthritis Index (WOMAC) | Higher score indicates worse status. | |
| Pain 0 to 9 scale | Higher score indicates worse status. | |
| Self‐esteem | ||
| BES | Higher score indicates better status. | |
| Body Image Questionnaire (BIQ) | Higher score indicates worse status. | |
| Body Image and Relationships Scale (BIRS) | Higher score indicates worse status. | |
| Body image ‐ EORTC QLQ‐Breast‐Related 23 | Higher score indicates better status. | |
| Physical Self‐Perception Profile | Higher score indicates better status. | |
| Rosenberg Self‐Esteem Scale (RSE) | Higher score indicates better status. | Cadmus 2009; Courneya 2003; Musanti 2012; Mustian 2004; Segar 1998 |
| Social Physique Anxiety Scale 7 (SPAS‐7) | Higher score indicates worse status. | |
| Vitality/vigour | ||
| Vitality scale ‐ MOS SF‐36 | Higher score indicates better status. | Baruth 2013; Basen‐Enquist 2006; Cadmus 2009; Cormie 2014; Duijits 2012; Kiecolt‐Glaser 2014; Mehnert 2011; Mustian 2004 |
| Vigour subscale ‐ POMS | Higher score indicates better status. | Cantarero‐Villanueva 2013; Fillion 2008; Pinto 2003; Pinto 2005 |
| Other psychological measures | ||
| Basic Psychological Needs Satisfaction Scale (BNS) | Higher score indicates better status. | |
| Behavioral Regulation for Exercise Questionnaire 2 (BREQ‐2) | Higher score indicates higher status of each subscale. | |
| Endocrine symptoms ‐ FACT‐Endocrine symptoms | Higher score indicates worse status. | |
| Exercise role identity ‐ 9‐item, 5‐point Likert‐type instrument (Anderson and Cychosz) | Higher score indicates greater exercise role identity. | |
| Exercise self‐efficacy ‐ 14‐item Steinhardt and Dishman Questionnaire | Higher score indicates better status. | |
| Hot flashes and night sweats ‐ Hot Flush Rating Scale | Higher score indicates worse status. | |
| Outcome expectancy value ‐ 19‐item Steinhardt and | Higher score indicates higher outcome expectancy. | |
| Menopausal symptoms 0 to 9 scale | Higher score indicates worse status. | |
| Menopausal symptoms ‐ Women’s Health Questionnaire (WHQ) | Higher score indicates worse status. | |
| Self‐regulation ‐ 20‐item, 5‐point Likert‐type instrument | Higher score indicates better status. | |
| Symptom Checklist‐90 Revised (SCL‐90R) | Higher score indicates worse status. | |
| Urinary symptoms ‐ Bristol Female Lower Urinary Tract Symptoms Questionnaire (BFLUTS) | Higher score indicates worse status. | |
| Instrument or test name | Outcome | Measurement units | Trials using this instrument or test |
| 12‐Minute walk test | Cardiorespiratory fitness | Distance covered in metres | |
| 2‐Kilometre walking test | Cardiorespiratory fitness | Time to complete in minutes | |
| 6‐Minute walk test | Cardiorespiratory fitness | Distance covered in metres | Basen‐Enquist 2006; Kaltsatou 2011; Kim 2015; Mustian 2004; Nieman 1995 |
| Aerobic Power Index cycle test | Cardiorespiratory fitness | Relative power output in W/kg | |
| Astrand‐Rhyming cycle test | Cardiorespiratory fitness | Estimated maximal oxygen uptake (VO₂max) in mL/kg/min | |
| Ebbeling 8‐minute single‐stage walking treadmill test | Cardiorespiratory fitness | Distance covered in metres | |
| Graded exercise treadmill test | Cardiorespiratory fitness | Direct VO₂max in mL/kg/min | |
| Graded exercise cycle ergometer test | Cardiorespiratory fitness | Direct VO₂max in mL/kg/min | |
| Harvard step test | Cardiorespiratory fitness | Heart rate in beats per minute (bpm) post test | |
| Modified Bruce protocol | Cardiorespiratory fitness | Estimated VO₂max in mL/kg/min | |
| Naughton submaximal treadmill test | Cardiorespiratory fitness | Estimated VO₂max in mL/kg/min | |
| Rockport 1‐mile walk test | Cardiorespiratory fitness | Time to complete in minutes | |
| 7‐Day Physical Activity Recall (PAR) | Self‐reported physical activity | Minutes/week | Basen‐Enquist 2006; Cadmus 2009; Hatchett 2013; Pinto 2005; Pinto 2015 |
| Community Health Activities Model Programme for Seniors (CHAMPS) | Self‐reported physical activity | Metabolic equivalent (MET)‐h/week | Baruth 2013; Kiecolt‐Glaser 2014; Matthews 2007; Winters‐Stone 2011 |
| International Physical Activity Questionnaire (IPAQ) | Self‐reported physical activity | MET‐h/week | |
| Physical activity questionnaire | Self‐reported physical activity | Minutes/week | |
| Leisure Score Index (LSI) of Godin Leisure‐Time Exercise Questionnaire | Self‐reported physical activity | Minutes/week | Courneya 2003; Guinan 2013; Kim 2015; Rogers 2009; Rogers 2015; Short 2014; Vallance 2007 |
| Modifiable Activity Questionnaire | Self‐reported physical activity | MET‐h/week | |
| Physical Activity Recall Questionnaire | Self‐reported physical activity | MET‐h/week | |
| Accelerometer | Objective physical activity | Counts per minute/d | Guinan 2013; Matthews 2007; Pinto 2005; Pinto 2015; Rogers 2009; Rogers 2013; Rogers 2014; Rogers 2015 |
| Pedometer | Objective physical activity | Steps/d | |
| Body fat via bioelectrical impedance analysis (BIA) | Body composition | % and/or kg | Cerulli 2014; Daley 2007; Guinan 2013; Ligibel 2008; Matthews 2007; Musanti 2012; Mustian 2004; Rogers 2013; Rogers 2014 |
| Body fat and lean mass via dual‐energy X‐ray absorptiometry (DEXA) | Body composition | % and/or kg | Cadmus 2009; DeNysschen 2011; Matthews 2007; Rogers 2009; Saarto 2012; Schmitz 2005; Schmitz 2009; Winters‐Stone 2011 |
| Body fat and muscle mass via multi‐slice magnetic resonance imaging (MRI) | Body composition | % and kg | |
| Body mass index (BMI) | Anthropometric | kg/m² | Basen‐Enquist 2006; Cadmus 2009; Courneya 2003; Daley 2007; Kiecolt‐Glaser 2014; Ligibel 2008; Littman 2012; Murtezani 2014; Mustian 2004; Naumann 2012; Nikander 2007; Pinto 2003; Portela 2008; Rahnama 2010; Rogers 2009; Rogers 2013; Rogers 2014; Schmitz 2005; Schmitz 2009 |
| Body mass | Anthropometric | kg | Cadmus 2009; Courneya 2003; Daley 2007; DeNysschen 2011; Dolan 2016; Guinan 2013; Herrero 2006; Irwin 2015; Kiecolt‐Glaser 2014; Ligibel 2008; Littman 2012; Matthews 2007; Murtezani 2014; Musanti 2012; Naumann 2012; Nikander 2007; Pinto 2003; Rahnama 2010; Saarto 2012; Schmitz 2005; Schmitz 2009; Winters‐Stone 2011 |
| Skinfold thickness | Body composition | mm and/or % | |
| Hip circumference | Anthropometric | cm | Basen‐Enquist 2006; Cadmus 2009; Dolan 2016; Ligibel 2008; Littman 2012; Rahnama 2010; Rogers 2009 |
| Waist circumference | Anthropometric | cm | Basen‐Enquist 2006; Cadmus 2009; Dolan 2016; Guinan 2013; Ligibel 2008; Littman 2012; Rahnama 2010; Rogers 2009; Schmitz 2005 |
| Waist‐to‐hip ratio | Anthropometric | NA | Ligibel 2008; Rahnama 2010; Rogers 2009; Rogers 2013; Rogers 2014 |
| Handgrip strength | Muscular strength | kg | Irwin 2015; Kaltsatou 2011; Kim 2015; Mustian 2004; Portela 2008; Rogers 2009; Saarto 2012; Winters‐Stone 2011 |
| Repetition maximum (RM) bench/chest press | Muscular strength | kg | Cormie 2014; Milne 2008; Musanti 2012; Naumann 2012; Schmitz 2005; Schmitz 2009; Winters‐Stone 2011) |
| RM leg press | Muscular strength | kg | Cerulli 2014; Cormie 2014; Dolan 2016; Milne 2008; Musanti 2012; Naumann 2012; Schmitz 2005; Schmitz 2009; Winters‐Stone 2011 |
| Total bone mineral content (BMC) | Bone‐related outcomes | g/cm | |
| BMC of distal tibia, tibial midshaft, and femoral neck | Bone‐related outcomes | g/cm | |
| Bone mineral density (BMD) via DEXA | Bone‐related outcomes | g/cm² | Cadmus 2009; Kim 2015; Rogers 2009; Saarto 2012; Waltman 2010; Winters‐Stone 2011 |
| BMD of femoral neck and lumbar spine | Bone‐related outcomes | g/cm² | Kim 2015; Rogers 2009; Saarto 2012; Waltman 2010; Winters‐Stone 2011 |
| BMD greater trochanter via DEXA | Bone‐related outcomes | g/cm² | |
| BMD total hip via DEXA | Bone‐related outcomes | g/cm² | |
| BMD total radius and 33% radius via DEXA | Bone‐related outcomes | g/cm² | |
| Bone Remodeling Index (BRI) | Bone‐related outcomes | NA | |
| Serum bone‐specific alkaline phosphatase (BSAP) | Bone‐related outcomes | μg/L | |
| SerumN‐telopeptides of type I collagen (NTx) | Bone‐related outcomes | nm bone collagen equivalent (BCE) | |
| Serum osteocalcin | Bone‐related outcomes | nmol |
| Outcome | Immediate postintervention estimate (95% CI) | ≥ 3‐Month postintervention estimate (95% CI) | Change from baseline to end of intervention estimate (95% CI) | Change from baseline to ≥ 3‐month postintervention estimate (95% CI) |
| QoL subscale domain | ||||
| Cognitive function | SMD: 0.40 (0.11 to 0.69) N women (trials): 189 (5) I² = 0% | SMD: 0.31 (‐0.09 to 0.71) N women (trials): 97 (2) I² = 0% | SMD: ‐0.00 (‐0.27 to 0.26) N women (trials): 672 (5) I² = 35% | SMD: 0.20 (‐0.20 to 0.60) N women (trials): 97 (2) I² = 0% |
| Emotional function/mental health | SMD: 0.21 (0.10 to 0.32) N women (trials): 2102 (26) I² = 27% | SMD: 0.20 (0.03 to 0.36) N women (trials): 655 (7) I² = 10% | SMD: 0.31 (0.09 to 0.53) N women (trials): 1579 (15) I² = 72% | SMD: 0.06 (‐0.29 to 0.41) N women (trials): 179 (3) I² = 27% |
| General health perspective | SMD: 0.18 (‐0.08 to 0.45) N women (trials): 456 (1) I² = 47% | NA | SMD: 0.17 (‐0.07 to 0.40) N women (trials): 906 (9) I² = 49% | NA |
| Perceived physical function | SMD: 0.33 (0.18 to 0.49) N women (trials): 2129 (25) I² = 61% | SMD: 0.21 (0.06 to 0.37) N women (trials): 637 (6) I² = 0% | SMD: 0.60 (0.23 to 0.97) N women (trials): 1433 (13) I² = 89% | NA |
| Role function | SMD: 0.29 (0.07 to 0.51) N women (trials): 1370 (18) I² = 69% | SMD: 0.13 (‐0.12 to 0.38) N women (trials): 249 (2) I² = 0% | SMD: 0.14 (‐0.05 to 0.33) N women (trials): 1315 (12) I² = 50% | NA |
| Sexual function | SMD: 0.16 (‐0.04 to 0.35) N women (trials): 411 (5) I² = 0% | NA | SMD: 0.22 (‐0.08 to 0.52) N women (trials): 693 (3) I² = 62% | NA |
| Sleep | SMD: ‐0.09 (‐0.37 to 0.20) N women (trials): 188 (5) I² = 0% | NA | SMD: 0.14 (‐0.20 to 0.48) N women (trials): 136 (3) I² = 0% | NA |
| Social function | SMD: 0.19 (0.08 to 0.30) N women (trials): 1557 (18) I² = 11% | NA | SMD: 0.52 (0.16 to 0.87) N women (trials): 1384 (12) I² = 87% | NA |
| Other psychological outcomes | ||||
| Anxiety | SMD: ‐0.57 (‐0.95 to ‐0.19) N women (trials): 326 (7) I² = 60% | NA | SMD: ‐0.37 (‐0.63 to ‐0.12) N women (trials): 235 (4) I² = 0% | NA |
| Depression | SMD: ‐0.34 (‐0.62 to ‐0.05) N women (trials): 657 (12) I² = 63% | SMD: ‐0.28 (‐0.51 to ‐0.05) N women (trials): 340 (4) I² = 9% | SMD: ‐0.34 (‐0.63 to ‐0.05) N women (trials): 816 (7) I² = 62% | NA |
| Fatigue | SMD: ‐0.32 (‐0.47 to ‐0.18) N women (trials): 2020 (26) I² = 54% | SMD: ‐0.43 (‐0.60 to ‐0.26) N women (trials): 536 (7) I² = 0% | SMD:‐0.30 (‐0.61 to 0.00) N women (trials): 1289 (13) I² = 80% | SMD: ‐0.47 (‐0.84 to ‐0.11) N women (trials): 178 (4) I² = 23% |
| Happiness/satisfaction with life | SMD: 0.61 (‐0.16 to 1.37) N women (studies): 209 (4) I² = 85% | NA | SMD: 0.28 (‐0.05 to 0.62) N women (studies): 182 (3) I² = 23% | NA |
| Pain/disability | SMD: 0.08 (‐0.09 to 0.25) N women (trials): 535 (9) I² = 0% | NA | SMD: ‐0.08 (‐0.33 to 0.16) N women (trials): 296 (5) I² = 5% | NA |
| Self‐esteem | SMD: 0.27 (0.05 to 0.48) N women (trials): 667 (12) I² = 42% | NA | SMD: 0.23 (‐0.11 to 0.58) N women (trials): 992 (9) I² = 80% | NA |
| Vigour/vitality | SMD: 0.36 (0.21 to 0.50) N women (trials): 762 (10) I² = 0% | SMD: 0.26 (0.04 to 0.48) N women (trials): 454 (4) I² = 24% | SMD: 0.23 (0.00 to 0.45) N women (trials): 359 (6) I² = 10% | SMD: 0.20 (‐0.06 to 0.46) N women (trials): 233 (2) I² = 0% |
| Cardiorespiratory fitness outcomes | ||||
| Overall cardiorespiratory fitness | SMD: 0.44 (0.30 to 0.58) N women (trials): 1265 (23) I² = 30% | SMD: 0.36 (0.03 to 0.69) N women (trials): 362 (3) I² = 53% | SMD: 0.83 (0.40 to 1.27) N women (trials): 863 (9) I² = 82% | SMD: 0.42 (0.05 to 0.79) N women (trials): 115 (2) I² = 0% |
| Directly assessed VO₂peak (mL/kg/min) | MD: 1.89 (0.65 to 3.13) N women (trials): 199 (4) I² = 0% | NA | MD: 1.31 (0.66 to 1.96) N women (trials): 166 (3) I² = 68% | NA |
| Peak power output (W) | MD: 18.92 (9.64 to 28.20) N women (trials): 66 (2) I² = 0% | NA | NA | NA |
| Resting heart rate (bpm) | MD: ‐4.47 (‐7.94 to ‐1.00) N women (trials): 82 (2) I² = 0% | NA | MD: ‐1.05 (‐2.22 to 0.11) N women (trials): 86 (2) I² = 81% | NA |
| Resting systolic blood pressure (mmHg) | MD: ‐0.83 (‐3.72 to 2.05) N women (trials): 134 (4) I² = 0% | NA | MD: ‐1.12 (‐7.74 to 5.50) N women (trials): 143 (3) I² = 73% | NA |
| Resting diastolic blood pressure (mmHg) | MD: 0.66 (‐2.89 to 4.21) N women (trials): 106 (3) I² = 22% | NA | MD: 0.53 (‐1.61 to 2.68) N women (trials): 144 (3) I² = 23% | NA |
| Physical activity outcomes | ||||
| Self‐reported physical activity | SMD: 0.52 (0.33 to 0.71) N women (trials): 2012 (17) I² = 72% | SMD: 0.44 (0.17 to 0.72) N women (trials): 683 (4) I² = 53% | SMD: 0.57 (0.25 to 0.90) N women (trials): 1274 (8) I² = 82% | SMD: 0.51 (0.08 to 0.93) N women (trials): 521 (4) I² = 67% |
| Meeting recommended physical activity guidelines | OR: 8.44 (2.41 to 29.56) N women (trials): 819 (6) I² = 89% | OR: 3.11 (1.50 to 6.46) N women (trials): 280 (2) I² = 28% | NA | NA |
| Objective physical activity | SMD: 0.43 (0.19 to 0.66) N women (trials): 1248 (10) I² = 67% | SMD: 0.22 (‐0.21 to 0.66) N women (trials): 305 (3) I² = 58% | SMD: 0.71 (0.14 to 1.29) N women (trials): 508 (5) I² = 83% | SMD: 0.23 (‐1.00 to 1.46) N women (trials): 61 (2) I² = 81% |
| Objective sedentary behaviour | SMD: ‐1.45 (‐3.68 to 0.78) N women (trials): 103 (3) I² = 95% | NA | SMD: ‐0.01 (‐0.63 to 0.60) N women (trials): 103 (3) I² = 57% | NA |
| Anthropometric outcomes | ||||
| Mass (kg) | MD: 0.00 (‐0.57 to 0.58) N women (trials): 1210 (16) I² = 0% | NA | MD: ‐0.50 (‐0.98 to ‐0.01) N women (trials): 1047 (11) I² = 59% | NA |
| BMI (kg/m2) | MD: 0.01 (‐0.19 to 0.22) N women (trials): 1481 (17) I² = 0% | NA | MD: ‐0.22 (‐0.45 to 0.01) N women (trials): 485 (8) I² = 65% | NA |
| Body fat | SMD: ‐0.18 (‐0.34 to ‐0.03) N women (trials): 1162 (18) I² = 35% | NA | SMD: ‐0.62 (‐1.19 to ‐0.06) N women (trials): 499 (9) I² = 88% | NA |
| Lean mass | MD: 0.05 (‐0.11 to 0.21) N women (trials): 612 (8) I² = 0% | NA | MD: 0.80 (‐0.13 to 1.72) N women (trials): 760 (5) I² = 95% | NA |
| Waist‐to‐hip ratio | MD: ‐0.03 (‐0.06 to 0.01) N women (trials): 213 (5) I² = 54% | NA | MD: 0.00 (‐0.01 to 0.01) N women (trials): 124 (2) I² = 0% | NA |
| Waist circumference (cm) | MD: ‐0.50 (‐3.18 to 2.18) N women (trials): 330 (6) I² = 0% | NA | MD: ‐1.71 (‐2.56 to ‐0.86) N women (trials): 285 (5) I² = 48% | NA |
| Hip circumference (cm) | MD: ‐0.97 (‐3.96 to 2.01) N women (trials): 249 (4) I² = 0% | NA | MD: ‐2.37 (‐3.31 to ‐1.44) N women (trials): 115 (2) I² = 5% | NA |
| Muscular strength outcomes | ||||
| Lower body strength | SMD: 0.44 (0.09 to 0.78) N women (trials): 637 (10) I² = 74% | NA | SMD: 0.72 (0.38 to 1.07) N women (trials): 720 (8) I² = 73% | NA |
| Upper body strength | SMD: 0.42 (0.08 to 0.76) N women (trials): 13 (768) I² = 79% | NA | SMD: 0.72 (0.30 to 1.14) N women (trials): 832 (8) I² = 86% | NA |
| Grip strength | MD: 2.37 kg (0.20 to 4.55) N women (trials): 320 (7) I² = 68% | NA | SMD: 0.24 (‐0.09 to 0.58) N women (trials): 145 (2) I² = 0% | NA |
| Bone health outcomes | ||||
| Bone mineral content (change and postintervention values) | SMD: 0.04 (‐0.20 to 0.27) N women (trials): 525 (2) I² = 22% | NA | NA | NA |
| Bone mineral density – femoral neck (change and postintervention values) | SMD: 0.21 (‐0.13 to 0.55) N women (trials): 786 (4) I² = 75% | NA | NA | NA |
| Bone mineral density – lumbar spine (change and postintervention values) | SMD: 0.22 (‐0.09 to 0.53) N women (trials): 786 (4) I² = 70% | NA | NA | NA |
| Bone mineral density – total hip (change and postintervention values) | SMD: 0.58 (‐0.02 to 1.18) N women (trials): 329 (3) I² = 97% | NA | NA | NA |
| Bone formation ‐ Alkaline phosphatase (change and postintervention values) | SMD: ‐0.25 (‐1.81 to 1.31) N women (trials): 239 (2) I² = 89% | NA | NA | NA |
| Bone resorption ‐ serum NTx (change and postintervention values) | SMD: 0.38 (‐1.58 to 2.34) N women (trials): 278 (3) I² = 97% | NA | NA | NA |
| CI: confidence interval. MD: mean difference. NA: not applicable. OR: odds ratio. SMD: standardised mean difference. | ||||
| Outcome or subgroup title | No. of studies | No. of participants | Statistical method | Effect size |
| 1 Overall HRQoL (follow‐up values) Show forest plot | 22 | Std. Mean Difference (IV, Random, 95% CI) | Subtotals only | |
| 1.1 End of intervention | 22 | 1996 | Std. Mean Difference (IV, Random, 95% CI) | 0.39 [0.21, 0.57] |
| 1.2 Follow‐up | 4 | 418 | Std. Mean Difference (IV, Random, 95% CI) | 0.20 [0.00, 0.39] |
| 2 Overall HRQoL (change values) Show forest plot | 14 | Std. Mean Difference (IV, Random, 95% CI) | Subtotals only | |
| 2.1 End of intervention | 14 | 1459 | Std. Mean Difference (IV, Random, 95% CI) | 0.78 [0.39, 1.17] |
| 2.2 Follow‐up | 2 | 132 | Std. Mean Difference (IV, Random, 95% CI) | 0.52 [0.15, 0.88] |
| 3 FACT‐G (follow‐up values) Show forest plot | 10 | Mean Difference (IV, Random, 95% CI) | Subtotals only | |
| 3.1 End of intervention | 10 | 1094 | Mean Difference (IV, Random, 95% CI) | 7.06 [2.82, 11.30] |
| 3.2 Follow‐up | 3 | 342 | Mean Difference (IV, Random, 95% CI) | 2.81 [‐0.46, 6.08] |
| 4 FACT‐G (change values) Show forest plot | 6 | Mean Difference (IV, Random, 95% CI) | Subtotals only | |
| 4.1 End of intervention | 6 | 663 | Mean Difference (IV, Random, 95% CI) | 5.04 [1.32, 8.75] |
| 4.2 Follow‐up | 2 | 132 | Mean Difference (IV, Random, 95% CI) | 6.16 [1.63, 10.69] |
| 5 FACT‐B (follow‐up values) Show forest plot | 11 | Mean Difference (IV, Random, 95% CI) | Subtotals only | |
| 5.1 End of intervention | 11 | 1395 | Mean Difference (IV, Random, 95% CI) | 6.31 [1.15, 11.47] |
| 5.2 Follow‐up | 4 | 421 | Mean Difference (IV, Random, 95% CI) | 3.77 [0.11, 7.43] |
| 6 FACT‐B (change values) Show forest plot | 6 | Mean Difference (IV, Random, 95% CI) | Subtotals only | |
| 6.1 End of intervention | 6 | 605 | Mean Difference (IV, Random, 95% CI) | 8.16 [2.56, 13.76] |
| 6.2 Follow‐up | 2 | 132 | Mean Difference (IV, Random, 95% CI) | 6.95 [1.34, 12.56] |
| 7 FACT Breast Cancer Subscale (follow‐up values) Show forest plot | 11 | Mean Difference (IV, Random, 95% CI) | Subtotals only | |
| 7.1 End of intervention | 11 | 1043 | Mean Difference (IV, Random, 95% CI) | 1.98 [0.92, 3.04] |
| 7.2 Follow‐up | 4 | 386 | Mean Difference (IV, Random, 95% CI) | 3.20 [‐0.65, 7.05] |
| 8 FACT Breast Cancer Subscale (change values) Show forest plot | 7 | Mean Difference (IV, Random, 95% CI) | Subtotals only | |
| 8.1 End of intervention | 7 | 646 | Mean Difference (IV, Random, 95% CI) | 1.78 [‐0.14, 3.70] |
| 8.2 Follow‐up | 1 | 36 | Mean Difference (IV, Random, 95% CI) | 1.30 [‐1.56, 4.16] |
| 9 FACT Trial Outcome Index (follow‐up values) Show forest plot | 4 | Mean Difference (IV, Random, 95% CI) | Subtotals only | |
| 9.1 End of intervention | 4 | 658 | Mean Difference (IV, Random, 95% CI) | 7.90 [‐1.24, 17.04] |
| 9.2 Follow‐up | 1 | 213 | Mean Difference (IV, Random, 95% CI) | 3.60 [0.01, 7.19] |
| 10 EORTC QLQ‐C30 Global Health (follow‐up values) Show forest plot | 4 | Mean Difference (IV, Random, 95% CI) | Subtotals only | |
| 10.1 End of intervention | 4 | 195 | Mean Difference (IV, Random, 95% CI) | 7.85 [2.16, 13.55] |
| 10.2 Follow‐up | 0 | 0 | Mean Difference (IV, Random, 95% CI) | 0.0 [0.0, 0.0] |
| 11 EORTC QLQ‐C30 Global Health (change values) Show forest plot | 4 | Mean Difference (IV, Random, 95% CI) | Subtotals only | |
| 11.1 End of intervention | 4 | 633 | Mean Difference (IV, Random, 95% CI) | 9.53 [‐2.43, 21.49] |
| 11.2 Follow‐up | 0 | 0 | Mean Difference (IV, Random, 95% CI) | 0.0 [0.0, 0.0] |
| 12 Overall emotional function/mental health (follow‐up values) Show forest plot | 26 | Std. Mean Difference (IV, Random, 95% CI) | Subtotals only | |
| 12.1 End of intervention | 26 | 2102 | Std. Mean Difference (IV, Random, 95% CI) | 0.21 [0.10, 0.32] |
| 12.2 Follow‐up | 7 | 655 | Std. Mean Difference (IV, Random, 95% CI) | 0.20 [0.03, 0.36] |
| 13 Overall emotional function/mental health (change values) Show forest plot | 15 | Std. Mean Difference (IV, Random, 95% CI) | Subtotals only | |
| 13.1 End of intervention | 15 | 1579 | Std. Mean Difference (IV, Random, 95% CI) | 0.31 [0.09, 0.53] |
| 13.2 Follow‐up | 3 | 179 | Std. Mean Difference (IV, Random, 95% CI) | 0.06 [‐0.29, 0.41] |
| 14 FACT Emotional well‐being (follow‐up values) Show forest plot | 11 | Mean Difference (IV, Random, 95% CI) | Subtotals only | |
| 14.1 End of intervention | 11 | 1064 | Mean Difference (IV, Random, 95% CI) | 0.47 [0.01, 0.94] |
| 14.2 Follow‐up | 3 | 311 | Mean Difference (IV, Random, 95% CI) | 0.14 [‐0.85, 1.14] |
| 15 FACT Emotional well‐being (change values) Show forest plot | 6 | Mean Difference (IV, Random, 95% CI) | Subtotals only | |
| 15.1 End of intervention | 6 | 582 | Mean Difference (IV, Random, 95% CI) | 0.96 [0.34, 1.57] |
| 15.2 Follow‐up | 1 | 36 | Mean Difference (IV, Random, 95% CI) | 0.79 [‐0.67, 2.25] |
| 16 MOS SF Mental composite (follow‐up values) Show forest plot | 5 | Mean Difference (IV, Random, 95% CI) | Subtotals only | |
| 16.1 End of intervention | 5 | 563 | Mean Difference (IV, Random, 95% CI) | 0.49 [‐1.09, 2.06] |
| 16.2 Follow‐up | 3 | 281 | Mean Difference (IV, Random, 95% CI) | 2.27 [0.05, 4.50] |
| 17 MOS SF Mental composite (change values) Show forest plot | 2 | Mean Difference (IV, Fixed, 95% CI) | Subtotals only | |
| 17.1 End of intervention | 2 | 294 | Mean Difference (IV, Fixed, 95% CI) | 2.22 [‐0.95, 5.40] |
| 17.2 Follow‐up | 0 | 0 | Mean Difference (IV, Fixed, 95% CI) | 0.0 [0.0, 0.0] |
| 18 MOS SF Mental health (follow‐up values) Show forest plot | 7 | Mean Difference (IV, Random, 95% CI) | Subtotals only | |
| 18.1 End of intervention | 7 | 524 | Mean Difference (IV, Random, 95% CI) | 1.67 [‐0.65, 3.99] |
| 18.2 Follow‐up | 2 | 196 | Mean Difference (IV, Random, 95% CI) | 3.49 [‐0.97, 7.95] |
| 19 MOS SF Mental health (change values) Show forest plot | 5 | Mean Difference (IV, Fixed, 95% CI) | Subtotals only | |
| 19.1 End of intervention | 5 | 333 | Mean Difference (IV, Fixed, 95% CI) | 2.22 [0.70, 3.74] |
| 19.2 Follow‐up | 0 | 0 | Mean Difference (IV, Fixed, 95% CI) | 0.0 [0.0, 0.0] |
| 20 MOS SF Emotional role (follow‐up values) Show forest plot | 5 | Mean Difference (IV, Fixed, 95% CI) | Subtotals only | |
| 20.1 End of intervention | 5 | 330 | Mean Difference (IV, Fixed, 95% CI) | ‐0.00 [‐1.09, 1.09] |
| 20.2 Follow‐up | 1 | 120 | Mean Difference (IV, Fixed, 95% CI) | 3.06 [‐11.55, 17.67] |
| 21 MOS SF Emotional role (change values) Show forest plot | 4 | Mean Difference (IV, Fixed, 95% CI) | Subtotals only | |
| 21.1 End of intervention | 4 | 213 | Mean Difference (IV, Fixed, 95% CI) | 0.23 [‐0.79, 1.24] |
| 21.2 Follow‐up | 0 | 0 | Mean Difference (IV, Fixed, 95% CI) | 0.0 [0.0, 0.0] |
| 22 EORTC QLQ‐C30 Emotional function (follow‐up values) Show forest plot | 3 | Mean Difference (IV, Random, 95% CI) | Subtotals only | |
| 22.1 End of intervention | 3 | 135 | Mean Difference (IV, Random, 95% CI) | 11.53 [3.96, 19.11] |
| 22.2 Follow‐up | 0 | 0 | Mean Difference (IV, Random, 95% CI) | 0.0 [0.0, 0.0] |
| 23 EORTC QLQ‐C30 Emotional function (change values) Show forest plot | 3 | Mean Difference (IV, Random, 95% CI) | Subtotals only | |
| 23.1 End of intervention | 3 | 573 | Mean Difference (IV, Random, 95% CI) | 0.90 [‐5.12, 6.92] |
| 23.2 Follow‐up | 0 | 0 | Mean Difference (IV, Random, 95% CI) | 0.0 [0.0, 0.0] |
| 24 POMS total mood disturbance (follow‐up values) Show forest plot | 3 | Std. Mean Difference (IV, Random, 95% CI) | Subtotals only | |
| 24.1 End of intervention | 3 | 161 | Std. Mean Difference (IV, Random, 95% CI) | ‐0.93 [‐1.55, ‐0.32] |
| 24.2 Follow‐up | 1 | 61 | Std. Mean Difference (IV, Random, 95% CI) | ‐0.54 [‐1.06, ‐0.03] |
| 25 POMS total mood disturbance (change values) Show forest plot | 2 | Std. Mean Difference (IV, Random, 95% CI) | Subtotals only | |
| 25.1 End of intervention | 2 | 143 | Std. Mean Difference (IV, Random, 95% CI) | 0.07 [‐0.65, 0.79] |
| 25.2 Follow‐up | 2 | 143 | Std. Mean Difference (IV, Random, 95% CI) | 0.09 [‐0.23, 0.42] |
| 26 POMS anger subscale (follow‐up values) Show forest plot | 2 | Std. Mean Difference (IV, Random, 95% CI) | Subtotals only | |
| 26.1 End of intervention | 2 | 79 | Std. Mean Difference (IV, Random, 95% CI) | ‐0.78 [‐1.25, ‐0.31] |
| 26.2 Follow‐up | 1 | 61 | Std. Mean Difference (IV, Random, 95% CI) | ‐0.44 [‐0.94, 0.07] |
| 27 Happiness/satisfaction with life (follow‐up values) Show forest plot | 4 | Std. Mean Difference (IV, Random, 95% CI) | Subtotals only | |
| 27.1 End of intervention | 4 | 209 | Std. Mean Difference (IV, Random, 95% CI) | 0.61 [‐0.16, 1.37] |
| 27.2 Follow‐up | 0 | 0 | Std. Mean Difference (IV, Random, 95% CI) | 0.0 [0.0, 0.0] |
| 28 Happiness/satisfaction with life (change values) Show forest plot | 3 | Std. Mean Difference (IV, Random, 95% CI) | Subtotals only | |
| 28.1 End of intervention | 3 | 182 | Std. Mean Difference (IV, Random, 95% CI) | 0.28 [‐0.05, 0.62] |
| 28.2 Follow‐up | 0 | 0 | Std. Mean Difference (IV, Random, 95% CI) | 0.0 [0.0, 0.0] |
| 29 Overall physical function (follow‐up values) Show forest plot | 25 | Std. Mean Difference (IV, Random, 95% CI) | Subtotals only | |
| 29.1 End of intervention | 25 | 2129 | Std. Mean Difference (IV, Random, 95% CI) | 0.33 [0.18, 0.49] |
| 29.2 Follow‐up | 6 | 637 | Std. Mean Difference (IV, Random, 95% CI) | 0.21 [0.06, 0.37] |
| 30 Overall physical function (change values) Show forest plot | 13 | Std. Mean Difference (IV, Random, 95% CI) | Subtotals only | |
| 30.1 End of intervention | 13 | 1433 | Std. Mean Difference (IV, Random, 95% CI) | 0.60 [0.23, 0.97] |
| 30.2 Follow‐up | 1 | 36 | Std. Mean Difference (IV, Random, 95% CI) | 0.17 [‐0.48, 0.83] |
| 31 FACT Physical well‐being (follow‐up values) Show forest plot | 11 | Mean Difference (IV, Random, 95% CI) | Subtotals only | |
| 31.1 End of intervention | 11 | 1064 | Mean Difference (IV, Random, 95% CI) | 1.44 [0.31, 2.56] |
| 31.2 Follow‐up | 3 | 311 | Mean Difference (IV, Random, 95% CI) | 1.17 [0.22, 2.12] |
| 32 FACT Physical well‐being (change values) Show forest plot | 6 | Mean Difference (IV, Random, 95% CI) | Subtotals only | |
| 32.1 End of intervention | 6 | 579 | Mean Difference (IV, Random, 95% CI) | 1.60 [‐0.85, 4.05] |
| 32.2 Follow‐up | 1 | 36 | Mean Difference (IV, Random, 95% CI) | 0.9 [‐2.37, 4.17] |
| 33 MOS SF Physical composite (follow‐up values) Show forest plot | 4 | Mean Difference (IV, Fixed, 95% CI) | Subtotals only | |
| 33.1 End of intervention | 4 | 437 | Mean Difference (IV, Fixed, 95% CI) | 1.78 [0.12, 3.43] |
| 33.2 Follow‐up | 2 | 163 | Mean Difference (IV, Fixed, 95% CI) | 1.30 [‐1.23, 3.82] |
| 34 MOS SF Physical composite (change values) Show forest plot | 2 | Mean Difference (IV, Fixed, 95% CI) | Subtotals only | |
| 34.1 End of intervention | 2 | 294 | Mean Difference (IV, Fixed, 95% CI) | 2.56 [‐0.13, 5.25] |
| 34.2 Follow‐up | 0 | 0 | Mean Difference (IV, Fixed, 95% CI) | 0.0 [0.0, 0.0] |
| 35 MOS SF Physical function (follow‐up values) Show forest plot | 7 | Mean Difference (IV, Random, 95% CI) | Subtotals only | |
| 35.1 End of intervention | 7 | 515 | Mean Difference (IV, Random, 95% CI) | 2.09 [0.03, 4.15] |
| 35.2 Follow‐up | 2 | 239 | Mean Difference (IV, Random, 95% CI) | 2.71 [‐1.58, 6.99] |
| 36 MOS SF Physical function (change values) Show forest plot | 5 | Mean Difference (IV, Random, 95% CI) | Subtotals only | |
| 36.1 End of intervention | 5 | 333 | Mean Difference (IV, Random, 95% CI) | 2.08 [0.21, 3.94] |
| 36.2 Follow‐up | 0 | 0 | Mean Difference (IV, Random, 95% CI) | 0.0 [0.0, 0.0] |
| 37 EORTC QLQ‐C30 Physical function (follow‐up values) Show forest plot | 3 | Mean Difference (IV, Random, 95% CI) | Subtotals only | |
| 37.1 End of intervention | 3 | 135 | Mean Difference (IV, Random, 95% CI) | 2.99 [‐1.64, 7.63] |
| 37.2 Follow‐up | 0 | 0 | Mean Difference (IV, Random, 95% CI) | 0.0 [0.0, 0.0] |
| 38 EORTC QLQ‐C30 Physical function (change values) Show forest plot | 3 | Mean Difference (IV, Random, 95% CI) | Subtotals only | |
| 38.1 End of intrevention | 3 | 573 | Mean Difference (IV, Random, 95% CI) | 3.12 [‐3.24, 9.49] |
| 38.2 Follow‐up | 0 | 0 | Mean Difference (IV, Random, 95% CI) | 0.0 [0.0, 0.0] |
| 39 Body Esteem Scale ‐ Physical condition (follow‐up values) Show forest plot | 2 | Mean Difference (IV, Random, 95% CI) | Subtotals only | |
| 39.1 End of intervention | 2 | 106 | Mean Difference (IV, Random, 95% CI) | 4.41 [0.57, 8.25] |
| 39.2 Follow‐up | 0 | 0 | Mean Difference (IV, Random, 95% CI) | 0.0 [0.0, 0.0] |
| 40 Overall role function (follow‐up values) Show forest plot | 18 | Std. Mean Difference (IV, Random, 95% CI) | Subtotals only | |
| 40.1 End of intervention | 18 | 1370 | Std. Mean Difference (IV, Random, 95% CI) | 0.29 [0.07, 0.51] |
| 40.2 Follow‐up | 2 | 249 | Std. Mean Difference (IV, Random, 95% CI) | 0.13 [‐0.12, 0.38] |
| 41 Overall role function (change values) Show forest plot | 12 | Std. Mean Difference (IV, Random, 95% CI) | Subtotals only | |
| 41.1 End of intervention | 12 | 1315 | Std. Mean Difference (IV, Random, 95% CI) | 0.14 [‐0.05, 0.33] |
| 41.2 Follow‐up | 1 | 36 | Std. Mean Difference (IV, Random, 95% CI) | 0.37 [‐0.29, 1.03] |
| 42 FACT Functional well‐being (follow‐up values) Show forest plot | 11 | Mean Difference (IV, Random, 95% CI) | Subtotals only | |
| 42.1 End of intervention | 11 | 1064 | Mean Difference (IV, Random, 95% CI) | 1.67 [0.29, 3.06] |
| 42.2 Follow‐up | 2 | 249 | Mean Difference (IV, Random, 95% CI) | 0.68 [‐0.65, 2.01] |
| 43 FACT Functional well‐being (change values) Show forest plot | 6 | Mean Difference (IV, Fixed, 95% CI) | Subtotals only | |
| 43.1 End of intervention | 6 | 582 | Mean Difference (IV, Fixed, 95% CI) | 0.72 [0.42, 1.01] |
| 43.2 Follow‐up | 1 | 36 | Mean Difference (IV, Fixed, 95% CI) | 1.31 [‐1.02, 3.64] |
| 44 MOS SF Physical role (follow‐up values) Show forest plot | 3 | Mean Difference (IV, Fixed, 95% CI) | Subtotals only | |
| 44.1 End of intervention | 3 | 143 | Mean Difference (IV, Fixed, 95% CI) | ‐0.16 [‐1.47, 1.15] |
| 44.2 Follow‐up | 0 | 0 | Mean Difference (IV, Fixed, 95% CI) | 0.0 [0.0, 0.0] |
| 45 MOS SF Physical role (change values) Show forest plot | 3 | Mean Difference (IV, Random, 95% CI) | Subtotals only | |
| 45.1 End of intervention | 3 | 155 | Mean Difference (IV, Random, 95% CI) | 0.46 [‐1.52, 2.43] |
| 45.2 Follow‐up | 0 | 0 | Mean Difference (IV, Random, 95% CI) | 0.0 [0.0, 0.0] |
| 46 EORTC QLQ‐C30 Role function (follow‐up values) Show forest plot | 3 | Mean Difference (IV, Random, 95% CI) | Subtotals only | |
| 46.1 End of intervention | 3 | 135 | Mean Difference (IV, Random, 95% CI) | 0.44 [‐5.78, 6.66] |
| 46.2 Follow‐up | 0 | 0 | Mean Difference (IV, Random, 95% CI) | 0.0 [0.0, 0.0] |
| 47 EORTC QLQ‐C30 Role function (change values) Show forest plot | 3 | Mean Difference (IV, Fixed, 95% CI) | Subtotals only | |
| 47.1 End of intervention | 3 | 573 | Mean Difference (IV, Fixed, 95% CI) | ‐1.08 [‐4.52, 2.36] |
| 47.2 Follow‐up | 0 | 0 | Mean Difference (IV, Fixed, 95% CI) | 0.0 [0.0, 0.0] |
| 48 Overall social well‐being/function (follow‐up values) Show forest plot | 18 | Std. Mean Difference (IV, Random, 95% CI) | Subtotals only | |
| 48.1 End of intervention | 18 | 1557 | Std. Mean Difference (IV, Random, 95% CI) | 0.19 [0.08, 0.30] |
| 48.2 Follow‐up | 1 | 213 | Std. Mean Difference (IV, Random, 95% CI) | 0.09 [‐0.18, 0.36] |
| 49 Overall social well‐being/function (change values) Show forest plot | 12 | Std. Mean Difference (IV, Random, 95% CI) | Subtotals only | |
| 49.1 End of intervention | 12 | 1384 | Std. Mean Difference (IV, Random, 95% CI) | 0.52 [0.16, 0.87] |
| 49.2 Follow‐up | 1 | 36 | Std. Mean Difference (IV, Random, 95% CI) | 0.69 [0.01, 1.36] |
| 50 FACT Social well‐being (follow‐up values) Show forest plot | 11 | Mean Difference (IV, Random, 95% CI) | Subtotals only | |
| 50.1 End of intervention | 11 | 1064 | Mean Difference (IV, Random, 95% CI) | 0.77 [0.11, 1.43] |
| 50.2 Follow‐up | 1 | 213 | Mean Difference (IV, Random, 95% CI) | 0.5 [‐1.02, 2.02] |
| 51 FACT Social well‐being (change values) Show forest plot | 6 | Mean Difference (IV, Fixed, 95% CI) | Subtotals only | |
| 51.1 End of intervention | 6 | 582 | Mean Difference (IV, Fixed, 95% CI) | 1.93 [1.58, 2.28] |
| 51.2 Follow‐up | 1 | 36 | Mean Difference (IV, Fixed, 95% CI) | 3.86 [0.17, 7.55] |
| 52 MOS SF Social functioning (follow‐up values) Show forest plot | 5 | Mean Difference (IV, Fixed, 95% CI) | Subtotals only | |
| 52.1 End of intervention | 5 | 234 | Mean Difference (IV, Fixed, 95% CI) | ‐0.32 [‐1.87, 1.23] |
| 52.2 Follow‐up | 0 | 0 | Mean Difference (IV, Fixed, 95% CI) | 0.0 [0.0, 0.0] |
| 53 MOS SF Social functioning (change values) Show forest plot | 4 | Mean Difference (IV, Fixed, 95% CI) | Subtotals only | |
| 53.1 End of intervention | 4 | 213 | Mean Difference (IV, Fixed, 95% CI) | 1.05 [‐0.08, 2.18] |
| 53.2 Follow‐up | 0 | 0 | Mean Difference (IV, Fixed, 95% CI) | 0.0 [0.0, 0.0] |
| 54 EORTC QLQ‐C30 Social function (follow‐up values) Show forest plot | 2 | Mean Difference (IV, Random, 95% CI) | Subtotals only | |
| 54.1 End of intervention | 2 | 73 | Mean Difference (IV, Random, 95% CI) | 7.55 [‐11.77, 26.86] |
| 54.2 Follow‐up | 0 | 0 | Mean Difference (IV, Random, 95% CI) | 0.0 [0.0, 0.0] |
| 55 EORTC QLQ‐C30 Social function (change values) Show forest plot | 3 | Mean Difference (IV, Random, 95% CI) | Subtotals only | |
| 55.1 End of intervention | 3 | 573 | Mean Difference (IV, Random, 95% CI) | 2.14 [‐8.02, 12.30] |
| 55.2 Follow‐up | 0 | 0 | Mean Difference (IV, Random, 95% CI) | 0.0 [0.0, 0.0] |
| 56 Overall cognitive function (follow‐up values) Show forest plot | 5 | Std. Mean Difference (IV, Random, 95% CI) | Subtotals only | |
| 56.1 End of intervention | 5 | 189 | Std. Mean Difference (IV, Random, 95% CI) | 0.40 [0.11, 0.69] |
| 56.2 Follow‐up | 2 | 97 | Std. Mean Difference (IV, Random, 95% CI) | 0.31 [‐0.09, 0.71] |
| 57 Overall cognitive function (change values) Show forest plot | 5 | Std. Mean Difference (IV, Random, 95% CI) | Subtotals only | |
| 57.1 End of intervention | 5 | 672 | Std. Mean Difference (IV, Random, 95% CI) | ‐0.00 [‐0.27, 0.26] |
| 57.2 Follow‐up | 2 | 97 | Std. Mean Difference (IV, Random, 95% CI) | 0.20 [‐0.20, 0.60] |
| 58 EORTC QLQ‐C30 Cognitive function (follow‐up values) Show forest plot | 2 | Mean Difference (IV, Fixed, 95% CI) | Subtotals only | |
| 58.1 End of intervention | 2 | 73 | Mean Difference (IV, Fixed, 95% CI) | 2.43 [‐5.75, 10.61] |
| 58.2 Follow‐up | 0 | 0 | Mean Difference (IV, Fixed, 95% CI) | 0.0 [0.0, 0.0] |
| 59 EORTC QLQ‐C30 Cognitive function (change values) Show forest plot | 3 | Mean Difference (IV, Fixed, 95% CI) | Subtotals only | |
| 59.1 End of intervention | 3 | 573 | Mean Difference (IV, Fixed, 95% CI) | ‐3.25 [‐6.31, ‐0.18] |
| 59.2 Follow‐up | 0 | 0 | Mean Difference (IV, Fixed, 95% CI) | 0.0 [0.0, 0.0] |
| 60 POMS confusion subscale (follow‐up values) Show forest plot | 2 | Std. Mean Difference (IV, Fixed, 95% CI) | Subtotals only | |
| 60.1 End of intervention | 2 | 79 | Std. Mean Difference (IV, Fixed, 95% CI) | ‐0.66 [‐1.12, ‐0.19] |
| 60.2 Follow‐up | 1 | 61 | Std. Mean Difference (IV, Fixed, 95% CI) | ‐0.45 [‐0.96, 0.06] |
| 61 Overall general health (follow‐up values) Show forest plot | 9 | Std. Mean Difference (IV, Random, 95% CI) | Subtotals only | |
| 61.1 End of intervention | 9 | 456 | Std. Mean Difference (IV, Random, 95% CI) | 0.18 [‐0.08, 0.45] |
| 61.2 Follow‐up | 1 | 36 | Std. Mean Difference (IV, Random, 95% CI) | ‐0.22 [‐0.87, 0.44] |
| 62 Overall general health (change values) Show forest plot | 9 | Std. Mean Difference (IV, Random, 95% CI) | Subtotals only | |
| 62.1 End of intervention | 9 | 906 | Std. Mean Difference (IV, Random, 95% CI) | 0.17 [‐0.07, 0.40] |
| 62.2 Follow‐up | 1 | 36 | Std. Mean Difference (IV, Random, 95% CI) | 0.07 [‐0.59, 0.72] |
| 63 MOS SF General health (follow‐up values) Show forest plot | 5 | Mean Difference (IV, Random, 95% CI) | Subtotals only | |
| 63.1 End of intervention | 5 | 233 | Mean Difference (IV, Random, 95% CI) | 2.14 [‐2.61, 6.88] |
| 63.2 Follow‐up | 0 | 0 | Mean Difference (IV, Random, 95% CI) | 0.0 [0.0, 0.0] |
| 64 MOS SF General health (change values) Show forest plot | 4 | Mean Difference (IV, Fixed, 95% CI) | Subtotals only | |
| 64.1 End of intervention | 4 | 213 | Mean Difference (IV, Fixed, 95% CI) | 0.10 [‐1.26, 1.45] |
| 64.2 Follow‐up | 0 | 0 | Mean Difference (IV, Fixed, 95% CI) | 0.0 [0.0, 0.0] |
| 65 Overall sexual function (follow‐up values) Show forest plot | 5 | Std. Mean Difference (IV, Fixed, 95% CI) | Subtotals only | |
| 65.1 End of intervention | 5 | 411 | Std. Mean Difference (IV, Fixed, 95% CI) | 0.16 [‐0.04, 0.35] |
| 65.2 Follow‐up | 1 | 102 | Std. Mean Difference (IV, Fixed, 95% CI) | 0.19 [‐0.20, 0.58] |
| 66 Overall sexual function (change values) Show forest plot | 3 | Std. Mean Difference (IV, Random, 95% CI) | Subtotals only | |
| 66.1 End of intervention | 3 | 693 | Std. Mean Difference (IV, Random, 95% CI) | 0.22 [‐0.08, 0.52] |
| 66.2 Follow‐up | 0 | 0 | Std. Mean Difference (IV, Random, 95% CI) | 0.0 [0.0, 0.0] |
| 67 Body Esteem Scale ‐ sexual attractiveness (follow‐up values) Show forest plot | 2 | Mean Difference (IV, Fixed, 95% CI) | Subtotals only | |
| 67.1 End of intervention | 2 | 100 | Mean Difference (IV, Fixed, 95% CI) | 1.71 [‐1.41, 4.82] |
| 67.2 Follow‐up | 0 | 0 | Mean Difference (IV, Fixed, 95% CI) | 0.0 [0.0, 0.0] |
| 68 Overall sleep (follow‐up values) Show forest plot | 5 | Std. Mean Difference (IV, Fixed, 95% CI) | Subtotals only | |
| 68.1 End of intervention | 5 | 188 | Std. Mean Difference (IV, Fixed, 95% CI) | ‐0.09 [‐0.37, 0.20] |
| 68.2 Follow‐up | 1 | 31 | Std. Mean Difference (IV, Fixed, 95% CI) | ‐0.49 [‐1.20, 0.23] |
| 69 Overall sleep (change values) Show forest plot | 3 | Std. Mean Difference (IV, Random, 95% CI) | Subtotals only | |
| 69.1 End of intervention | 3 | 136 | Std. Mean Difference (IV, Random, 95% CI) | 0.14 [‐0.20, 0.48] |
| 69.2 Follow‐up | 0 | 0 | Std. Mean Difference (IV, Random, 95% CI) | 0.0 [0.0, 0.0] |
| 70 PSQI Global sleep score (follow‐up values) Show forest plot | 5 | Mean Difference (IV, Fixed, 95% CI) | Subtotals only | |
| 70.1 End of intervention | 5 | 317 | Mean Difference (IV, Fixed, 95% CI) | ‐0.47 [‐1.01, 0.08] |
| 70.2 Follow‐up | 1 | 31 | Mean Difference (IV, Fixed, 95% CI) | ‐1.5 [‐3.63, 0.63] |
| 71 PSQI Global sleep score (change values) Show forest plot | 2 | Mean Difference (IV, Fixed, 95% CI) | Subtotals only | |
| 71.1 End of intervention | 2 | 80 | Mean Difference (IV, Fixed, 95% CI) | 0.54 [‐1.11, 2.19] |
| 71.2 Follow‐up | 0 | 0 | Mean Difference (IV, Fixed, 95% CI) | 0.0 [0.0, 0.0] |
| 72 PSQI sleep quality (follow‐up values) Show forest plot | 2 | Mean Difference (IV, Random, 95% CI) | Subtotals only | |
| 72.1 End of intervention | 2 | 80 | Mean Difference (IV, Random, 95% CI) | ‐0.24 [‐0.81, 0.32] |
| 72.2 Follow‐up | 0 | 0 | Mean Difference (IV, Random, 95% CI) | 0.0 [0.0, 0.0] |
| 73 PSQI sleep efficiency (follow‐up values) Show forest plot | 3 | Mean Difference (IV, Fixed, 95% CI) | Subtotals only | |
| 73.1 End of intervention | 3 | 100 | Mean Difference (IV, Fixed, 95% CI) | 0.15 [‐0.24, 0.53] |
| 73.2 Follow‐up | 0 | 0 | Mean Difference (IV, Fixed, 95% CI) | 0.0 [0.0, 0.0] |
| 74 PSQI sleep latency (follow‐up values) Show forest plot | 3 | Mean Difference (IV, Fixed, 95% CI) | Subtotals only | |
| 74.1 End of intervention | 3 | 100 | Mean Difference (IV, Fixed, 95% CI) | 0.19 [‐0.16, 0.55] |
| 74.2 Follow‐up | 0 | 0 | Mean Difference (IV, Fixed, 95% CI) | 0.0 [0.0, 0.0] |
| 75 PSQI sleep duration (follow‐up values) Show forest plot | 2 | Mean Difference (IV, Fixed, 95% CI) | Subtotals only | |
| 75.1 End of intervention | 2 | 80 | Mean Difference (IV, Fixed, 95% CI) | 0.06 [‐0.28, 0.41] |
| 75.2 Follow‐up | 0 | 0 | Mean Difference (IV, Fixed, 95% CI) | 0.0 [0.0, 0.0] |
| 76 PSQI daytime dysfunction (follow‐up values) Show forest plot | 3 | Mean Difference (IV, Random, 95% CI) | Subtotals only | |
| 76.1 End of intervention | 3 | 100 | Mean Difference (IV, Random, 95% CI) | ‐0.08 [‐0.51, 0.35] |
| 76.2 Follow‐up | 0 | 0 | Mean Difference (IV, Random, 95% CI) | 0.0 [0.0, 0.0] |
| 77 PSQI medication use (follow‐up values) Show forest plot | 2 | Std. Mean Difference (IV, Random, 95% CI) | Subtotals only | |
| 77.1 End of intervention | 2 | 80 | Std. Mean Difference (IV, Random, 95% CI) | ‐0.06 [‐0.50, 0.38] |
| 77.2 Follow‐up | 0 | 0 | Std. Mean Difference (IV, Random, 95% CI) | 0.0 [0.0, 0.0] |
| 78 Accelerator‐derived sleep efficiency (follow‐up values) Show forest plot | 2 | Mean Difference (IV, Fixed, 95% CI) | Subtotals only | |
| 78.1 End of intervention | 2 | 62 | Mean Difference (IV, Fixed, 95% CI) | ‐2.25 [‐5.52, 1.01] |
| 78.2 Follow‐up | 0 | 0 | Mean Difference (IV, Fixed, 95% CI) | 0.0 [0.0, 0.0] |
| 79 Accelerator‐derived sleep latency (follow‐up values) Show forest plot | 2 | Mean Difference (IV, Fixed, 95% CI) | Subtotals only | |
| 79.1 End of intervention | 2 | 62 | Mean Difference (IV, Fixed, 95% CI) | ‐2.04 [‐4.78, 0.69] |
| 79.2 Follow‐up | 0 | 0 | Mean Difference (IV, Fixed, 95% CI) | 0.0 [0.0, 0.0] |
| Outcome or subgroup title | No. of studies | No. of participants | Statistical method | Effect size |
| 1 Overall anxiety (follow‐up values) Show forest plot | 7 | Std. Mean Difference (IV, Random, 95% CI) | Subtotals only | |
| 1.1 End of intervention | 7 | 326 | Std. Mean Difference (IV, Random, 95% CI) | ‐0.57 [‐0.95, ‐0.19] |
| 1.2 Follow‐up | 1 | 61 | Std. Mean Difference (IV, Random, 95% CI) | ‐0.47 [‐0.98, 0.04] |
| 2 Overall anxiety (change values) Show forest plot | 4 | Std. Mean Difference (IV, Fixed, 95% CI) | Subtotals only | |
| 2.1 End of intervention | 4 | 235 | Std. Mean Difference (IV, Fixed, 95% CI) | ‐0.37 [‐0.63, ‐0.12] |
| 2.2 Follow‐up | 1 | 61 | Std. Mean Difference (IV, Fixed, 95% CI) | ‐0.30 [‐0.81, 0.20] |
| 3 POMS tension ‐ anxiety (follow‐up values) Show forest plot | 2 | Std. Mean Difference (IV, Fixed, 95% CI) | Subtotals only | |
| 3.1 End of intervention | 2 | 79 | Std. Mean Difference (IV, Fixed, 95% CI) | ‐0.66 [‐1.12, ‐0.20] |
| 3.2 Follow‐up | 1 | 61 | Std. Mean Difference (IV, Fixed, 95% CI) | ‐0.47 [‐0.98, 0.04] |
| 4 State Trait Anxiety Inventory (follow‐up values) Show forest plot | 2 | Std. Mean Difference (IV, Random, 95% CI) | Subtotals only | |
| 4.1 End of intervention | 2 | 89 | Std. Mean Difference (IV, Random, 95% CI) | ‐1.20 [‐3.49, 1.09] |
| 4.2 Follow‐up | 0 | 0 | Std. Mean Difference (IV, Random, 95% CI) | 0.0 [0.0, 0.0] |
| 5 Cohen's Perceived Stress Scale Show forest plot | 2 | Mean Difference (IV, Fixed, 95% CI) | Subtotals only | |
| 5.1 End of intervention | 2 | 105 | Mean Difference (IV, Fixed, 95% CI) | ‐1.25 [‐3.99, 1.50] |
| 5.2 Follow‐up | 0 | 0 | Mean Difference (IV, Fixed, 95% CI) | 0.0 [0.0, 0.0] |
| Outcome or subgroup title | No. of studies | No. of participants | Statistical method | Effect size |
| 1 Overall depression (follow‐up values) Show forest plot | 12 | Std. Mean Difference (IV, Random, 95% CI) | Subtotals only | |
| 1.1 End of intervention | 12 | 657 | Std. Mean Difference (IV, Random, 95% CI) | ‐0.34 [‐0.62, ‐0.05] |
| 1.2 Follow‐up | 4 | 340 | Std. Mean Difference (IV, Random, 95% CI) | ‐0.28 [‐0.51, ‐0.05] |
| 2 Overall depression (change values) Show forest plot | 7 | Std. Mean Difference (IV, Random, 95% CI) | Subtotals only | |
| 2.1 End of intervention | 7 | 816 | Std. Mean Difference (IV, Random, 95% CI) | ‐0.34 [‐0.63, ‐0.05] |
| 2.2 Follow‐up | 1 | 61 | Std. Mean Difference (IV, Random, 95% CI) | ‐0.46 [‐0.97, 0.05] |
| 3 Beck Depression Inventory‐II (follow‐up values) Show forest plot | 5 | Mean Difference (IV, Random, 95% CI) | Subtotals only | |
| 3.1 End of intervention | 5 | 198 | Mean Difference (IV, Random, 95% CI) | ‐3.25 [‐5.94, ‐0.56] |
| 3.2 Follow‐up | 2 | 93 | Mean Difference (IV, Random, 95% CI) | ‐2.35 [‐5.31, 0.60] |
| 4 Beck Depression Inventory‐II (change values) Show forest plot | 3 | Mean Difference (IV, Random, 95% CI) | Subtotals only | |
| 4.1 End of intervention | 3 | 581 | Mean Difference (IV, Random, 95% CI) | ‐1.84 [‐5.33, 1.65] |
| 4.2 Follow‐up | 0 | 0 | Mean Difference (IV, Random, 95% CI) | 0.0 [0.0, 0.0] |
| 5 CES‐Depression scale (follow‐up values) Show forest plot | 3 | Mean Difference (IV, Fixed, 95% CI) | Subtotals only | |
| 5.1 End of intervention | 3 | 280 | Mean Difference (IV, Fixed, 95% CI) | ‐1.36 [‐3.39, 0.67] |
| 5.2 Follow‐up | 1 | 186 | Mean Difference (IV, Fixed, 95% CI) | ‐1.90 [‐4.32, 0.52] |
| 6 POMS depression subscale (follow‐up values) Show forest plot | 2 | Mean Difference (IV, Random, 95% CI) | Subtotals only | |
| 6.1 End of intervention | 2 | 79 | Mean Difference (IV, Random, 95% CI) | ‐6.39 [‐10.66, ‐2.12] |
| 6.2 Follow‐up | 1 | 61 | Mean Difference (IV, Random, 95% CI) | ‐6.65 [‐11.97, ‐1.33] |
| 7 POMS tension subscale (follow‐up values) Show forest plot | 2 | Mean Difference (IV, Random, 95% CI) | Subtotals only | |
| 7.1 End of intervention | 2 | 79 | Mean Difference (IV, Random, 95% CI) | ‐5.14 [‐9.55, ‐0.73] |
| 7.2 Follow‐up | 1 | 61 | Mean Difference (IV, Random, 95% CI) | ‐4.87 [‐10.09, 0.35] |
| Outcome or subgroup title | No. of studies | No. of participants | Statistical method | Effect size |
| 1 Overall fatigue (follow‐up values) Show forest plot | 26 | Std. Mean Difference (IV, Random, 95% CI) | Subtotals only | |
| 1.1 End of intervention | 26 | 2020 | Std. Mean Difference (IV, Random, 95% CI) | ‐0.32 [‐0.47, ‐0.18] |
| 1.2 Follow‐up | 7 | 536 | Std. Mean Difference (IV, Random, 95% CI) | ‐0.43 [‐0.60, ‐0.26] |
| 2 Overall fatigue (change values) Show forest plot | 13 | Std. Mean Difference (IV, Random, 95% CI) | Subtotals only | |
| 2.1 End of intervention | 13 | 1289 | Std. Mean Difference (IV, Random, 95% CI) | ‐0.30 [‐0.61, 0.00] |
| 2.2 Follow‐up | 4 | 178 | Std. Mean Difference (IV, Random, 95% CI) | ‐0.47 [‐0.84, ‐0.11] |
| 3 FACT‐Fatigue (follow‐up values) Show forest plot | 7 | Mean Difference (IV, Fixed, 95% CI) | Subtotals only | |
| 3.1 End of intervention | 7 | 952 | Mean Difference (IV, Fixed, 95% CI) | 1.14 [‐0.06, 2.35] |
| 3.2 Follow‐up | 2 | 112 | Mean Difference (IV, Fixed, 95% CI) | 1.49 [‐1.95, 4.93] |
| 4 FACT‐Fatigue (change values) Show forest plot | 4 | Mean Difference (IV, Random, 95% CI) | Subtotals only | |
| 4.1 End of intervention | 4 | 925 | Mean Difference (IV, Random, 95% CI) | ‐0.54 [‐3.23, 2.14] |
| 4.2 Follow‐up | 1 | 36 | Mean Difference (IV, Random, 95% CI) | 1.28 [‐4.11, 6.67] |
| 5 EORTC QLQ‐C30 Fatigue scale (follow‐up values) Show forest plot | 2 | Mean Difference (IV, Fixed, 95% CI) | Subtotals only | |
| 5.1 End of intervention | 2 | 119 | Mean Difference (IV, Fixed, 95% CI) | ‐6.83 [‐13.08, ‐0.58] |
| 5.2 Follow‐up | 0 | 0 | Mean Difference (IV, Fixed, 95% CI) | 0.0 [0.0, 0.0] |
| 6 EORTC QLQ‐C30 Fatigue scale (change values) Show forest plot | 2 | Mean Difference (IV, Random, 95% CI) | Subtotals only | |
| 6.1 End of intervention | 2 | 73 | Mean Difference (IV, Random, 95% CI) | ‐2.81 [‐14.98, 9.36] |
| 6.2 Follow‐up | 0 | 0 | Mean Difference (IV, Random, 95% CI) | 0.0 [0.0, 0.0] |
| 7 Multidimensional Fatigue Symptom Inventory (follow‐up values) Show forest plot | 5 | Mean Difference (IV, Random, 95% CI) | Subtotals only | |
| 7.1 End of intervention | 5 | 366 | Mean Difference (IV, Random, 95% CI) | ‐0.53 [‐1.35, 0.29] |
| 7.2 Follow‐up | 3 | 304 | Mean Difference (IV, Random, 95% CI) | ‐2.04 [‐4.30, 0.23] |
| 8 Multidimensional Fatigue Symptom Inventory ‐ interference (follow‐up values) Show forest plot | 2 | Mean Difference (IV, Random, 95% CI) | Subtotals only | |
| 8.1 End of intervention | 2 | 62 | Mean Difference (IV, Random, 95% CI) | ‐0.37 [‐1.34, 0.60] |
| 8.2 Follow‐up | 0 | 0 | Mean Difference (IV, Random, 95% CI) | 0.0 [0.0, 0.0] |
| 9 Revised Piper Fatigue Scale total fatigue (follow‐up values) Show forest plot | 4 | Mean Difference (IV, Random, 95% CI) | Subtotals only | |
| 9.1 End of intervention | 4 | 187 | Mean Difference (IV, Random, 95% CI) | ‐1.18 [‐2.38, 0.02] |
| 9.2 Follow‐up | 2 | 120 | Mean Difference (IV, Random, 95% CI) | ‐1.15 [‐1.86, ‐0.43] |
| 10 Revised Piper Fatigue Scale total fatigue (change values) Show forest plot | 4 | Mean Difference (IV, Random, 95% CI) | Subtotals only | |
| 10.1 End of intervention | 4 | 166 | Mean Difference (IV, Random, 95% CI) | ‐1.96 [‐2.93, 1.00] |
| 10.2 Follow‐up | 2 | 120 | Mean Difference (IV, Random, 95% CI) | ‐1.14 [‐1.78, ‐0.49] |
| 11 Revised Piper Fatigue Scale behavioural/severity (follow‐up values) Show forest plot | 3 | Mean Difference (IV, Random, 95% CI) | Subtotals only | |
| 11.1 End of intervention | 3 | 121 | Mean Difference (IV, Random, 95% CI) | ‐1.24 [‐2.49, 0.01] |
| 11.2 Follow‐up | 1 | 61 | Mean Difference (IV, Random, 95% CI) | ‐1.41 [‐2.57, ‐0.25] |
| 12 Revised Piper Fatigue Scale affective/meaning (follow‐up values) Show forest plot | 3 | Mean Difference (IV, Fixed, 95% CI) | Subtotals only | |
| 12.1 End of intervention | 3 | 121 | Mean Difference (IV, Fixed, 95% CI) | ‐2.11 [‐3.03, ‐1.20] |
| 12.2 Follow‐up | 1 | 61 | Mean Difference (IV, Fixed, 95% CI) | ‐2.05 [‐3.21, ‐0.89] |
| 13 Revised Piper Fatigue Scale sensory (follow‐up values) Show forest plot | 3 | Mean Difference (IV, Random, 95% CI) | Subtotals only | |
| 13.1 End of intervention | 3 | 121 | Mean Difference (IV, Random, 95% CI) | ‐0.44 [‐3.11, 2.22] |
| 13.2 Follow‐up | 1 | 61 | Mean Difference (IV, Random, 95% CI) | ‐1.60 [‐2.65, ‐0.55] |
| 14 Revised Piper Fatigue Scale cognitive/mood (follow‐up values) Show forest plot | 3 | Mean Difference (IV, Random, 95% CI) | Subtotals only | |
| 14.1 End of intervention | 3 | 121 | Mean Difference (IV, Random, 95% CI) | ‐0.72 [‐2.31, 0.87] |
| 14.2 Follow‐up | 1 | 61 | Mean Difference (IV, Random, 95% CI) | ‐1.40 [‐2.50, ‐0.30] |
| 15 Schwartz Cancer Fatigue Scale (follow‐up values) Show forest plot | 2 | Mean Difference (IV, Random, 95% CI) | Subtotals only | |
| 15.1 End of intervention | 2 | 125 | Mean Difference (IV, Random, 95% CI) | ‐2.01 [‐9.25, 5.23] |
| 15.2 Follow‐up | 0 | 0 | Mean Difference (IV, Random, 95% CI) | 0.0 [0.0, 0.0] |
| 16 POMS fatigue scale (follow‐up values) Show forest plot | 2 | Std. Mean Difference (IV, Fixed, 95% CI) | Subtotals only | |
| 16.1 End of intervention | 2 | 79 | Std. Mean Difference (IV, Fixed, 95% CI) | ‐0.54 [1.00, ‐0.08] |
| 16.2 Follow‐up | 1 | 61 | Std. Mean Difference (IV, Fixed, 95% CI) | ‐0.57 [‐1.08, ‐0.05] |
| 17 Visual analogue scale fatigue (follow‐up and change values) Show forest plot | 4 | Std. Mean Difference (IV, Fixed, 95% CI) | Subtotals only | |
| 17.1 End of intervention | 4 | 148 | Std. Mean Difference (IV, Fixed, 95% CI) | ‐0.51 [‐0.88, ‐0.14] |
| 17.2 Follow‐up | 1 | 22 | Std. Mean Difference (IV, Fixed, 95% CI) | 0.0 [0.0, 0.0] |
| 18 Overall vigour/vitality (follow‐up values) Show forest plot | 10 | Std. Mean Difference (IV, Random, 95% CI) | Subtotals only | |
| 18.1 End of intervention | 10 | 762 | Std. Mean Difference (IV, Random, 95% CI) | 0.36 [0.21, 0.50] |
| 18.2 Follow‐up | 4 | 454 | Std. Mean Difference (IV, Random, 95% CI) | 0.26 [0.04, 0.48] |
| 19 Overall vigour/vitality (change values) Show forest plot | 6 | Std. Mean Difference (IV, Random, 95% CI) | Subtotals only | |
| 19.1 End of intervention | 6 | 359 | Std. Mean Difference (IV, Random, 95% CI) | 0.23 [0.00, 0.45] |
| 19.2 Follow‐up | 2 | 233 | Std. Mean Difference (IV, Random, 95% CI) | 0.20 [‐0.06, 0.46] |
| 20 MOS SF vitality (follow‐up values) Show forest plot | 6 | Mean Difference (IV, Fixed, 95% CI) | Subtotals only | |
| 20.1 End of intervention | 6 | 514 | Mean Difference (IV, Fixed, 95% CI) | 3.08 [0.84, 5.31] |
| 20.2 Follow‐up | 2 | 306 | Mean Difference (IV, Fixed, 95% CI) | 5.09 [0.99, 9.19] |
| 21 MOS SF vitality (change values) Show forest plot | 4 | Mean Difference (IV, Fixed, 95% CI) | Subtotals only | |
| 21.1 End of intervention | 4 | 212 | Mean Difference (IV, Fixed, 95% CI) | 1.36 [‐0.52, 3.25] |
| 21.2 Follow‐up | 0 | 0 | Mean Difference (IV, Fixed, 95% CI) | 0.0 [0.0, 0.0] |
| 22 POMS vigour scale (follow‐up values) Show forest plot | 4 | Std. Mean Difference (IV, Random, 95% CI) | Subtotals only | |
| 22.1 End of intervention | 4 | 248 | Std. Mean Difference (IV, Random, 95% CI) | 0.46 [0.13, 0.79] |
| 22.2 Follow‐up | 2 | 148 | Std. Mean Difference (IV, Random, 95% CI) | 0.21 [‐0.34, 0.77] |
| 23 POMS vigour scale (change values) Show forest plot | 2 | Std. Mean Difference (IV, Random, 95% CI) | Subtotals only | |
| 23.1 End of intervention | 2 | 147 | Std. Mean Difference (IV, Random, 95% CI) | 0.25 [‐0.45, 0.95] |
| 23.2 Follow‐up | 2 | 233 | Std. Mean Difference (IV, Random, 95% CI) | 0.20 [‐0.06, 0.46] |
| Outcome or subgroup title | No. of studies | No. of participants | Statistical method | Effect size |
| 1 Overall pain/disability (follow‐up values) Show forest plot | 9 | Std. Mean Difference (IV, Random, 95% CI) | Subtotals only | |
| 1.1 End of intervention | 9 | 535 | Std. Mean Difference (IV, Random, 95% CI) | 0.08 [‐0.09, 0.25] |
| 1.2 Follow‐up | 1 | 162 | Std. Mean Difference (IV, Random, 95% CI) | 0.19 [‐0.12, 0.50] |
| 2 Overall pain/disability (change values) Show forest plot | 6 | Std. Mean Difference (IV, Random, 95% CI) | Subtotals only | |
| 2.1 End of intervention | 5 | 296 | Std. Mean Difference (IV, Random, 95% CI) | ‐0.08 [‐0.33, 0.16] |
| 2.2 Follow‐up | 1 | 36 | Std. Mean Difference (IV, Random, 95% CI) | 0.22 [‐0.43, 0.88] |
| 3 Brief Pain Inventory severity score (change values) Show forest plot | 2 | Mean Difference (IV, Random, 95% CI) | Subtotals only | |
| 3.1 End of intervention | 2 | 145 | Mean Difference (IV, Random, 95% CI) | ‐0.84 [‐1.92, 0.23] |
| 3.2 Follow‐up | 0 | 0 | Mean Difference (IV, Random, 95% CI) | 0.0 [0.0, 0.0] |
| 4 Brief Pain Inventory interference score (change values) Show forest plot | 2 | Mean Difference (IV, Random, 95% CI) | Subtotals only | |
| 4.1 End of intervention | 2 | 145 | Mean Difference (IV, Random, 95% CI) | ‐1.08 [‐1.91, ‐0.24] |
| 4.2 Follow‐up | 0 | 0 | Mean Difference (IV, Random, 95% CI) | 0.0 [0.0, 0.0] |
| 5 DASH (follow‐up and change values) Show forest plot | 3 | Mean Difference (IV, Fixed, 95% CI) | Subtotals only | |
| 5.1 End of intervention | 3 | 179 | Mean Difference (IV, Fixed, 95% CI) | ‐4.00 [‐9.08, ‐2.91] |
| 5.2 Follow‐up | 0 | 0 | Mean Difference (IV, Fixed, 95% CI) | 0.0 [0.0, 0.0] |
| 6 EORTC QLQ‐C30 Pain scale (follow‐up and change values) Show forest plot | 2 | Mean Difference (IV, Fixed, 95% CI) | Subtotals only | |
| 6.1 End of intervention | 2 | 119 | Mean Difference (IV, Fixed, 95% CI) | ‐1.04 [‐9.83, 7.75] |
| 6.2 Follow‐up | 0 | 0 | Mean Difference (IV, Fixed, 95% CI) | 0.0 [0.0, 0.0] |
| 7 MOS SF Pain (follow‐up values) Show forest plot | 5 | Mean Difference (IV, Random, 95% CI) | Subtotals only | |
| 7.1 End of intervention | 5 | 378 | Mean Difference (IV, Random, 95% CI) | 1.25 [‐1.40, 3.90] |
| 7.2 Follow‐up | 1 | 162 | Mean Difference (IV, Random, 95% CI) | 4.45 [‐2.80, 11.70] |
| 8 MOS SF Pain (change values) Show forest plot | 4 | Mean Difference (IV, Fixed, 95% CI) | Subtotals only | |
| 8.1 End of intervention | 4 | 213 | Mean Difference (IV, Fixed, 95% CI) | 0.07 [‐1.04, 1.17] |
| 8.2 Follow‐up | 0 | 0 | Mean Difference (IV, Fixed, 95% CI) | 0.0 [0.0, 0.0] |
| 9 WOMAC joint pain (follow‐up and change values) Show forest plot | 2 | Mean Difference (IV, Random, 95% CI) | Subtotals only | |
| 9.1 End of intervention | 2 | 121 | Mean Difference (IV, Random, 95% CI) | ‐2.36 [‐7.55, 2.82] |
| 9.2 Follow‐up | 0 | 0 | Mean Difference (IV, Random, 95% CI) | 0.0 [0.0, 0.0] |
| 10 WOMAC physical dysfunction (follow‐up and change values) Show forest plot | 2 | Mean Difference (IV, Random, 95% CI) | Subtotals only | |
| 10.1 End of intervention | 2 | 121 | Mean Difference (IV, Random, 95% CI) | ‐6.15 [‐16.21, 3.92] |
| 10.2 Follow‐up | 0 | 0 | Mean Difference (IV, Random, 95% CI) | 0.0 [0.0, 0.0] |
| 11 WOMAC total score (follow‐up and change values) Show forest plot | 2 | Mean Difference (IV, Random, 95% CI) | Subtotals only | |
| 11.1 End of intervention | 2 | 121 | Mean Difference (IV, Random, 95% CI) | ‐6.49 [‐13.57, 0.58] |
| 11.2 Follow‐up | 0 | 0 | Mean Difference (IV, Random, 95% CI) | 0.0 [0.0, 0.0] |
| Outcome or subgroup title | No. of studies | No. of participants | Statistical method | Effect size |
| 1 Overall self‐esteem/body image (follow‐up values) Show forest plot | 12 | Std. Mean Difference (IV, Random, 95% CI) | Subtotals only | |
| 1.1 End of intervention | 12 | 667 | Std. Mean Difference (IV, Random, 95% CI) | 0.27 [0.05, 0.48] |
| 1.2 Follow‐up | 1 | 61 | Std. Mean Difference (IV, Random, 95% CI) | 0.57 [0.05, 1.08] |
| 2 Overall self‐esteem/body image (change values) Show forest plot | 9 | Std. Mean Difference (IV, Random, 95% CI) | Subtotals only | |
| 2.1 End of intervention | 9 | 992 | Std. Mean Difference (IV, Random, 95% CI) | 0.23 [‐0.11, 0.58] |
| 2.2 Follow‐up | 1 | 62 | Std. Mean Difference (IV, Random, 95% CI) | 0.46 [‐0.05, 0.96] |
| 3 Body Esteem Scale ‐ weight concern (follow‐up values) Show forest plot | 2 | Mean Difference (IV, Random, 95% CI) | Subtotals only | |
| 3.1 End of intervention | 2 | 100 | Mean Difference (IV, Random, 95% CI) | 4.22 [‐1.01, 9.45] |
| 3.2 Follow‐up | 0 | 0 | Mean Difference (IV, Random, 95% CI) | 0.0 [0.0, 0.0] |
| 4 Physical self‐perception profile ‐ attractiveness of body (follow‐up values) Show forest plot | 2 | Mean Difference (IV, Fixed, 95% CI) | Subtotals only | |
| 4.1 End of intervention | 2 | 107 | Mean Difference (IV, Fixed, 95% CI) | 0.46 [0.13, 0.79] |
| 4.2 Follow‐up | 1 | 61 | Mean Difference (IV, Fixed, 95% CI) | 0.29 [0.04, 0.54] |
| 5 Physical self‐perception profile ‐ attractiveness of body (change values) Show forest plot | 2 | Mean Difference (IV, Fixed, 95% CI) | Subtotals only | |
| 5.1 End of intervention | 2 | 108 | Mean Difference (IV, Fixed, 95% CI) | 0.26 [‐0.07, 0.59] |
| 5.2 Follow‐up | 1 | 62 | Mean Difference (IV, Fixed, 95% CI) | 0.26 [‐0.02, 0.54] |
| 6 Rosenberg Self‐Esteem Scale (follow‐up values) Show forest plot | 4 | Mean Difference (IV, Random, 95% CI) | Subtotals only | |
| 6.1 End of intervention | 4 | 183 | Mean Difference (IV, Random, 95% CI) | 0.24 [‐1.79, 2.26] |
| 6.2 Follow‐up | 0 | 0 | Mean Difference (IV, Random, 95% CI) | 0.0 [0.0, 0.0] |
| 7 Rosenberg Self‐Esteem Scale (change values) Show forest plot | 4 | Mean Difference (IV, Fixed, 95% CI) | Subtotals only | |
| 7.1 End of intervention | 4 | 189 | Mean Difference (IV, Fixed, 95% CI) | 2.78 [1.98, 3.58] |
| 7.2 Follow‐up | 0 | 0 | Mean Difference (IV, Fixed, 95% CI) | 0.0 [0.0, 0.0] |
| 8 EORTC QLQ‐C30 Body image (follow‐up and change values) Show forest plot | 2 | Mean Difference (IV, Fixed, 95% CI) | Subtotals only | |
| 8.1 End of intervention | 2 | 562 | Mean Difference (IV, Fixed, 95% CI) | ‐0.85 [‐4.38, 2.68] |
| 8.2 Follow‐up | 0 | 0 | Mean Difference (IV, Fixed, 95% CI) | 0.0 [0.0, 0.0] |
| Outcome or subgroup title | No. of studies | No. of participants | Statistical method | Effect size |
| 1 Overall cardiorespiratory fitness (follow‐up values) Show forest plot | 23 | Std. Mean Difference (IV, Random, 95% CI) | Subtotals only | |
| 1.1 End of intervention | 23 | 1265 | Std. Mean Difference (IV, Random, 95% CI) | 0.44 [0.30, 0.58] |
| 1.2 Follow‐up | 3 | 362 | Std. Mean Difference (IV, Random, 95% CI) | 0.36 [0.03, 0.69] |
| 2 Overall cardiorespiratory fitness (change values) Show forest plot | 10 | Std. Mean Difference (IV, Random, 95% CI) | Subtotals only | |
| 2.1 End of intervention | 9 | 863 | Std. Mean Difference (IV, Random, 95% CI) | 0.83 [0.40, 1.27] |
| 2.2 Follow‐up | 2 | 115 | Std. Mean Difference (IV, Random, 95% CI) | 0.42 [0.05, 0.79] |
| 3 Directly assessed VO₂max/peak (follow‐up values) Show forest plot | 4 | Mean Difference (IV, Fixed, 95% CI) | Subtotals only | |
| 3.1 End of intervention | 4 | 199 | Mean Difference (IV, Fixed, 95% CI) | 1.89 [0.65, 3.13] |
| 3.2 Follow‐up | 0 | 0 | Mean Difference (IV, Fixed, 95% CI) | 0.0 [0.0, 0.0] |
| 4 Directly assessed VO₂max/peak (change values) Show forest plot | 3 | Std. Mean Difference (IV, Random, 95% CI) | Subtotals only | |
| 4.1 End of intervention | 3 | 166 | Std. Mean Difference (IV, Random, 95% CI) | 1.31 [0.66, 1.96] |
| 4.2 Follow‐up | 0 | 0 | Std. Mean Difference (IV, Random, 95% CI) | 0.0 [0.0, 0.0] |
| 5 Directly assessed VO₂max/peak ‐ treadmill (follow‐up and change values) Show forest plot | 2 | Std. Mean Difference (IV, Random, 95% CI) | Subtotals only | |
| 5.1 End of intervention | 2 | 116 | Std. Mean Difference (IV, Random, 95% CI) | 1.04 [‐0.49, 2.58] |
| 5.2 Follow‐up | 0 | 0 | Std. Mean Difference (IV, Random, 95% CI) | 0.0 [0.0, 0.0] |
| 6 Directly assessed VO₂max/peak ‐ cycle ergometer (follow‐up values) Show forest plot | 3 | Mean Difference (IV, Random, 95% CI) | Subtotals only | |
| 6.1 End of intervention | 3 | 116 | Mean Difference (IV, Random, 95% CI) | 1.99 [0.39, 3.59] |
| 6.2 Follow‐up | 0 | 0 | Mean Difference (IV, Random, 95% CI) | 0.0 [0.0, 0.0] |
| 7 Peak Power Output ‐ cycle ergometer test (follow‐up values) Show forest plot | 2 | Mean Difference (IV, Fixed, 95% CI) | Subtotals only | |
| 7.1 End of intervention | 2 | 66 | Mean Difference (IV, Fixed, 95% CI) | 18.92 [9.64, 28.20] |
| 7.2 Follow‐up | 0 | 0 | Mean Difference (IV, Fixed, 95% CI) | 0.0 [0.0, 0.0] |
| 8 Peak Respiratory Exchange Ratio ‐ cycle ergometer test (follow‐up values) Show forest plot | 2 | Mean Difference (IV, Fixed, 95% CI) | Subtotals only | |
| 8.1 End of intervention | 2 | 66 | Mean Difference (IV, Fixed, 95% CI) | ‐0.01 [‐0.04, 0.03] |
| 8.2 Follow‐up | 0 | 0 | Mean Difference (IV, Fixed, 95% CI) | 0.0 [0.0, 0.0] |
| 9 Peak Heart Rate ‐ cycle ergometer test (follow‐up values) Show forest plot | 2 | Mean Difference (IV, Fixed, 95% CI) | Subtotals only | |
| 9.1 End of intervention | 2 | 66 | Mean Difference (IV, Fixed, 95% CI) | 2.02 [‐5.65, 9.68] |
| 9.2 Follow‐up | 0 | 0 | Mean Difference (IV, Fixed, 95% CI) | 0.0 [0.0, 0.0] |
| 10 Ebbeling single‐stage treadmill test (follow‐up and change values) Show forest plot | 2 | Mean Difference (IV, Random, 95% CI) | Subtotals only | |
| 10.1 End of intervention | 2 | 189 | Mean Difference (IV, Random, 95% CI) | 1.30 [‐0.16, 2.75] |
| 10.2 Follow‐up | 2 | 149 | Mean Difference (IV, Random, 95% CI) | 1.77 [‐1.23, 4.77] |
| 11 Modified Bruce treadmill test (follow‐up and change values) Show forest plot | 3 | Mean Difference (IV, Random, 95% CI) | Subtotals only | |
| 11.1 End of intervention | 3 | 92 | Mean Difference (IV, Random, 95% CI) | 3.57 [0.95, 6.19] |
| 11.2 Follow‐up | 0 | 0 | Mean Difference (IV, Random, 95% CI) | 0.0 [0.0, 0.0] |
| 12 Naughton submaximal treadmill test (follow‐up and change values) Show forest plot | 4 | Mean Difference (IV, Random, 95% CI) | Subtotals only | |
| 12.1 End of intervention | 4 | 315 | Mean Difference (IV, Random, 95% CI) | 2.02 [‐0.33, 4.37] |
| 12.2 Follow‐up | 2 | 249 | Mean Difference (IV, Random, 95% CI) | 1.91 [0.57, 3.26] |
| 13 Cardiorespiratory fitness walk tests (follow‐up values) Show forest plot | 7 | Std. Mean Difference (IV, Random, 95% CI) | Subtotals only | |
| 13.1 End of intervention | 7 | 314 | Std. Mean Difference (IV, Random, 95% CI) | 0.62 [0.33, 0.91] |
| 13.2 Follow‐up | 0 | 0 | Std. Mean Difference (IV, Random, 95% CI) | 0.0 [0.0, 0.0] |
| 14 Cardiorespiratory fitness walk tests (change values) Show forest plot | 3 | Std. Mean Difference (IV, Random, 95% CI) | Subtotals only | |
| 14.1 End of intervention | 3 | 592 | Std. Mean Difference (IV, Random, 95% CI) | 0.72 [‐0.05, 1.49] |
| 14.2 Follow‐up | 1 | 79 | Std. Mean Difference (IV, Random, 95% CI) | 0.54 [0.09, 0.99] |
| 15 6‐Minute walk test (follow‐up and change values) Show forest plot | 5 | Mean Difference (IV, Random, 95% CI) | Subtotals only | |
| 15.1 End of intervention | 5 | 159 | Mean Difference (IV, Random, 95% CI) | 54.74 [33.25, 76.22] |
| 15.2 Follow‐up | 0 | 0 | Mean Difference (IV, Random, 95% CI) | 0.0 [0.0, 0.0] |
| 16 12‐Minute walk test (follow‐up values) Show forest plot | 2 | Mean Difference (IV, Random, 95% CI) | Subtotals only | |
| 16.1 End of intervention | 2 | 96 | Mean Difference (IV, Random, 95% CI) | 94.56 [‐24.25, 213.37] |
| 16.2 Follow‐up | 0 | 0 | Mean Difference (IV, Random, 95% CI) | 0.0 [0.0, 0.0] |
| 17 2‐Kilometer walk test (follow‐up and change values) Show forest plot | 2 | Mean Difference (IV, Random, 95% CI) | Subtotals only | |
| 17.1 End of intervention | 2 | 526 | Mean Difference (IV, Random, 95% CI) | ‐0.11 [‐0.46, 0.25] |
| 17.2 Follow‐up | 0 | 0 | Mean Difference (IV, Random, 95% CI) | 0.0 [0.0, 0.0] |
| 18 Resting Heart Rate (follow‐up values) Show forest plot | 2 | Mean Difference (IV, Fixed, 95% CI) | Subtotals only | |
| 18.1 End of intervention | 2 | 82 | Mean Difference (IV, Fixed, 95% CI) | ‐4.47 [‐7.94, ‐1.00] |
| 18.2 Follow‐up | 0 | 0 | Mean Difference (IV, Fixed, 95% CI) | 0.0 [0.0, 0.0] |
| 19 Resting Heart Rate (change values) Show forest plot | 2 | Std. Mean Difference (IV, Random, 95% CI) | Subtotals only | |
| 19.1 End of intervention | 2 | 86 | Std. Mean Difference (IV, Random, 95% CI) | ‐1.05 [‐2.22, 0.11] |
| 19.2 Follow‐up | 0 | 0 | Std. Mean Difference (IV, Random, 95% CI) | 0.0 [0.0, 0.0] |
| 20 Resting Systolic Blood Pressure (follow‐up values) Show forest plot | 4 | Mean Difference (IV, Random, 95% CI) | Subtotals only | |
| 20.1 End of intervention | 4 | 134 | Mean Difference (IV, Random, 95% CI) | ‐0.83 [‐3.72, 2.05] |
| 20.2 Follow‐up | 1 | 26 | Mean Difference (IV, Random, 95% CI) | 5.20 [‐5.35, 15.75] |
| 21 Resting Systolic Blood Pressure (change values) Show forest plot | 3 | Mean Difference (IV, Random, 95% CI) | Subtotals only | |
| 21.1 End of intervention | 3 | 143 | Mean Difference (IV, Random, 95% CI) | ‐1.12 [‐7.74, 5.50] |
| 21.2 Follow‐up | 1 | 26 | Mean Difference (IV, Random, 95% CI) | ‐2.70 [‐5.94, 0.54] |
| 22 Resting Diastolic Blood Pressure (follow‐up values) Show forest plot | 3 | Mean Difference (IV, Random, 95% CI) | Subtotals only | |
| 22.1 End of intervention | 3 | 106 | Mean Difference (IV, Random, 95% CI) | 0.66 [‐2.89, 4.21] |
| 22.2 Follow‐up | 1 | 26 | Mean Difference (IV, Random, 95% CI) | 2.10 [‐3.78, 7.98] |
| 23 Resting Diastolic Blood Pressure (change values) Show forest plot | 3 | 170 | Mean Difference (IV, Random, 95% CI) | ‐0.04 [‐1.82, 1.73] |
| 23.1 End of intervention | 3 | 144 | Mean Difference (IV, Random, 95% CI) | 0.53 [‐1.61, 2.68] |
| 23.2 Follow‐up | 1 | 26 | Mean Difference (IV, Random, 95% CI) | ‐1.30 [‐3.85, 1.25] |
| Outcome or subgroup title | No. of studies | No. of participants | Statistical method | Effect size |
| 1 Overall self‐reported physical activity (follow‐up values) Show forest plot | 17 | Std. Mean Difference (IV, Random, 95% CI) | Subtotals only | |
| 1.1 End of intervention | 17 | 2012 | Std. Mean Difference (IV, Random, 95% CI) | 0.52 [0.33, 0.71] |
| 1.2 Follow‐up | 4 | 683 | Std. Mean Difference (IV, Random, 95% CI) | 0.44 [0.17, 0.72] |
| 2 Overall self‐reported physical activity (change values) Show forest plot | 9 | Std. Mean Difference (IV, Random, 95% CI) | Subtotals only | |
| 2.1 End of intervention | 8 | 1274 | Std. Mean Difference (IV, Random, 95% CI) | 0.57 [0.25, 0.90] |
| 2.2 Follow‐up | 4 | 521 | Std. Mean Difference (IV, Random, 95% CI) | 0.51 [0.08, 0.93] |
| 3 Self‐reported total physical activity (follow‐up values) Show forest plot | 9 | Std. Mean Difference (IV, Random, 95% CI) | Subtotals only | |
| 3.1 End of intervention | 9 | 881 | Std. Mean Difference (IV, Random, 95% CI) | 0.57 [0.28, 0.86] |
| 3.2 Follow‐up | 1 | 26 | Std. Mean Difference (IV, Random, 95% CI) | 0.37 [‐0.43, 1.16] |
| 4 Self‐reported total physical activity (change values) Show forest plot | 5 | Std. Mean Difference (IV, Random, 95% CI) | Subtotals only | |
| 4.1 End of intervention | 5 | 332 | Std. Mean Difference (IV, Random, 95% CI) | 0.80 [0.30, 1.31] |
| 4.2 Follow‐up | 2 | 108 | Std. Mean Difference (IV, Random, 95% CI) | 0.73 [‐0.36, 1.83] |
| 5 Self‐reported moderate physical activity (follow‐up values) Show forest plot | 4 | Std. Mean Difference (IV, Random, 95% CI) | Subtotals only | |
| 5.1 End of intervention | 4 | 249 | Std. Mean Difference (IV, Random, 95% CI) | 0.77 [0.47, 1.07] |
| 5.2 Follow‐up | 1 | 26 | Std. Mean Difference (IV, Random, 95% CI) | 0.10 [‐0.69, 0.89] |
| 6 Self‐reported moderate physical activity (change values) Show forest plot | 2 | Std. Mean Difference (IV, Random, 95% CI) | Subtotals only | |
| 6.1 End of intervention | 2 | 93 | Std. Mean Difference (IV, Random, 95% CI) | 1.19 [0.27, 2.11] |
| 6.2 Follow‐up | 1 | 26 | Std. Mean Difference (IV, Random, 95% CI) | 1.20 [0.33, 2.06] |
| 7 Self‐reported moderate‐vigorous physical activity (follow‐up values) Show forest plot | 6 | Std. Mean Difference (IV, Random, 95% CI) | Subtotals only | |
| 7.1 End of intervention | 6 | 1025 | Std. Mean Difference (IV, Random, 95% CI) | 0.42 [0.12, 0.72] |
| 7.2 Follow‐up | 3 | 657 | Std. Mean Difference (IV, Random, 95% CI) | 0.46 [0.13, 0.78] |
| 8 Self‐reported moderate‐vigorous physical activity (change values) Show forest plot | 4 | Std. Mean Difference (IV, Random, 95% CI) | Subtotals only | |
| 8.1 End of intervention | 2 | 875 | Std. Mean Difference (IV, Random, 95% CI) | 0.15 [‐0.14, 0.44] |
| 8.2 Follow‐up | 3 | 495 | Std. Mean Difference (IV, Random, 95% CI) | 0.30 [0.00, 0.59] |
| 9 Self‐reported vigorous physical activity (follow‐up values) Show forest plot | 3 | Std. Mean Difference (IV, Random, 95% CI) | Subtotals only | |
| 9.1 End of intervention | 3 | 182 | Std. Mean Difference (IV, Random, 95% CI) | 0.74 [0.43, 1.04] |
| 9.2 Follow‐up | 1 | 26 | Std. Mean Difference (IV, Random, 95% CI) | 0.19 [‐0.61, 0.98] |
| 10 Self‐reported vigorous physical activity (change values) Show forest plot | 2 | Std. Mean Difference (IV, Random, 95% CI) | Subtotals only | |
| 10.1 End of intervention | 2 | 108 | Std. Mean Difference (IV, Random, 95% CI) | 1.72 [0.78, 2.66] |
| 10.2 Follow‐up | 2 | 108 | Std. Mean Difference (IV, Random, 95% CI) | ‐0.13 [‐0.92, 0.66] |
| 11 Self‐reported walking (follow‐up values) Show forest plot | 2 | Std. Mean Difference (IV, Random, 95% CI) | Subtotals only | |
| 11.1 End of intervention | 2 | 374 | Std. Mean Difference (IV, Random, 95% CI) | 0.40 [‐0.06, 0.86] |
| 11.2 Follow‐up | 1 | 338 | Std. Mean Difference (IV, Random, 95% CI) | 0.09 [‐0.15, 0.34] |
| 12 Self‐reported walking (change values) Show forest plot | 2 | Std. Mean Difference (IV, Random, 95% CI) | Subtotals only | |
| 12.1 End of intervention | 2 | 374 | Std. Mean Difference (IV, Random, 95% CI) | 0.50 [0.23, 0.77] |
| 12.2 Follow‐up | 1 | 338 | Std. Mean Difference (IV, Random, 95% CI) | 0.23 [‐0.02, 0.47] |
| 13 7‐Day PAR self‐reported moderate physical activity (follow‐up values) Show forest plot | 2 | Mean Difference (IV, Fixed, 95% CI) | Subtotals only | |
| 13.1 End of intervention | 2 | 149 | Mean Difference (IV, Fixed, 95% CI) | 110.44 [72.50, 148.38] |
| 13.2 Follow‐up | 0 | 0 | Mean Difference (IV, Fixed, 95% CI) | 0.0 [0.0, 0.0] |
| 14 7‐day PAR self‐reported moderate‐vigorous physical activity (follow‐up values) Show forest plot | 2 | Mean Difference (IV, Random, 95% CI) | Subtotals only | |
| 14.1 End of intervention | 2 | 128 | Mean Difference (IV, Random, 95% CI) | 52.86 [29.04, 76.67] |
| 14.2 Follow‐up | 1 | 67 | Mean Difference (IV, Random, 95% CI) | 41.2 [11.81, 70.59] |
| 15 Godin LSI self‐reported moderate‐vigorous physical activity (follow‐up values) Show forest plot | 5 | Mean Difference (IV, Random, 95% CI) | Subtotals only | |
| 15.1 End of intervention | 5 | 936 | Mean Difference (IV, Random, 95% CI) | 39.42 [‐1.51, 80.34] |
| 15.2 Follow‐up | 2 | 590 | Mean Difference (IV, Random, 95% CI) | 55.07 [17.16, 92.99] |
| 16 Meeting recommended physical activity guidelines (follow‐up values) Show forest plot | 6 | Odds Ratio (M‐H, Random, 95% CI) | Subtotals only | |
| 16.1 End of intervention | 6 | 819 | Odds Ratio (M‐H, Random, 95% CI) | 8.44 [2.41, 29.56] |
| 16.2 Follow‐up | 2 | 280 | Odds Ratio (M‐H, Random, 95% CI) | 3.11 [1.50, 6.46] |
| 17 Overall objective physical activity (follow‐up values) Show forest plot | 10 | Std. Mean Difference (IV, Random, 95% CI) | Subtotals only | |
| 17.1 End of intervention | 10 | 1248 | Std. Mean Difference (IV, Random, 95% CI) | 0.43 [0.19, 0.66] |
| 17.2 Follow‐up | 3 | 305 | Std. Mean Difference (IV, Random, 95% CI) | 0.22 [‐0.21, 0.66] |
| 18 Overall objective physical activity (change values) Show forest plot | 6 | Std. Mean Difference (IV, Random, 95% CI) | Subtotals only | |
| 18.1 End of intervention | 5 | 508 | Std. Mean Difference (IV, Random, 95% CI) | 0.71 [0.14, 1.29] |
| 18.2 Follow‐up | 2 | 61 | Std. Mean Difference (IV, Random, 95% CI) | 0.23 [1.00, 1.46] |
| 19 Objective moderate‐vigorous physical activity (follow‐up values) Show forest plot | 5 | Std. Mean Difference (IV, Random, 95% CI) | Subtotals only | |
| 19.1 End of intervention | 5 | 390 | Std. Mean Difference (IV, Random, 95% CI) | 1.49 [0.47, 2.51] |
| 19.2 Follow‐up | 2 | 280 | Std. Mean Difference (IV, Random, 95% CI) | 0.36 [‐0.08, 0.79] |
| 20 Objective moderate‐vigorous physical activity (change values) Show forest plot | 3 | Std. Mean Difference (IV, Random, 95% CI) | Subtotals only | |
| 20.1 End of intervention | 2 | 78 | Std. Mean Difference (IV, Random, 95% CI) | 0.92 [0.45, 1.40] |
| 20.2 Follow‐up | 1 | 36 | Std. Mean Difference (IV, Random, 95% CI) | 0.84 [0.15, 1.52] |
| 21 Objective vigorous physical activity (follow‐up values) Show forest plot | 2 | Std. Mean Difference (IV, Random, 95% CI) | Subtotals only | |
| 21.1 End of intervention | 2 | 63 | Std. Mean Difference (IV, Random, 95% CI) | 0.46 [‐0.05, 0.97] |
| 21.2 Follow‐up | 1 | 25 | Std. Mean Difference (IV, Random, 95% CI) | ‐0.16 [‐0.97, 0.66] |
| 22 Accelerometer counts (follow‐up values) Show forest plot | 2 | Std. Mean Difference (IV, Random, 95% CI) | Subtotals only | |
| 22.1 End of intervention | 2 | 74 | Std. Mean Difference (IV, Random, 95% CI) | 0.90 [0.08, 1.72] |
| 22.2 Follow‐up | 0 | 0 | Std. Mean Difference (IV, Random, 95% CI) | 0.0 [0.0, 0.0] |
| 23 Pedometer/accelerometer steps/d (follow‐up values) Show forest plot | 5 | Std. Mean Difference (IV, Random, 95% CI) | Subtotals only | |
| 23.1 End of intervention | 5 | 809 | Std. Mean Difference (IV, Random, 95% CI) | 0.22 [‐0.08, 0.53] |
| 23.2 Follow‐up | 0 | 0 | Std. Mean Difference (IV, Random, 95% CI) | 0.0 [0.0, 0.0] |
| 24 Pedometer/accelerometer steps/d (change values) Show forest plot | 3 | Std. Mean Difference (IV, Random, 95% CI) | Subtotals only | |
| 24.1 End of intervention | 3 | 441 | Std. Mean Difference (IV, Random, 95% CI) | 0.45 [‐0.18, 1.09] |
| 24.2 Follow‐up | 0 | 0 | Std. Mean Difference (IV, Random, 95% CI) | 0.0 [0.0, 0.0] |
| 25 Overall sedentary behaviour (follow‐up values) Show forest plot | 4 | Std. Mean Difference (IV, Random, 95% CI) | Subtotals only | |
| 25.1 End of intervention | 4 | 402 | Std. Mean Difference (IV, Random, 95% CI) | ‐1.01 [‐2.28, 0.26] |
| 25.2 Follow‐up | 1 | 25 | Std. Mean Difference (IV, Random, 95% CI) | 0.58 [‐0.26, 1.41] |
| 26 Objective sedentary behaviour (follow‐up values) Show forest plot | 3 | Std. Mean Difference (IV, Random, 95% CI) | Subtotals only | |
| 26.1 End of intervention | 3 | 103 | Std. Mean Difference (IV, Random, 95% CI) | ‐1.45 [‐3.68, 0.78] |
| 26.2 Follow‐up | 1 | 25 | Std. Mean Difference (IV, Random, 95% CI) | 0.58 [‐0.26, 1.41] |
| 27 Objective sedentary behaviour (change values) Show forest plot | 3 | Std. Mean Difference (IV, Random, 95% CI) | Subtotals only | |
| 27.1 End of intervention | 3 | 103 | Std. Mean Difference (IV, Random, 95% CI) | ‐0.01 [‐0.63, 0.60] |
| 27.2 Follow‐up | 1 | 25 | Std. Mean Difference (IV, Random, 95% CI) | 0.88 [0.02, 1.74] |
| Outcome or subgroup title | No. of studies | No. of participants | Statistical method | Effect size |
| 1 Mass (follow‐up values) Show forest plot | 16 | Mean Difference (IV, Fixed, 95% CI) | Subtotals only | |
| 1.1 End of intervention | 16 | 1210 | Mean Difference (IV, Fixed, 95% CI) | 0.00 [‐0.57, 0.58] |
| 1.2 Follow‐up | 1 | 49 | Mean Difference (IV, Fixed, 95% CI) | 5.02 [‐5.17, 15.21] |
| 2 Mass (change values) Show forest plot | 11 | Mean Difference (IV, Random, 95% CI) | Subtotals only | |
| 2.1 End of intervention | 11 | 1047 | Mean Difference (IV, Random, 95% CI) | ‐0.50 [‐0.98, ‐0.01] |
| 2.2 Follow‐up | 0 | 0 | Mean Difference (IV, Random, 95% CI) | 0.0 [0.0, 0.0] |
| 3 BMI (follow‐up values) Show forest plot | 17 | Mean Difference (IV, Fixed, 95% CI) | Subtotals only | |
| 3.1 End of intervention | 17 | 1481 | Mean Difference (IV, Fixed, 95% CI) | 0.01 [‐0.19, 0.22] |
| 3.2 Follow‐up | 0 | 0 | Mean Difference (IV, Fixed, 95% CI) | 0.0 [0.0, 0.0] |
| 4 BMI (change values) Show forest plot | 8 | Mean Difference (IV, Random, 95% CI) | Subtotals only | |
| 4.1 End of intervention | 8 | 485 | Mean Difference (IV, Random, 95% CI) | ‐0.22 [‐0.45, 0.01] |
| 4.2 Follow‐up | 0 | 0 | Mean Difference (IV, Random, 95% CI) | 0.0 [0.0, 0.0] |
| 5 Overall body fat (follow‐up values) Show forest plot | 18 | Std. Mean Difference (IV, Random, 95% CI) | Subtotals only | |
| 5.1 End of intervention | 18 | 1162 | Std. Mean Difference (IV, Random, 95% CI) | ‐0.18 [‐0.34, ‐0.03] |
| 5.2 Follow‐up | 1 | 49 | Std. Mean Difference (IV, Random, 95% CI) | 0.08 [‐0.48, 0.64] |
| 6 Overall body fat (change values) Show forest plot | 9 | Std. Mean Difference (IV, Random, 95% CI) | Subtotals only | |
| 6.1 End of intervention | 9 | 499 | Std. Mean Difference (IV, Random, 95% CI) | ‐0.62 [‐1.19, ‐0.06] |
| 6.2 Follow‐up | 0 | 0 | Std. Mean Difference (IV, Random, 95% CI) | 0.0 [0.0, 0.0] |
| 7 Percentage body fat ‐ DEXA (follow‐up values) Show forest plot | 6 | Mean Difference (IV, Random, 95% CI) | Subtotals only | |
| 7.1 End of intervention | 6 | 580 | Mean Difference (IV, Random, 95% CI) | ‐0.66 [‐1.70, 0.37] |
| 7.2 Follow‐up | 1 | 49 | Mean Difference (IV, Random, 95% CI) | 0.52 [‐3.18, 4.22] |
| 8 Percentage body fat ‐ DEXA (change values) Show forest plot | 3 | Mean Difference (IV, Random, 95% CI) | Subtotals only | |
| 8.1 End of intervention | 3 | 228 | Mean Difference (IV, Random, 95% CI) | ‐1.32 [‐1.66, ‐0.99] |
| 8.2 Follow‐up | 0 | 0 | Mean Difference (IV, Random, 95% CI) | 0.0 [0.0, 0.0] |
| 9 Percentage body fat ‐ BIA (follow‐up values) Show forest plot | 7 | Mean Difference (IV, Fixed, 95% CI) | Subtotals only | |
| 9.1 End of intervention | 7 | 331 | Mean Difference (IV, Fixed, 95% CI) | ‐1.47 [‐2.84, ‐0.10] |
| 9.2 Follow‐up | 0 | 0 | Mean Difference (IV, Fixed, 95% CI) | 0.0 [0.0, 0.0] |
| 10 Percentage body fat ‐ BIA (change values) Show forest plot | 4 | Mean Difference (IV, Fixed, 95% CI) | Subtotals only | |
| 10.1 End of intervention | 4 | 185 | Mean Difference (IV, Fixed, 95% CI) | ‐0.70 [‐1.26, ‐0.13] |
| 10.2 Follow‐up | 0 | 0 | Mean Difference (IV, Fixed, 95% CI) | 0.0 [0.0, 0.0] |
| 11 Percentage body fat ‐ SKF (follow‐up values) Show forest plot | 3 | Mean Difference (IV, Random, 95% CI) | Subtotals only | |
| 11.1 End of intervention | 3 | 165 | Mean Difference (IV, Random, 95% CI) | ‐0.73 [‐2.41, 0.96] |
| 11.2 Follow‐up | 0 | 0 | Mean Difference (IV, Random, 95% CI) | 0.0 [0.0, 0.0] |
| 12 Fat mass (follow‐up values) Show forest plot | 5 | Mean Difference (IV, Fixed, 95% CI) | Subtotals only | |
| 12.1 End of intervention | 5 | 460 | Mean Difference (IV, Fixed, 95% CI) | ‐0.70 [‐1.40, ‐0.00] |
| 12.2 Follow‐up | 0 | 0 | Mean Difference (IV, Fixed, 95% CI) | 0.0 [0.0, 0.0] |
| 13 Fat mass (change values) Show forest plot | 4 | Mean Difference (IV, Random, 95% CI) | Subtotals only | |
| 13.1 End of intervention | 4 | 768 | Mean Difference (IV, Random, 95% CI) | ‐0.46 [‐1.08, 0.15] |
| 13.2 Follow‐up | 0 | 0 | Mean Difference (IV, Random, 95% CI) | 0.0 [0.0, 0.0] |
| 14 Fat mass ‐ DEXA (follow‐up values) Show forest plot | 3 | Mean Difference (IV, Fixed, 95% CI) | Subtotals only | |
| 14.1 End of intervention | 3 | 408 | Mean Difference (IV, Fixed, 95% CI) | ‐0.68 [‐1.39, 0.03] |
| 14.2 Follow‐up | 0 | 0 | Mean Difference (IV, Fixed, 95% CI) | 0.0 [0.0, 0.0] |
| 15 Fat mass ‐ DEXA (change values) Show forest plot | 2 | Mean Difference (IV, Random, 95% CI) | Subtotals only | |
| 15.1 End of intervention | 2 | 207 | Mean Difference (IV, Random, 95% CI) | ‐0.74 [‐0.93, ‐0.56] |
| 15.2 Follow‐up | 0 | 0 | Mean Difference (IV, Random, 95% CI) | 0.0 [0.0, 0.0] |
| 16 Lean mass (follow‐up values) Show forest plot | 8 | Std. Mean Difference (IV, Fixed, 95% CI) | Subtotals only | |
| 16.1 End of intervention | 8 | 612 | Std. Mean Difference (IV, Fixed, 95% CI) | 0.05 [‐0.11, 0.21] |
| 16.2 Follow‐up | 1 | 49 | Std. Mean Difference (IV, Fixed, 95% CI) | 0.33 [‐0.24, 0.89] |
| 17 Lean mass (change values) Show forest plot | 5 | Std. Mean Difference (IV, Random, 95% CI) | Subtotals only | |
| 17.1 End of intervention | 5 | 760 | Std. Mean Difference (IV, Random, 95% CI) | 0.80 [‐0.13, 1.72] |
| 17.2 Follow‐up | 0 | 0 | Std. Mean Difference (IV, Random, 95% CI) | 0.0 [0.0, 0.0] |
| 18 Lean mass ‐ DEXA (follow‐up values) Show forest plot | 5 | Mean Difference (IV, Fixed, 95% CI) | Subtotals only | |
| 18.1 End of intervention | 5 | 541 | Mean Difference (IV, Fixed, 95% CI) | 0.43 [‐0.54, 1.40] |
| 18.2 Follow‐up | 1 | 49 | Mean Difference (IV, Fixed, 95% CI) | 2.41 [‐1.62, 6.44] |
| 19 Lean mass ‐ DEXA (change values) Show forest plot | 2 | Mean Difference (IV, Random, 95% CI) | Subtotals only | |
| 19.1 End of intervention | 2 | 207 | Mean Difference (IV, Random, 95% CI) | 0.73 [0.17, 1.29] |
| 19.2 Follow‐up | 0 | 0 | Mean Difference (IV, Random, 95% CI) | 0.0 [0.0, 0.0] |
| 20 Waist‐to‐hip ratio (follow‐up values) Show forest plot | 5 | Mean Difference (IV, Random, 95% CI) | Subtotals only | |
| 20.1 End of intervention | 5 | 213 | Mean Difference (IV, Random, 95% CI) | ‐0.03 [‐0.06, 0.01] |
| 20.2 Follow‐up | 0 | 0 | Mean Difference (IV, Random, 95% CI) | 0.0 [0.0, 0.0] |
| 21 Waist‐to‐hip ratio (change values) Show forest plot | 3 | Mean Difference (IV, Fixed, 95% CI) | Subtotals only | |
| 21.1 End of intervention | 2 | 124 | Mean Difference (IV, Fixed, 95% CI) | 0.0 [‐0.01, 0.01] |
| 21.2 Follow‐up | 1 | 36 | Mean Difference (IV, Fixed, 95% CI) | 0.04 [‐0.14, 0.22] |
| 22 Waist circumference (follow‐up values) Show forest plot | 6 | Mean Difference (IV, Fixed, 95% CI) | Subtotals only | |
| 22.1 End of intervention | 6 | 330 | Mean Difference (IV, Fixed, 95% CI) | ‐0.50 [‐3.18, 2.18] |
| 22.2 Follow‐up | 1 | 26 | Mean Difference (IV, Fixed, 95% CI) | 1.40 [‐8.29, 11.09] |
| 23 Waist circumference (change values) Show forest plot | 5 | Mean Difference (IV, Random, 95% CI) | Subtotals only | |
| 23.1 End of intervention | 5 | 285 | Mean Difference (IV, Random, 95% CI) | ‐1.71 [‐2.56, ‐0.86] |
| 23.2 Follow‐up | 1 | 26 | Mean Difference (IV, Random, 95% CI) | ‐0.90 [‐2.61, 0.81] |
| 24 Hip circumference (follow‐up values) Show forest plot | 4 | Mean Difference (IV, Fixed, 95% CI) | Subtotals only | |
| 24.1 End of intervention | 4 | 249 | Mean Difference (IV, Fixed, 95% CI) | ‐0.97 [‐3.96, 2.01] |
| 24.2 Follow‐up | 0 | 0 | Mean Difference (IV, Fixed, 95% CI) | 0.0 [0.0, 0.0] |
| 25 Hip circumference (change values) Show forest plot | 2 | Mean Difference (IV, Random, 95% CI) | Subtotals only | |
| 25.1 End of intervention | 2 | 115 | Mean Difference (IV, Random, 95% CI) | ‐2.37 [‐3.31, ‐1.44] |
| 25.2 Follow‐up | 0 | 0 | Mean Difference (IV, Random, 95% CI) | 0.0 [0.0, 0.0] |
| Outcome or subgroup title | No. of studies | No. of participants | Statistical method | Effect size |
| 1 Lower body strength (follow‐up values) Show forest plot | 10 | Std. Mean Difference (IV, Random, 95% CI) | Subtotals only | |
| 1.1 End of intervention | 10 | 637 | Std. Mean Difference (IV, Random, 95% CI) | 0.44 [0.09, 0.78] |
| 1.2 Follow‐up | 0 | 0 | Std. Mean Difference (IV, Random, 95% CI) | 0.0 [0.0, 0.0] |
| 2 Lower body strength (change values) Show forest plot | 9 | Std. Mean Difference (IV, Random, 95% CI) | Subtotals only | |
| 2.1 End of intervention | 8 | 720 | Std. Mean Difference (IV, Random, 95% CI) | 0.72 [0.38, 1.07] |
| 2.2 Follow‐up | 1 | 36 | Std. Mean Difference (IV, Random, 95% CI) | 0.78 [0.10, 1.46] |
| 3 Leg press (follow‐up values) Show forest plot | 5 | Std. Mean Difference (IV, Random, 95% CI) | Subtotals only | |
| 3.1 End of intervention | 5 | 422 | Std. Mean Difference (IV, Random, 95% CI) | 0.79 [0.35, 1.22] |
| 3.2 Follow‐up | 0 | 0 | Std. Mean Difference (IV, Random, 95% CI) | 0.0 [0.0, 0.0] |
| 4 Leg press (change values) Show forest plot | 5 | Std. Mean Difference (IV, Random, 95% CI) | Subtotals only | |
| 4.1 End of intervention | 5 | 393 | Std. Mean Difference (IV, Random, 95% CI) | 0.94 [0.68, 1.20] |
| 4.2 Follow‐up | 0 | 0 | Std. Mean Difference (IV, Random, 95% CI) | 0.0 [0.0, 0.0] |
| 5 Back & leg strength (follow‐up values) Show forest plot | 2 | Mean Difference (IV, Fixed, 95% CI) | Subtotals only | |
| 5.1 End of intervention | 2 | 58 | Mean Difference (IV, Fixed, 95% CI) | 7.90 [‐2.31, 18.11] |
| 5.2 Follow‐up | 0 | 0 | Mean Difference (IV, Fixed, 95% CI) | 0.0 [0.0, 0.0] |
| 6 Leg extension (follow‐up values) Show forest plot | 4 | Std. Mean Difference (IV, Random, 95% CI) | Subtotals only | |
| 6.1 End of intervention | 4 | 177 | Std. Mean Difference (IV, Random, 95% CI) | ‐0.01 [‐0.34, 0.32] |
| 6.2 Follow‐up | 0 | 0 | Std. Mean Difference (IV, Random, 95% CI) | 0.0 [0.0, 0.0] |
| 7 Leg extension (change values) Show forest plot | 4 | Std. Mean Difference (IV, Random, 95% CI) | Subtotals only | |
| 7.1 End of intervention | 4 | 389 | Std. Mean Difference (IV, Random, 95% CI) | 0.57 [0.03, 1.12] |
| 7.2 Follow‐up | 0 | 0 | Std. Mean Difference (IV, Random, 95% CI) | 0.0 [0.0, 0.0] |
| 8 Hip extension (follow‐up values) Show forest plot | 2 | Std. Mean Difference (IV, Random, 95% CI) | Subtotals only | |
| 8.1 End of intervention | 2 | 285 | Std. Mean Difference (IV, Random, 95% CI) | 0.14 [‐0.45, 0.72] |
| 8.2 Follow‐up | 0 | 0 | Std. Mean Difference (IV, Random, 95% CI) | 0.0 [0.0, 0.0] |
| 9 Hip flexion (follow‐up values) Show forest plot | 2 | Std. Mean Difference (IV, Random, 95% CI) | Subtotals only | |
| 9.1 End of intervention | 2 | 285 | Std. Mean Difference (IV, Random, 95% CI) | 0.04 [‐0.76, 0.83] |
| 9.2 Follow‐up | 0 | 0 | Std. Mean Difference (IV, Random, 95% CI) | 0.0 [0.0, 0.0] |
| 10 Leg flexion (follow‐up values) Show forest plot | 2 | Std. Mean Difference (IV, Random, 95% CI) | Subtotals only | |
| 10.1 End of intervention | 2 | 243 | Std. Mean Difference (IV, Random, 95% CI) | 0.86 [‐0.05, 1.76] |
| 10.2 Follow‐up | 0 | 0 | Std. Mean Difference (IV, Random, 95% CI) | 0.0 [0.0, 0.0] |
| 11 Upper body strength (follow‐up values) Show forest plot | 13 | Std. Mean Difference (IV, Random, 95% CI) | Subtotals only | |
| 11.1 End of intervention | 13 | 768 | Std. Mean Difference (IV, Random, 95% CI) | 0.42 [0.08, 0.76] |
| 11.2 Follow‐up | 0 | 0 | Std. Mean Difference (IV, Random, 95% CI) | 0.0 [0.0, 0.0] |
| 12 Upper body strength (change values) Show forest plot | 9 | Std. Mean Difference (IV, Random, 95% CI) | Subtotals only | |
| 12.1 End of intervention | 8 | 832 | Std. Mean Difference (IV, Random, 95% CI) | 0.72 [0.30, 1.14] |
| 12.2 Follow‐up | 1 | 36 | Std. Mean Difference (IV, Random, 95% CI) | 0.76 [0.08, 1.44] |
| 13 Chest press (follow‐up values) Show forest plot | 5 | Std. Mean Difference (IV, Random, 95% CI) | Subtotals only | |
| 13.1 End of intervention | 5 | 444 | Std. Mean Difference (IV, Random, 95% CI) | 0.51 [‐0.15, 1.17] |
| 13.2 Follow‐up | 0 | 0 | Std. Mean Difference (IV, Random, 95% CI) | 0.0 [0.0, 0.0] |
| 14 Chest press (change values) Show forest plot | 4 | Std. Mean Difference (IV, Random, 95% CI) | Subtotals only | |
| 14.1 End of intervention | 4 | 381 | Std. Mean Difference (IV, Random, 95% CI) | 1.13 [0.46, 1.80] |
| 14.2 Follow‐up | 0 | 0 | Std. Mean Difference (IV, Random, 95% CI) | 0.0 [0.0, 0.0] |
| 15 Grip strength (follow‐up) Show forest plot | 7 | Mean Difference (IV, Random, 95% CI) | Subtotals only | |
| 15.1 End of intervention | 7 | 320 | Mean Difference (IV, Random, 95% CI) | 2.37 [0.20, 4.55] |
| 15.2 Follow‐up | 0 | 0 | Mean Difference (IV, Random, 95% CI) | 0.0 [0.0, 0.0] |
| 16 Grip strength (change values) Show forest plot | 3 | Std. Mean Difference (IV, Random, 95% CI) | Subtotals only | |
| 16.1 End of intervention | 2 | 145 | Std. Mean Difference (IV, Random, 95% CI) | 0.24 [‐0.09, 0.58] |
| 16.2 Follow‐up | 1 | 36 | Std. Mean Difference (IV, Random, 95% CI) | 0.76 [0.08, 1.44] |
| 17 Grip strength right hand (follow‐up) Show forest plot | 5 | Mean Difference (IV, Random, 95% CI) | Subtotals only | |
| 17.1 End of intervention | 5 | 232 | Mean Difference (IV, Random, 95% CI) | 2.30 [‐0.56, 5.16] |
| 17.2 Follow‐up | 0 | 0 | Mean Difference (IV, Random, 95% CI) | 0.0 [0.0, 0.0] |
| 18 Grip strength left hand (follow‐up) Show forest plot | 4 | Mean Difference (IV, Random, 95% CI) | Subtotals only | |
| 18.1 End of intervention | 4 | 198 | Mean Difference (IV, Random, 95% CI) | 2.12 [‐1.05, 5.30] |
| 18.2 Follow‐up | 0 | 0 | Mean Difference (IV, Random, 95% CI) | 0.0 [0.0, 0.0] |
| 19 Elbow flexion (follow‐up values) Show forest plot | 3 | Std. Mean Difference (IV, Fixed, 95% CI) | Subtotals only | |
| 19.1 End of intervention | 3 | 148 | Std. Mean Difference (IV, Fixed, 95% CI) | ‐0.08 [‐0.41, 0.24] |
| 19.2 Follow‐up | 0 | 0 | Std. Mean Difference (IV, Fixed, 95% CI) | 0.0 [0.0, 0.0] |
| Outcome or subgroup title | No. of studies | No. of participants | Statistical method | Effect size |
| 1 Bone mineral content (follow‐up and change values) Show forest plot | 2 | Std. Mean Difference (IV, Random, 95% CI) | Subtotals only | |
| 1.1 End of intervention | 2 | 525 | Std. Mean Difference (IV, Random, 95% CI) | 0.04 [‐0.20, 0.27] |
| 1.2 Follow‐up | 0 | 0 | Std. Mean Difference (IV, Random, 95% CI) | 0.0 [0.0, 0.0] |
| 2 Bone mineral density ‐ femoral neck (follow‐up and change values) Show forest plot | 4 | Std. Mean Difference (IV, Random, 95% CI) | Subtotals only | |
| 2.1 End of intervention | 4 | 786 | Std. Mean Difference (IV, Random, 95% CI) | 0.21 [‐0.13, 0.55] |
| 2.2 Follow‐up | 0 | 0 | Std. Mean Difference (IV, Random, 95% CI) | 0.0 [0.0, 0.0] |
| 3 Bone mineral density ‐ lumbar spine (follow‐up and change values) Show forest plot | 4 | Std. Mean Difference (IV, Random, 95% CI) | Subtotals only | |
| 3.1 End of intervention | 4 | 786 | Std. Mean Difference (IV, Random, 95% CI) | 0.22 [‐0.09, 0.53] |
| 3.2 Follow‐up | 0 | 0 | Std. Mean Difference (IV, Random, 95% CI) | 0.0 [0.0, 0.0] |
| 4 Bone mineral density ‐ total hip (follow‐up and change values) Show forest plot | 3 | Std. Mean Difference (IV, Random, 95% CI) | Subtotals only | |
| 4.1 End of intervention | 3 | 329 | Std. Mean Difference (IV, Random, 95% CI) | 0.58 [‐0.02, 1.18] |
| 4.2 Follow‐up | 0 | 0 | Std. Mean Difference (IV, Random, 95% CI) | 0.0 [0.0, 0.0] |
| 5 Bone formation ‐ alkaline phosphatase (follow‐up and change values) Show forest plot | 2 | Std. Mean Difference (IV, Random, 95% CI) | Subtotals only | |
| 5.1 End of intervention | 2 | 239 | Std. Mean Difference (IV, Random, 95% CI) | ‐0.25 [‐1.81, 1.31] |
| 5.2 Follow‐up | 0 | 0 | Std. Mean Difference (IV, Random, 95% CI) | 0.0 [0.0, 0.0] |
| 6 Bone resorption ‐ serum NTx (follow‐up and change values) Show forest plot | 3 | Std. Mean Difference (IV, Random, 95% CI) | Subtotals only | |
| 6.1 End of intervention | 3 | 278 | Std. Mean Difference (IV, Random, 95% CI) | 0.38 [‐1.58, 2.34] |
| 6.2 Follow‐up | 0 | 0 | Std. Mean Difference (IV, Random, 95% CI) | 0.0 [0.0, 0.0] |
| Outcome or subgroup title | No. of studies | No. of participants | Statistical method | Effect size |
| 1 Overall HRQoL (follow‐up values) Show forest plot | 9 | Std. Mean Difference (IV, Random, 95% CI) | Subtotals only | |
| 1.1 Postmenopausal only | 3 | 186 | Std. Mean Difference (IV, Random, 95% CI) | 0.24 [‐0.05, 0.54] |
| 1.2 Not postmenopausal only | 6 | 818 | Std. Mean Difference (IV, Random, 95% CI) | 0.55 [0.11, 0.98] |
| 2 Overall HRQoL (change values) Show forest plot | 7 | Std. Mean Difference (IV, Random, 95% CI) | Subtotals only | |
| 2.1 Postmenopausal only | 3 | 186 | Std. Mean Difference (IV, Random, 95% CI) | 0.49 [0.19, 0.79] |
| 2.2 Not postmenopausal only | 4 | 952 | Std. Mean Difference (IV, Random, 95% CI) | 0.13 [‐0.11, 0.38] |
| 3 Overall emotional function/mental health (follow‐up values) Show forest plot | 11 | Std. Mean Difference (IV, Random, 95% CI) | Subtotals only | |
| 3.1 Postmenopausal only | 2 | 126 | Std. Mean Difference (IV, Random, 95% CI) | 0.21 [‐0.14, 0.56] |
| 3.2 Not postmenopausal only | 9 | 990 | Std. Mean Difference (IV, Random, 95% CI) | 0.25 [0.06, 0.44] |
| 4 Overall emotional function/mental health (change values) Show forest plot | 7 | Std. Mean Difference (IV, Random, 95% CI) | Subtotals only | |
| 4.1 Postmenopausal only | 2 | 126 | Std. Mean Difference (IV, Random, 95% CI) | 0.37 [0.01, 0.72] |
| 4.2 Not postmenopausal only | 5 | 1013 | Std. Mean Difference (IV, Random, 95% CI) | 0.08 [‐0.17, 0.33] |
| 5 Overall physical function (follow‐up values) Show forest plot | 11 | Std. Mean Difference (IV, Random, 95% CI) | Subtotals only | |
| 5.1 Postmenopausal only | 3 | 187 | Std. Mean Difference (IV, Random, 95% CI) | 0.09 [‐0.20, 0.38] |
| 5.2 Not postmenopausal only | 8 | 929 | Std. Mean Difference (IV, Random, 95% CI) | 0.50 [0.10, 0.90] |
| 6 Overall physical function (change values) Show forest plot | 6 | Std. Mean Difference (IV, Random, 95% CI) | Subtotals only | |
| 6.1 Postmenopausal only | 2 | 126 | Std. Mean Difference (IV, Random, 95% CI) | 0.52 [‐0.36, 1.39] |
| 6.2 Not postmenopausal only | 4 | 949 | Std. Mean Difference (IV, Random, 95% CI) | 0.03 [‐0.20, 0.25] |
| 7 Overall role function (follow‐up values) Show forest plot | 8 | Std. Mean Difference (IV, Random, 95% CI) | Subtotals only | |
| 7.1 Postmenopausal only | 2 | 126 | Std. Mean Difference (IV, Random, 95% CI) | 0.27 [‐0.08, 0.62] |
| 7.2 Not postmenopausal only | 6 | 818 | Std. Mean Difference (IV, Random, 95% CI) | 0.42 [‐0.07, 0.90] |
| 8 Overall role function (change values) Show forest plot | 6 | Std. Mean Difference (IV, Random, 95% CI) | Subtotals only | |
| 8.1 Postmenopausal only | 2 | 126 | Std. Mean Difference (IV, Random, 95% CI) | 0.11 [‐0.24, 0.46] |
| 8.2 Not postmenopausal only | 4 | 952 | Std. Mean Difference (IV, Random, 95% CI) | ‐0.00 [‐0.14, 0.13] |
| 9 Overall social well‐being/function (follow‐up values) Show forest plot | 8 | Std. Mean Difference (IV, Random, 95% CI) | Subtotals only | |
| 9.1 Postmenopausal only | 3 | 168 | Std. Mean Difference (IV, Random, 95% CI) | 0.43 [‐0.06, 0.91] |
| 9.2 Not postmenopausal only | 5 | 867 | Std. Mean Difference (IV, Random, 95% CI) | 0.09 [‐0.05, 0.24] |
| 10 Overall social well‐being/function (change values) Show forest plot | 6 | Std. Mean Difference (IV, Random, 95% CI) | Subtotals only | |
| 10.1 Postmenopausal only | 3 | 168 | Std. Mean Difference (IV, Random, 95% CI) | 0.50 [0.19, 0.80] |
| 10.2 Not postmenopausal only | 3 | 873 | Std. Mean Difference (IV, Random, 95% CI) | 0.50 [‐0.39, 1.40] |
| 11 Overall cognitive function (follow‐up values) Show forest plot | 3 | Std. Mean Difference (IV, Random, 95% CI) | Subtotals only | |
| 11.1 Postmenopausal only | 0 | 0 | Std. Mean Difference (IV, Random, 95% CI) | 0.0 [0.0, 0.0] |
| 11.2 Not postmenopausal only | 3 | 116 | Std. Mean Difference (IV, Random, 95% CI) | 0.58 [0.20, 0.95] |
| 12 Overall cognitive function (change values) Show forest plot | 3 | Std. Mean Difference (IV, Random, 95% CI) | Subtotals only | |
| 12.1 Postmenopausal only | 0 | 0 | Std. Mean Difference (IV, Random, 95% CI) | 0.0 [0.0, 0.0] |
| 12.2 Not postmenopausal only | 3 | 599 | Std. Mean Difference (IV, Random, 95% CI) | 0.12 [‐0.31, 0.55] |
| 13 Overall general health (follow‐up values) Show forest plot | 4 | Std. Mean Difference (IV, Random, 95% CI) | Subtotals only | |
| 13.1 Postmenopausal only | 2 | 134 | Std. Mean Difference (IV, Random, 95% CI) | ‐0.03 [‐0.41, 0.35] |
| 13.2 Not postmenopausal only | 2 | 117 | Std. Mean Difference (IV, Random, 95% CI) | ‐0.09 [‐0.57, 0.39] |
| 14 Overall general health (change values) Show forest plot | 5 | Std. Mean Difference (IV, Random, 95% CI) | Subtotals only | |
| 14.1 Postmenopausal only | 2 | 134 | Std. Mean Difference (IV, Random, 95% CI) | 0.27 [‐0.18, 0.71] |
| 14.2 Not postmenopausal only | 3 | 617 | Std. Mean Difference (IV, Random, 95% CI) | ‐0.01 [‐0.22, 0.21] |
| 15 Overall sexual function (follow‐up values) Show forest plot | 2 | Std. Mean Difference (IV, Fixed, 95% CI) | Subtotals only | |
| 15.1 Postmenopausal only | 0 | 0 | Std. Mean Difference (IV, Fixed, 95% CI) | 0.0 [0.0, 0.0] |
| 15.2 Not postmenopausal only | 2 | 161 | Std. Mean Difference (IV, Fixed, 95% CI) | 0.31 [‐0.00, 0.62] |
| 16 Overall sexual function (change values) Show forest plot | 2 | Std. Mean Difference (IV, Random, 95% CI) | Subtotals only | |
| 16.1 Postmenopausal only | 0 | 0 | Std. Mean Difference (IV, Random, 95% CI) | 0.0 [0.0, 0.0] |
| 16.2 Not postmenopausal only | 2 | 579 | Std. Mean Difference (IV, Random, 95% CI) | 0.08 [‐0.14, 0.30] |
| 17 Overall sleep (follow‐up values) Show forest plot | 4 | Std. Mean Difference (IV, Fixed, 95% CI) | Subtotals only | |
| 17.1 Postmenopausal only | 1 | 42 | Std. Mean Difference (IV, Fixed, 95% CI) | ‐0.11 [‐0.72, 0.49] |
| 17.2 Not postmenopausal only | 3 | 89 | Std. Mean Difference (IV, Fixed, 95% CI) | 0.18 [‐0.24, 0.60] |
| 18 Overall sleep (change values) Show forest plot | 2 | Std. Mean Difference (IV, Random, 95% CI) | Subtotals only | |
| 18.1 Postmenopausal only | 1 | 42 | Std. Mean Difference (IV, Random, 95% CI) | 0.23 [‐0.38, 0.84] |
| 18.2 Not postmenopausal only | 1 | 38 | Std. Mean Difference (IV, Random, 95% CI) | 0.05 [‐0.59, 0.68] |
| 19 Overall anxiety (follow‐up values) Show forest plot | 4 | Std. Mean Difference (IV, Random, 95% CI) | Subtotals only | |
| 19.1 Postmenopausal only | 2 | 116 | Std. Mean Difference (IV, Random, 95% CI) | ‐0.09 [‐0.46, 0.27] |
| 19.2 Not postmenopausal only | 2 | 79 | Std. Mean Difference (IV, Random, 95% CI) | ‐0.66 [‐1.12, ‐0.20] |
| 20 Overall anxiety (change values) Show forest plot | 3 | Std. Mean Difference (IV, Fixed, 95% CI) | Subtotals only | |
| 20.1 Postmenopausal only | 2 | 116 | Std. Mean Difference (IV, Fixed, 95% CI) | ‐0.23 [‐0.60, 0.13] |
| 20.2 Not postmenopausal only | 1 | 61 | Std. Mean Difference (IV, Fixed, 95% CI) | ‐0.61 [‐1.12, ‐0.09] |
| 21 Overall self‐esteem/body image (follow‐up values) Show forest plot | 4 | Std. Mean Difference (IV, Random, 95% CI) | Subtotals only | |
| 21.1 Postmenopausal only | 2 | 126 | Std. Mean Difference (IV, Random, 95% CI) | 0.10 [‐0.25, 0.45] |
| 21.2 Not postmenopausal only | 2 | 76 | Std. Mean Difference (IV, Random, 95% CI) | 0.60 [‐0.15, 1.35] |
| 22 Overall self‐esteem/body image (change values) Show forest plot | 4 | Std. Mean Difference (IV, Random, 95% CI) | Subtotals only | |
| 22.1 Postmenopausal only | 2 | 126 | Std. Mean Difference (IV, Random, 95% CI) | 0.38 [‐0.30, 1.05] |
| 22.2 Not postmenopausal only | 2 | 558 | Std. Mean Difference (IV, Random, 95% CI) | 0.08 [‐0.31, 0.47] |
| 23 Overall depression (follow‐up values) Show forest plot | 8 | Std. Mean Difference (IV, Random, 95% CI) | Subtotals only | |
| 23.1 Postmenopausal only | 4 | 196 | Std. Mean Difference (IV, Random, 95% CI) | 0.18 [‐0.13, 0.48] |
| 23.2 Not postmenopausal only | 4 | 296 | Std. Mean Difference (IV, Random, 95% CI) | ‐0.42 [‐0.77, ‐0.06] |
| 24 Overall depression (change values) Show forest plot | 5 | Std. Mean Difference (IV, Random, 95% CI) | Subtotals only | |
| 24.1 Postmenopausal only | 3 | 176 | Std. Mean Difference (IV, Random, 95% CI) | ‐0.27 [‐0.57, 0.04] |
| 24.2 Not postmenopausal only | 2 | 561 | Std. Mean Difference (IV, Random, 95% CI) | ‐0.21 [‐0.82, 0.40] |
| 25 Overall fatigue (follow‐up values) Show forest plot | 15 | Std. Mean Difference (IV, Random, 95% CI) | Subtotals only | |
| 25.1 Postmenopausal only | 6 | 313 | Std. Mean Difference (IV, Random, 95% CI) | 0.04 [‐0.19, 0.26] |
| 25.2 Not postmenopausal only | 9 | 834 | Std. Mean Difference (IV, Random, 95% CI) | ‐0.53 [‐0.87, ‐0.18] |
| 26 Overall fatigue (change values) Show forest plot | 7 | Std. Mean Difference (IV, Random, 95% CI) | Subtotals only | |
| 26.1 Postmenopausal only | 2 | 70 | Std. Mean Difference (IV, Random, 95% CI) | 0.05 [‐1.55, 1.64] |
| 26.2 Not postmenopausal only | 5 | 954 | Std. Mean Difference (IV, Random, 95% CI) | ‐0.24 [‐0.69, 0.20] |
| 27 Overall pain/disability (follow‐up values) Show forest plot | 2 | Std. Mean Difference (IV, Random, 95% CI) | Subtotals only | |
| 27.1 Postmenopausal only | 1 | 74 | Std. Mean Difference (IV, Random, 95% CI) | ‐0.05 [‐0.51, 0.40] |
| 27.2 Not postmenopausal only | 1 | 38 | Std. Mean Difference (IV, Random, 95% CI) | ‐0.26 [‐0.89, 0.38] |
| 28 Overall pain/disability (change values) Show forest plot | 3 | Std. Mean Difference (IV, Random, 95% CI) | Subtotals only | |
| 28.1 Postmenopausal only | 2 | 157 | Std. Mean Difference (IV, Random, 95% CI) | ‐0.29 [‐0.61, 0.02] |
| 28.2 Not postmenopausal only | 1 | 36 | Std. Mean Difference (IV, Random, 95% CI) | 0.22 [‐0.43, 0.88] |
| 29 Overall cardiorespiratory fitness (follow‐up values) Show forest plot | 9 | Std. Mean Difference (IV, Random, 95% CI) | Subtotals only | |
| 29.1 Postmenopausal only | 4 | 214 | Std. Mean Difference (IV, Random, 95% CI) | 0.61 [0.30, 0.92] |
| 29.2 Not postmenopausal only | 5 | 418 | Std. Mean Difference (IV, Random, 95% CI) | 0.19 [‐0.01, 0.38] |
| 30 Overall cardiorespiratory fitness (change values) Show forest plot | 5 | Std. Mean Difference (IV, Random, 95% CI) | Subtotals only | |
| 30.1 Postmenopausal only | 4 | 208 | Std. Mean Difference (IV, Random, 95% CI) | 1.07 [0.48, 1.67] |
| 30.2 Not postmenopausal only | 1 | 498 | Std. Mean Difference (IV, Random, 95% CI) | 0.16 [‐0.02, 0.33] |
| 31 Overall self‐reported physical activity (follow‐up values) Show forest plot | 10 | Std. Mean Difference (IV, Random, 95% CI) | Subtotals only | |
| 31.1 Postmenopausal only | 5 | 292 | Std. Mean Difference (IV, Random, 95% CI) | 0.63 [0.17, 1.10] |
| 31.2 Not postmenopausal only | 5 | 810 | Std. Mean Difference (IV, Random, 95% CI) | 0.45 [0.16, 0.75] |
| 32 Overall self‐reported physical activity (change values) Show forest plot | 6 | Std. Mean Difference (IV, Random, 95% CI) | Subtotals only | |
| 32.1 Postmenopausal only | 3 | 186 | Std. Mean Difference (IV, Random, 95% CI) | 0.83 [0.53, 1.13] |
| 32.2 Not postmenopausal only | 3 | 901 | Std. Mean Difference (IV, Random, 95% CI) | 0.57 [‐0.02, 1.16] |
| 33 Overall objective physical activity (follow‐up values) Show forest plot | 8 | Std. Mean Difference (IV, Random, 95% CI) | Subtotals only | |
| 33.1 Postmenopausal only | 3 | 145 | Std. Mean Difference (IV, Random, 95% CI) | 0.87 [0.27, 1.46] |
| 33.2 Not postmenopausal only | 5 | 645 | Std. Mean Difference (IV, Random, 95% CI) | 0.19 [‐0.03, 0.42] |
| 34 Overall objective physical activity (change values) Show forest plot | 5 | Std. Mean Difference (IV, Random, 95% CI) | Subtotals only | |
| 34.1 Postmenopausal only | 3 | 145 | Std. Mean Difference (IV, Random, 95% CI) | 0.89 [0.54, 1.24] |
| 34.2 Not postmenopausal only | 2 | 363 | Std. Mean Difference (IV, Random, 95% CI) | 0.45 [‐0.67, 1.58] |
| 35 Mass (follow‐up values) Show forest plot | 8 | Mean Difference (IV, Fixed, 95% CI) | Subtotals only | |
| 35.1 Postmenopausal only | 4 | 222 | Mean Difference (IV, Fixed, 95% CI) | 0.69 [‐3.74, 5.13] |
| 35.2 Not postmenopausal only | 4 | 411 | Mean Difference (IV, Fixed, 95% CI) | 0.08 [‐0.52, 0.68] |
| 36 Mass (change values) Show forest plot | 7 | Mean Difference (IV, Random, 95% CI) | Subtotals only | |
| 36.1 Postmenopausal only | 4 | 202 | Mean Difference (IV, Random, 95% CI) | ‐0.99 [‐1.96, ‐0.02] |
| 36.2 Not postmenopausal only | 3 | 613 | Mean Difference (IV, Random, 95% CI) | 0.11 [‐0.07, 0.29] |
| 37 BMI (follow‐up values) Show forest plot | 9 | Mean Difference (IV, Fixed, 95% CI) | Subtotals only | |
| 37.1 Postmenopausal only | 3 | 161 | Mean Difference (IV, Fixed, 95% CI) | ‐0.60 [‐2.62, 1.42] |
| 37.2 Not postmenopausal only | 6 | 745 | Mean Difference (IV, Fixed, 95% CI) | 0.08 [‐0.13, 0.29] |
| 38 BMI (change values) Show forest plot | 4 | Mean Difference (IV, Random, 95% CI) | Subtotals only | |
| 38.1 Postmenopausal only | 2 | 92 | Mean Difference (IV, Random, 95% CI) | ‐0.17 [‐0.54, 0.20] |
| 38.2 Not postmenopausal only | 2 | 161 | Mean Difference (IV, Random, 95% CI) | ‐0.02 [‐0.09, 0.05] |
| 39 Overall body fat (follow‐up values) Show forest plot | 11 | Std. Mean Difference (IV, Random, 95% CI) | Subtotals only | |
| 39.1 Postmenopausal only | 5 | 264 | Std. Mean Difference (IV, Random, 95% CI) | ‐0.06 [‐0.36, 0.25] |
| 39.2 Not postmenopausal only | 6 | 353 | Std. Mean Difference (IV, Random, 95% CI) | ‐0.22 [‐0.59, 0.15] |
| 40 Overall body fat (change values) Show forest plot | 5 | Std. Mean Difference (IV, Random, 95% CI) | Subtotals only | |
| 40.1 Postmenopausal only | 3 | 128 | Std. Mean Difference (IV, Random, 95% CI) | ‐0.35 [‐0.70, 0.00] |
| 40.2 Not postmenopausal only | 2 | 161 | Std. Mean Difference (IV, Random, 95% CI) | ‐1.67 [‐4.39, 1.05] |
| 41 Lower body strength (follow‐up values) Show forest plot | 6 | Std. Mean Difference (IV, Random, 95% CI) | Subtotals only | |
| 41.1 Postmenopausal only | 1 | 67 | Std. Mean Difference (IV, Random, 95% CI) | 0.19 [‐0.30, 0.67] |
| 41.2 Not postmenopausal only | 5 | 228 | Std. Mean Difference (IV, Random, 95% CI) | 0.46 [0.04, 0.88] |
| 42 Lower body strength (change values) Show forest plot | 3 | Std. Mean Difference (IV, Random, 95% CI) | Subtotals only | |
| 42.1 Postmenopausal only | 2 | 256 | Std. Mean Difference (IV, Random, 95% CI) | 0.70 [‐0.01, 1.41] |
| 42.2 Not postmenopausal only | 1 | 45 | Std. Mean Difference (IV, Random, 95% CI) | 1.27 [0.63, 1.92] |
| 43 Upper body strength (follow‐up values) Show forest plot | 5 | Std. Mean Difference (IV, Random, 95% CI) | Subtotals only | |
| 43.1 Postmenopausal only | 1 | 67 | Std. Mean Difference (IV, Random, 95% CI) | 0.14 [‐0.34, 0.62] |
| 43.2 Not postmenopausal only | 4 | 208 | Std. Mean Difference (IV, Random, 95% CI) | 0.44 [‐0.40, 1.28] |
| 44 Upper body strength (change values) Show forest plot | 4 | Std. Mean Difference (IV, Random, 95% CI) | Subtotals only | |
| 44.1 Postmenopausal only | 2 | 306 | Std. Mean Difference (IV, Random, 95% CI) | 0.25 [0.03, 0.48] |
| 44.2 Not postmenopausal only | 2 | 81 | Std. Mean Difference (IV, Random, 95% CI) | 1.49 [0.04, 2.93] |
| 45 Bone mineral density ‐ femoral neck (follow‐up and change values) Show forest plot | 4 | Std. Mean Difference (IV, Random, 95% CI) | Subtotals only | |
| 45.1 Postmenopausal only | 3 | 329 | Std. Mean Difference (IV, Random, 95% CI) | 0.18 [‐0.39, 0.75] |
| 45.2 Not postmenopausal only | 1 | 457 | Std. Mean Difference (IV, Random, 95% CI) | 0.18 [‐0.00, 0.37] |
| 46 Bone mineral density ‐ lumbar spine (follow‐up and change values) Show forest plot | 4 | Std. Mean Difference (IV, Random, 95% CI) | Subtotals only | |
| 46.1 Postmenopausal only | 3 | 329 | Std. Mean Difference (IV, Random, 95% CI) | 0.27 [‐0.16, 0.70] |
| 46.2 Not postmenopausal only | 1 | 457 | Std. Mean Difference (IV, Random, 95% CI) | 0.09 [‐0.09, 0.27] |
| Outcome or subgroup title | No. of studies | No. of participants | Statistical method | Effect size |
| 1 Overall HRQoL (follow‐up values) Show forest plot | 22 | Std. Mean Difference (IV, Random, 95% CI) | Subtotals only | |
| 1.1 Aerobic exercise interventions | 12 | 971 | Std. Mean Difference (IV, Random, 95% CI) | 0.41 [0.19, 0.63] |
| 1.2 Resistance exercise interventions | 1 | 79 | Std. Mean Difference (IV, Random, 95% CI) | 0.35 [‐0.09, 0.79] |
| 1.3 Combined aerobic and resistance exercise | 7 | 589 | Std. Mean Difference (IV, Random, 95% CI) | 0.63 [0.08, 1.19] |
| 1.4 Yoga, Tai Chi, and Pilates interventions | 3 | 184 | Std. Mean Difference (IV, Random, 95% CI) | 0.11 [‐0.22, 0.45] |
| 2 Overall HRQoL (change values) Show forest plot | 14 | Std. Mean Difference (IV, Random, 95% CI) | Subtotals only | |
| 2.1 Aerobic exercise interventions | 9 | 1280 | Std. Mean Difference (IV, Random, 95% CI) | 0.68 [0.22, 1.15] |
| 2.2 Resistance exercise interventions | 1 | 79 | Std. Mean Difference (IV, Random, 95% CI) | 0.40 [‐0.05, 0.84] |
| 2.3 Combined aerobic and resistance exercise | 4 | 139 | Std. Mean Difference (IV, Random, 95% CI) | 0.69 [0.01, 1.38] |
| 2.4 Yoga, Tai Chi, and Pilates interventions | 1 | 21 | Std. Mean Difference (IV, Random, 95% CI) | 2.88 [1.59, 4.17] |
| 3 Overall emotional function/mental health (follow‐up values) Show forest plot | 26 | Std. Mean Difference (IV, Random, 95% CI) | Subtotals only | |
| 3.1 Aerobic exercise interventions | 14 | 1415 | Std. Mean Difference (IV, Random, 95% CI) | 0.15 [0.04, 0.25] |
| 3.2 Resistance exercise interventions | 2 | 311 | Std. Mean Difference (IV, Random, 95% CI) | 0.08 [‐0.28, 0.44] |
| 3.3 Combined aerobic and resistance exercise | 6 | 263 | Std. Mean Difference (IV, Random, 95% CI) | 0.72 [0.47, 0.97] |
| 3.4 Yoga, Tai Chi, and Pilates interventions | 4 | 113 | Std. Mean Difference (IV, Random, 95% CI) | ‐0.03 [‐0.40, 0.34] |
| 4 Overall emotional function/mental health (change values) Show forest plot | 15 | Std. Mean Difference (IV, Random, 95% CI) | Subtotals only | |
| 4.1 Aerobic exercise | 7 | 701 | Std. Mean Difference (IV, Random, 95% CI) | 0.44 [0.06, 0.82] |
| 4.2 Resistance exercise | 3 | 261 | Std. Mean Difference (IV, Random, 95% CI) | 0.22 [‐0.09, 0.54] |
| 4.3 Combined aerobic and resistance exercise | 4 | 598 | Std. Mean Difference (IV, Random, 95% CI) | ‐0.01 [‐0.38, 0.36] |
| 4.4 Yoga, Tai Chi, and Pilates | 1 | 19 | Std. Mean Difference (IV, Random, 95% CI) | 1.06 [0.08, 2.03] |
| 5 Overall physical function (follow‐up values) Show forest plot | 25 | Std. Mean Difference (IV, Random, 95% CI) | Subtotals only | |
| 5.1 Aerobic exercise | 14 | 1465 | Std. Mean Difference (IV, Random, 95% CI) | 0.28 [0.15, 0.41] |
| 5.2 Resistance exercise | 3 | 372 | Std. Mean Difference (IV, Random, 95% CI) | 0.23 [‐0.11, 0.57] |
| 5.3 Combined aerobic and resistance exercise | 5 | 202 | Std. Mean Difference (IV, Random, 95% CI) | 0.80 [‐0.04, 1.64] |
| 5.4 Yoga, Tai Chi, and Pilates | 3 | 90 | Std. Mean Difference (IV, Random, 95% CI) | 0.16 [‐0.26, 0.57] |
| 6 Overall physical function (change values) Show forest plot | 13 | Std. Mean Difference (IV, Random, 95% CI) | Subtotals only | |
| 6.1 Aerobic exercise | 7 | 1116 | Std. Mean Difference (IV, Random, 95% CI) | 0.72 [0.14, 1.30] |
| 6.2 Resistance exercise | 3 | 261 | Std. Mean Difference (IV, Random, 95% CI) | 0.24 [‐0.17, 0.65] |
| 6.3 Combined aerobic and resistance exercise | 2 | 37 | Std. Mean Difference (IV, Random, 95% CI) | 0.75 [‐0.22, 1.73] |
| 6.4 Yoga, Tai Chi, and Pilates | 1 | 19 | Std. Mean Difference (IV, Random, 95% CI) | 0.93 [‐0.03, 1.89] |
| 7 Overall role function (follow‐up values) Show forest plot | 18 | Std. Mean Difference (IV, Random, 95% CI) | Subtotals only | |
| 7.1 Aerobic exercise | 10 | 1043 | Std. Mean Difference (IV, Random, 95% CI) | 0.28 [0.12, 0.44] |
| 7.2 Resistance exercise | 1 | 79 | Std. Mean Difference (IV, Random, 95% CI) | 0.12 [‐0.32, 0.57] |
| 7.3 Combined aerobic and resistance exercise | 3 | 136 | Std. Mean Difference (IV, Random, 95% CI) | 0.61 [‐1.15, 2.37] |
| 7.4 Yoga, Tai Chi, and Pilates | 4 | 112 | Std. Mean Difference (IV, Random, 95% CI) | 0.11 [‐0.26, 0.48] |
| 8 Overall role function (change values) Show forest plot | 12 | Std. Mean Difference (IV, Random, 95% CI) | Subtotals only | |
| 8.1 Aerobic exercise | 7 | 1118 | Std. Mean Difference (IV, Random, 95% CI) | 0.16 [‐0.10, 0.43] |
| 8.2 Resistance exercise | 2 | 141 | Std. Mean Difference (IV, Random, 95% CI) | 0.17 [‐0.32, 0.65] |
| 8.3 Combined aerobic and resistance exercise | 2 | 37 | Std. Mean Difference (IV, Random, 95% CI) | 0.12 [‐0.52, 0.77] |
| 8.4 Yoga, Tai Chi, and Pilates | 1 | 19 | Std. Mean Difference (IV, Random, 95% CI) | ‐0.15 [‐1.05, 0.76] |
| 9 Overall social well‐being/function (follow‐up values) Show forest plot | 18 | Std. Mean Difference (IV, Random, 95% CI) | Subtotals only | |
| 9.1 Aerobic exercise | 10 | 1044 | Std. Mean Difference (IV, Random, 95% CI) | 0.18 [0.04, 0.31] |
| 9.2 Resistance exercise | 1 | 121 | Std. Mean Difference (IV, Random, 95% CI) | 0.14 [‐0.21, 0.50] |
| 9.3 Combined aerobic and resistance exercise | 3 | 116 | Std. Mean Difference (IV, Random, 95% CI) | 0.45 [‐0.16, 1.05] |
| 9.4 Yoga, Tai Chi, and Pilates | 4 | 276 | Std. Mean Difference (IV, Random, 95% CI) | 0.10 [‐0.13, 0.34] |
| 10 Overall social well‐being/function (change values) Show forest plot | 12 | Std. Mean Difference (IV, Random, 95% CI) | Subtotals only | |
| 10.1 Aerobic exercise | 7 | 1119 | Std. Mean Difference (IV, Random, 95% CI) | 0.60 [0.07, 1.13] |
| 10.2 Resistance exercise | 2 | 183 | Std. Mean Difference (IV, Random, 95% CI) | 0.11 [‐0.19, 0.41] |
| 10.3 Combined aerobic and resistance exercise | 2 | 63 | Std. Mean Difference (IV, Random, 95% CI) | 0.66 [0.15, 1.17] |
| 10.4 Yoga, Tai Chi, and Pilates | 1 | 19 | Std. Mean Difference (IV, Random, 95% CI) | 0.76 [‐0.18, 1.70] |
| 11 Overall cognitive function (follow‐up values) Show forest plot | 5 | Std. Mean Difference (IV, Random, 95% CI) | Subtotals only | |
| 11.1 Aerobic exercise | 2 | 94 | Std. Mean Difference (IV, Random, 95% CI) | 0.24 [‐0.17, 0.65] |
| 11.2 Resistance exercise | 0 | 0 | Std. Mean Difference (IV, Random, 95% CI) | 0.0 [0.0, 0.0] |
| 11.3 Combined aerobic and resistance exercise | 3 | 95 | Std. Mean Difference (IV, Random, 95% CI) | 0.57 [0.15, 0.98] |
| 11.4 Yoga, Tai Chi, and Pilates | 0 | 0 | Std. Mean Difference (IV, Random, 95% CI) | 0.0 [0.0, 0.0] |
| 12 Overall cognitive function (change values) Show forest plot | 5 | Std. Mean Difference (IV, Random, 95% CI) | Subtotals only | |
| 12.1 Aerobic exercise | 2 | 95 | Std. Mean Difference (IV, Random, 95% CI) | 0.08 [‐0.50, 0.65] |
| 12.2 Resistance exercise | 0 | 0 | Std. Mean Difference (IV, Random, 95% CI) | 0.0 [0.0, 0.0] |
| 12.3 Combined aerobic and resistance exercise | 3 | 577 | Std. Mean Difference (IV, Random, 95% CI) | ‐0.01 [‐0.38, 0.35] |
| 12.4 Yoga, Tai Chi, and Pilates | 0 | 0 | Std. Mean Difference (IV, Random, 95% CI) | 0.0 [0.0, 0.0] |
| 13 Overall general health (follow‐up values) Show forest plot | 10 | Std. Mean Difference (IV, Random, 95% CI) | Subtotals only | |
| 13.1 Aerobic exercise | 6 | 293 | Std. Mean Difference (IV, Random, 95% CI) | 0.11 [‐0.29, 0.51] |
| 13.2 Resistance exercise | 1 | 79 | Std. Mean Difference (IV, Random, 95% CI) | 0.10 [‐0.34, 0.55] |
| 13.3 Combined aerobic and resistance exercise | 3 | 118 | Std. Mean Difference (IV, Random, 95% CI) | 0.46 [0.00, 0.91] |
| 13.4 Yoga, Tai Chi, and Pilates | 1 | 18 | Std. Mean Difference (IV, Random, 95% CI) | ‐0.18 [‐1.11, 0.74] |
| 14 Overall general health (change values) Show forest plot | 9 | Std. Mean Difference (IV, Fixed, 95% CI) | Subtotals only | |
| 14.1 Aerobic exercise | 5 | 710 | Std. Mean Difference (IV, Fixed, 95% CI) | ‐0.02 [‐0.17, 0.13] |
| 14.2 Resistance exercise | 2 | 141 | Std. Mean Difference (IV, Fixed, 95% CI) | 0.23 [‐0.12, 0.57] |
| 14.3 Combined aerobic and resistance exercise | 2 | 76 | Std. Mean Difference (IV, Fixed, 95% CI) | 0.66 [0.17, 1.16] |
| 14.4 Yoga, Tai Chi, and Pilates | 1 | 19 | Std. Mean Difference (IV, Fixed, 95% CI) | ‐0.20 [‐1.10, 0.71] |
| 15 Overall sexual function (follow‐up values) Show forest plot | 5 | Std. Mean Difference (IV, Fixed, 95% CI) | Subtotals only | |
| 15.1 Aerobic exercise | 2 | 136 | Std. Mean Difference (IV, Fixed, 95% CI) | ‐0.00 [‐0.34, 0.34] |
| 15.2 Resistance exercise | 2 | 193 | Std. Mean Difference (IV, Fixed, 95% CI) | 0.21 [‐0.07, 0.49] |
| 15.3 Combined aerobic and resistance exercise | 1 | 82 | Std. Mean Difference (IV, Fixed, 95% CI) | 0.29 [‐0.14, 0.73] |
| 15.4 Yoga, Tai Chi, and Pilates | 0 | 0 | Std. Mean Difference (IV, Fixed, 95% CI) | 0.0 [0.0, 0.0] |
| 16 Overall sexual function (change values) Show forest plot | 3 | Mean Difference (IV, Random, 95% CI) | Subtotals only | |
| 16.1 Aerobic exercise | 1 | 500 | Mean Difference (IV, Random, 95% CI) | 0.5 [‐3.86, 4.86] |
| 16.2 Resistance exercise | 2 | 193 | Mean Difference (IV, Random, 95% CI) | 3.83 [‐1.83, 9.48] |
| 16.3 Combined aerobic and resistance exercise | 0 | 0 | Mean Difference (IV, Random, 95% CI) | 0.0 [0.0, 0.0] |
| 16.4 Yoga, Tai Chi, and Pilates | 0 | 0 | Mean Difference (IV, Random, 95% CI) | 0.0 [0.0, 0.0] |
| 17 Overall sleep (follow‐up values) Show forest plot | 5 | Std. Mean Difference (IV, Fixed, 95% CI) | Subtotals only | |
| 17.1 Aerobic exercise | 2 | 95 | Std. Mean Difference (IV, Fixed, 95% CI) | ‐0.18 [‐0.59, 0.23] |
| 17.2 Resistance exercise | 0 | 0 | Std. Mean Difference (IV, Fixed, 95% CI) | 0.0 [0.0, 0.0] |
| 17.3 Combined aerobic and resistance exercise | 2 | 62 | Std. Mean Difference (IV, Fixed, 95% CI) | ‐0.07 [‐0.57, 0.43] |
| 17.4 Yoga, Tai Chi, and Pilates | 1 | 31 | Std. Mean Difference (IV, Fixed, 95% CI) | 0.15 [‐0.55, 0.86] |
| 18 Overall sleep (change values) Show forest plot | 3 | Std. Mean Difference (IV, Random, 95% CI) | Subtotals only | |
| 18.1 Aerobic exercise | 2 | 94 | Std. Mean Difference (IV, Random, 95% CI) | 0.10 [‐0.30, 0.51] |
| 18.2 Resistance exercise | 0 | 0 | Std. Mean Difference (IV, Random, 95% CI) | 0.0 [0.0, 0.0] |
| 18.3 Combined aerobic and resistance exercise | 1 | 42 | Std. Mean Difference (IV, Random, 95% CI) | 0.23 [‐0.38, 0.84] |
| 18.4 Yoga, Tai Chi, and Pilates | 0 | 0 | Std. Mean Difference (IV, Random, 95% CI) | 0.0 [0.0, 0.0] |
| 19 Overall anxiety (follow‐up values) Show forest plot | 7 | Std. Mean Difference (IV, Random, 95% CI) | Subtotals only | |
| 19.1 Aerobic exercise | 4 | 205 | Std. Mean Difference (IV, Random, 95% CI) | ‐0.76 [‐1.37, ‐0.14] |
| 19.2 Resistance exercise | 0 | 0 | Std. Mean Difference (IV, Random, 95% CI) | 0.0 [0.0, 0.0] |
| 19.3 Combined aerobic and resistance exercise | 3 | 121 | Std. Mean Difference (IV, Random, 95% CI) | ‐0.40 [‐0.87, 0.07] |
| 19.4 Yoga, Tai Chi, and Pilates | 0 | 0 | Std. Mean Difference (IV, Random, 95% CI) | 0.0 [0.0, 0.0] |
| 20 Overall anxiety (change values) Show forest plot | 4 | Std. Mean Difference (IV, Fixed, 95% CI) | Subtotals only | |
| 20.1 Aerobic exercise | 2 | 132 | Std. Mean Difference (IV, Fixed, 95% CI) | ‐0.27 [‐0.61, 0.07] |
| 20.2 Resistance exercise | 0 | 0 | Std. Mean Difference (IV, Fixed, 95% CI) | 0.0 [0.0, 0.0] |
| 20.3 Combined aerobic and resistance exercise | 2 | 103 | Std. Mean Difference (IV, Fixed, 95% CI) | ‐0.51 [‐0.90, ‐0.12] |
| 20.4 Yoga, Tai Chi, and Pilates | 0 | 0 | Std. Mean Difference (IV, Fixed, 95% CI) | 0.0 [0.0, 0.0] |
| 21 Overall depression (follow‐up values) Show forest plot | 12 | Std. Mean Difference (IV, Random, 95% CI) | Subtotals only | |
| 21.1 Aerobic exercise | 6 | 273 | Std. Mean Difference (IV, Random, 95% CI) | ‐0.32 [‐0.78, 0.14] |
| 21.2 Resistance exercise | 0 | 0 | Std. Mean Difference (IV, Random, 95% CI) | 0.0 [0.0, 0.0] |
| 21.3 Combined aerobic and resistance exercise | 5 | 187 | Std. Mean Difference (IV, Random, 95% CI) | ‐0.33 [‐0.90, 0.24] |
| 21.4 Yoga, Tai Chi, and Pilates | 2 | 217 | Std. Mean Difference (IV, Random, 95% CI) | ‐0.23 [‐0.61, 0.14] |
| 22 Overall depression (change values) Show forest plot | 7 | Std. Mean Difference (IV, Random, 95% CI) | Subtotals only | |
| 22.1 Aerobic exercise | 4 | 672 | Std. Mean Difference (IV, Random, 95% CI) | ‐0.18 [‐0.48, 0.11] |
| 22.2 Resistance exercise | 0 | 0 | Std. Mean Difference (IV, Random, 95% CI) | 0.0 [0.0, 0.0] |
| 22.3 Combined aerobic and resistance exercise | 4 | 164 | Std. Mean Difference (IV, Random, 95% CI) | ‐0.47 [‐0.92, ‐0.02] |
| 22.4 Yoga, Tai Chi, and Pilates | 0 | 0 | Std. Mean Difference (IV, Random, 95% CI) | 0.0 [0.0, 0.0] |
| 23 Overall fatigue (follow‐up values) Show forest plot | 25 | Std. Mean Difference (IV, Random, 95% CI) | Subtotals only | |
| 23.1 Aerobic exercise | 11 | 925 | Std. Mean Difference (IV, Random, 95% CI) | ‐0.24 [‐0.41, ‐0.07] |
| 23.2 Resistance exercise | 1 | 67 | Std. Mean Difference (IV, Random, 95% CI) | 0.23 [‐0.25, 0.72] |
| 23.3 Combined aerobic and resistance exercise | 9 | 642 | Std. Mean Difference (IV, Random, 95% CI) | ‐0.48 [‐0.83, ‐0.13] |
| 23.4 Yoga, Tai Chi, and Pilates | 5 | 311 | Std. Mean Difference (IV, Random, 95% CI) | ‐0.36 [‐0.58, ‐0.13] |
| 24 Overall fatigue (change values) Show forest plot | 12 | Std. Mean Difference (IV, Random, 95% CI) | Subtotals only | |
| 24.1 Aerobic exercise | 7 | 1130 | Std. Mean Difference (IV, Random, 95% CI) | ‐0.08 [‐0.38, 0.23] |
| 24.2 Resistance exercise | 0 | 0 | Std. Mean Difference (IV, Random, 95% CI) | 0.0 [0.0, 0.0] |
| 24.3 Combined aerobic and resistance exercise | 4 | 118 | Std. Mean Difference (IV, Random, 95% CI) | ‐0.81 [‐1.57, ‐0.05] |
| 24.4 Yoga, Tai Chi, and Pilates | 1 | 23 | Std. Mean Difference (IV, Random, 95% CI) | ‐0.07 [‐0.89, 0.75] |
| 25 Overall pain/disability (follow‐up values) Show forest plot | 9 | Std. Mean Difference (IV, Random, 95% CI) | Subtotals only | |
| 25.1 Aerobic exercise | 5 | 397 | Std. Mean Difference (IV, Random, 95% CI) | 0.11 [‐0.15, 0.37] |
| 25.2 Resistance exercise | 0 | 0 | Std. Mean Difference (IV, Random, 95% CI) | 0.0 [0.0, 0.0] |
| 25.3 Combined aerobic and resistance exercise | 2 | 96 | Std. Mean Difference (IV, Random, 95% CI) | 0.13 [‐0.29, 0.54] |
| 25.4 Yoga, Tai Chi, and Pilates | 2 | 42 | Std. Mean Difference (IV, Random, 95% CI) | ‐0.18 [‐0.78, 0.43] |
| 26 Overall pain/disability (change values) Show forest plot | 5 | Std. Mean Difference (IV, Random, 95% CI) | Subtotals only | |
| 26.1 Aerobic exercise | 2 | 132 | Std. Mean Difference (IV, Random, 95% CI) | ‐0.03 [‐0.44, 0.39] |
| 26.2 Resistance exercise | 1 | 62 | Std. Mean Difference (IV, Random, 95% CI) | 0.22 [‐0.33, 0.76] |
| 26.3 Combined aerobic and resistance exercise | 1 | 83 | Std. Mean Difference (IV, Random, 95% CI) | ‐0.35 [‐0.79, 0.08] |
| 26.4 Yoga, Tai Chi, and Pilates | 1 | 19 | Std. Mean Difference (IV, Random, 95% CI) | ‐0.15 [‐1.06, 0.75] |
| 27 Overall self‐esteem/body image (follow‐up values) Show forest plot | 12 | Std. Mean Difference (IV, Random, 95% CI) | Subtotals only | |
| 27.1 Aerobic exercise | 7 | 364 | Std. Mean Difference (IV, Random, 95% CI) | 0.29 [‐0.07, 0.64] |
| 27.2 Resistance exercise | 2 | 143 | Std. Mean Difference (IV, Random, 95% CI) | 0.06 [‐0.27, 0.39] |
| 27.3 Combined aerobic and resistance exercise | 4 | 161 | Std. Mean Difference (IV, Random, 95% CI) | 0.14 [‐0.46, 0.74] |
| 27.4 Yoga, Tai Chi, and Pilates | 1 | 23 | Std. Mean Difference (IV, Random, 95% CI) | 0.20 [‐0.62, 1.02] |
| 28 Overall self‐esteem/body image (change values) Show forest plot | 9 | Std. Mean Difference (IV, Random, 95% CI) | Subtotals only | |
| 28.1 Aerobic exercise | 6 | 771 | Std. Mean Difference (IV, Random, 95% CI) | 0.14 [‐0.12, 0.39] |
| 28.2 Resistance exercise | 2 | 143 | Std. Mean Difference (IV, Random, 95% CI) | ‐0.29 [‐0.88, 0.30] |
| 28.3 Combined aerobic and resistance exercise | 2 | 81 | Std. Mean Difference (IV, Random, 95% CI) | 0.10 [‐0.54, 0.75] |
| 28.4 Yoga, Tai Chi, and Pilates | 1 | 21 | Std. Mean Difference (IV, Random, 95% CI) | 3.42 [1.99, 4.86] |
| 29 Overall cardiorespiratory fitness (follow‐up values) Show forest plot | 23 | Std. Mean Difference (IV, Random, 95% CI) | Subtotals only | |
| 29.1 Aerobic exercise | 12 | 814 | Std. Mean Difference (IV, Random, 95% CI) | 0.37 [0.21, 0.54] |
| 29.2 Resistance exercise | 1 | 21 | Std. Mean Difference (IV, Random, 95% CI) | 0.27 [‐0.60, 1.14] |
| 29.3 Combined aerobic and resistance exercise | 11 | 433 | Std. Mean Difference (IV, Random, 95% CI) | 0.56 [0.30, 0.81] |
| 29.4 Yoga, Tai Chi, and Pilates | 1 | 21 | Std. Mean Difference (IV, Random, 95% CI) | 0.39 [‐0.48, 1.25] |
| 30 Overall cardiorespiratory fitness (change values) Show forest plot | 9 | Std. Mean Difference (IV, Random, 95% CI) | Subtotals only | |
| 30.1 Aerobic exercise | 5 | 685 | Std. Mean Difference (IV, Random, 95% CI) | 0.79 [0.17, 1.42] |
| 30.2 Resistance exercise | 1 | 21 | Std. Mean Difference (IV, Random, 95% CI) | ‐0.04 [‐0.91, 0.82] |
| 30.3 Combined aerobic and resistance exercise | 5 | 181 | Std. Mean Difference (IV, Random, 95% CI) | 0.75 [0.18, 1.31] |
| 30.4 Yoga, Tai Chi, and Pilates | 0 | 0 | Std. Mean Difference (IV, Random, 95% CI) | 0.0 [0.0, 0.0] |
| 31 Overall self‐reported physical activity (follow‐up values) Show forest plot | 17 | Std. Mean Difference (IV, Random, 95% CI) | Subtotals only | |
| 31.1 Aerobic exercise | 10 | 1011 | Std. Mean Difference (IV, Random, 95% CI) | 0.69 [0.44, 0.94] |
| 31.2 Resistance exercise | 2 | 331 | Std. Mean Difference (IV, Random, 95% CI) | 0.08 [‐0.13, 0.30] |
| 31.3 Combined aerobic and resistance exercise | 3 | 421 | Std. Mean Difference (IV, Random, 95% CI) | 0.53 [‐0.05, 1.10] |
| 31.4 Yoga, Tai Chi, and Pilates | 2 | 249 | Std. Mean Difference (IV, Random, 95% CI) | 0.33 [0.08, 0.58] |
| 32 Overall self‐reported physical activity (change values) Show forest plot | 8 | Std. Mean Difference (IV, Random, 95% CI) | Subtotals only | |
| 32.1 Aerobic exercise | 6 | 1086 | Std. Mean Difference (IV, Random, 95% CI) | 0.59 [0.20, 0.97] |
| 32.2 Resistance exercise | 1 | 105 | Std. Mean Difference (IV, Random, 95% CI) | 0.21 [‐0.17, 0.60] |
| 32.3 Combined aerobic and resistance exercise | 1 | 83 | Std. Mean Difference (IV, Random, 95% CI) | 0.94 [0.48, 1.40] |
| 32.4 Yoga, Tai Chi, and Pilates | 0 | 0 | Std. Mean Difference (IV, Random, 95% CI) | 0.0 [0.0, 0.0] |
| 33 Overall objective physical activity (follow‐up values) Show forest plot | 11 | Std. Mean Difference (IV, Random, 95% CI) | Subtotals only | |
| 33.1 Aerobic exercise | 8 | 876 | Std. Mean Difference (IV, Random, 95% CI) | 0.43 [0.15, 0.70] |
| 33.2 Resistance exercise | 0 | 0 | Std. Mean Difference (IV, Random, 95% CI) | 0.0 [0.0, 0.0] |
| 33.3 Combined aerobic and resistance exercise | 3 | 394 | Std. Mean Difference (IV, Random, 95% CI) | 0.54 [‐0.31, 1.40] |
| 33.4 Yoga, Tai Chi, and Pilates | 0 | 0 | Std. Mean Difference (IV, Random, 95% CI) | 0.0 [0.0, 0.0] |
| 34 Overall objective physical activity (change values) Show forest plot | 5 | Std. Mean Difference (IV, Random, 95% CI) | Subtotals only | |
| 34.1 Aerobic exercise | 4 | 466 | Std. Mean Difference (IV, Random, 95% CI) | 0.61 [‐0.01, 1.23] |
| 34.2 Resistance exercise | 0 | 0 | Std. Mean Difference (IV, Random, 95% CI) | 0.0 [0.0, 0.0] |
| 34.3 Combined aerobic and resistance exercise | 1 | 42 | Std. Mean Difference (IV, Random, 95% CI) | 1.13 [0.47, 1.78] |
| 34.4 Yoga, Tai Chi, and Pilates | 0 | 0 | Std. Mean Difference (IV, Random, 95% CI) | 0.0 [0.0, 0.0] |
| 35 Mass (follow‐up values) Show forest plot | 16 | Mean Difference (IV, Fixed, 95% CI) | Subtotals only | |
| 35.1 Aerobic exercise | 7 | 411 | Mean Difference (IV, Fixed, 95% CI) | ‐1.29 [‐4.06, 1.47] |
| 35.2 Resistance exercise | 3 | 410 | Mean Difference (IV, Fixed, 95% CI) | 0.26 [‐0.67, 1.20] |
| 35.3 Combined aerobic and resistance exercise | 3 | 127 | Mean Difference (IV, Fixed, 95% CI) | ‐2.46 [‐7.24, 2.33] |
| 35.4 Yoga, Tai Chi, and Pilates | 3 | 262 | Mean Difference (IV, Fixed, 95% CI) | ‐0.01 [‐0.78, 0.76] |
| 36 Mass (change values) Show forest plot | 11 | Mean Difference (IV, Random, 95% CI) | Subtotals only | |
| 36.1 Aerobic exercise | 5 | 679 | Mean Difference (IV, Random, 95% CI) | ‐0.74 [‐1.58, 0.09] |
| 36.2 Resistance exercise | 2 | 209 | Mean Difference (IV, Random, 95% CI) | 0.10 [‐0.15, 0.34] |
| 36.3 Combined aerobic and resistance exercise | 3 | 140 | Mean Difference (IV, Random, 95% CI) | ‐0.55 [‐1.99, 0.90] |
| 36.4 Yoga, Tai Chi, and Pilates | 1 | 19 | Mean Difference (IV, Random, 95% CI) | ‐0.90 [‐2.40, 0.60] |
| 37 BMI (follow‐up values) Show forest plot | 17 | Mean Difference (IV, Fixed, 95% CI) | Subtotals only | |
| 37.1 Aerobic exercise | 6 | 639 | Mean Difference (IV, Fixed, 95% CI) | ‐0.41 [‐1.26, 0.43] |
| 37.2 Resistance exercise | 2 | 343 | Mean Difference (IV, Fixed, 95% CI) | 0.17 [‐0.15, 0.48] |
| 37.3 Combined aerobic and resistance exercise | 6 | 237 | Mean Difference (IV, Fixed, 95% CI) | ‐1.03 [‐2.63, 0.56] |
| 37.4 Yoga, Tai Chi, and Pilates | 3 | 262 | Mean Difference (IV, Fixed, 95% CI) | ‐0.03 [‐0.32, 0.26] |
| 38 BMI (change values) Show forest plot | 8 | Mean Difference (IV, Random, 95% CI) | Subtotals only | |
| 38.1 Aerobic exercise | 2 | 112 | Mean Difference (IV, Random, 95% CI) | ‐0.48 [‐0.84, ‐0.13] |
| 38.2 Resistance exercise | 2 | 209 | Mean Difference (IV, Random, 95% CI) | ‐0.01 [‐0.08, 0.06] |
| 38.3 Combined aerobic and resistance exercise | 3 | 145 | Mean Difference (IV, Random, 95% CI) | ‐0.02 [‐0.28, 0.24] |
| 38.4 Yoga, Tai Chi, and Pilates | 1 | 19 | Mean Difference (IV, Random, 95% CI) | ‐0.71 [‐1.33, ‐0.09] |
| 39 Overall body fat (follow‐up values) Show forest plot | 18 | Std. Mean Difference (IV, Random, 95% CI) | Subtotals only | |
| 39.1 Aerobic exercise | 10 | 551 | Std. Mean Difference (IV, Random, 95% CI) | ‐0.11 [‐0.28, 0.06] |
| 39.2 Resistance exercise | 4 | 429 | Std. Mean Difference (IV, Random, 95% CI) | ‐0.26 [‐0.81, 0.28] |
| 39.3 Combined aerobic and resistance exercise | 5 | 185 | Std. Mean Difference (IV, Random, 95% CI) | ‐0.13 [‐0.42, 0.16] |
| 39.4 Yoga, Tai Chi, and Pilates | 1 | 21 | Std. Mean Difference (IV, Random, 95% CI) | ‐0.66 [‐1.54, 0.23] |
| 40 Overall body fat (change values) Show forest plot | 9 | Std. Mean Difference (IV, Random, 95% CI) | Subtotals only | |
| 40.1 Aerobic exercise | 3 | 108 | Std. Mean Difference (IV, Random, 95% CI) | ‐0.43 [‐0.82, ‐0.05] |
| 40.2 Resistance exercise | 3 | 228 | Std. Mean Difference (IV, Random, 95% CI) | ‐1.38 [‐3.39, 0.63] |
| 40.3 Combined aerobic and resistance exercise | 4 | 168 | Std. Mean Difference (IV, Random, 95% CI) | ‐0.30 [‐0.61, 0.00] |
| 40.4 Yoga, Tai Chi, and Pilates | 1 | 19 | Std. Mean Difference (IV, Random, 95% CI) | ‐0.18 [‐1.09, 0.72] |
| 41 Lower body strength (follow‐up values) Show forest plot | 10 | Std. Mean Difference (IV, Random, 95% CI) | Subtotals only | |
| 41.1 Aerobic exercise | 3 | 125 | Std. Mean Difference (IV, Random, 95% CI) | 0.75 [‐0.20, 1.69] |
| 41.2 Resistance exercise | 3 | 344 | Std. Mean Difference (IV, Random, 95% CI) | 0.72 [0.22, 1.23] |
| 41.3 Combined aerobic and resistance exercise | 4 | 168 | Std. Mean Difference (IV, Random, 95% CI) | 0.05 [‐0.28, 0.38] |
| 41.4 Yoga, Tai Chi, and Pilates | 0 | 0 | Std. Mean Difference (IV, Random, 95% CI) | 0.0 [0.0, 0.0] |
| 42 Lower body strength (change values) Show forest plot | 8 | Std. Mean Difference (IV, Random, 95% CI) | Subtotals only | |
| 42.1 Aerobic exercise | 1 | 33 | Std. Mean Difference (IV, Random, 95% CI) | 1.17 [0.37, 1.97] |
| 42.2 Resistance exercise | 4 | 562 | Std. Mean Difference (IV, Random, 95% CI) | 0.85 [0.48, 1.22] |
| 42.3 Combined aerobic and resistance exercise | 3 | 125 | Std. Mean Difference (IV, Random, 95% CI) | 0.28 [‐0.37, 0.93] |
| 42.4 Yoga, Tai Chi, and Pilates | 0 | 0 | Std. Mean Difference (IV, Random, 95% CI) | 0.0 [0.0, 0.0] |
| 43 Upper body strength (follow‐up values) Show forest plot | 13 | Std. Mean Difference (IV, Random, 95% CI) | Subtotals only | |
| 43.1 Aerobic exercise | 5 | 175 | Std. Mean Difference (IV, Random, 95% CI) | 0.35 [0.05, 0.65] |
| 43.2 Resistance exercise | 4 | 365 | Std. Mean Difference (IV, Random, 95% CI) | 0.80 [0.28, 1.33] |
| 43.3 Combined aerobic and resistance exercise | 5 | 231 | Std. Mean Difference (IV, Random, 95% CI) | 0.25 [‐0.47, 0.97] |
| 43.4 Yoga, Tai Chi, and Pilates | 1 | 21 | Std. Mean Difference (IV, Random, 95% CI) | 0.60 [‐0.28, 1.49] |
| 44 Upper body strength (change values) Show forest plot | 8 | Std. Mean Difference (IV, Random, 95% CI) | Subtotals only | |
| 44.1 Aerobic exercise | 1 | 22 | Std. Mean Difference (IV, Random, 95% CI) | 0.36 [‐0.48, 1.21] |
| 44.2 Resistance exercise | 5 | 583 | Std. Mean Difference (IV, Random, 95% CI) | 0.96 [0.43, 1.49] |
| 44.3 Combined aerobic and resistance exercise | 3 | 168 | Std. Mean Difference (IV, Random, 95% CI) | 0.07 [‐0.34, 0.48] |
| 44.4 Yoga, Tai Chi, and Pilates | 1 | 83 | Std. Mean Difference (IV, Random, 95% CI) | 1.30 [0.82, 1.78] |
| 45 Bone mineral density ‐ femoral neck (follow‐up and change values) Show forest plot | 4 | Std. Mean Difference (IV, Random, 95% CI) | Subtotals only | |
| 45.1 Aerobic exercise | 1 | 457 | Std. Mean Difference (IV, Random, 95% CI) | 0.18 [‐0.00, 0.37] |
| 45.2 Resistance exercise | 2 | 290 | Std. Mean Difference (IV, Random, 95% CI) | 0.41 [‐0.09, 0.91] |
| 45.3 Combined aerobic and resistance exercise | 1 | 39 | Std. Mean Difference (IV, Random, 95% CI) | ‐0.37 [‐1.00, 0.27] |
| 45.4 Yoga, Tai Chi, and Pilates | 0 | 0 | Std. Mean Difference (IV, Random, 95% CI) | 0.0 [0.0, 0.0] |
| 46 Bone mineral density ‐ lumbar spine (follow‐up and change values) Show forest plot | 4 | Std. Mean Difference (IV, Random, 95% CI) | Subtotals only | |
| 46.1 Aerobic exercise | 1 | 457 | Std. Mean Difference (IV, Random, 95% CI) | 0.09 [‐0.09, 0.27] |
| 46.2 Resistance exercise | 2 | 290 | Std. Mean Difference (IV, Random, 95% CI) | 0.49 [0.25, 0.72] |
| 46.3 Combined aerobic and resistance exercise | 1 | 39 | Std. Mean Difference (IV, Random, 95% CI) | ‐0.26 [‐0.89, 0.37] |
| 46.4 Yoga, Tai Chi, and Pilates | 0 | 0 | Std. Mean Difference (IV, Random, 95% CI) | 0.0 [0.0, 0.0] |
| 47 Bone mineral density ‐ total hip (follow‐up and change values) Show forest plot | 3 | Std. Mean Difference (IV, Random, 95% CI) | Subtotals only | |
| 47.1 Aerobic exercise | 0 | 0 | Std. Mean Difference (IV, Random, 95% CI) | 0.0 [0.0, 0.0] |
| 47.2 Resistance exercise | 2 | 290 | Std. Mean Difference (IV, Random, 95% CI) | 0.64 [‐0.20, 1.48] |
| 47.3 Combined aerobic and resistance exercise | 1 | 39 | Std. Mean Difference (IV, Random, 95% CI) | 10.34 [7.84, 12.84] |
| 47.4 Yoga, Tai Chi, and Pilates | 0 | 0 | Std. Mean Difference (IV, Random, 95% CI) | 0.0 [0.0, 0.0] |
| Outcome or subgroup title | No. of studies | No. of participants | Statistical method | Effect size |
| 1 Overall HRQoL (follow‐up values) Show forest plot | 22 | Std. Mean Difference (IV, Random, 95% CI) | Subtotals only | |
| 1.1 Light‐to‐moderate intensity | 16 | 983 | Std. Mean Difference (IV, Random, 95% CI) | 0.51 [0.25, 0.77] |
| 1.2 Moderate‐to‐high intensity | 6 | 820 | Std. Mean Difference (IV, Random, 95% CI) | 0.19 [‐0.05, 0.43] |
| 2 Overall HRQoL (change values) Show forest plot | 14 | Std. Mean Difference (IV, Random, 95% CI) | Subtotals only | |
| 2.1 Light‐to‐moderate intensity | 10 | 534 | Std. Mean Difference (IV, Random, 95% CI) | 0.99 [0.39, 1.60] |
| 2.2 Moderate‐to‐high intensity | 4 | 925 | Std. Mean Difference (IV, Random, 95% CI) | 0.28 [‐0.11, 0.67] |
| 3 Overall emotional function/mental health (follow‐up values) Show forest plot | 26 | Std. Mean Difference (IV, Random, 95% CI) | Subtotals only | |
| 3.1 Light‐to‐moderate intensity | 21 | 1489 | Std. Mean Difference (IV, Random, 95% CI) | 0.19 [0.08, 0.30] |
| 3.2 Moderate‐to‐high intensity | 5 | 613 | Std. Mean Difference (IV, Random, 95% CI) | 0.29 [‐0.07, 0.65] |
| 4 Overall emotional function/mental health (change values) Show forest plot | 15 | Std. Mean Difference (IV, Random, 95% CI) | Subtotals only | |
| 4.1 Light‐to‐moderate intensity | 10 | 592 | Std. Mean Difference (IV, Random, 95% CI) | 0.41 [0.04, 0.77] |
| 4.2 Moderate‐to‐high intensity | 5 | 987 | Std. Mean Difference (IV, Random, 95% CI) | 0.07 [‐0.07, 0.21] |
| 5 Overall physical function (follow‐up values) Show forest plot | 25 | Std. Mean Difference (IV, Random, 95% CI) | Subtotals only | |
| 5.1 Light‐to‐moderate intensity | 20 | 1466 | Std. Mean Difference (IV, Random, 95% CI) | 0.38 [0.19, 0.58] |
| 5.2 Moderate‐to‐high intensity | 5 | 663 | Std. Mean Difference (IV, Random, 95% CI) | 0.14 [‐0.02, 0.30] |
| 6 Overall physical function (change values) Show forest plot | 13 | Std. Mean Difference (IV, Random, 95% CI) | Subtotals only | |
| 6.1 Light‐to‐moderate intensity | 8 | 449 | Std. Mean Difference (IV, Random, 95% CI) | 0.81 [0.11, 1.51] |
| 6.2 Moderate‐to‐high intensity | 5 | 984 | Std. Mean Difference (IV, Random, 95% CI) | 0.28 [‐0.06, 0.62] |
| 7 Overall role function (follow‐up values) Show forest plot | 18 | Std. Mean Difference (IV, Random, 95% CI) | Subtotals only | |
| 7.1 Light‐to‐moderate intensity | 14 | 883 | Std. Mean Difference (IV, Random, 95% CI) | 0.36 [0.08, 0.64] |
| 7.2 Moderate‐to‐high intensity | 4 | 487 | Std. Mean Difference (IV, Random, 95% CI) | 0.11 [‐0.13, 0.35] |
| 8 Overall role function (change values) Show forest plot | 12 | Std. Mean Difference (IV, Random, 95% CI) | Subtotals only | |
| 8.1 Light‐to‐moderate intensity | 7 | 328 | Std. Mean Difference (IV, Random, 95% CI) | 0.18 [‐0.19, 0.56] |
| 8.2 Moderate‐to‐high intensity | 5 | 987 | Std. Mean Difference (IV, Random, 95% CI) | 0.06 [‐0.09, 0.21] |
| 9 Overall social well‐being/function (follow‐up values) Show forest plot | 18 | Std. Mean Difference (IV, Random, 95% CI) | Subtotals only | |
| 9.1 Light‐to‐moderate intensity | 15 | 1132 | Std. Mean Difference (IV, Random, 95% CI) | 0.23 [0.10, 0.36] |
| 9.2 Moderate‐to‐high intensity | 3 | 425 | Std. Mean Difference (IV, Random, 95% CI) | 0.05 [‐0.16, 0.26] |
| 10 Overall social well‐being/function (change values) Show forest plot | 12 | Std. Mean Difference (IV, Random, 95% CI) | Subtotals only | |
| 10.1 Light‐to‐moderate intensity | 8 | 413 | Std. Mean Difference (IV, Random, 95% CI) | 0.63 [0.21, 1.04] |
| 10.2 Moderate‐to‐high intensity | 4 | 971 | Std. Mean Difference (IV, Random, 95% CI) | 0.33 [‐0.33, 0.98] |
| 11 Overall cognitive function (follow‐up values) Show forest plot | 5 | Std. Mean Difference (IV, Random, 95% CI) | Subtotals only | |
| 11.1 Light‐to‐moderate intensity | 4 | 173 | Std. Mean Difference (IV, Random, 95% CI) | 0.43 [0.11, 0.74] |
| 11.2 Moderate‐to‐high intensity | 1 | 16 | Std. Mean Difference (IV, Random, 95% CI) | 0.16 [‐0.82, 1.14] |
| 12 Overall cognitive function (change values) Show forest plot | 5 | Std. Mean Difference (IV, Random, 95% CI) | Subtotals only | |
| 12.1 Light‐to‐moderate intensity | 3 | 156 | Std. Mean Difference (IV, Random, 95% CI) | 0.17 [‐0.21, 0.55] |
| 12.2 Moderate‐to‐high intensity | 2 | 516 | Std. Mean Difference (IV, Random, 95% CI) | ‐0.17 [‐0.35, 0.00] |
| 13 Overall general health (follow‐up values) Show forest plot | 10 | Std. Mean Difference (IV, Random, 95% CI) | Subtotals only | |
| 13.1 Light‐to‐moderate intensity | 6 | 304 | Std. Mean Difference (IV, Random, 95% CI) | 0.17 [‐0.14, 0.48] |
| 13.2 Moderate‐to‐high intensity | 4 | 184 | Std. Mean Difference (IV, Random, 95% CI) | 0.30 [‐0.35, 0.95] |
| 14 Overall general health (change values) Show forest plot | 9 | Std. Mean Difference (IV, Random, 95% CI) | Subtotals only | |
| 14.1 Light‐to‐moderate intensity | 5 | 254 | Std. Mean Difference (IV, Random, 95% CI) | 0.23 [‐0.02, 0.48] |
| 14.2 Moderate‐to‐high intensity | 4 | 652 | Std. Mean Difference (IV, Random, 95% CI) | 0.20 [‐0.24, 0.64] |
| 15 Overall sexual function (follow‐up values) Show forest plot | 5 | Std. Mean Difference (IV, Fixed, 95% CI) | Subtotals only | |
| 15.1 Light‐to‐moderate intensity | 4 | 293 | Std. Mean Difference (IV, Fixed, 95% CI) | 0.22 [‐0.01, 0.45] |
| 15.2 Moderate‐to‐high intensity | 1 | 118 | Std. Mean Difference (IV, Fixed, 95% CI) | 0.01 [‐0.35, 0.38] |
| 16 Overall sexual function (change values) Show forest plot | 3 | Mean Difference (IV, Random, 95% CI) | Subtotals only | |
| 16.1 Light‐to‐moderate intensity | 2 | 193 | Mean Difference (IV, Random, 95% CI) | 3.83 [‐1.83, 9.48] |
| 16.2 Moderate‐to‐high intensity | 1 | 500 | Mean Difference (IV, Random, 95% CI) | 0.5 [‐3.86, 4.86] |
| 17 Overall anxiety (follow‐up values) Show forest plot | 7 | Std. Mean Difference (IV, Random, 95% CI) | Subtotals only | |
| 17.1 Light‐to‐moderate intensity | 5 | 237 | Std. Mean Difference (IV, Random, 95% CI) | ‐0.56 [‐0.88, ‐0.25] |
| 17.2 Moderate‐to‐high intensity | 2 | 89 | Std. Mean Difference (IV, Random, 95% CI) | ‐1.20 [‐3.49, 1.09] |
| 18 Overall anxiety (change values) Show forest plot | 4 | Std. Mean Difference (IV, Fixed, 95% CI) | Subtotals only | |
| 18.1 Light‐to‐moderate intensity | 3 | 161 | Std. Mean Difference (IV, Fixed, 95% CI) | ‐0.48 [‐0.79, ‐0.16] |
| 18.2 Moderate‐to‐high intensity | 1 | 74 | Std. Mean Difference (IV, Fixed, 95% CI) | ‐0.15 [‐0.61, 0.30] |
| 19 Overall depression (follow‐up values) Show forest plot | 12 | Std. Mean Difference (IV, Random, 95% CI) | Subtotals only | |
| 19.1 Light‐to‐moderate intensity | 9 | 542 | Std. Mean Difference (IV, Random, 95% CI) | ‐0.24 [‐0.53, 0.06] |
| 19.2 Moderate‐to‐high intensity | 3 | 115 | Std. Mean Difference (IV, Random, 95% CI) | ‐0.92 [‐1.95, 0.11] |
| 20 Overall depression (change values) Show forest plot | 6 | Std. Mean Difference (IV, Random, 95% CI) | Subtotals only | |
| 20.1 Light‐to‐moderate intensity | 4 | 182 | Std. Mean Difference (IV, Random, 95% CI) | ‐0.60 [‐0.89, ‐0.30] |
| 20.2 Moderate‐to‐high intensity | 2 | 574 | Std. Mean Difference (IV, Random, 95% CI) | 0.00 [‐0.21, 0.22] |
| 21 Overall fatigue (follow‐up values) Show forest plot | 25 | Std. Mean Difference (IV, Random, 95% CI) | Subtotals only | |
| 21.1 Light‐to‐moderate intensity | 21 | 1155 | Std. Mean Difference (IV, Random, 95% CI) | ‐0.38 [‐0.56, ‐0.19] |
| 21.2 Moderate‐to‐high intensity | 4 | 770 | Std. Mean Difference (IV, Random, 95% CI) | ‐0.13 [‐0.28, 0.03] |
| 22 Overall fatigue (change values) Show forest plot | 12 | Std. Mean Difference (IV, Random, 95% CI) | Subtotals only | |
| 22.1 Light‐to‐moderate intensity | 9 | 420 | Std. Mean Difference (IV, Random, 95% CI) | ‐0.36 [‐0.84, 0.11] |
| 22.2 Moderate‐to‐high intensity | 3 | 851 | Std. Mean Difference (IV, Random, 95% CI) | 0.05 [‐0.14, 0.24] |
| 23 Overall pain/disability (follow‐up values) Show forest plot | 9 | Std. Mean Difference (IV, Random, 95% CI) | Subtotals only | |
| 23.1 Light‐to‐moderate intensity | 5 | 189 | Std. Mean Difference (IV, Random, 95% CI) | 0.13 [‐0.25, 0.50] |
| 23.2 Moderate‐to‐high intensity | 4 | 346 | Std. Mean Difference (IV, Random, 95% CI) | 0.03 [‐0.18, 0.24] |
| 24 Overall pain/disability (change values) Show forest plot | 5 | Std. Mean Difference (IV, Random, 95% CI) | Subtotals only | |
| 24.1 Light‐to‐moderate intensity | 2 | 77 | Std. Mean Difference (IV, Random, 95% CI) | 0.12 [‐0.33, 0.56] |
| 24.2 Moderate‐to‐high intensity | 3 | 219 | Std. Mean Difference (IV, Random, 95% CI) | ‐0.15 [‐0.47, 0.16] |
| 25 Overall self‐esteem/body image (follow‐up values) Show forest plot | 12 | Std. Mean Difference (IV, Random, 95% CI) | Subtotals only | |
| 25.1 Light‐to‐moderate intensity | 8 | 474 | Std. Mean Difference (IV, Random, 95% CI) | 0.35 [0.14, 0.55] |
| 25.2 Moderate‐to‐high intensity | 4 | 193 | Std. Mean Difference (IV, Random, 95% CI) | 0.06 [‐0.45, 0.56] |
| 26 Overall self‐esteem/body image (change values) Show forest plot | 9 | Std. Mean Difference (IV, Random, 95% CI) | Subtotals only | |
| 26.1 Light‐to‐moderate intensity | 6 | 376 | Std. Mean Difference (IV, Random, 95% CI) | 0.52 [‐0.09, 1.13] |
| 26.2 Moderate‐to‐high intensity | 3 | 616 | Std. Mean Difference (IV, Random, 95% CI) | ‐0.05 [‐0.21, 0.10] |
| 27 Overall cardiorespiratory fitness (follow‐up values) Show forest plot | 23 | Std. Mean Difference (IV, Random, 95% CI) | Subtotals only | |
| 27.1 Light‐to‐moderate intensity | 16 | 975 | Std. Mean Difference (IV, Random, 95% CI) | 0.43 [0.27, 0.59] |
| 27.2 Moderate‐to‐high intensity | 7 | 290 | Std. Mean Difference (IV, Random, 95% CI) | 0.46 [0.13, 0.80] |
| 28 Overall cardiorespiratory fitness (change values) Show forest plot | 9 | Std. Mean Difference (IV, Random, 95% CI) | Subtotals only | |
| 28.1 Light‐to‐moderate intensity | 6 | 228 | Std. Mean Difference (IV, Random, 95% CI) | 1.18 [0.60, 1.77] |
| 28.2 Moderate‐to‐high intensity | 4 | 645 | Std. Mean Difference (IV, Random, 95% CI) | 0.57 [0.01, 1.14] |
| 29 Overall self‐reported physical activity (follow‐up values) Show forest plot | 17 | Std. Mean Difference (IV, Random, 95% CI) | Subtotals only | |
| 29.1 Light‐to‐moderate intensity | 11 | 1112 | Std. Mean Difference (IV, Random, 95% CI) | 0.47 [0.23, 0.72] |
| 29.2 Moderate‐to‐high intensity | 6 | 893 | Std. Mean Difference (IV, Random, 95% CI) | 0.65 [0.27, 1.03] |
| 30 Overall self‐reported physical activity (change values) Show forest plot | 8 | Std. Mean Difference (IV, Random, 95% CI) | Subtotals only | |
| 30.1 Light‐to‐moderate intensity | 4 | 249 | Std. Mean Difference (IV, Random, 95% CI) | 0.79 [0.15, 1.44] |
| 30.2 Moderate‐to‐high intensity | 4 | 1025 | Std. Mean Difference (IV, Random, 95% CI) | 0.46 [0.07, 0.85] |
| 31 Overall objective physical activity (follow‐up values) Show forest plot | 12 | Std. Mean Difference (IV, Random, 95% CI) | Subtotals only | |
| 31.1 Light‐to‐moderate intensity | 9 | 574 | Std. Mean Difference (IV, Random, 95% CI) | 0.58 [0.29, 0.87] |
| 31.2 Moderate‐to‐high intensity | 3 | 735 | Std. Mean Difference (IV, Random, 95% CI) | 0.12 [‐0.03, 0.28] |
| 32 Overall objective physical activity (change values) Show forest plot | 5 | Std. Mean Difference (IV, Random, 95% CI) | Subtotals only | |
| 32.1 Light‐to‐moderate intensity | 3 | 103 | Std. Mean Difference (IV, Random, 95% CI) | 1.05 [0.62, 1.47] |
| 32.2 Moderate‐to‐high intensity | 2 | 405 | Std. Mean Difference (IV, Random, 95% CI) | 0.32 [‐0.45, 1.09] |
| 33 Mass (follow‐up values) Show forest plot | 16 | Mean Difference (IV, Fixed, 95% CI) | Subtotals only | |
| 33.1 Light‐to‐moderate intensity | 12 | 1015 | Mean Difference (IV, Fixed, 95% CI) | 0.03 [‐0.56, 0.61] |
| 33.2 Moderate‐to‐high intensity | 4 | 195 | Mean Difference (IV, Fixed, 95% CI) | ‐1.34 [‐5.66, 2.98] |
| 34 Mass (change values) Show forest plot | 11 | Mean Difference (IV, Random, 95% CI) | Subtotals only | |
| 34.1 Light‐to‐moderate intensity | 8 | 418 | Mean Difference (IV, Random, 95% CI) | ‐0.58 [‐1.21, 0.05] |
| 34.2 Moderate‐to‐high intensity | 4 | 639 | Mean Difference (IV, Random, 95% CI) | ‐0.97 [‐2.18, 0.24] |
| 35 BMI (follow‐up values) Show forest plot | 17 | Mean Difference (IV, Fixed, 95% CI) | Subtotals only | |
| 35.1 Light‐to‐moderate intensity | 12 | 930 | Mean Difference (IV, Fixed, 95% CI) | 0.03 [‐0.18, 0.24] |
| 35.2 Moderate‐to‐high intensity | 5 | 551 | Mean Difference (IV, Fixed, 95% CI) | ‐0.35 [‐1.40, 0.69] |
| 36 BMI (change values) Show forest plot | 8 | Mean Difference (IV, Random, 95% CI) | Subtotals only | |
| 36.1 Light‐to‐moderate intensity | 7 | 403 | Mean Difference (IV, Random, 95% CI) | ‐0.23 [‐0.50, 0.05] |
| 36.2 Moderate‐to‐high intensity | 1 | 82 | Mean Difference (IV, Random, 95% CI) | ‐0.2 [‐0.57, 0.17] |
| 37 Overall body fat (follow‐up values) Show forest plot | 18 | Std. Mean Difference (IV, Random, 95% CI) | Subtotals only | |
| 37.1 Light‐to‐moderate intensity | 13 | 886 | Std. Mean Difference (IV, Random, 95% CI) | ‐0.24 [‐0.44, ‐0.04] |
| 37.2 Moderate‐to‐high intensity | 5 | 276 | Std. Mean Difference (IV, Random, 95% CI) | ‐0.03 [‐0.27, 0.21] |
| 38 Overall body fat (change values) Show forest plot | 9 | Std. Mean Difference (IV, Random, 95% CI) | Subtotals only | |
| 38.1 Light‐to‐moderate intensity | 7 | 375 | Std. Mean Difference (IV, Random, 95% CI) | ‐0.68 [‐1.44, 0.09] |
| 38.2 Moderate‐to‐high intensity | 2 | 124 | Std. Mean Difference (IV, Random, 95% CI) | ‐0.39 [‐0.76, ‐0.02] |
| 39 Lower body strength (follow‐up values) Show forest plot | 10 | Std. Mean Difference (IV, Random, 95% CI) | Subtotals only | |
| 39.1 Light‐to‐moderate intensity | 7 | 480 | Std. Mean Difference (IV, Random, 95% CI) | 0.69 [0.34, 1.04] |
| 39.2 Moderate‐to‐high intensity | 3 | 157 | Std. Mean Difference (IV, Random, 95% CI) | ‐0.10 [‐0.42, 0.21] |
| 40 Lower body strength (change values) Show forest plot | 8 | Std. Mean Difference (IV, Random, 95% CI) | Subtotals only | |
| 40.1 Light‐to‐moderate intensity | 5 | 331 | Std. Mean Difference (IV, Random, 95% CI) | 0.87 [0.64, 1.09] |
| 40.2 Moderate‐to‐high intensity | 4 | 399 | Std. Mean Difference (IV, Random, 95% CI) | 0.62 [0.07, 1.17] |
| 41 Upper body strength (follow‐up values) Show forest plot | 13 | Std. Mean Difference (IV, Random, 95% CI) | Subtotals only | |
| 41.1 Light‐to‐moderate intensity | 7 | 481 | Std. Mean Difference (IV, Random, 95% CI) | 0.43 [‐0.11, 0.96] |
| 41.2 Moderate‐to‐high intensity | 6 | 287 | Std. Mean Difference (IV, Random, 95% CI) | 0.41 [‐0.05, 0.87] |
| 42 Upper body strength (change values) Show forest plot | 8 | Std. Mean Difference (IV, Random, 95% CI) | Subtotals only | |
| 42.1 Light‐to‐moderate intensity | 3 | 360 | Std. Mean Difference (IV, Random, 95% CI) | 1.32 [0.47, 2.16] |
| 42.2 Moderate‐to‐high intensity | 5 | 472 | Std. Mean Difference (IV, Random, 95% CI) | 0.37 [‐0.05, 0.79] |
| 43 Bone mineral density ‐ femoral neck (follow‐up and change values) Show forest plot | 4 | Std. Mean Difference (IV, Random, 95% CI) | Subtotals only | |
| 43.1 Light‐to‐moderate intensity | 2 | 106 | Std. Mean Difference (IV, Random, 95% CI) | ‐0.08 [‐0.54, 0.37] |
| 43.2 Moderate‐to‐high intensity | 2 | 680 | Std. Mean Difference (IV, Random, 95% CI) | 0.39 [‐0.04, 0.83] |
| 44 Bone mineral density ‐ lumbar spine (follow‐up and change values) Show forest plot | 4 | Std. Mean Difference (IV, Random, 95% CI) | Subtotals only | |
| 44.1 Light‐to‐moderate intensity | 2 | 106 | Std. Mean Difference (IV, Random, 95% CI) | 0.06 [‐0.48, 0.60] |
| 44.2 Moderate‐to‐high intensity | 2 | 680 | Std. Mean Difference (IV, Random, 95% CI) | 0.31 [‐0.14, 0.75] |
| 45 Bone mineral density ‐ total hip (follow‐up and change values) Show forest plot | 3 | Std. Mean Difference (IV, Random, 95% CI) | Subtotals only | |
| 45.1 Light‐to‐moderate intensity | 2 | 106 | Std. Mean Difference (IV, Random, 95% CI) | 5.19 [‐4.76, 15.14] |
| 45.2 Moderate‐to‐high intensity | 1 | 223 | Std. Mean Difference (IV, Random, 95% CI) | 1.05 [0.77, 1.33] |
| Outcome or subgroup title | No. of studies | No. of participants | Statistical method | Effect size |
| 1 Overall HRQoL (follow‐up values) Show forest plot | 22 | Std. Mean Difference (IV, Random, 95% CI) | Subtotals only | |
| 1.1 12 weeks or less | 16 | 1404 | Std. Mean Difference (IV, Random, 95% CI) | 0.45 [0.19, 0.70] |
| 1.2 More than 12 weeks | 6 | 399 | Std. Mean Difference (IV, Random, 95% CI) | 0.38 [0.10, 0.65] |
| 2 Overall HRQoL (change values) Show forest plot | 14 | Std. Mean Difference (IV, Random, 95% CI) | Subtotals only | |
| 2.1 12 weeks or less | 11 | 828 | Std. Mean Difference (IV, Random, 95% CI) | 0.99 [0.45, 1.52] |
| 2.2 More than 12 weeks | 3 | 631 | Std. Mean Difference (IV, Random, 95% CI) | 0.27 [‐0.21, 0.76] |
| 3 Overall emotional function/mental health (follow‐up values) Show forest plot | 26 | Std. Mean Difference (IV, Random, 95% CI) | Subtotals only | |
| 3.1 12 weeks or less | 20 | 1557 | Std. Mean Difference (IV, Random, 95% CI) | 0.26 [0.12, 0.39] |
| 3.2 More than 12 weeks | 6 | 545 | Std. Mean Difference (IV, Random, 95% CI) | 0.06 [‐0.11, 0.23] |
| 4 Overall emotional function/mental health (change values) Show forest plot | 15 | Std. Mean Difference (IV, Random, 95% CI) | Subtotals only | |
| 4.1 12 weeks or less | 10 | 754 | Std. Mean Difference (IV, Random, 95% CI) | 0.39 [0.03, 0.76] |
| 4.2 More than 12 weeks | 5 | 825 | Std. Mean Difference (IV, Random, 95% CI) | 0.19 [‐0.05, 0.43] |
| 5 Overall physical function (follow‐up values) Show forest plot | 25 | Std. Mean Difference (IV, Random, 95% CI) | Subtotals only | |
| 5.1 12 weeks or less | 18 | 1523 | Std. Mean Difference (IV, Random, 95% CI) | 0.37 [0.17, 0.58] |
| 5.2 More than 12 weeks | 7 | 606 | Std. Mean Difference (IV, Random, 95% CI) | 0.24 [0.08, 0.40] |
| 6 Overall physical function (change values) Show forest plot | 13 | Std. Mean Difference (IV, Random, 95% CI) | Subtotals only | |
| 6.1 12 weeks or less | 8 | 608 | Std. Mean Difference (IV, Random, 95% CI) | 0.97 [0.27, 1.66] |
| 6.2 More than 12 weeks | 5 | 825 | Std. Mean Difference (IV, Random, 95% CI) | 0.15 [‐0.16, 0.45] |
| 7 Overall role function (follow‐up values) Show forest plot | 18 | Std. Mean Difference (IV, Random, 95% CI) | Subtotals only | |
| 7.1 12 weeks or less | 13 | 1057 | Std. Mean Difference (IV, Random, 95% CI) | 0.30 [‐0.01, 0.60] |
| 7.2 More than 12 weeks | 5 | 313 | Std. Mean Difference (IV, Random, 95% CI) | 0.27 [0.04, 0.49] |
| 8 Overall role function (change values) Show forest plot | 12 | Std. Mean Difference (IV, Random, 95% CI) | Subtotals only | |
| 8.1 12 weeks or less | 8 | 610 | Std. Mean Difference (IV, Random, 95% CI) | 0.24 [‐0.06, 0.55] |
| 8.2 More than 12 weeks | 4 | 705 | Std. Mean Difference (IV, Random, 95% CI) | ‐0.03 [‐0.18, 0.11] |
| 9 Overall social well‐being/function (follow‐up values) Show forest plot | 18 | Std. Mean Difference (IV, Random, 95% CI) | Subtotals only | |
| 9.1 12 weeks or less | 13 | 1202 | Std. Mean Difference (IV, Random, 95% CI) | 0.23 [0.06, 0.39] |
| 9.2 More than 12 weeks | 5 | 355 | Std. Mean Difference (IV, Random, 95% CI) | 0.15 [‐0.05, 0.36] |
| 10 Overall social well‐being/function (change values) Show forest plot | 12 | Std. Mean Difference (IV, Random, 95% CI) | Subtotals only | |
| 10.1 12 weeks or less | 8 | 637 | Std. Mean Difference (IV, Random, 95% CI) | 0.73 [0.35, 1.11] |
| 10.2 More than 12 weeks | 4 | 747 | Std. Mean Difference (IV, Random, 95% CI) | 0.11 [‐0.19, 0.42] |
| 11 Overall cognitive function (follow‐up values) Show forest plot | 5 | Std. Mean Difference (IV, Random, 95% CI) | Subtotals only | |
| 11.1 12 weeks or less | 5 | 189 | Std. Mean Difference (IV, Random, 95% CI) | 0.40 [0.11, 0.69] |
| 11.2 More than 12 weeks | 0 | 0 | Std. Mean Difference (IV, Random, 95% CI) | 0.0 [0.0, 0.0] |
| 12 Overall cognitive function (change values) Show forest plot | 5 | Std. Mean Difference (IV, Random, 95% CI) | Subtotals only | |
| 12.1 12 weeks or less | 4 | 172 | Std. Mean Difference (IV, Random, 95% CI) | 0.14 [‐0.17, 0.44] |
| 12.2 More than 12 weeks | 1 | 500 | Std. Mean Difference (IV, Random, 95% CI) | ‐0.17 [‐0.35, 0.00] |
| 13 Overall general health (follow‐up values) Show forest plot | 9 | Std. Mean Difference (IV, Random, 95% CI) | Subtotals only | |
| 13.1 12 weeks or less | 6 | 252 | Std. Mean Difference (IV, Random, 95% CI) | 0.17 [‐0.16, 0.50] |
| 13.2 More than 12 weeks | 3 | 204 | Std. Mean Difference (IV, Random, 95% CI) | 0.21 [‐0.32, 0.75] |
| 14 Overall general health (change values) Show forest plot | 9 | Std. Mean Difference (IV, Random, 95% CI) | Subtotals only | |
| 14.1 12 weeks or less | 6 | 253 | Std. Mean Difference (IV, Random, 95% CI) | 0.29 [‐0.09, 0.67] |
| 14.2 More than 12 weeks | 3 | 653 | Std. Mean Difference (IV, Random, 95% CI) | 0.01 [‐0.20, 0.22] |
| 15 Overall sexual function (follow‐up values) Show forest plot | 5 | Std. Mean Difference (IV, Fixed, 95% CI) | Subtotals only | |
| 15.1 12 weeks or less | 3 | 218 | Std. Mean Difference (IV, Fixed, 95% CI) | 0.11 [‐0.16, 0.38] |
| 15.2 More than 12 weeks | 2 | 193 | Std. Mean Difference (IV, Fixed, 95% CI) | 0.21 [‐0.07, 0.49] |
| 16 Overall sexual function (change values) Show forest plot | 3 | Mean Difference (IV, Random, 95% CI) | Subtotals only | |
| 16.1 12 weeks or less | 0 | 0 | Mean Difference (IV, Random, 95% CI) | 0.0 [0.0, 0.0] |
| 16.2 More than 12 weeks | 3 | 693 | Mean Difference (IV, Random, 95% CI) | 2.44 [‐0.76, 5.64] |
| 17 Overall sleep (follow‐up values) Show forest plot | 5 | Std. Mean Difference (IV, Fixed, 95% CI) | Subtotals only | |
| 17.1 12 weeks or less | 5 | 188 | Std. Mean Difference (IV, Fixed, 95% CI) | ‐0.09 [‐0.37, 0.20] |
| 17.2 More than 12 weeks | 0 | 0 | Std. Mean Difference (IV, Fixed, 95% CI) | 0.0 [0.0, 0.0] |
| 18 Overall sleep (change values) Show forest plot | 3 | Std. Mean Difference (IV, Random, 95% CI) | Subtotals only | |
| 18.1 12 weeks or less | 3 | 136 | Std. Mean Difference (IV, Random, 95% CI) | 0.14 [‐0.20, 0.48] |
| 18.2 More than 12 weeks | 0 | 0 | Std. Mean Difference (IV, Random, 95% CI) | 0.0 [0.0, 0.0] |
| 19 Overall anxiety (follow‐up values) Show forest plot | 7 | Std. Mean Difference (IV, Random, 95% CI) | Subtotals only | |
| 19.1 12 weeks or less | 6 | 252 | Std. Mean Difference (IV, Random, 95% CI) | ‐0.67 [‐1.09, ‐0.25] |
| 19.2 More than 12 weeks | 1 | 74 | Std. Mean Difference (IV, Random, 95% CI) | ‐0.14 [‐0.60, 0.31] |
| 20 Overall anxiety (change values) Show forest plot | 4 | Std. Mean Difference (IV, Fixed, 95% CI) | Subtotals only | |
| 20.1 12 weeks or less | 3 | 161 | Std. Mean Difference (IV, Fixed, 95% CI) | ‐0.48 [‐0.79, ‐0.16] |
| 20.2 More than 12 weeks | 1 | 74 | Std. Mean Difference (IV, Fixed, 95% CI) | ‐0.15 [‐0.61, 0.30] |
| 21 Overall depression (follow‐up values) Show forest plot | 12 | Std. Mean Difference (IV, Random, 95% CI) | Subtotals only | |
| 21.1 12 weeks or less | 9 | 537 | Std. Mean Difference (IV, Random, 95% CI) | ‐0.36 [‐0.70, ‐0.01] |
| 21.2 More than 12 weeks | 3 | 120 | Std. Mean Difference (IV, Random, 95% CI) | ‐0.30 [‐0.90, 0.30] |
| 22 Overall depression (change values) Show forest plot | 6 | Std. Mean Difference (IV, Random, 95% CI) | Subtotals only | |
| 22.1 12 weeks or less | 4 | 182 | Std. Mean Difference (IV, Random, 95% CI) | ‐0.60 [‐0.89, ‐0.30] |
| 22.2 More than 12 weeks | 2 | 574 | Std. Mean Difference (IV, Random, 95% CI) | 0.00 [‐0.21, 0.22] |
| 23 Overall fatigue (follow‐up values) Show forest plot | 25 | Std. Mean Difference (IV, Random, 95% CI) | Subtotals only | |
| 23.1 12 weeks or less | 20 | 1657 | Std. Mean Difference (IV, Random, 95% CI) | ‐0.42 [‐0.59, ‐0.25] |
| 23.2 More than 12 weeks | 5 | 268 | Std. Mean Difference (IV, Random, 95% CI) | 0.02 [‐0.22, 0.26] |
| 24 Overall fatigue (change values) Show forest plot | 12 | Std. Mean Difference (IV, Random, 95% CI) | Subtotals only | |
| 24.1 12 weeks or less | 10 | 719 | Std. Mean Difference (IV, Random, 95% CI) | ‐0.44 [‐0.83, ‐0.05] |
| 24.2 More than 12 weeks | 2 | 552 | Std. Mean Difference (IV, Random, 95% CI) | 0.36 [‐0.43, 1.15] |
| 25 Overall pain/disability (follow‐up values) Show forest plot | 9 | Std. Mean Difference (IV, Random, 95% CI) | Subtotals only | |
| 25.1 12 weeks or less | 6 | 376 | Std. Mean Difference (IV, Random, 95% CI) | 0.03 [‐0.17, 0.23] |
| 25.2 More than 12 weeks | 3 | 159 | Std. Mean Difference (IV, Random, 95% CI) | 0.21 [‐0.27, 0.70] |
| 26 Overall pain/disability (change values) Show forest plot | 5 | Std. Mean Difference (IV, Random, 95% CI) | Subtotals only | |
| 26.1 12 weeks or less | 3 | 139 | Std. Mean Difference (IV, Random, 95% CI) | 0.16 [‐0.19, 0.50] |
| 26.2 More than 12 weeks | 2 | 157 | Std. Mean Difference (IV, Random, 95% CI) | ‐0.29 [‐0.61, 0.02] |
| 27 Overall self‐esteem/body image (follow‐up values) Show forest plot | 12 | Std. Mean Difference (IV, Random, 95% CI) | Subtotals only | |
| 27.1 12 weeks or less | 9 | 419 | Std. Mean Difference (IV, Random, 95% CI) | 0.36 [0.07, 0.66] |
| 27.2 More than 12 weeks | 3 | 248 | Std. Mean Difference (IV, Random, 95% CI) | 0.08 [‐0.17, 0.33] |
| 28 Overall self‐esteem/body image (change values) Show forest plot | 9 | Std. Mean Difference (IV, Random, 95% CI) | Subtotals only | |
| 28.1 12 weeks or less | 5 | 244 | Std. Mean Difference (IV, Random, 95% CI) | 0.54 [‐0.10, 1.18] |
| 28.2 More than 12 weeks | 4 | 748 | Std. Mean Difference (IV, Random, 95% CI) | 0.01 [‐0.37, 0.39] |
| 29 Overall cardiorespiratory fitness (follow‐up values) Show forest plot | 23 | Std. Mean Difference (IV, Random, 95% CI) | Subtotals only | |
| 29.1 12 weeks or less | 15 | 923 | Std. Mean Difference (IV, Random, 95% CI) | 0.35 [0.20, 0.49] |
| 29.2 More than 12 weeks | 8 | 342 | Std. Mean Difference (IV, Random, 95% CI) | 0.67 [0.40, 0.94] |
| 30 Overall cardiorespiratory fitness (change values) Show forest plot | 9 | Std. Mean Difference (IV, Random, 95% CI) | Subtotals only | |
| 30.1 12 weeks or less | 6 | 232 | Std. Mean Difference (IV, Random, 95% CI) | 0.91 [0.31, 1.52] |
| 30.2 More than 12 weeks | 3 | 631 | Std. Mean Difference (IV, Random, 95% CI) | 0.76 [0.02, 1.51] |
| 31 Overall self‐reported physical activity (follow‐up values) Show forest plot | 18 | Std. Mean Difference (IV, Random, 95% CI) | Subtotals only | |
| 31.1 12 weeks or less | 11 | 1401 | Std. Mean Difference (IV, Random, 95% CI) | 0.60 [0.36, 0.84] |
| 31.2 More than 12 weeks | 7 | 643 | Std. Mean Difference (IV, Random, 95% CI) | 0.41 [0.09, 0.74] |
| 32 Overall self‐reported physical activity (change values) Show forest plot | 8 | Std. Mean Difference (IV, Random, 95% CI) | Subtotals only | |
| 32.1 12 weeks or less | 4 | 521 | Std. Mean Difference (IV, Random, 95% CI) | 0.78 [0.20, 1.36] |
| 32.2 More than 12 weeks | 4 | 753 | Std. Mean Difference (IV, Random, 95% CI) | 0.46 [‐0.01, 0.92] |
| 33 Overall objective physical activity (follow‐up values) Show forest plot | 11 | Std. Mean Difference (IV, Random, 95% CI) | Subtotals only | |
| 33.1 12 weeks or less | 10 | 1203 | Std. Mean Difference (IV, Random, 95% CI) | 0.44 [0.18, 0.70] |
| 33.2 More than 12 weeks | 1 | 67 | Std. Mean Difference (IV, Random, 95% CI) | 0.38 [‐0.11, 0.86] |
| 34 Overall objective physical activity (change values) Show forest plot | 5 | Std. Mean Difference (IV, Random, 95% CI) | Subtotals only | |
| 34.1 12 weeks or less | 4 | 441 | Std. Mean Difference (IV, Random, 95% CI) | 0.72 [‐0.02, 1.46] |
| 34.2 More than 12 weeks | 1 | 67 | Std. Mean Difference (IV, Random, 95% CI) | 0.75 [0.25, 1.24] |
| 35 Mass (follow‐up values) Show forest plot | 16 | Mean Difference (IV, Fixed, 95% CI) | Subtotals only | |
| 35.1 12 weeks or less | 7 | 451 | Mean Difference (IV, Fixed, 95% CI) | ‐0.10 [‐0.85, 0.65] |
| 35.2 More than 12 weeks | 9 | 759 | Mean Difference (IV, Fixed, 95% CI) | 0.14 [‐0.76, 1.05] |
| 36 Mass (change values) Show forest plot | 11 | Mean Difference (IV, Random, 95% CI) | Subtotals only | |
| 36.1 12 weeks or less | 5 | 171 | Mean Difference (IV, Random, 95% CI) | ‐0.82 [‐1.81, 0.17] |
| 36.2 More than 12 weeks | 6 | 876 | Mean Difference (IV, Random, 95% CI) | ‐0.25 [‐0.73, 0.24] |
| 37 BMI (follow‐up values) Show forest plot | 17 | Mean Difference (IV, Fixed, 95% CI) | Subtotals only | |
| 37.1 12 weeks or less | 9 | 819 | Mean Difference (IV, Fixed, 95% CI) | ‐0.07 [‐0.35, 0.20] |
| 37.2 More than 12 weeks | 8 | 662 | Mean Difference (IV, Fixed, 95% CI) | 0.13 [‐0.18, 0.43] |
| 38 BMI (change values) Show forest plot | 8 | Mean Difference (IV, Random, 95% CI) | Subtotals only | |
| 38.1 12 weeks or less | 4 | 144 | Mean Difference (IV, Random, 95% CI) | ‐0.27 [‐0.76, 0.22] |
| 38.2 More than 12 weeks | 4 | 341 | Mean Difference (IV, Random, 95% CI) | ‐0.08 [‐0.22, 0.07] |
| 39 Overall body fat (follow‐up values) Show forest plot | 18 | Std. Mean Difference (IV, Random, 95% CI) | Subtotals only | |
| 39.1 12 weeks or less | 9 | 402 | Std. Mean Difference (IV, Random, 95% CI) | ‐0.16 [‐0.37, 0.04] |
| 39.2 More than 12 weeks | 9 | 760 | Std. Mean Difference (IV, Random, 95% CI) | ‐0.20 [‐0.45, 0.05] |
| 40 Overall body fat (change values) Show forest plot | 9 | Std. Mean Difference (IV, Random, 95% CI) | Subtotals only | |
| 40.1 12 weeks or less | 5 | 160 | Std. Mean Difference (IV, Random, 95% CI) | ‐0.36 [‐0.68, ‐0.04] |
| 40.2 More than 12 weeks | 4 | 339 | Std. Mean Difference (IV, Random, 95% CI) | ‐0.94 [‐2.07, 0.18] |
| 41 Lower body strength (follow‐up values) Show forest plot | 10 | Std. Mean Difference (IV, Random, 95% CI) | Subtotals only | |
| 41.1 12 weeks or less | 5 | 206 | Std. Mean Difference (IV, Random, 95% CI) | 0.15 [‐0.19, 0.50] |
| 41.2 More than 12 weeks | 5 | 431 | Std. Mean Difference (IV, Random, 95% CI) | 0.72 [0.20, 1.24] |
| 42 Lower body strength (change values) Show forest plot | 8 | Std. Mean Difference (IV, Random, 95% CI) | Subtotals only | |
| 42.1 12 weeks or less | 5 | 220 | Std. Mean Difference (IV, Random, 95% CI) | 0.71 [0.06, 1.37] |
| 42.2 More than 12 weeks | 3 | 500 | Std. Mean Difference (IV, Random, 95% CI) | 0.76 [0.36, 1.17] |
| 43 Upper body strength (follow‐up values) Show forest plot | 13 | Std. Mean Difference (IV, Random, 95% CI) | Subtotals only | |
| 43.1 12 weeks or less | 6 | 249 | Std. Mean Difference (IV, Random, 95% CI) | 0.15 [‐0.32, 0.62] |
| 43.2 More than 12 weeks | 7 | 519 | Std. Mean Difference (IV, Random, 95% CI) | 0.64 [0.24, 1.04] |
| 44 Upper body strength (change values) Show forest plot | 8 | Std. Mean Difference (IV, Random, 95% CI) | Subtotals only | |
| 44.1 12 weeks or less | 4 | 249 | Std. Mean Difference (IV, Random, 95% CI) | 0.72 [‐0.06, 1.50] |
| 44.2 More than 12 weeks | 4 | 583 | Std. Mean Difference (IV, Random, 95% CI) | 0.71 [0.17, 1.25] |
| Outcome or subgroup title | No. of studies | No. of participants | Statistical method | Effect size |
| 1 Overall HRQoL (follow‐up values) Show forest plot | 21 | Std. Mean Difference (IV, Random, 95% CI) | Subtotals only | |
| 1.1 Group format | 5 | 214 | Std. Mean Difference (IV, Random, 95% CI) | 0.99 [0.22, 1.75] |
| 1.2 Individual format | 10 | 1137 | Std. Mean Difference (IV, Random, 95% CI) | 0.21 [0.03, 0.38] |
| 1.3 Both group and individual formats | 6 | 390 | Std. Mean Difference (IV, Random, 95% CI) | 0.33 [0.04, 0.62] |
| 2 Overall HRQoL (change values) Show forest plot | 14 | Std. Mean Difference (IV, Random, 95% CI) | Subtotals only | |
| 2.1 Group format | 5 | 198 | Std. Mean Difference (IV, Random, 95% CI) | 1.88 [0.19, 3.56] |
| 2.2 Individual format | 6 | 649 | Std. Mean Difference (IV, Random, 95% CI) | 0.43 [0.25, 0.61] |
| 2.3 Both group and individual formats | 3 | 612 | Std. Mean Difference (IV, Random, 95% CI) | 0.06 [‐0.22, 0.33] |
| 3 Overall emotional function/mental health (follow‐up values) Show forest plot | 26 | Std. Mean Difference (IV, Random, 95% CI) | Subtotals only | |
| 3.1 Group format | 10 | 649 | Std. Mean Difference (IV, Random, 95% CI) | 0.28 [0.07, 0.49] |
| 3.2 Individual format | 10 | 923 | Std. Mean Difference (IV, Random, 95% CI) | 0.16 [0.02, 0.30] |
| 3.3 Both group and individual formats | 6 | 500 | Std. Mean Difference (IV, Random, 95% CI) | 0.10 [‐0.09, 0.29] |
| 4 Overall emotional function/mental health (change values) Show forest plot | 15 | Std. Mean Difference (IV, Random, 95% CI) | Subtotals only | |
| 4.1 Group format | 7 | 398 | Std. Mean Difference (IV, Random, 95% CI) | 0.42 [‐0.14, 0.99] |
| 4.2 Individual format | 5 | 569 | Std. Mean Difference (IV, Random, 95% CI) | 0.26 [0.08, 0.44] |
| 4.3 Both group and individual formats | 3 | 612 | Std. Mean Difference (IV, Random, 95% CI) | 0.09 [‐0.16, 0.34] |
| 5 Overall physical function (follow‐up values) Show forest plot | 24 | Std. Mean Difference (IV, Random, 95% CI) | Subtotals only | |
| 5.1 Group format | 9 | 588 | Std. Mean Difference (IV, Random, 95% CI) | 0.53 [0.12, 0.94] |
| 5.2 Individual format | 9 | 941 | Std. Mean Difference (IV, Random, 95% CI) | 0.28 [0.12, 0.45] |
| 5.3 Both group and individual formats | 6 | 538 | Std. Mean Difference (IV, Random, 95% CI) | 0.18 [‐0.06, 0.42] |
| 6 Overall physical function (change values) Show forest plot | 13 | Std. Mean Difference (IV, Random, 95% CI) | Subtotals only | |
| 6.1 Group format | 6 | 337 | Std. Mean Difference (IV, Random, 95% CI) | 1.25 [0.29, 2.21] |
| 6.2 Individual format | 3 | 432 | Std. Mean Difference (IV, Random, 95% CI) | 0.20 [‐0.01, 0.41] |
| 6.3 Both group and individual formats | 4 | 664 | Std. Mean Difference (IV, Random, 95% CI) | 0.19 [‐0.25, 0.63] |
| 7 Overall role function (follow‐up values) Show forest plot | 18 | Std. Mean Difference (IV, Random, 95% CI) | Subtotals only | |
| 7.1 Group format | 6 | 225 | Std. Mean Difference (IV, Random, 95% CI) | 0.52 [‐0.27, 1.30] |
| 7.2 Individual format | 7 | 689 | Std. Mean Difference (IV, Random, 95% CI) | 0.23 [0.07, 0.40] |
| 7.3 Both group and individual formats | 5 | 426 | Std. Mean Difference (IV, Random, 95% CI) | 0.15 [‐0.15, 0.45] |
| 8 Overall role function (change values) Show forest plot | 12 | Std. Mean Difference (IV, Random, 95% CI) | Subtotals only | |
| 8.1 Group format | 5 | 216 | Std. Mean Difference (IV, Random, 95% CI) | 0.36 [‐0.14, 0.85] |
| 8.2 Individual format | 4 | 487 | Std. Mean Difference (IV, Random, 95% CI) | 0.13 [‐0.07, 0.32] |
| 8.3 Both group and individual formats | 3 | 612 | Std. Mean Difference (IV, Random, 95% CI) | ‐0.06 [‐0.22, 0.10] |
| 9 Overall social well‐being/function (follow‐up values) Show forest plot | 18 | Std. Mean Difference (IV, Random, 95% CI) | Subtotals only | |
| 9.1 Group format | 7 | 348 | Std. Mean Difference (IV, Random, 95% CI) | 0.22 [0.00, 0.45] |
| 9.2 Individual format | 5 | 546 | Std. Mean Difference (IV, Random, 95% CI) | 0.27 [‐0.07, 0.61] |
| 9.3 Both group and individual formats | 6 | 663 | Std. Mean Difference (IV, Random, 95% CI) | 0.16 [0.01, 0.32] |
| 10 Overall social well‐being/function (change values) Show forest plot | 12 | Std. Mean Difference (IV, Random, 95% CI) | Subtotals only | |
| 10.1 Group format | 5 | 322 | Std. Mean Difference (IV, Random, 95% CI) | 0.57 [‐0.06, 1.19] |
| 10.2 Individual format | 4 | 450 | Std. Mean Difference (IV, Random, 95% CI) | 0.72 [0.38, 1.06] |
| 10.3 Both group and individual formats | 3 | 612 | Std. Mean Difference (IV, Random, 95% CI) | 0.27 [‐0.31, 0.85] |
| 11 Overall cognitive function (follow‐up values) Show forest plot | 5 | Std. Mean Difference (IV, Random, 95% CI) | Subtotals only | |
| 11.1 Group format | 3 | 134 | Std. Mean Difference (IV, Random, 95% CI) | 0.32 [‐0.02, 0.66] |
| 11.2 Individual format | 1 | 18 | Std. Mean Difference (IV, Random, 95% CI) | 1.14 [0.07, 2.20] |
| 11.3 Both group and individual formats | 1 | 37 | Std. Mean Difference (IV, Random, 95% CI) | 0.42 [‐0.24, 1.07] |
| 12 Overall cognitive function (change values) Show forest plot | 5 | Std. Mean Difference (IV, Random, 95% CI) | Subtotals only | |
| 12.1 Group format | 3 | 134 | Std. Mean Difference (IV, Random, 95% CI) | 0.06 [‐0.31, 0.43] |
| 12.2 Individual format | 0 | 0 | Std. Mean Difference (IV, Random, 95% CI) | 0.0 [0.0, 0.0] |
| 12.3 Both group and individual formats | 2 | 538 | Std. Mean Difference (IV, Random, 95% CI) | 0.03 [‐0.51, 0.57] |
| 13 Overall general health (follow‐up values) Show forest plot | 9 | Std. Mean Difference (IV, Random, 95% CI) | Subtotals only | |
| 13.1 Group format | 3 | 92 | Std. Mean Difference (IV, Random, 95% CI) | 0.38 [‐0.31, 1.07] |
| 13.2 Individual format | 4 | 222 | Std. Mean Difference (IV, Random, 95% CI) | 0.34 [‐0.08, 0.76] |
| 13.3 Both group and individual formats | 2 | 112 | Std. Mean Difference (IV, Random, 95% CI) | ‐0.26 [‐0.64, 0.11] |
| 14 Overall general health (change values) Show forest plot | 9 | Std. Mean Difference (IV, Random, 95% CI) | Subtotals only | |
| 14.1 Group format | 4 | 155 | Std. Mean Difference (IV, Random, 95% CI) | 0.35 [‐0.25, 0.95] |
| 14.2 Individual format | 2 | 139 | Std. Mean Difference (IV, Random, 95% CI) | 0.38 [0.04, 0.73] |
| 14.3 Both group and individual formats | 3 | 612 | Std. Mean Difference (IV, Random, 95% CI) | ‐0.07 [‐0.23, 0.09] |
| 15 Overall sexual function (follow‐up values) Show forest plot | 5 | Std. Mean Difference (IV, Fixed, 95% CI) | Subtotals only | |
| 15.1 Group format | 1 | 114 | Std. Mean Difference (IV, Fixed, 95% CI) | 0.14 [‐0.23, 0.51] |
| 15.2 Individual format | 4 | 297 | Std. Mean Difference (IV, Fixed, 95% CI) | 0.17 [‐0.06, 0.40] |
| 15.3 Both group and individual formats | 0 | 0 | Std. Mean Difference (IV, Fixed, 95% CI) | 0.0 [0.0, 0.0] |
| 16 Overall sleep (follow‐up values) Show forest plot | 5 | Std. Mean Difference (IV, Fixed, 95% CI) | Subtotals only | |
| 16.1 Group format | 2 | 88 | Std. Mean Difference (IV, Fixed, 95% CI) | ‐0.26 [‐0.68, 0.16] |
| 16.2 Individual format | 2 | 62 | Std. Mean Difference (IV, Fixed, 95% CI) | ‐0.07 [‐0.57, 0.43] |
| 16.3 Both group and individual formats | 1 | 38 | Std. Mean Difference (IV, Fixed, 95% CI) | 0.28 [‐0.36, 0.92] |
| 17 Overall anxiety (follow‐up values) Show forest plot | 6 | Std. Mean Difference (IV, Random, 95% CI) | Subtotals only | |
| 17.1 Group format | 3 | 177 | Std. Mean Difference (IV, Random, 95% CI) | ‐0.73 [‐1.03, ‐0.42] |
| 17.2 Individual format | 2 | 60 | Std. Mean Difference (IV, Random, 95% CI) | ‐0.13 [‐0.64, 0.39] |
| 17.3 Both group and individual formats | 1 | 74 | Std. Mean Difference (IV, Random, 95% CI) | ‐0.14 [‐0.60, 0.31] |
| 18 Overall anxiety (change values) Show forest plot | 4 | Std. Mean Difference (IV, Fixed, 95% CI) | Subtotals only | |
| 18.1 Group format | 2 | 119 | Std. Mean Difference (IV, Fixed, 95% CI) | ‐0.52 [‐0.88, ‐0.15] |
| 18.2 Individual format | 1 | 42 | Std. Mean Difference (IV, Fixed, 95% CI) | ‐0.37 [‐0.99, 0.24] |
| 18.3 Both group and individual formats | 1 | 74 | Std. Mean Difference (IV, Fixed, 95% CI) | ‐0.15 [‐0.61, 0.30] |
| 19 Overall depression (change values) Show forest plot | 7 | Std. Mean Difference (IV, Random, 95% CI) | Subtotals only | |
| 19.1 Group format | 2 | 119 | Std. Mean Difference (IV, Random, 95% CI) | ‐0.54 [‐0.91, ‐0.18] |
| 19.2 Individual format | 3 | 123 | Std. Mean Difference (IV, Random, 95% CI) | ‐0.51 [‐1.03, 0.01] |
| 19.3 Both group and individual formats | 2 | 574 | Std. Mean Difference (IV, Random, 95% CI) | 0.00 [‐0.21, 0.22] |
| 20 Overall depression (follow‐up values) Show forest plot | 11 | Std. Mean Difference (IV, Random, 95% CI) | Subtotals only | |
| 20.1 Group format | 4 | 176 | Std. Mean Difference (IV, Random, 95% CI) | ‐0.68 [‐0.98, ‐0.37] |
| 20.2 Individual format | 5 | 206 | Std. Mean Difference (IV, Random, 95% CI) | ‐0.01 [‐0.51, 0.49] |
| 20.3 Both group and individual formats | 2 | 260 | Std. Mean Difference (IV, Random, 95% CI) | ‐0.13 [‐0.37, 0.12] |
| 21 Overall fatigue (follow‐up values) Show forest plot | 24 | Std. Mean Difference (IV, Random, 95% CI) | Subtotals only | |
| 21.1 Group format | 7 | 350 | Std. Mean Difference (IV, Random, 95% CI) | ‐0.77 [‐1.15, ‐0.39] |
| 21.2 Individual format | 11 | 1068 | Std. Mean Difference (IV, Random, 95% CI) | ‐0.19 [‐0.36, ‐0.02] |
| 21.3 Both group and individual formats | 6 | 445 | Std. Mean Difference (IV, Random, 95% CI) | ‐0.18 [‐0.37, 0.01] |
| 22 Overall fatigue (change values) Show forest plot | 12 | Std. Mean Difference (IV, Random, 95% CI) | Subtotals only | |
| 22.1 Group format | 2 | 73 | Std. Mean Difference (IV, Random, 95% CI) | ‐0.10 [‐0.70, 0.50] |
| 22.2 Individual format | 7 | 637 | Std. Mean Difference (IV, Random, 95% CI) | ‐0.40 [‐0.98, 0.17] |
| 22.3 Both group and individual formats | 3 | 561 | Std. Mean Difference (IV, Random, 95% CI) | ‐0.02 [‐0.18, 0.15] |
| 23 Overall pain/disability (follow‐up values) Show forest plot | 8 | Std. Mean Difference (IV, Random, 95% CI) | Subtotals only | |
| 23.1 Group format | 2 | 77 | Std. Mean Difference (IV, Random, 95% CI) | 0.18 [‐0.26, 0.63] |
| 23.2 Individual format | 3 | 261 | Std. Mean Difference (IV, Random, 95% CI) | 0.22 [‐0.22, 0.65] |
| 23.3 Both group and individual formats | 3 | 135 | Std. Mean Difference (IV, Random, 95% CI) | ‐0.16 [‐0.50, 0.18] |
| 24 Overall pain/disability (change values) Show forest plot | 3 | Std. Mean Difference (IV, Random, 95% CI) | Subtotals only | |
| 24.1 Group format | 3 | 139 | Std. Mean Difference (IV, Random, 95% CI) | 0.16 [‐0.19, 0.50] |
| 24.2 Individual format | 0 | 0 | Std. Mean Difference (IV, Random, 95% CI) | 0.0 [0.0, 0.0] |
| 24.3 Both group and individual formats | 0 | 0 | Std. Mean Difference (IV, Random, 95% CI) | 0.0 [0.0, 0.0] |
| 25 Overall self‐esteem/body image (follow‐up values) Show forest plot | 10 | Std. Mean Difference (IV, Random, 95% CI) | Subtotals only | |
| 25.1 Group format | 3 | 234 | Std. Mean Difference (IV, Random, 95% CI) | 0.28 [‐0.04, 0.60] |
| 25.2 Individual format | 5 | 259 | Std. Mean Difference (IV, Random, 95% CI) | 0.27 [‐0.21, 0.76] |
| 25.3 Both group and individual formats | 2 | 97 | Std. Mean Difference (IV, Random, 95% CI) | 0.15 [‐0.25, 0.55] |
| 26 Overall self‐esteem/body image (change values) Show forest plot | 9 | Std. Mean Difference (IV, Random, 95% CI) | Subtotals only | |
| 26.1 Group format | 4 | 258 | Std. Mean Difference (IV, Random, 95% CI) | 0.59 [‐0.33, 1.51] |
| 26.2 Individual format | 3 | 160 | Std. Mean Difference (IV, Random, 95% CI) | 0.31 [‐0.19, 0.81] |
| 26.3 Both group and individual formats | 2 | 574 | Std. Mean Difference (IV, Random, 95% CI) | ‐0.05 [‐0.21, 0.12] |
| 27 Overall cardiorespiratory fitness (follow‐up values) Show forest plot | 21 | Std. Mean Difference (IV, Random, 95% CI) | Subtotals only | |
| 27.1 Group format | 7 | 321 | Std. Mean Difference (IV, Random, 95% CI) | 0.29 [0.06, 0.51] |
| 27.2 Individual format | 10 | 493 | Std. Mean Difference (IV, Random, 95% CI) | 0.59 [0.38, 0.79] |
| 27.3 Both group and individual formats | 4 | 362 | Std. Mean Difference (IV, Random, 95% CI) | 0.24 [0.03, 0.44] |
| 28 Overall cardiorespiratory fitness (change values) Show forest plot | 6 | Std. Mean Difference (IV, Random, 95% CI) | Subtotals only | |
| 28.1 Group format | 0 | 0 | Std. Mean Difference (IV, Random, 95% CI) | 0.0 [0.0, 0.0] |
| 28.2 Individual format | 4 | 216 | Std. Mean Difference (IV, Random, 95% CI) | 0.64 [0.08, 1.19] |
| 28.3 Both group and individual formats | 2 | 581 | Std. Mean Difference (IV, Random, 95% CI) | 0.44 [‐0.18, 1.05] |
| 29 Overall self‐reported physical activity (follow‐up values) Show forest plot | 17 | Std. Mean Difference (IV, Random, 95% CI) | Subtotals only | |
| 29.1 Group format | 1 | 264 | Std. Mean Difference (IV, Random, 95% CI) | 0.13 [‐0.11, 0.37] |
| 29.2 Individual format | 8 | 989 | Std. Mean Difference (IV, Random, 95% CI) | 0.59 [0.28, 0.90] |
| 29.3 Both group and individual formats | 8 | 752 | Std. Mean Difference (IV, Random, 95% CI) | 0.55 [0.25, 0.84] |
| 30 Overall self‐reported physical activity (change values) Show forest plot | 8 | Std. Mean Difference (IV, Random, 95% CI) | Subtotals only | |
| 30.1 Group format | 1 | 105 | Std. Mean Difference (IV, Random, 95% CI) | 0.21 [‐0.17, 0.60] |
| 30.2 Individual format | 3 | 495 | Std. Mean Difference (IV, Random, 95% CI) | 0.38 [0.18, 0.57] |
| 30.3 Both group and individual formats | 4 | 674 | Std. Mean Difference (IV, Random, 95% CI) | 0.92 [0.14, 1.70] |
| 31 Overall objective physical activity (follow‐up values) Show forest plot | 12 | Std. Mean Difference (IV, Random, 95% CI) | Subtotals only | |
| 31.1 Group format | 0 | 0 | Std. Mean Difference (IV, Random, 95% CI) | 0.0 [0.0, 0.0] |
| 31.2 Individual format | 8 | 957 | Std. Mean Difference (IV, Random, 95% CI) | 0.51 [0.18, 0.85] |
| 31.3 Both group and individual formats | 4 | 352 | Std. Mean Difference (IV, Random, 95% CI) | 0.34 [0.13, 0.55] |
| 32 Overall objective physical activity (change values) Show forest plot | 5 | Std. Mean Difference (IV, Random, 95% CI) | Subtotals only | |
| 32.1 Group format | 0 | 0 | Std. Mean Difference (IV, Random, 95% CI) | 0.0 [0.0, 0.0] |
| 32.2 Individual format | 3 | 416 | Std. Mean Difference (IV, Random, 95% CI) | 0.62 [‐0.23, 1.46] |
| 32.3 Both group and individual formats | 2 | 92 | Std. Mean Difference (IV, Random, 95% CI) | 0.83 [0.40, 1.27] |
| 33 Mass (follow‐up values) Show forest plot | 15 | Mean Difference (IV, Fixed, 95% CI) | Subtotals only | |
| 33.1 Group format | 4 | 363 | Mean Difference (IV, Fixed, 95% CI) | ‐1.10 [‐3.92, 1.72] |
| 33.2 Individual format | 5 | 331 | Mean Difference (IV, Fixed, 95% CI) | 0.16 [‐0.79, 1.10] |
| 33.3 Both group and individual formats | 6 | 487 | Mean Difference (IV, Fixed, 95% CI) | ‐0.00 [‐0.76, 0.76] |
| 34 Mass (change values) Show forest plot | 10 | Mean Difference (IV, Random, 95% CI) | Subtotals only | |
| 34.1 Group format | 3 | 211 | Mean Difference (IV, Random, 95% CI) | ‐1.23 [‐2.10, ‐0.35] |
| 34.2 Individual format | 4 | 186 | Mean Difference (IV, Random, 95% CI) | 0.10 [‐0.08, 0.28] |
| 34.3 Both group and individual formats | 3 | 617 | Mean Difference (IV, Random, 95% CI) | ‐0.58 [‐1.80, 0.63] |
| 35 BMI (follow‐up values) Show forest plot | 16 | Mean Difference (IV, Fixed, 95% CI) | Subtotals only | |
| 35.1 Group format | 3 | 347 | Mean Difference (IV, Fixed, 95% CI) | ‐0.71 [‐1.74, 0.32] |
| 35.2 Individual format | 7 | 647 | Mean Difference (IV, Fixed, 95% CI) | 0.13 [‐0.18, 0.44] |
| 35.3 Both group and individual formats | 6 | 458 | Mean Difference (IV, Fixed, 95% CI) | ‐0.03 [‐0.31, 0.26] |
| 36 BMI (change values) Show forest plot | 8 | Mean Difference (IV, Random, 95% CI) | Subtotals only | |
| 36.1 Group format | 3 | 211 | Mean Difference (IV, Random, 95% CI) | ‐0.67 [‐0.98, ‐0.36] |
| 36.2 Individual format | 3 | 150 | Mean Difference (IV, Random, 95% CI) | ‐0.03 [‐0.22, 0.15] |
| 36.3 Both group and individual formats | 2 | 124 | Mean Difference (IV, Random, 95% CI) | ‐0.12 [‐0.43, 0.20] |
| 37 Overall body fat (follow‐up values) Show forest plot | 18 | Std. Mean Difference (IV, Random, 95% CI) | Subtotals only | |
| 37.1 Group format | 3 | 299 | Std. Mean Difference (IV, Random, 95% CI) | ‐0.23 [‐0.46, ‐0.00] |
| 37.2 Individual format | 10 | 539 | Std. Mean Difference (IV, Random, 95% CI) | ‐0.30 [‐0.54, ‐0.06] |
| 37.3 Both group and individual formats | 5 | 324 | Std. Mean Difference (IV, Random, 95% CI) | 0.05 [‐0.17, 0.26] |
| 38 Overall body fat (change values) Show forest plot | 9 | Std. Mean Difference (IV, Random, 95% CI) | Subtotals only | |
| 38.1 Group format | 2 | 147 | Std. Mean Difference (IV, Random, 95% CI) | ‐0.06 [‐0.38, 0.26] |
| 38.2 Individual format | 6 | 270 | Std. Mean Difference (IV, Random, 95% CI) | ‐0.86 [‐1.74, 0.02] |
| 38.3 Both group and individual formats | 1 | 82 | Std. Mean Difference (IV, Random, 95% CI) | ‐0.29 [‐0.73, 0.14] |
| 39 Lower body strength (follow‐up values) Show forest plot | 9 | Std. Mean Difference (IV, Random, 95% CI) | Subtotals only | |
| 39.1 Group format | 2 | 290 | Std. Mean Difference (IV, Random, 95% CI) | 0.69 [0.29, 1.10] |
| 39.2 Individual format | 3 | 85 | Std. Mean Difference (IV, Random, 95% CI) | 1.04 [0.08, 2.00] |
| 39.3 Both group and individual formats | 4 | 200 | Std. Mean Difference (IV, Random, 95% CI) | 0.13 [‐0.22, 0.47] |
| 40 Lower body strength (change values) Show forest plot | 5 | Std. Mean Difference (IV, Random, 95% CI) | Subtotals only | |
| 40.1 Group format | 2 | 294 | Std. Mean Difference (IV, Random, 95% CI) | 0.92 [0.61, 1.22] |
| 40.2 Individual format | 3 | 289 | Std. Mean Difference (IV, Random, 95% CI) | 0.65 [0.09, 1.22] |
| 40.3 Both group and individual formats | 0 | 0 | Std. Mean Difference (IV, Random, 95% CI) | 0.0 [0.0, 0.0] |
| 41 Upper body strength (follow‐up values) Show forest plot | 12 | Std. Mean Difference (IV, Random, 95% CI) | Subtotals only | |
| 41.1 Group format | 4 | 365 | Std. Mean Difference (IV, Random, 95% CI) | 0.53 [‐0.29, 1.35] |
| 41.2 Individual format | 4 | 141 | Std. Mean Difference (IV, Random, 95% CI) | 0.63 [‐0.06, 1.32] |
| 41.3 Both group and individual formats | 4 | 200 | Std. Mean Difference (IV, Random, 95% CI) | 0.29 [0.01, 0.57] |
| 42 Upper body strength (change values) Show forest plot | 7 | Std. Mean Difference (IV, Random, 95% CI) | Subtotals only | |
| 42.1 Group format | 3 | 377 | Std. Mean Difference (IV, Random, 95% CI) | 1.01 [0.49, 1.53] |
| 42.2 Individual format | 3 | 310 | Std. Mean Difference (IV, Random, 95% CI) | 1.00 [‐0.08, 2.09] |
| 42.3 Both group and individual formats | 1 | 83 | Std. Mean Difference (IV, Random, 95% CI) | 0.16 [‐0.27, 0.59] |
| 43 Bone mineral density ‐ femoral neck (follow‐up and change values) Show forest plot | 4 | Std. Mean Difference (IV, Random, 95% CI) | Subtotals only | |
| 43.1 Group format | 0 | 0 | Std. Mean Difference (IV, Random, 95% CI) | 0.0 [0.0, 0.0] |
| 43.2 Individual format | 2 | 262 | Std. Mean Difference (IV, Random, 95% CI) | 0.17 [‐0.80, 1.14] |
| 43.3 Both group and individual formats | 2 | 524 | Std. Mean Difference (IV, Random, 95% CI) | 0.17 [0.00, 0.34] |
| 44 Bone mineral density ‐ lumbar spine (follow‐up and change values) Show forest plot | 4 | Std. Mean Difference (IV, Random, 95% CI) | Subtotals only | |
| 44.1 Group format | 0 | 0 | Std. Mean Difference (IV, Random, 95% CI) | 0.0 [0.0, 0.0] |
| 44.2 Individual format | 2 | 262 | Std. Mean Difference (IV, Random, 95% CI) | 0.20 [‐0.59, 0.98] |
| 44.3 Both group and individual formats | 2 | 524 | Std. Mean Difference (IV, Random, 95% CI) | 0.12 [‐0.06, 0.29] |
| 45 Bone mineral density ‐ total hip (follow‐up and change values) Show forest plot | 3 | Std. Mean Difference (IV, Random, 95% CI) | Subtotals only | |
| 45.1 Group format | 0 | 0 | Std. Mean Difference (IV, Random, 95% CI) | 0.0 [0.0, 0.0] |
| 45.2 Individual format | 1 | 39 | Std. Mean Difference (IV, Random, 95% CI) | 10.34 [7.84, 12.84] |
| 45.3 Both group and individual formats | 2 | 290 | Std. Mean Difference (IV, Random, 95% CI) | 0.64 [‐0.20, 1.48] |
| Outcome or subgroup title | No. of studies | No. of participants | Statistical method | Effect size |
| 1 Overall HRQoL (follow‐up values) Show forest plot | 22 | Std. Mean Difference (IV, Random, 95% CI) | Subtotals only | |
| 1.1 Home‐based | 5 | 792 | Std. Mean Difference (IV, Random, 95% CI) | 0.04 [‐0.11, 0.19] |
| 1.2 Facility‐based | 15 | 833 | Std. Mean Difference (IV, Random, 95% CI) | 0.55 [0.27, 0.83] |
| 1.3 Both home‐ and facility‐based | 4 | 227 | Std. Mean Difference (IV, Random, 95% CI) | 0.48 [0.04, 0.92] |
| 2 Overall HRQoL (change values) Show forest plot | 14 | Std. Mean Difference (IV, Random, 95% CI) | Subtotals only | |
| 2.1 Home‐based | 2 | 375 | Std. Mean Difference (IV, Random, 95% CI) | 0.27 [0.04, 0.50] |
| 2.2 Facility‐based | 10 | 492 | Std. Mean Difference (IV, Random, 95% CI) | 1.18 [0.53, 1.82] |
| 2.3 Both home‐ and facility‐based | 3 | 612 | Std. Mean Difference (IV, Random, 95% CI) | 0.06 [‐0.22, 0.33] |
| 3 Overall emotional function/mental health (follow‐up values) Show forest plot | 26 | Std. Mean Difference (IV, Random, 95% CI) | Subtotals only | |
| 3.1 Home‐based | 5 | 670 | Std. Mean Difference (IV, Random, 95% CI) | 0.11 [‐0.06, 0.27] |
| 3.2 Facility‐based | 15 | 901 | Std. Mean Difference (IV, Random, 95% CI) | 0.31 [0.12, 0.50] |
| 3.3 Both home‐ and facility‐based | 6 | 531 | Std. Mean Difference (IV, Random, 95% CI) | 0.15 [‐0.04, 0.34] |
| 4 Overall emotional function/mental health (change values) Show forest plot | 15 | Std. Mean Difference (IV, Random, 95% CI) | Subtotals only | |
| 4.1 Home‐based | 2 | 417 | Std. Mean Difference (IV, Random, 95% CI) | 0.16 [‐0.06, 0.37] |
| 4.2 Facility‐based | 10 | 550 | Std. Mean Difference (IV, Random, 95% CI) | 0.43 [0.04, 0.82] |
| 4.3 Both home‐ and facility‐based | 3 | 612 | Std. Mean Difference (IV, Random, 95% CI) | 0.09 [‐0.16, 0.34] |
| 5 Overall physical function (follow‐up values) Show forest plot | 25 | Std. Mean Difference (IV, Random, 95% CI) | Subtotals only | |
| 5.1 Home‐based | 5 | 720 | Std. Mean Difference (IV, Random, 95% CI) | 0.19 [0.03, 0.34] |
| 5.2 Facility‐based | 13 | 816 | Std. Mean Difference (IV, Random, 95% CI) | 0.43 [0.14, 0.73] |
| 5.3 Both home‐ and facility‐based | 7 | 592 | Std. Mean Difference (IV, Random, 95% CI) | 0.23 [‐0.02, 0.48] |
| 6 Overall physical function (change values) Show forest plot | 13 | Std. Mean Difference (IV, Random, 95% CI) | Subtotals only | |
| 6.1 Home‐based | 1 | 332 | Std. Mean Difference (IV, Random, 95% CI) | 0.26 [0.02, 0.51] |
| 6.2 Facility‐based | 9 | 489 | Std. Mean Difference (IV, Random, 95% CI) | 0.95 [0.31, 1.59] |
| 6.3 Both home‐ and facility‐based | 3 | 612 | Std. Mean Difference (IV, Random, 95% CI) | ‐0.08 [‐0.24, 0.08] |
| 7 Overall role function (follow‐up values) Show forest plot | 18 | Std. Mean Difference (IV, Random, 95% CI) | Subtotals only | |
| 7.1 Home‐based | 2 | 386 | Std. Mean Difference (IV, Random, 95% CI) | 0.26 [‐0.14, 0.66] |
| 7.2 Facility‐based | 12 | 564 | Std. Mean Difference (IV, Random, 95% CI) | 0.33 [‐0.03, 0.69] |
| 7.3 Both home‐ and facility‐based | 4 | 420 | Std. Mean Difference (IV, Random, 95% CI) | 0.20 [‐0.14, 0.54] |
| 8 Overall role function (change values) Show forest plot | 12 | Std. Mean Difference (IV, Random, 95% CI) | Subtotals only | |
| 8.1 Home‐based | 1 | 335 | Std. Mean Difference (IV, Random, 95% CI) | 0.17 [‐0.08, 0.41] |
| 8.2 Facility‐based | 8 | 368 | Std. Mean Difference (IV, Random, 95% CI) | 0.26 [‐0.06, 0.58] |
| 8.3 Both home‐ and facility‐based | 3 | 612 | Std. Mean Difference (IV, Random, 95% CI) | ‐0.06 [‐0.22, 0.10] |
| 9 Overall social well‐being/function (follow‐up values) Show forest plot | 18 | Std. Mean Difference (IV, Random, 95% CI) | Subtotals only | |
| 9.1 Home‐based | 2 | 386 | Std. Mean Difference (IV, Random, 95% CI) | ‐0.01 [‐0.23, 0.22] |
| 9.2 Facility‐based | 11 | 709 | Std. Mean Difference (IV, Random, 95% CI) | 0.22 [0.07, 0.37] |
| 9.3 Both home‐ and facility‐based | 5 | 462 | Std. Mean Difference (IV, Random, 95% CI) | 0.31 [0.03, 0.59] |
| 10 Overall social well‐being/function (change values) Show forest plot | 12 | Std. Mean Difference (IV, Random, 95% CI) | Subtotals only | |
| 10.1 Home‐based | 1 | 335 | Std. Mean Difference (IV, Random, 95% CI) | 0.97 [0.71, 1.23] |
| 10.2 Facility‐based | 7 | 395 | Std. Mean Difference (IV, Random, 95% CI) | 0.50 [0.05, 0.95] |
| 10.3 Both home‐ and facility‐based | 4 | 654 | Std. Mean Difference (IV, Random, 95% CI) | 0.41 [‐0.15, 0.96] |
| 11 Overall cognitive function (follow‐up values) Show forest plot | 5 | Std. Mean Difference (IV, Random, 95% CI) | Subtotals only | |
| 11.1 Home‐based | 0 | 0 | Std. Mean Difference (IV, Random, 95% CI) | 0.0 [0.0, 0.0] |
| 11.2 Facility‐based | 3 | 134 | Std. Mean Difference (IV, Random, 95% CI) | 0.32 [‐0.02, 0.66] |
| 11.3 Both home‐ and facility‐based | 2 | 55 | Std. Mean Difference (IV, Random, 95% CI) | 0.65 [‐0.01, 1.31] |
| 12 Overall cognitive function (change values) Show forest plot | 5 | Std. Mean Difference (IV, Random, 95% CI) | Subtotals only | |
| 12.1 Home‐based | 0 | 0 | Std. Mean Difference (IV, Random, 95% CI) | 0.0 [0.0, 0.0] |
| 12.2 Facility‐based | 3 | 134 | Std. Mean Difference (IV, Random, 95% CI) | 0.06 [‐0.31, 0.43] |
| 12.3 Both home‐ and facility‐based | 2 | 538 | Std. Mean Difference (IV, Random, 95% CI) | 0.03 [‐0.51, 0.57] |
| 13 Overall general health (follow‐up values) Show forest plot | 9 | Std. Mean Difference (IV, Random, 95% CI) | Subtotals only | |
| 13.1 Home‐based | 2 | 111 | Std. Mean Difference (IV, Random, 95% CI) | 0.43 [‐0.32, 1.17] |
| 13.2 Facility‐based | 6 | 273 | Std. Mean Difference (IV, Random, 95% CI) | 0.25 [0.01, 0.49] |
| 13.3 Both home‐ and facility‐based | 2 | 112 | Std. Mean Difference (IV, Random, 95% CI) | ‐0.26 [‐0.64, 0.11] |
| 14 Overall general health (change values) Show forest plot | 5 | Std. Mean Difference (IV, Random, 95% CI) | Subtotals only | |
| 14.1 Home‐based | 1 | 40 | Std. Mean Difference (IV, Random, 95% CI) | 0.42 [‐0.21, 1.05] |
| 14.2 Facility‐based | 2 | 59 | Std. Mean Difference (IV, Random, 95% CI) | 0.27 [‐0.49, 1.03] |
| 14.3 Both home‐ and facility‐based | 3 | 612 | Std. Mean Difference (IV, Random, 95% CI) | ‐0.07 [‐0.23, 0.09] |
| 15 Overall sexual function (follow‐up values) Show forest plot | 5 | Std. Mean Difference (IV, Fixed, 95% CI) | Subtotals only | |
| 15.1 Home‐based | 2 | 136 | Std. Mean Difference (IV, Fixed, 95% CI) | ‐0.00 [‐0.34, 0.34] |
| 15.2 Facility‐based | 2 | 193 | Std. Mean Difference (IV, Fixed, 95% CI) | 0.21 [‐0.07, 0.49] |
| 15.3 Both home‐ and facility‐based | 1 | 82 | Std. Mean Difference (IV, Fixed, 95% CI) | 0.29 [‐0.14, 0.73] |
| 16 Overall sexual function (change values) Show forest plot | 3 | Mean Difference (IV, Random, 95% CI) | Subtotals only | |
| 16.1 Home‐based | 0 | 0 | Mean Difference (IV, Random, 95% CI) | 0.0 [0.0, 0.0] |
| 16.2 Facility‐based | 2 | 193 | Mean Difference (IV, Random, 95% CI) | 3.83 [‐1.83, 9.48] |
| 16.3 Both home‐ and facility‐based | 1 | 500 | Mean Difference (IV, Random, 95% CI) | 0.5 [‐3.86, 4.86] |
| 17 Overall sleep (follow‐up values) Show forest plot | 5 | Std. Mean Difference (IV, Fixed, 95% CI) | Subtotals only | |
| 17.1 Home‐based | 0 | 0 | Std. Mean Difference (IV, Fixed, 95% CI) | 0.0 [0.0, 0.0] |
| 17.2 Facility‐based | 2 | 88 | Std. Mean Difference (IV, Fixed, 95% CI) | ‐0.26 [‐0.68, 0.16] |
| 17.3 Both home‐ and facility‐based | 3 | 100 | Std. Mean Difference (IV, Fixed, 95% CI) | 0.06 [‐0.33, 0.46] |
| 18 Overall sleep (change values) Show forest plot | 3 | Std. Mean Difference (IV, Random, 95% CI) | Subtotals only | |
| 18.1 Home‐based | 0 | 0 | Std. Mean Difference (IV, Random, 95% CI) | 0.0 [0.0, 0.0] |
| 18.2 Facility‐based | 1 | 56 | Std. Mean Difference (IV, Random, 95% CI) | 0.14 [‐0.38, 0.67] |
| 18.3 Both home‐ and facility‐based | 2 | 80 | Std. Mean Difference (IV, Random, 95% CI) | 0.14 [‐0.30, 0.58] |
| 19 Overall anxiety (follow‐up values) Show forest plot | 7 | Std. Mean Difference (IV, Random, 95% CI) | Subtotals only | |
| 19.1 Home‐based | 0 | 0 | Std. Mean Difference (IV, Random, 95% CI) | 0.0 [0.0, 0.0] |
| 19.2 Facility‐based | 4 | 192 | Std. Mean Difference (IV, Random, 95% CI) | ‐0.87 [‐1.34, ‐0.41] |
| 19.3 Both home‐ and facility‐based | 3 | 134 | Std. Mean Difference (IV, Random, 95% CI) | ‐0.14 [‐0.48, 0.21] |
| 20 Overall anxiety (change values) Show forest plot | 4 | Std. Mean Difference (IV, Fixed, 95% CI) | Subtotals only | |
| 20.1 Home‐based | 0 | 0 | Std. Mean Difference (IV, Fixed, 95% CI) | 0.0 [0.0, 0.0] |
| 20.2 Facility‐based | 2 | 119 | Std. Mean Difference (IV, Fixed, 95% CI) | ‐0.52 [‐0.88, ‐0.15] |
| 20.3 Both home‐ and facility‐based | 2 | 116 | Std. Mean Difference (IV, Fixed, 95% CI) | ‐0.23 [‐0.60, 0.13] |
| 21 Overall depression (follow‐up values) Show forest plot | 12 | Std. Mean Difference (IV, Random, 95% CI) | Subtotals only | |
| 21.1 Home‐based | 2 | 60 | Std. Mean Difference (IV, Random, 95% CI) | 0.34 [‐0.17, 0.85] |
| 21.2 Facility‐based | 8 | 483 | Std. Mean Difference (IV, Random, 95% CI) | ‐0.55 [‐0.85, ‐0.25] |
| 21.3 Both home‐ and facility‐based | 3 | 134 | Std. Mean Difference (IV, Random, 95% CI) | 0.05 [‐0.52, 0.61] |
| 22 Overall depression (change values) Show forest plot | 7 | Std. Mean Difference (IV, Random, 95% CI) | Subtotals only | |
| 22.1 Home‐based | 1 | 40 | Std. Mean Difference (IV, Random, 95% CI) | ‐0.39 [‐1.02, 0.23] |
| 22.2 Facility‐based | 3 | 140 | Std. Mean Difference (IV, Random, 95% CI) | ‐0.63 [‐0.97, ‐0.29] |
| 22.3 Both home‐ and facility‐based | 3 | 616 | Std. Mean Difference (IV, Random, 95% CI) | ‐0.11 [‐0.41, 0.19] |
| 23 Overall fatigue (follow‐up values) Show forest plot | 25 | Std. Mean Difference (IV, Random, 95% CI) | Subtotals only | |
| 23.1 Home‐based | 6 | 850 | Std. Mean Difference (IV, Random, 95% CI) | ‐0.18 [‐0.39, 0.03] |
| 23.2 Facility‐based | 13 | 749 | Std. Mean Difference (IV, Random, 95% CI) | ‐0.53 [‐0.77, ‐0.29] |
| 23.3 Both home‐ and facility‐based | 7 | 346 | Std. Mean Difference (IV, Random, 95% CI) | ‐0.09 [‐0.30, 0.13] |
| 24 Overall fatigue (change values) Show forest plot | 12 | Std. Mean Difference (IV, Random, 95% CI) | Subtotals only | |
| 24.1 Home‐based | 2 | 417 | Std. Mean Difference (IV, Random, 95% CI) | ‐0.25 [‐1.10, 0.61] |
| 24.2 Facility‐based | 7 | 296 | Std. Mean Difference (IV, Random, 95% CI) | ‐0.43 [‐1.06, 0.20] |
| 24.3 Both home‐ and facility‐based | 3 | 558 | Std. Mean Difference (IV, Random, 95% CI) | ‐0.01 [‐0.17, 0.16] |
| 25 Overall pain/disability (follow‐up values) Show forest plot | 9 | Std. Mean Difference (IV, Random, 95% CI) | Subtotals only | |
| 25.1 Home‐based | 3 | 249 | Std. Mean Difference (IV, Random, 95% CI) | 0.24 [‐0.20, 0.68] |
| 25.2 Facility‐based | 5 | 183 | Std. Mean Difference (IV, Random, 95% CI) | 0.09 [‐0.20, 0.38] |
| 25.3 Both home‐ and facility‐based | 2 | 112 | Std. Mean Difference (IV, Random, 95% CI) | ‐0.12 [‐0.49, 0.25] |
| 26 Overall pain/disability (change values) Show forest plot | 5 | Std. Mean Difference (IV, Random, 95% CI) | Subtotals only | |
| 26.1 Home‐based | 0 | 0 | Std. Mean Difference (IV, Random, 95% CI) | 0.0 [0.0, 0.0] |
| 26.2 Facility‐based | 3 | 139 | Std. Mean Difference (IV, Random, 95% CI) | 0.16 [‐0.19, 0.50] |
| 26.3 Both home‐ and facility‐based | 2 | 157 | Std. Mean Difference (IV, Random, 95% CI) | ‐0.29 [‐0.61, 0.02] |
| 27 Overall self‐esteem/body image (follow‐up values) Show forest plot | 12 | Std. Mean Difference (IV, Random, 95% CI) | Subtotals only | |
| 27.1 Home‐based | 2 | 124 | Std. Mean Difference (IV, Random, 95% CI) | ‐0.10 [‐1.17, 0.97] |
| 27.2 Facility‐based | 8 | 451 | Std. Mean Difference (IV, Random, 95% CI) | 0.29 [0.09, 0.50] |
| 27.3 Both home‐ and facility‐based | 2 | 92 | Std. Mean Difference (IV, Random, 95% CI) | 0.52 [‐0.44, 1.48] |
| 28 Overall self‐esteem/body image (change values) Show forest plot | 9 | Std. Mean Difference (IV, Random, 95% CI) | Subtotals only | |
| 28.1 Home‐based | 1 | 42 | Std. Mean Difference (IV, Random, 95% CI) | ‐0.22 [‐0.89, 0.45] |
| 28.2 Facility‐based | 6 | 376 | Std. Mean Difference (IV, Random, 95% CI) | 0.52 [‐0.09, 1.13] |
| 28.3 Both home‐ and facility‐based | 2 | 574 | Std. Mean Difference (IV, Random, 95% CI) | ‐0.05 [‐0.21, 0.12] |
| 29 Overall cardiorespiratory fitness (follow‐up values) Show forest plot | 23 | Std. Mean Difference (IV, Random, 95% CI) | Subtotals only | |
| 29.1 Home‐based | 5 | 245 | Std. Mean Difference (IV, Random, 95% CI) | 0.66 [0.40, 0.92] |
| 29.2 Facility‐based | 13 | 603 | Std. Mean Difference (IV, Random, 95% CI) | 0.45 [0.25, 0.66] |
| 29.3 Both home‐ and facility‐based | 6 | 426 | Std. Mean Difference (IV, Random, 95% CI) | 0.29 [0.03, 0.56] |
| 30 Overall cardiorespiratory fitness (change values) Show forest plot | 9 | Std. Mean Difference (IV, Random, 95% CI) | Subtotals only | |
| 30.1 Home‐based | 2 | 124 | Std. Mean Difference (IV, Random, 95% CI) | 0.39 [‐0.20, 0.99] |
| 30.2 Facility‐based | 4 | 116 | Std. Mean Difference (IV, Random, 95% CI) | 1.62 [1.03, 2.21] |
| 30.3 Both home‐ and facility‐based | 3 | 623 | Std. Mean Difference (IV, Random, 95% CI) | 0.40 [‐0.02, 0.82] |
| 31 Overall self‐reported physical activity (follow‐up values) Show forest plot | 18 | Std. Mean Difference (IV, Random, 95% CI) | Subtotals only | |
| 31.1 Home‐based | 9 | 1028 | Std. Mean Difference (IV, Random, 95% CI) | 0.57 [0.29, 0.85] |
| 31.2 Facility‐based | 3 | 513 | Std. Mean Difference (IV, Random, 95% CI) | 0.23 [0.05, 0.40] |
| 31.3 Both home‐ and facility‐based | 6 | 503 | Std. Mean Difference (IV, Random, 95% CI) | 0.62 [0.23, 1.00] |
| 32 Overall self‐reported physical activity (change values) Show forest plot | 8 | Std. Mean Difference (IV, Random, 95% CI) | Subtotals only | |
| 32.1 Home‐based | 3 | 495 | Std. Mean Difference (IV, Random, 95% CI) | 0.38 [0.18, 0.57] |
| 32.2 Facility‐based | 1 | 105 | Std. Mean Difference (IV, Random, 95% CI) | 0.21 [‐0.17, 0.60] |
| 32.3 Both home‐ and facility‐based | 4 | 674 | Std. Mean Difference (IV, Random, 95% CI) | 0.92 [0.14, 1.70] |
| 33 Overall objective physical activity (follow‐up values) Show forest plot | 11 | Std. Mean Difference (IV, Random, 95% CI) | Subtotals only | |
| 33.1 Home‐based | 5 | 854 | Std. Mean Difference (IV, Random, 95% CI) | 0.45 [0.07, 0.82] |
| 33.2 Facility‐based | 0 | 0 | Std. Mean Difference (IV, Random, 95% CI) | 0.0 [0.0, 0.0] |
| 33.3 Both home‐ and facility‐based | 6 | 416 | Std. Mean Difference (IV, Random, 95% CI) | 0.43 [0.17, 0.68] |
| 34 Overall objective physical activity (change values) Show forest plot | 5 | Std. Mean Difference (IV, Random, 95% CI) | Subtotals only | |
| 34.1 Home‐based | 2 | 374 | Std. Mean Difference (IV, Random, 95% CI) | 0.37 [‐0.56, 1.30] |
| 34.2 Facility‐based | 0 | 0 | Std. Mean Difference (IV, Random, 95% CI) | 0.0 [0.0, 0.0] |
| 34.3 Both home‐ and facility‐based | 3 | 134 | Std. Mean Difference (IV, Random, 95% CI) | 0.92 [0.56, 1.28] |
| 35 Mass (follow‐up values) Show forest plot | 16 | Mean Difference (IV, Fixed, 95% CI) | Subtotals only | |
| 35.1 Home‐based | 2 | 100 | Mean Difference (IV, Fixed, 95% CI) | ‐3.38 [‐10.29, 3.53] |
| 35.2 Facility‐based | 10 | 864 | Mean Difference (IV, Fixed, 95% CI) | 0.03 [‐0.56, 0.61] |
| 35.3 Both home‐ and facility‐based | 4 | 246 | Mean Difference (IV, Fixed, 95% CI) | 0.04 [‐3.96, 4.04] |
| 36 Mass (change values) Show forest plot | 11 | Mean Difference (IV, Random, 95% CI) | Subtotals only | |
| 36.1 Home‐based | 1 | 36 | Mean Difference (IV, Random, 95% CI) | ‐0.03 [‐1.46, 1.40] |
| 36.2 Facility‐based | 7 | 394 | Mean Difference (IV, Random, 95% CI) | ‐0.61 [‐1.31, 0.08] |
| 36.3 Both home‐ and facility‐based | 3 | 617 | Mean Difference (IV, Random, 95% CI) | ‐0.58 [‐1.80, 0.63] |
| 37 BMI (follow‐up values) Show forest plot | 17 | Mean Difference (IV, Fixed, 95% CI) | Subtotals only | |
| 37.1 Home‐based | 3 | 442 | Mean Difference (IV, Fixed, 95% CI) | ‐0.53 [‐1.64, 0.57] |
| 37.2 Facility‐based | 9 | 767 | Mean Difference (IV, Fixed, 95% CI) | 0.04 [‐0.17, 0.26] |
| 37.3 Both home‐ and facility‐based | 6 | 281 | Mean Difference (IV, Fixed, 95% CI) | ‐0.61 [‐2.14, 0.91] |
| 38 BMI (change values) Show forest plot | 8 | Mean Difference (IV, Random, 95% CI) | Subtotals only | |
| 38.1 Home‐based | 0 | 0 | Mean Difference (IV, Random, 95% CI) | 0.0 [0.0, 0.0] |
| 38.2 Facility‐based | 6 | 361 | Mean Difference (IV, Random, 95% CI) | ‐0.27 [‐0.58, 0.04] |
| 38.3 Both home‐ and facility‐based | 2 | 124 | Mean Difference (IV, Random, 95% CI) | ‐0.12 [‐0.43, 0.20] |
| 39 Overall body fat (follow‐up values) Show forest plot | 18 | Std. Mean Difference (IV, Random, 95% CI) | Subtotals only | |
| 39.1 Home‐based | 4 | 224 | Std. Mean Difference (IV, Random, 95% CI) | ‐0.18 [‐0.45, 0.09] |
| 39.2 Facility‐based | 7 | 550 | Std. Mean Difference (IV, Random, 95% CI) | ‐0.39 [‐0.69, ‐0.08] |
| 39.3 Both home‐ and facility‐based | 7 | 388 | Std. Mean Difference (IV, Random, 95% CI) | 0.01 [‐0.19, 0.21] |
| 40 Overall body fat (change values) Show forest plot | 9 | Std. Mean Difference (IV, Random, 95% CI) | Subtotals only | |
| 40.1 Home‐based | 2 | 78 | Std. Mean Difference (IV, Random, 95% CI) | ‐0.48 [‐0.97, ‐0.00] |
| 40.2 Facility‐based | 5 | 297 | Std. Mean Difference (IV, Random, 95% CI) | ‐0.84 [‐1.94, 0.26] |
| 40.3 Both home‐ and facility‐based | 2 | 124 | Std. Mean Difference (IV, Random, 95% CI) | ‐0.26 [‐0.62, 0.09] |
| 41 Lower body strength (follow‐up values) Show forest plot | 10 | Std. Mean Difference (IV, Random, 95% CI) | Subtotals only | |
| 41.1 Home‐based | 0 | 0 | Std. Mean Difference (IV, Random, 95% CI) | 0.0 [0.0, 0.0] |
| 41.2 Facility‐based | 5 | 417 | Std. Mean Difference (IV, Random, 95% CI) | 0.75 [0.24, 1.27] |
| 41.3 Both home‐ and facility‐based | 5 | 220 | Std. Mean Difference (IV, Random, 95% CI) | 0.12 [‐0.16, 0.40] |
| 42 Lower body strength (change values) Show forest plot | 8 | Std. Mean Difference (IV, Random, 95% CI) | Subtotals only | |
| 42.1 Home‐based | 0 | 0 | Std. Mean Difference (IV, Random, 95% CI) | 0.0 [0.0, 0.0] |
| 42.2 Facility‐based | 7 | 497 | Std. Mean Difference (IV, Random, 95% CI) | 0.80 [0.38, 1.23] |
| 42.3 Both home‐ and facility‐based | 1 | 223 | Std. Mean Difference (IV, Random, 95% CI) | 0.42 [0.15, 0.69] |
| 43 Upper body strength (follow‐up values) Show forest plot | 13 | Std. Mean Difference (IV, Random, 95% CI) | Subtotals only | |
| 43.1 Home‐based | 2 | 64 | Std. Mean Difference (IV, Random, 95% CI) | 0.58 [0.05, 1.12] |
| 43.2 Facility‐based | 8 | 513 | Std. Mean Difference (IV, Random, 95% CI) | 0.43 [‐0.12, 0.98] |
| 43.3 Both home‐ and facility‐based | 4 | 200 | Std. Mean Difference (IV, Random, 95% CI) | 0.29 [0.01, 0.57] |
| 44 Upper body strength (change values) Show forest plot | 8 | Std. Mean Difference (IV, Random, 95% CI) | Subtotals only | |
| 44.1 Home‐based | 0 | 0 | Std. Mean Difference (IV, Random, 95% CI) | 0.0 [0.0, 0.0] |
| 44.2 Facility‐based | 6 | 526 | Std. Mean Difference (IV, Random, 95% CI) | 0.92 [0.34, 1.50] |
| 44.3 Both home‐ and facility‐based | 2 | 306 | Std. Mean Difference (IV, Random, 95% CI) | 0.25 [0.03, 0.48] |
| 45 Bone mineral density ‐ femoral neck (follow‐up and change values) Show forest plot | 4 | Std. Mean Difference (IV, Random, 95% CI) | Subtotals only | |
| 45.1 Home‐based | 1 | 39 | Std. Mean Difference (IV, Random, 95% CI) | ‐0.37 [‐1.00, 0.27] |
| 45.2 Facility‐based | 0 | 0 | Std. Mean Difference (IV, Random, 95% CI) | 0.0 [0.0, 0.0] |
| 45.3 Both home‐ and facility‐based | 3 | 747 | Std. Mean Difference (IV, Random, 95% CI) | 0.32 [‐0.01, 0.65] |
| 46 Bone mineral density ‐ lumbar spine (follow‐up and change values) Show forest plot | 4 | Std. Mean Difference (IV, Random, 95% CI) | Subtotals only | |
| 46.1 Home‐based | 1 | 39 | Std. Mean Difference (IV, Random, 95% CI) | ‐0.26 [‐0.89, 0.37] |
| 46.2 Facility‐based | 0 | 0 | Std. Mean Difference (IV, Random, 95% CI) | 0.0 [0.0, 0.0] |
| 46.3 Both home‐ and facility‐based | 3 | 747 | Std. Mean Difference (IV, Random, 95% CI) | 0.30 [‐0.02, 0.63] |
| 47 Bone mineral density ‐ total hip (follow‐up and change values) Show forest plot | 3 | Std. Mean Difference (IV, Random, 95% CI) | Subtotals only | |
| 47.1 Home‐based | 1 | 39 | Std. Mean Difference (IV, Random, 95% CI) | 10.34 [7.84, 12.84] |
| 47.2 Facility‐based | 0 | 0 | Std. Mean Difference (IV, Random, 95% CI) | 0.0 [0.0, 0.0] |
| 47.3 Both home‐ and facility‐based | 2 | 290 | Std. Mean Difference (IV, Random, 95% CI) | 0.64 [‐0.20, 1.48] |
| Outcome or subgroup title | No. of studies | No. of participants | Statistical method | Effect size |
| 1 Overall HRQoL (follow‐up values) Show forest plot | 22 | Std. Mean Difference (IV, Random, 95% CI) | Subtotals only | |
| 1.1 Low risk of bias | 15 | 1521 | Std. Mean Difference (IV, Random, 95% CI) | 0.43 [0.19, 0.66] |
| 1.2 Unclear/high risk of bias | 7 | 475 | Std. Mean Difference (IV, Random, 95% CI) | 0.30 [0.06, 0.55] |
| 2 Overall HRQoL (change values) Show forest plot | 14 | Std. Mean Difference (IV, Random, 95% CI) | Subtotals only | |
| 2.1 Low risk of bias | 11 | 1360 | Std. Mean Difference (IV, Random, 95% CI) | 0.70 [0.28, 1.12] |
| 2.2 Unclear/high risk of bias | 3 | 99 | Std. Mean Difference (IV, Random, 95% CI) | 1.26 [‐0.11, 2.62] |
| 3 Overall emotional function/mental health (follow‐up values) Show forest plot | 26 | Std. Mean Difference (IV, Random, 95% CI) | Subtotals only | |
| 3.1 Low risk of bias | 15 | 1427 | Std. Mean Difference (IV, Random, 95% CI) | 0.22 [0.09, 0.34] |
| 3.2 Unclear/high risk of bias | 11 | 675 | Std. Mean Difference (IV, Random, 95% CI) | 0.19 [‐0.02, 0.40] |
| 4 Overall emotional function/mental health (change values) Show forest plot | 15 | Std. Mean Difference (IV, Random, 95% CI) | Subtotals only | |
| 4.1 Low risk of bias | 11 | 1399 | Std. Mean Difference (IV, Random, 95% CI) | 0.31 [0.04, 0.58] |
| 4.2 Unclear/high risk of bias | 4 | 180 | Std. Mean Difference (IV, Random, 95% CI) | 0.28 [‐0.08, 0.65] |
| 5 Overall physical function (follow‐up values) Show forest plot | 25 | Std. Mean Difference (IV, Random, 95% CI) | Subtotals only | |
| 5.1 Low risk of bias | 13 | 1343 | Std. Mean Difference (IV, Random, 95% CI) | 0.38 [0.13, 0.63] |
| 5.2 Unclear/high risk of bias | 12 | 786 | Std. Mean Difference (IV, Random, 95% CI) | 0.28 [0.14, 0.42] |
| 6 Overall physical function (change values) Show forest plot | 13 | Std. Mean Difference (IV, Random, 95% CI) | Subtotals only | |
| 6.1 Low risk of bias | 10 | 1335 | Std. Mean Difference (IV, Random, 95% CI) | 0.63 [0.19, 1.07] |
| 6.2 Unclear/high risk of bias | 3 | 98 | Std. Mean Difference (IV, Random, 95% CI) | 0.50 [0.09, 0.90] |
| 7 Overall role function (follow‐up values) Show forest plot | 18 | Std. Mean Difference (IV, Random, 95% CI) | Subtotals only | |
| 7.1 Low risk of bias | 12 | 1111 | Std. Mean Difference (IV, Random, 95% CI) | 0.32 [0.02, 0.61] |
| 7.2 Unclear/high risk of bias | 6 | 259 | Std. Mean Difference (IV, Random, 95% CI) | 0.24 [‐0.01, 0.48] |
| 8 Overall role function (change values) Show forest plot | 12 | Std. Mean Difference (IV, Random, 95% CI) | Subtotals only | |
| 8.1 Low risk of bias | 9 | 1218 | Std. Mean Difference (IV, Random, 95% CI) | 0.17 [‐0.06, 0.40] |
| 8.2 Unclear/high risk of bias | 3 | 97 | Std. Mean Difference (IV, Random, 95% CI) | 0.04 [‐0.36, 0.44] |
| 9 Overall social well‐being/function (follow‐up values) Show forest plot | 18 | Std. Mean Difference (IV, Random, 95% CI) | Subtotals only | |
| 9.1 Low risk of bias | 12 | 1263 | Std. Mean Difference (IV, Random, 95% CI) | 0.21 [0.07, 0.36] |
| 9.2 Unclear/high risk of bias | 6 | 294 | Std. Mean Difference (IV, Random, 95% CI) | 0.17 [‐0.06, 0.40] |
| 10 Overall social well‐being/function (change values) Show forest plot | 12 | Std. Mean Difference (IV, Random, 95% CI) | Subtotals only | |
| 10.1 Low risk of bias | 9 | 1286 | Std. Mean Difference (IV, Random, 95% CI) | 0.56 [0.13, 0.98] |
| 10.2 Unclear/high risk of bias | 3 | 98 | Std. Mean Difference (IV, Random, 95% CI) | 0.31 [‐0.09, 0.71] |
| 11 Overall cognitive function (follow‐up values) Show forest plot | 5 | Std. Mean Difference (IV, Random, 95% CI) | Subtotals only | |
| 11.1 Low risk of bias | 3 | 114 | Std. Mean Difference (IV, Random, 95% CI) | 0.45 [0.07, 0.82] |
| 11.2 Unclear/high risk of bias | 2 | 75 | Std. Mean Difference (IV, Random, 95% CI) | 0.52 [‐0.44, 1.48] |
| 12 Overall cognitive function (change values) Show forest plot | 5 | Std. Mean Difference (IV, Random, 95% CI) | Subtotals only | |
| 12.1 Low risk of bias | 4 | 615 | Std. Mean Difference (IV, Random, 95% CI) | 0.07 [‐0.28, 0.42] |
| 12.2 Unclear/high risk of bias | 1 | 57 | Std. Mean Difference (IV, Random, 95% CI) | ‐0.19 [‐0.71, 0.33] |
| 13 Overall general health (follow‐up values) Show forest plot | 9 | Std. Mean Difference (IV, Random, 95% CI) | Subtotals only | |
| 13.1 Low risk of bias | 5 | 267 | Std. Mean Difference (IV, Random, 95% CI) | 0.06 [‐0.31, 0.43] |
| 13.2 Unclear/high risk of bias | 4 | 189 | Std. Mean Difference (IV, Random, 95% CI) | 0.36 [0.02, 0.70] |
| 14 Overall general health (change values) Show forest plot | 9 | Std. Mean Difference (IV, Random, 95% CI) | Subtotals only | |
| 14.1 Low risk of bias | 7 | 829 | Std. Mean Difference (IV, Random, 95% CI) | 0.21 [‐0.08, 0.49] |
| 14.2 Unclear/high risk of bias | 2 | 77 | Std. Mean Difference (IV, Random, 95% CI) | 0.10 [‐0.35, 0.55] |
| 15 Overall sexual function (follow‐up values) Show forest plot | 5 | Std. Mean Difference (IV, Fixed, 95% CI) | Subtotals only | |
| 15.1 Low risk of bias | 2 | 193 | Std. Mean Difference (IV, Fixed, 95% CI) | 0.21 [‐0.07, 0.49] |
| 15.2 Unclear/high risk of bias | 3 | 218 | Std. Mean Difference (IV, Fixed, 95% CI) | 0.11 [‐0.16, 0.38] |
| 16 Overall sexual function (change values) Show forest plot | 3 | Std. Mean Difference (IV, Random, 95% CI) | Subtotals only | |
| 16.1 Low risk of bias | 3 | 693 | Std. Mean Difference (IV, Random, 95% CI) | 0.22 [‐0.08, 0.52] |
| 16.2 Unclear/high risk of bias | 0 | 0 | Std. Mean Difference (IV, Random, 95% CI) | 0.0 [0.0, 0.0] |
| 17 Overall sleep (follow‐up values) Show forest plot | 5 | Std. Mean Difference (IV, Fixed, 95% CI) | Subtotals only | |
| 17.1 Low risk of bias | 3 | 111 | Std. Mean Difference (IV, Fixed, 95% CI) | 0.09 [‐0.28, 0.47] |
| 17.2 Unclear/high risk of bias | 2 | 77 | Std. Mean Difference (IV, Fixed, 95% CI) | ‐0.35 [‐0.80, 0.10] |
| 18 Overall sleep (change values) Show forest plot | 3 | Std. Mean Difference (IV, Random, 95% CI) | Subtotals only | |
| 18.1 Low risk of bias | 2 | 80 | Std. Mean Difference (IV, Random, 95% CI) | 0.14 [‐0.30, 0.58] |
| 18.2 Unclear/high risk of bias | 1 | 56 | Std. Mean Difference (IV, Random, 95% CI) | 0.14 [‐0.38, 0.67] |
| 19 Overall anxiety (follow‐up values) Show forest plot | 7 | Std. Mean Difference (IV, Random, 95% CI) | Subtotals only | |
| 19.1 Low risk of bias | 4 | 235 | Std. Mean Difference (IV, Random, 95% CI) | ‐0.46 [‐0.89, ‐0.03] |
| 19.2 Unclear/high risk of bias | 3 | 91 | Std. Mean Difference (IV, Random, 95% CI) | ‐0.95 [‐1.92, 0.02] |
| 20 Overall anxiety (change values) Show forest plot | 4 | Std. Mean Difference (IV, Fixed, 95% CI) | Subtotals only | |
| 20.1 Low risk of bias | 3 | 177 | Std. Mean Difference (IV, Fixed, 95% CI) | ‐0.36 [‐0.66, ‐0.06] |
| 20.2 Unclear/high risk of bias | 1 | 58 | Std. Mean Difference (IV, Fixed, 95% CI) | ‐0.42 [‐0.95, 0.10] |
| 21 Overall self‐esteem/body image (follow‐up values) Show forest plot | 12 | Std. Mean Difference (IV, Random, 95% CI) | Subtotals only | |
| 21.1 Low risk of bias | 7 | 436 | Std. Mean Difference (IV, Random, 95% CI) | 0.14 [‐0.12, 0.40] |
| 21.2 Unclear/high risk of bias | 5 | 231 | Std. Mean Difference (IV, Random, 95% CI) | 0.48 [0.16, 0.80] |
| 22 Overall self‐esteem/body image (change values) Show forest plot | 9 | Std. Mean Difference (IV, Random, 95% CI) | Subtotals only | |
| 22.1 Low risk of bias | 7 | 914 | Std. Mean Difference (IV, Random, 95% CI) | 0.07 [‐0.21, 0.34] |
| 22.2 Unclear/high risk of bias | 2 | 78 | Std. Mean Difference (IV, Random, 95% CI) | 1.72 [‐1.48, 4.92] |
| 23 Overall depression (follow‐up values) Show forest plot | 12 | Std. Mean Difference (IV, Random, 95% CI) | Subtotals only | |
| 23.1 Low risk of bias | 7 | 520 | Std. Mean Difference (IV, Random, 95% CI) | ‐0.20 [‐0.52, 0.12] |
| 23.2 Unclear/high risk of bias | 5 | 137 | Std. Mean Difference (IV, Random, 95% CI) | ‐0.67 [‐1.23, ‐0.11] |
| 24 Overall depression (change values) Show forest plot | 7 | Std. Mean Difference (IV, Random, 95% CI) | Subtotals only | |
| 24.1 Low risk of bias | 5 | 737 | Std. Mean Difference (IV, Random, 95% CI) | ‐0.20 [‐0.47, 0.06] |
| 24.2 Unclear/high risk of bias | 2 | 79 | Std. Mean Difference (IV, Random, 95% CI) | ‐0.75 [‐1.39, ‐0.10] |
| 25 Overall fatigue (follow‐up values) Show forest plot | 25 | Std. Mean Difference (IV, Random, 95% CI) | Subtotals only | |
| 25.1 Low risk of bias | 15 | 1443 | Std. Mean Difference (IV, Random, 95% CI) | ‐0.38 [‐0.59, ‐0.18] |
| 25.2 Unclear/high risk of bias | 10 | 482 | Std. Mean Difference (IV, Random, 95% CI) | ‐0.25 [‐0.45, ‐0.05] |
| 26 Overall fatigue (change values) Show forest plot | 13 | Std. Mean Difference (IV, Random, 95% CI) | Subtotals only | |
| 26.1 Low risk of bias | 8 | 1091 | Std. Mean Difference (IV, Random, 95% CI) | ‐0.22 [‐0.61, 0.16] |
| 26.2 Unclear/high risk of bias | 5 | 198 | Std. Mean Difference (IV, Random, 95% CI) | ‐0.45 [‐0.95, 0.05] |
| 27 Overall pain/disability (follow‐up values) Show forest plot | 9 | Std. Mean Difference (IV, Random, 95% CI) | Subtotals only | |
| 27.1 Low risk of bias | 4 | 169 | Std. Mean Difference (IV, Random, 95% CI) | ‐0.13 [‐0.44, 0.18] |
| 27.2 Unclear/high risk of bias | 5 | 352 | Std. Mean Difference (IV, Random, 95% CI) | 0.25 [0.04, 0.46] |
| 28 Overall pain/disability (change values) Show forest plot | 6 | Std. Mean Difference (IV, Random, 95% CI) | Subtotals only | |
| 28.1 Low risk of bias | 2 | 136 | Std. Mean Difference (IV, Random, 95% CI) | ‐0.03 [‐0.45, 0.40] |
| 28.2 Unclear/high risk of bias | 4 | 196 | Std. Mean Difference (IV, Random, 95% CI) | ‐0.05 [‐0.36, 0.26] |
| 29 Overall cardiorespiratory fitness (follow‐up values) Show forest plot | 23 | Std. Mean Difference (IV, Random, 95% CI) | Subtotals only | |
| 29.1 Low risk of bias | 10 | 657 | Std. Mean Difference (IV, Random, 95% CI) | 0.44 [0.24, 0.65] |
| 29.2 Unclear/high risk of bias | 13 | 608 | Std. Mean Difference (IV, Random, 95% CI) | 0.44 [0.23, 0.65] |
| 30 Overall cardiorespiratory fitness (change values) Show forest plot | 9 | Std. Mean Difference (IV, Random, 95% CI) | Subtotals only | |
| 30.1 Low risk of bias | 4 | 632 | Std. Mean Difference (IV, Random, 95% CI) | 0.49 [‐0.09, 1.06] |
| 30.2 Unclear/high risk of bias | 5 | 231 | Std. Mean Difference (IV, Random, 95% CI) | 1.16 [0.60, 1.72] |
| 31 Overall self‐reported physical activity (follow‐up values) Show forest plot | 17 | Std. Mean Difference (IV, Random, 95% CI) | Subtotals only | |
| 31.1 Low risk of bias | 8 | 1482 | Std. Mean Difference (IV, Random, 95% CI) | 0.45 [0.21, 0.68] |
| 31.2 Unclear/high risk of bias | 9 | 530 | Std. Mean Difference (IV, Random, 95% CI) | 0.61 [0.31, 0.91] |
| 32 Overall self‐reported physical activity (change values) Show forest plot | 8 | Std. Mean Difference (IV, Random, 95% CI) | Subtotals only | |
| 32.1 Low risk of bias | 4 | 1047 | Std. Mean Difference (IV, Random, 95% CI) | 0.27 [‐0.00, 0.55] |
| 32.2 Unclear/high risk of bias | 4 | 227 | Std. Mean Difference (IV, Random, 95% CI) | 0.99 [0.40, 1.58] |
| 33 Overall objective physical activity (follow‐up values) Show forest plot | 11 | Std. Mean Difference (IV, Random, 95% CI) | Subtotals only | |
| 33.1 Low risk of bias | 7 | 1105 | Std. Mean Difference (IV, Random, 95% CI) | 0.41 [0.15, 0.66] |
| 33.2 Unclear/high risk of bias | 4 | 165 | Std. Mean Difference (IV, Random, 95% CI) | 0.50 [‐0.24, 1.25] |
| 34 Overall objective physical activity (change values) Show forest plot | 5 | Std. Mean Difference (IV, Random, 95% CI) | Subtotals only | |
| 34.1 Low risk of bias | 3 | 447 | Std. Mean Difference (IV, Random, 95% CI) | 0.56 [‐0.18, 1.30] |
| 34.2 Unclear/high risk of bias | 2 | 61 | Std. Mean Difference (IV, Random, 95% CI) | 0.99 [0.44, 1.54] |
| 35 Mass (follow‐up values) Show forest plot | 16 | Mean Difference (IV, Fixed, 95% CI) | Subtotals only | |
| 35.1 Low risk of bias | 8 | 828 | Mean Difference (IV, Fixed, 95% CI) | 0.05 [‐0.54, 0.64] |
| 35.2 Unclear/high risk of bias | 8 | 382 | Mean Difference (IV, Fixed, 95% CI) | ‐1.28 [‐4.26, 1.70] |
| 36 Mass (change values) Show forest plot | 11 | Mean Difference (IV, Random, 95% CI) | Subtotals only | |
| 36.1 Low risk of bias | 5 | 819 | Mean Difference (IV, Random, 95% CI) | ‐0.43 [‐1.05, 0.20] |
| 36.2 Unclear/high risk of bias | 6 | 228 | Mean Difference (IV, Random, 95% CI) | ‐0.62 [‐1.44, 0.19] |
| 37 BMI (follow‐up values) Show forest plot | 17 | Mean Difference (IV, Fixed, 95% CI) | Subtotals only | |
| 37.1 Low risk of bias | 10 | 1162 | Mean Difference (IV, Fixed, 95% CI) | 0.05 [‐0.16, 0.26] |
| 37.2 Unclear/high risk of bias | 7 | 319 | Mean Difference (IV, Fixed, 95% CI) | ‐1.07 [‐2.29, 0.14] |
| 38 BMI (change values) Show forest plot | 8 | Mean Difference (IV, Random, 95% CI) | Subtotals only | |
| 38.1 Low risk of bias | 5 | 363 | Mean Difference (IV, Random, 95% CI) | ‐0.24 [‐0.56, 0.08] |
| 38.2 Unclear/high risk of bias | 3 | 122 | Mean Difference (IV, Random, 95% CI) | ‐0.20 [‐0.65, 0.25] |
| 39 Overall body fat (follow‐up values) Show forest plot | 18 | Std. Mean Difference (IV, Random, 95% CI) | Subtotals only | |
| 39.1 Low risk of bias | 10 | 768 | Std. Mean Difference (IV, Random, 95% CI) | ‐0.19 [‐0.41, 0.03] |
| 39.2 Unclear/high risk of bias | 8 | 394 | Std. Mean Difference (IV, Random, 95% CI) | ‐0.17 [‐0.40, 0.07] |
| 40 Overall body fat (change values) Show forest plot | 9 | Std. Mean Difference (IV, Random, 95% CI) | Subtotals only | |
| 40.1 Low risk of bias | 5 | 341 | Std. Mean Difference (IV, Random, 95% CI) | ‐0.87 [‐1.86, 0.12] |
| 40.2 Unclear/high risk of bias | 4 | 158 | Std. Mean Difference (IV, Random, 95% CI) | ‐0.30 [‐0.62, 0.01] |
| 41 Lower body strength (follow‐up values) Show forest plot | 10 | Std. Mean Difference (IV, Random, 95% CI) | Subtotals only | |
| 41.1 Low risk of bias | 5 | 440 | Std. Mean Difference (IV, Random, 95% CI) | 0.61 [0.22, 1.00] |
| 41.2 Unclear/high risk of bias | 5 | 197 | Std. Mean Difference (IV, Random, 95% CI) | 0.23 [‐0.32, 0.79] |
| 42 Lower body strength (change values) Show forest plot | 8 | Std. Mean Difference (IV, Random, 95% CI) | Subtotals only | |
| 42.1 Low risk of bias | 3 | 339 | Std. Mean Difference (IV, Random, 95% CI) | 0.97 [0.70, 1.25] |
| 42.2 Unclear/high risk of bias | 5 | 381 | Std. Mean Difference (IV, Random, 95% CI) | 0.46 [0.04, 0.88] |
| 43 Upper body strength (follow‐up values) Show forest plot | 13 | Std. Mean Difference (IV, Random, 95% CI) | Subtotals only | |
| 43.1 Low risk of bias | 7 | 516 | Std. Mean Difference (IV, Random, 95% CI) | 0.53 [0.04, 1.01] |
| 43.2 Unclear/high risk of bias | 6 | 252 | Std. Mean Difference (IV, Random, 95% CI) | 0.29 [‐0.21, 0.78] |
| 44 Upper body strength (change values) Show forest plot | 9 | Std. Mean Difference (IV, Random, 95% CI) | Subtotals only | |
| 44.1 Low risk of bias | 4 | 381 | Std. Mean Difference (IV, Random, 95% CI) | 1.13 [0.46, 1.80] |
| 44.2 Unclear/high risk of bias | 5 | 487 | Std. Mean Difference (IV, Random, 95% CI) | 0.43 [‐0.05, 0.91] |
| 45 Bone mineral density ‐ femoral neck (follow‐up and change values) Show forest plot | 4 | Std. Mean Difference (IV, Random, 95% CI) | Subtotals only | |
| 45.1 Low risk of bias | 1 | 457 | Std. Mean Difference (IV, Random, 95% CI) | 0.18 [‐0.00, 0.37] |
| 45.2 Unclear/high risk of bias | 3 | 329 | Std. Mean Difference (IV, Random, 95% CI) | 0.18 [‐0.39, 0.75] |
| 46 Bone mineral density ‐ lumbar spine (follow‐up and change values) Show forest plot | 4 | Std. Mean Difference (IV, Random, 95% CI) | Subtotals only | |
| 46.1 Low risk of bias | 1 | 457 | Std. Mean Difference (IV, Random, 95% CI) | 0.09 [‐0.09, 0.27] |
| 46.2 Unclear/high risk of bias | 3 | 329 | Std. Mean Difference (IV, Random, 95% CI) | 0.27 [‐0.16, 0.70] |