Estimulación eléctrica neuromuscular (EENM) para el síndrome de dolor patelofemoral
Información
- DOI:
- https://doi.org/10.1002/14651858.CD011289.pub2Copiar DOI

- Base de datos:
-
- Cochrane Database of Systematic Reviews
- Versión publicada:
-
- 12 diciembre 2017see what's new
- Tipo:
-
- Intervention
- Etapa:
-
- Review
- Grupo Editorial Cochrane:
-
Grupo Cochrane de Lesiones óseas, articulares y musculares
- Copyright:
-
- Copyright © 2017 The Cochrane Collaboration. Published by John Wiley & Sons, Ltd.
Cifras del artículo
Altmetric:
Citado por:
Autores
Contributions of authors
Ana Luiza C Martimbianco: drafted the protocol and review, methodological and content issues
Maria R Torloni: drafted the protocol and review, content issues, language (English) issues
Brenda NG Andriolo: drafted the protocol and review, methodological and content issues
Gustavo Porfirio: drafted the protocol and review, content issues
Rachel Riera: drafted the protocol and review, methodological issues
Sources of support
Internal sources
-
Brazilian Cochrane Centre, Brazil.
External sources
-
No sources of support supplied, Other.
Declarations of interest
Ana Luiza C Martimbianco: none known
Maria R Torloni: none known
Brenda NG Andriolo: none known
Gustavo Porfirio: none known
Rachel Riera: none known
Acknowledgements
We thank Lindsey Elstub and Laura MacDonald for their assistance in the preparation of this review, Joanne Elliott for her advice on developing the search strategies, and the Brazilian Cochrane Centre team for their methodological support. We also thank Helen Handoll, Zipporah Iheozor‐ejiofor, Catherine Sherrington, Toby Smith, and Martin Underwood for their feedback and suggestions on the protocol and review.
This project was supported by the National Institute for Health Research (NIHR) via Cochrane Infrastructure funding to the Cochrane Bone, Joint and Muscle Trauma Group. The views and opinions expressed therein are those of the authors and do not necessarily reflect those of the Systematic Reviews Programme, NIHR, National Health Service (NHS), or the Department of Health.
Version history
| Published | Title | Stage | Authors | Version |
| 2017 Dec 12 | Neuromuscular electrical stimulation (NMES) for patellofemoral pain syndrome | Review | Ana Luiza C Martimbianco, Maria Regina Torloni, Brenda NG Andriolo, Gustavo JM Porfírio, Rachel Riera | |
| 2014 Sep 02 | Neuromuscular electrical stimulation (NMES) for patellofemoral pain syndrome | Protocol | Ana Luiza C Martimbianco, Maria R Torloni, Brenda NG Andriolo, Gustavo Porfirio, Rachel Riera | |
Differences between protocol and review
Consistent with the International Patellofemoral Pain consensus statements published in 2014, we replaced the terminology 'patellofemoral pain syndrome' with 'patellofemoral pain' in the written text.
As noted by the external referee, PFP is a multifactorial condition, and people with PFP can take several months of treatment to gain sustained improvement in outcomes. We therefore adjusted the 'Timing of outcome measurement' section from: at the end of the treatment, up to three months after treatment (short term), and over three months after treatment (long term) to: up to three months (short term), three to up to 12 months (medium term), and 12 months or above (long term). We adjusted the start point for follow‐up to the start of treatment (postrandomisation) and note that the timing of the short‐term follow‐up usually coincided with the end of treatment.
Keywords
MeSH
Medical Subject Headings (MeSH) Keywords
Medical Subject Headings Check Words
Adult; Female; Humans; Male;
PICO

Study flow diagram.

Risk of bias summary: review authors' judgements about each risk of bias item for each included study.

Risk of bias graph: review authors' judgements about each risk of bias item presented as percentages across all included studies.
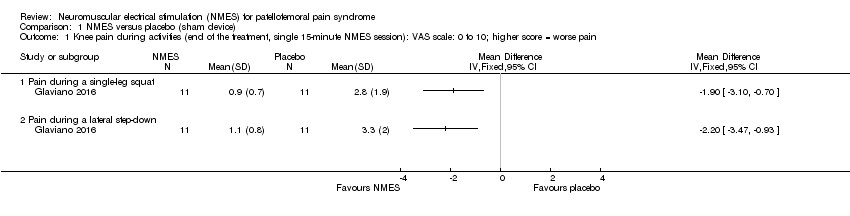
Comparison 1 NMES versus placebo (sham device), Outcome 1 Knee pain during activities (end of the treatment, single 15‐minute NMES session): VAS scale: 0 to 10; higher score = worse pain.

Comparison 2 NMES (+ other intervention) versus no NMES (+ same other intervention), Outcome 1 Knee pain (end of the treatment, 3 to 12 weeks): VAS scale: 0 to 10; higher score = worse pain.

Comparison 2 NMES (+ other intervention) versus no NMES (+ same other intervention), Outcome 2 Knee pain during activities (end of the treatment, 6 weeks): VAS scale: 0 to 10; higher score = worse pain.

Comparison 2 NMES (+ other intervention) versus no NMES (+ same other intervention), Outcome 3 Knee function (end of the treatment, 3 and 6 weeks): Cincinnati Knee Rating System and LEFS; higher score = better function.
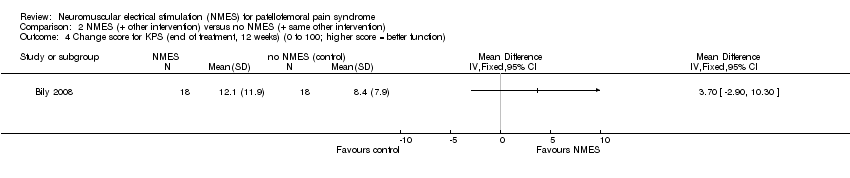
Comparison 2 NMES (+ other intervention) versus no NMES (+ same other intervention), Outcome 4 Change score for KPS (end of treatment, 12 weeks) (0 to 100; higher score = better function).

Comparison 2 NMES (+ other intervention) versus no NMES (+ same other intervention), Outcome 5 Good or normal muscle strength (end of the treatment, 6 weeks): grades 4 to 5 Lovett’s manual muscle scale.

Comparison 2 NMES (+ other intervention) versus no NMES (+ same other intervention), Outcome 6 Muscle strength (end of the treatment, 12 weeks): isokinetic dynamometer (N).

Comparison 3 NMES versus exercise, Outcome 1 Knee function (end of the treatment, 4 weeks): Arpège function scale: 0 to 18; higher score = better function.

Comparison 3 NMES versus exercise, Outcome 2 Muscle strength (end of the treatment, 4 weeks): isokinetic dynamometer (Nm).
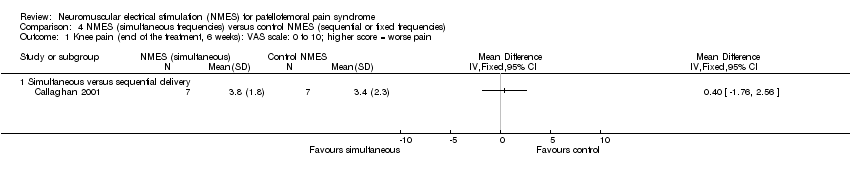
Comparison 4 NMES (simultaneous frequencies) versus control NMES (sequential or fixed frequencies), Outcome 1 Knee pain (end of the treatment, 6 weeks): VAS scale: 0 to 10; higher score = worse pain.

Comparison 4 NMES (simultaneous frequencies) versus control NMES (sequential or fixed frequencies), Outcome 2 Knee function (end of the treatment, 6 weeks): KPS: 0 to 100 scale; higher score = better function.
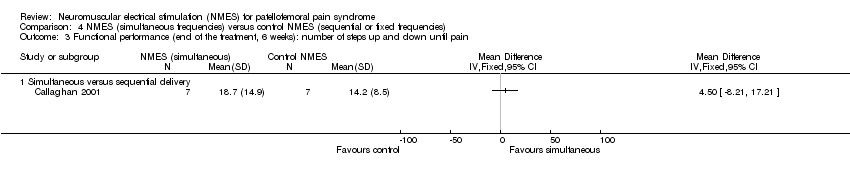
Comparison 4 NMES (simultaneous frequencies) versus control NMES (sequential or fixed frequencies), Outcome 3 Functional performance (end of the treatment, 6 weeks): number of steps up and down until pain.

Comparison 4 NMES (simultaneous frequencies) versus control NMES (sequential or fixed frequencies), Outcome 4 Quadriceps isometric muscle strength (end of the treatment, 6 weeks): dynamometer at 90°/s (Nm).

Comparison 4 NMES (simultaneous frequencies) versus control NMES (sequential or fixed frequencies), Outcome 5 Quadriceps isokinetic muscle strength (end of the treatment, 6 weeks): dynamometer at 90°/s (Nm).
| Neuromuscular electrical stimulation (NMES) plus other intervention (e.g. exercise) versus no NMES plus same other intervention for patellofemoral pain syndrome | ||||||
| Patient or population: people with patellofemoral pain syndrome1 Comparison: no NMES control plus same other active intervention | ||||||
| Outcomes | Illustrative comparative risks* (95% CI) | Relative effect | No. of participants | Quality of the evidence | Comments | |
| Assumed risk | Corresponding risk | |||||
| No NMES plus same other intervention | NMES plus other intervention (e.g. exercise) | |||||
| Knee pain (short term) | The mean knee pain ranged across control groups from | The mean knee pain in the intervention groups was | MD ‐1.63 (‐2.23 to ‐1.02) | 118 | ⊕⊝⊝⊝ | This difference may not be clinically important since the MCID for VAS (1.5 to 2.0, out of 10 points)5 lies within the 95% CI. |
| Knee pain (long term) | The median pain score in the study control group was 0.4 points (IQR 0.2 to 3.4). | The median pain score in the NMES group was 1.8 points (IQR 0.1 to 3.6). | See comment | 29 | ⊕⊝⊝⊝ | The difference was reported as not statistically significant. |
| Knee function (short term) | The mean knee function in the study control groups was | The mean difference in knee function in the intervention groups was | SMD 0.37 (‐0.11 to 0.84) | 70 | ⊕⊝⊝⊝ | 0.2 SD represents a small difference, 0.5 SD a moderate difference, and 0.8 SD a large difference. However, the mean differences in the 2 trials were small and unlikely to be clinically important (LEFS scale: MD 0.73; Cincinnati score: MD 4.65). |
| Knee function (long term) Kujala Patellofemoral Score (KPS) (0 to 100; higher score = better function). | The median KPS in the study control group was 95 (IQR 85 to 96). | The median KPS in the NMES group was 94 (IQR 88 to 96). | See comment | 29 | ⊕⊝⊝⊝ | The very small difference was reported as not statistically significant. |
| Adverse events ‐ not measured | See comment | See comment | Not estimable | ‐ | See comment | Not measured |
| *The basis for the assumed risk (e.g. the median control group risk across studies) is provided in footnotes. The corresponding risk (and its 95% confidence interval) is based on the assumed risk in the comparison group and the relative effect of the intervention (and its 95% CI). | ||||||
| GRADE Working Group grades of evidence | ||||||
| 1Where reported, there was a higher percentage of females (63% to 100%). The mean ages of the participants in the four trials ranged from 25 to 39 years. There was a wide duration of symptoms, with the minimum duration of symptoms for trial inclusion ranging from one to six months. | ||||||
| Neuromuscular electrical stimulation (NMES) versus exercise for patellofemoral pain syndrome | ||||||
| Patient or population: people with patellofemoral pain syndrome Comparison: exercise (either isokinetic or isometric; data combined in the analyses) | ||||||
| Outcomes | Illustrative comparative risks* (95% CI) | Relative effect | No. of participants | Quality of the evidence | Comments | |
| Assumed risk | Corresponding risk | |||||
| Exercise | NMES | |||||
| Knee pain (short term: < 3 months) | See comment | See comment | Not estimable | ‐ | See comment | Not estimable |
| Knee pain (longer term: > 3 months) | See comment | See comment | Not estimable | ‐ | See comment | Not estimable |
| Knee function | The mean knee function in the study control group was | The mean knee function in the intervention groups was | MD ‐0.94 (‐2.10 to 0.22) | 94 | ⊕⊝⊝⊝ | |
| Knee function (longer term: > 3 months) | See comment | See comment | Not estimable | ‐ | See comment | Not estimable |
| Adverse events | See comment | See comment | Not estimable | ‐ | See comment | Not measured |
| *The basis for the assumed risk (e.g. the median control group risk across studies) is provided in footnotes. The corresponding risk (and its 95% confidence interval) is based on the assumed risk in the comparison group and the relative effect of the intervention (and its 95% CI). | ||||||
| GRADE Working Group grades of evidence | ||||||
| 1This very demanding schedule is unlikely to be found in clinical practice. | ||||||
| Outcome or subgroup title | No. of studies | No. of participants | Statistical method | Effect size |
| 1 Knee pain during activities (end of the treatment, single 15‐minute NMES session): VAS scale: 0 to 10; higher score = worse pain Show forest plot | 1 | Mean Difference (IV, Fixed, 95% CI) | Totals not selected | |
| 1.1 Pain during a single‐leg squat | 1 | Mean Difference (IV, Fixed, 95% CI) | 0.0 [0.0, 0.0] | |
| 1.2 Pain during a lateral step‐down | 1 | Mean Difference (IV, Fixed, 95% CI) | 0.0 [0.0, 0.0] | |
| Outcome or subgroup title | No. of studies | No. of participants | Statistical method | Effect size |
| 1 Knee pain (end of the treatment, 3 to 12 weeks): VAS scale: 0 to 10; higher score = worse pain Show forest plot | 3 | 118 | Mean Difference (IV, Fixed, 95% CI) | ‐1.63 [‐2.23, ‐1.02] |
| 2 Knee pain during activities (end of the treatment, 6 weeks): VAS scale: 0 to 10; higher score = worse pain Show forest plot | 1 | Mean Difference (IV, Fixed, 95% CI) | Totals not selected | |
| 2.1 Pain during step‐down | 1 | Mean Difference (IV, Fixed, 95% CI) | 0.0 [0.0, 0.0] | |
| 2.2 Pain during step‐up | 1 | Mean Difference (IV, Fixed, 95% CI) | 0.0 [0.0, 0.0] | |
| 2.3 Pain during squat | 1 | Mean Difference (IV, Fixed, 95% CI) | 0.0 [0.0, 0.0] | |
| 3 Knee function (end of the treatment, 3 and 6 weeks): Cincinnati Knee Rating System and LEFS; higher score = better function Show forest plot | 2 | 70 | Std. Mean Difference (IV, Fixed, 95% CI) | 0.37 [‐0.11, 0.84] |
| 4 Change score for KPS (end of treatment, 12 weeks) (0 to 100; higher score = better function) Show forest plot | 1 | Mean Difference (IV, Fixed, 95% CI) | Totals not selected | |
| 5 Good or normal muscle strength (end of the treatment, 6 weeks): grades 4 to 5 Lovett’s manual muscle scale Show forest plot | 1 | Risk Ratio (M‐H, Fixed, 95% CI) | Totals not selected | |
| 6 Muscle strength (end of the treatment, 12 weeks): isokinetic dynamometer (N) Show forest plot | 1 | Mean Difference (IV, Fixed, 95% CI) | Totals not selected | |
| 6.1 Isometric strength with 30° knee flexion | 1 | Mean Difference (IV, Fixed, 95% CI) | 0.0 [0.0, 0.0] | |
| 6.2 Isometric strength with 60° knee flexion | 1 | Mean Difference (IV, Fixed, 95% CI) | 0.0 [0.0, 0.0] | |
| Outcome or subgroup title | No. of studies | No. of participants | Statistical method | Effect size |
| 1 Knee function (end of the treatment, 4 weeks): Arpège function scale: 0 to 18; higher score = better function Show forest plot | 1 | Mean Difference (IV, Fixed, 95% CI) | Totals not selected | |
| 2 Muscle strength (end of the treatment, 4 weeks): isokinetic dynamometer (Nm) Show forest plot | 1 | Mean Difference (IV, Fixed, 95% CI) | Totals not selected | |
| 2.1 Isokinetic dynamometer at 30°/s | 1 | Mean Difference (IV, Fixed, 95% CI) | 0.0 [0.0, 0.0] | |
| 2.2 Isokinetic dynamometer at 300°/s | 1 | Mean Difference (IV, Fixed, 95% CI) | 0.0 [0.0, 0.0] | |
| Outcome or subgroup title | No. of studies | No. of participants | Statistical method | Effect size |
| 1 Knee pain (end of the treatment, 6 weeks): VAS scale: 0 to 10; higher score = worse pain Show forest plot | 1 | Mean Difference (IV, Fixed, 95% CI) | Totals not selected | |
| 1.1 Simultaneous versus sequential delivery | 1 | Mean Difference (IV, Fixed, 95% CI) | 0.0 [0.0, 0.0] | |
| 2 Knee function (end of the treatment, 6 weeks): KPS: 0 to 100 scale; higher score = better function Show forest plot | 2 | 88 | Mean Difference (IV, Fixed, 95% CI) | ‐1.16 [‐6.79, 4.47] |
| 2.1 Simultaneous versus sequential delivery | 1 | 14 | Mean Difference (IV, Fixed, 95% CI) | ‐5.90 [‐16.14, 4.34] |
| 2.2 Simultaneous versus fixed delivery | 1 | 74 | Mean Difference (IV, Fixed, 95% CI) | 0.90 [‐5.84, 7.64] |
| 3 Functional performance (end of the treatment, 6 weeks): number of steps up and down until pain Show forest plot | 1 | Mean Difference (IV, Fixed, 95% CI) | Totals not selected | |
| 3.1 Simultaneous versus sequential delivery | 1 | Mean Difference (IV, Fixed, 95% CI) | 0.0 [0.0, 0.0] | |
| 4 Quadriceps isometric muscle strength (end of the treatment, 6 weeks): dynamometer at 90°/s (Nm) Show forest plot | 2 | 88 | Mean Difference (IV, Fixed, 95% CI) | ‐1.15 [‐16.24, 13.94] |
| 4.1 Simultaneous versus sequential delivery | 1 | 14 | Mean Difference (IV, Fixed, 95% CI) | 3.40 [‐25.83, 32.63] |
| 4.2 Simultaneous versus fixed delivery | 1 | 74 | Mean Difference (IV, Fixed, 95% CI) | ‐2.80 [‐20.42, 14.82] |
| 5 Quadriceps isokinetic muscle strength (end of the treatment, 6 weeks): dynamometer at 90°/s (Nm) Show forest plot | 2 | 88 | Mean Difference (IV, Fixed, 95% CI) | ‐7.28 [‐24.45, 9.89] |
| 5.1 Simultaneous versus sequential delivery | 1 | 14 | Mean Difference (IV, Fixed, 95% CI) | 6.10 [‐30.70, 42.90] |
| 5.2 Simultaneous versus fixed delivery | 1 | 74 | Mean Difference (IV, Fixed, 95% CI) | ‐11.0 [‐30.41, 8.41] |