استفاده از برنامه توانبخشی ورزشمحور برای درمان هیپرتانسیون ریوی
Referencias
منابع مطالعات واردشده در این مرور
منابع مطالعات خارجشده از این مرور
منابع اضافی
Characteristics of studies
Characteristics of included studies [ordered by study ID]
Ir a:
| Methods | Study design: RCT Study grouping: Parallel group | |
| Participants | Baseline characteristics Exercise training
Control
Included criteria: Quote "Patients with World Health Organization (WHO) group 1 PH were recruited from local outpatient clinics and enrolled between September 2009 and October 2011. Men and women were eligible if they were between 21 and 82 years of age, had PH diagnosed by a resting mean pulmonary arterial pressure ≥ 25 mm Hg as measured by right‐sided heart catheterization, were on stable PH therapies for at least 3 months, were sedentary, and had no pulmonary rehabilitation for 6 months prior to enrolment". Excluded criteria: Quote "To avoid “ceiling” or “floor” effects, patients were excluded if they were classified ed as WHO and New York Heart Association (NYHA) functional class I and could walk 400 m during a 6MWT, or classified as functional class IV and could not walk 50 m during a 6MWT. Additional exclusion criteria included FEV1 /FVC ratio ≤ 65%; history of ischaemic heart disease; ejection fraction < 40%; documented pulmonary capillary wedge pressure ≥ 18 mm Hg; significant hepatic, renal, or mitochondrial dysfunctions; severe psychiatric disease; use of medications that may limit exercise capacity or ability to adapt to exercise training; antiretroviral therapies; illicit drugs; tobacco use; or pregnancy". Pretreatment: Control group had worse lung function | |
| Interventions | Intervention characteristics Exercise training
Control
| |
| Outcomes | 6MWD VO2peak Anaerobic threshold HRQoL (SF‐36): Role physical HRQoL (SF36): Bodily pain HRQoL (SF‐36): General health HRQoL (SF‐36): Vitality HRQoL (SF‐36): Social function HRQoL (SF‐36): Role emotional HRQoL (SF‐36): Mental health HRQoL: Physical summary score (SF‐36) HRQoL: Mental summary score (SF‐36) HRQol (CAMPHOR): Symptoms HRQol (CAMPHOR): Activities HRQol (CAMPHOR): QoL NYHA Class | |
| Identification | This work was supported by the US National Institutes of Health (Intramural Funds 1 Z01 CL060068‐05 CC) | |
| Notes | ||
| Risk of bias | ||
| Bias | Authors' judgement | Support for judgement |
| Random sequence generation (selection bias) | Unclear risk | Quote: "Patients who enrolled in the protocol were sequentially assigned subject numbers that randomly corresponded to a group receiving concurrent patient education plus aerobic exercise training (EXE) or to a group that received only the patient education portion of the regimen (EDU)." |
| Allocation concealment (selection bias) | Unclear risk | Not specified. Quote " Following the baseline evaluations, patients were informed of the group to which they were randomly assigned" |
| Blinding of participants and personnel (performance bias) | High risk | Quote: "Study personnel were blind to the randomization of patients during all baseline evaluations." |
| Blinding of outcome assessment (detection bias) | Low risk | Quote: "Investigators administering the CPET, 6MWT, and questionnaires were blind to randomization at baseline." |
| Incomplete outcome data (attrition bias) | Low risk | Quote: "criterion (Fig. 1). All 29 of these patients performed base‐ line testing. Based on their test responses, two of these patients were required to obtain additional medical clearance prior to beginning the intervention. One patient declined further participation while the other patient was cleared for participation and subsequently assigned a new subject number upon re‐entry into the protocol. This patient was originally assigned a subject number corresponding to EXE, but at re‐entry the randomization procedure resulted re‐assignment to EDU. As such, 28 patients in total participated in either the EXE or EDU groups (Fig. 1). Of the 14 patients allocated to the EXE group, two patients withdrew due to changes in medication and one withdrew due to low attendance at the exercise sessions. One patient in the EDU group was withdrawn from the study due to medication changes." |
| Selective reporting (reporting bias) | High risk | Comment: Trial protocol at clinicaltrials.gov states that they were also going to collect IPAQ, stages of exercise change, exercise self efficacy, profile of mood states and near infrared spectroscopy |
| Other bias | Low risk | |
| Methods | Study design: RCT Study grouping: Parallel group | |
| Participants | Baseline characteristics Exercise
Control
Included criteria: participants with PAH and inoperable or persistent CTEPH and chronic right heart failure who were stable on disease‐targeted medication for at least 2 months prior to inclusion were randomly assigned to a control and a training group. Medication remained unchanged during the study period. Excluded criteria: not specified Pretreatment: Nil evident | |
| Interventions | Intervention characteristics Exercise
Control
| |
| Outcomes | 6MWD VO2peak Wpeak (peak power) Morbidity ‐ adverse events Disease Progression Precluded from Training HRQoL (SF‐36): Physical functioning HRQoL (SF‐36): Role physical HRQoL (SF36): Bodily pain HRQoL (SF‐36): General health HRQoL (SF‐36): Vitality HRQoL (SF‐36): Social function HRQoL (SF‐36): Role emotional HRQoL (SF‐36): Mental health Discontinued training Haemodynamics ‐ mPAP (mmHg), PVR (Dynes), cardiac output (L/min) B‐type natriuretic peptide | |
| Identification | Sponsorship Source: funding to pay the open access publication charges for this article was provided by Centre for Pulmonary Hypertension, Thorax clinic at the University of Heidelberg, Germany Comments Author's contact details Nicola Ehlken University Hospital Heidelberg, [email protected]‐heidelberg.de Amalienstrasse 5, Heidelberg D‐69126, Germany | |
| Notes | ||
| Risk of bias | ||
| Bias | Authors' judgement | Support for judgement |
| Random sequence generation (selection bias) | Unclear risk | Does not specify methods of randomisation |
| Allocation concealment (selection bias) | Unclear risk | Does not specify whether allocation was concealed |
| Blinding of participants and personnel (performance bias) | High risk | Not possible to blind participants to intervention |
| Blinding of outcome assessment (detection bias) | Unclear risk | Quote: "Assessment of 6MWD, SF‐36 and other efficacy parameter were performed by investigators who were blinded to the clinical data" Not clear whether assessors were blinded to group allocation, especially for primary outcome |
| Incomplete outcome data (attrition bias) | High risk | Differential attrition ‐ 17% lost to follow‐up in exercise group, none lost to follow‐up in control group |
| Selective reporting (reporting bias) | High risk | Not all outcomes specified in the trial protocol are reported |
| Other bias | High risk | CONSORT diagram does not report how many people were assessed to arrive at the 95 participants enrolled |
| Methods | Study design: RCT Study grouping: Parallel group | |
| Participants | Baseline characteristics Exercise
Control
Included criteria: participants were included in the study if they had a confirmed diagnosis of idiopathic PAH, familial PAH or PAH associated with connective tissue disorders, based on elevated pulmonary artery pressures (> 25 mmHg at rest or > 30 mmHg during exercise) measured by right heart catheterisation; were medically stable and had been on PAH‐specific pharmaceutical therapy for 3 months prior to enrolment into the study; were in WHO functional class II or III; and were willing to complete the 12‐week supervised and 12‐week home exercise training programmes. Excluded criteria: participants were excluded if they had:
Pretreatment: nil | |
| Interventions | Intervention characteristics Exercise
Control
| |
| Outcomes | 6MWD VO2peak Wpeak Anaerobic threshold HRQoL (SF‐36): Physical functioning HRQoL (Sf‐36): Role physical HRQoL (SF36): Bodily pain HRQoL (SF‐36): General health HRQoL (SF‐36): Vitality HRQoL (SF‐36): Social function HRQoL (SF‐36): Role emotional HRQoL (SF‐36): Mental health HRQol (CAMPHOR): Symptoms HRQol (CAMPHOR): Activities HRQol (CAMPHOR): QoL Morbidity Disease progression Symptoms precluding training Discontinued training NYHA class HRQoL: Physical summary score (SF‐36) HRQoL: Mental summary score (SF‐36) Assessed at baseline, 12 weeks (post intervention) and 24 weeks (follow‐up) | |
| Identification | Sponsorship source: Advanced Lung Disease Unit at Royal Perth Hospital and the Lung Institute of Western Australia Country: Australia Setting: Outpatient, hospital Comments: Author's name: Louise Ganderton Institution: Curtin University Email: [email protected] Address: School of Physiotherapy, Faculty of Health Sciences, The University of Sydney | |
| Notes | Protocol paper published: Ganderton 2011 Thesis available: http://espace.library.curtin.edu.au:80/R?func=dbin‐jump‐full&local_base=gen01‐era02&object_id=198083 | |
| Risk of bias | ||
| Bias | Authors' judgement | Support for judgement |
| Random sequence generation (selection bias) | Low risk | From thesis: "Permuted block randomisation with block sizes of four was used to generate a randomisation chart. Fourteen blocks were created in total using a web‐based research randomiser." |
| Allocation concealment (selection bias) | Unclear risk | Not specified |
| Blinding of participants and personnel (performance bias) | High risk | Not possible to blind participants to intervention |
| Blinding of outcome assessment (detection bias) | Low risk | From thesis: "The primary investigator (LG) carried out all assessments at baseline, 12 weeks and 24 weeks and was blinded to the participants group allocation...The physiotherapists responsible for conducting the exercise training sessions were not involved in any of the formal assessments" |
| Incomplete outcome data (attrition bias) | Low risk | Data available on all recruited participants for ITT. However planned to enrol 34 and only recruited 10 |
| Selective reporting (reporting bias) | Low risk | All outcomes reported |
| Other bias | Low risk | |
| Methods | Study design: RCT Study grouping: Parallel group | |
| Participants | Baseline characteristics Exercise
Control
Included criteria: adults (≥ 18 years) with confirmed PAH and CTEPH who underwent complete clinical work‐up including RHC. All participants were stable under optimised medical therapy (such as endothelin antagonists, iloprost, sildenafil, calcium channel blockers, anticoagulants, diuretics and supplemental oxygen) for at least 3 months before entering the study. Additional inclusion criteria were WHO functional class II to III Excluded criteria: no recent syncope, and no skeletal or muscle abnormalities prohibiting participation in an exercise training programme Pretreatment: nil | |
| Interventions | Intervention characteristics Exercise
Control
| |
| Outcomes | Morbidity ‐ adverse events Disease progression Precluded from training 6MWD | |
| Identification | Sponsorship source: this work was supported by the German National Research Agency (DFG): “Image‐based V/Q analysis” (FOR 474‐2) Country: Germany Setting: inpatient rehabilitation Comments: Author's name: Sebastian Ley Institution: University Hospital Heidelberg Email: [email protected] Address: Department of Diagnostic and Interventional Radiology, University Hospital Heidelberg, Im Neuenheimer Feld 430,69120 Heidelberg, Germany | |
| Notes | ||
| Risk of bias | ||
| Bias | Authors' judgement | Support for judgement |
| Random sequence generation (selection bias) | Low risk | Quote: "patients were randomly assigned to either a training or a control group using a permuted block randomization procedure." |
| Allocation concealment (selection bias) | Unclear risk | The method of allocation was not specified. |
| Blinding of participants and personnel (performance bias) | High risk | Unabel to blind participants or personnel due to the to intervention |
| Blinding of outcome assessment (detection bias) | Low risk | Quote: "Assessment of 6MWD and MR examination were performed by investigators who were blinded to the clinical data and group assignment of the patients. Evaluation of the MR data was done blinded to the clinical setting and in random order." |
| Incomplete outcome data (attrition bias) | Low risk | All randomised patients were analysed |
| Selective reporting (reporting bias) | Low risk | Unclear whether trial was registered but reporting does not appear selective |
| Other bias | Low risk | |
| Methods | Study design: RCT Study grouping: Parallel group | |
| Participants | Baseline characteristics Exercise
Control
Included criteria: people with severe chronic PH who were stable and compensated under optimised medical therapy (such as endothelin antagonists, iloprost, sildenafil, calcium channel blockers, anti‐coagulants, diuretics, and supplemental oxygen) for at least 3 months before entering the study were invited to participate. Additional inclusion criteria were age 18‐75 years, WHO functional class II to IV. Excluded criteria: no recent syncope, and no skeletal or muscle abnormalities prohibiting participation in an exercise programme Pretreatment: Nil evident | |
| Interventions | Intervention characteristics Exercise
Control
| |
| Outcomes | 6MWD VO2peak Wpeak Morbidity ‐ adverse events Disease progression Precluded from training Anaerobic threshold HRQoL (SF‐36): Physical functioning HRQoL (SF‐36): Role physical HRQoL (SF36): Bodily pain HRQoL (SF‐36): General health HRQoL (SF‐36): Vitality HRQoL (SF‐36): Social function HRQoL (SF‐36): Role emotional HRQoL (SF‐36): Mental health HRQoL:Physical Summary score (SF36) HRQoL:Mental Summary score (SF36) HRQol (CAMPHOR): QoL NYHA Class Discontinued training | |
| Identification | Sponsorship source: this study was funded by a grant from the German Pulmonary Hypertension Group, Pulmonale Hypertonie e.V., Rheinstetten, Germany. Country: Germany Setting: inpatient rehabilitation Comments: Author's name: Derliz Mereles Institution: University Hospital Heidelberg Email: [email protected]‐heidelberg.de Address: Department of Cardiology and Pneumology, University Hospital Heidelberg, INF 410, D‐69120 Heidelberg | |
| Notes | Adverse Outcomes | |
| Risk of bias | ||
| Bias | Authors' judgement | Support for judgement |
| Random sequence generation (selection bias) | Low risk | Comment: participants were randomly assigned to either a primary training group or a sedentary control group using a permuted block randomization procedure |
| Allocation concealment (selection bias) | Unclear risk | Comment: there is no comment regarding allocation concealment |
| Blinding of participants and personnel (performance bias) | High risk | Comment: unable to blind participants and personnel due to nature of intervention |
| Blinding of outcome assessment (detection bias) | Low risk | Quote: "The completed questionnaire at baseline was compared with the results after 15 weeks by investigators who were blinded to the patients’ clinical data and group assignment. To avoid bias as far as possible in this study, all measurements and/or offline readings were performed by investigators who were blinded to patient data and group assignment." |
| Incomplete outcome data (attrition bias) | Low risk | No dropouts reported |
| Selective reporting (reporting bias) | Low risk | The protocol was not registered or published however the outcome reporting is comprehensive. |
| Other bias | High risk | Comment: No CONSORT diagram so not possible to tell how many people were assessed in order to recruit the sample. |
| Methods | Study design: RCT Study grouping: Parallel group | |
| Participants | Baseline characteristics Exercise
Control
Included criteria: "Clinically stable PH patients in a single centre" Excluded criteria: unclear | |
| Interventions | Intervention characteristics Exercise
Control
| |
| Outcomes | Incremental shuttle walk test Endurance shuttle walk test Assessed at baseline and 3 months | |
| Identification | Sponsorship source: Country: Setting: Comments: Author's name: Anna Wilkinson Institution: Royal Hallamshire Hospital Email: Address: | |
| Notes | Reported as two abstracts In the Thorax abstract it does not specify the number in each group, only that 40 were randomised. ERS abstract says 18 in each group. Neither specifies age by allocated group | |
| Risk of bias | ||
| Bias | Authors' judgement | Support for judgement |
| Random sequence generation (selection bias) | Unclear risk | Abstract only, does not specify how sequence was generated |
| Allocation concealment (selection bias) | Unclear risk | Abstract only, does not specify |
| Blinding of participants and personnel (performance bias) | High risk | Not possible to blind participants to intervention |
| Blinding of outcome assessment (detection bias) | Low risk | Quote: "Blind assessment was undertaken pre intervention and following 3 months" |
| Incomplete outcome data (attrition bias) | High risk | Dropouts unclear. 2007 abstract specifies 40 participants and 2008 abstract specifies 36 participants. |
| Selective reporting (reporting bias) | High risk | Abstract only, not all outcomes reported |
| Other bias | High risk | Abstract only |
bpm: beats per minute; CAMPHOR: Cambridge Pulmonary Hypertension Outcome Review; CI: Cardiac Index; CPET: cardiopulmonary exercise test; CTEPH: chronic thromboembolitic pulmonary hypertension; Dual: patients on two pharmacotherapies; FEV1: forced expired volume in one second; FVC: forced vital capacity; HR: heart rate; HRQoL: health‐related quality of life; ITT: intention‐to‐treat; Mono: patients on single pharmacotherapy; mPAP: mean pulmonary artery pressure; NYHA: New York Heart Association; PAH: Pulmonary Artery Hypertension; PASP: Pulmonary Artery Systolic Pressure; PH: Pulmonary Hypertension, PLB: pursed lip breathing; PVR: pulmonary vascular resistance; RCT: randomised controlled trial; SF‐36: Short‐form 36; 6MWD: six minute walk distance; SPO2: oxygen saturation; Triple: patients on 3 pharmacotherapies; QoL: quality of life; VO2peak: peak oxygen uptake; Wpeak: peak power
Characteristics of excluded studies [ordered by study ID]
Ir a:
| Study | Reason for exclusion |
| Review paper | |
| Not an RCT | |
| No exercise training | |
| Not an RCT | |
| Wrong patient population | |
| Not an RCT | |
| Not an RCT | |
| Not an RCT | |
| Not an RCT | |
| Not an RCT | |
| Wrong intervention | |
| Wrong intervention | |
| No exercise training | |
| Not an RCT | |
| No exercise training |
RCT: randomised controlled trial
Data and analyses
| Outcome or subgroup title | No. of studies | No. of participants | Statistical method | Effect size |
| 1 Exercise capacity: 6MWD Show forest plot | 5 | 165 | Mean Difference (IV, Random, 95% CI) | 60.12 [30.17, 90.07] |
| Analysis 1.1 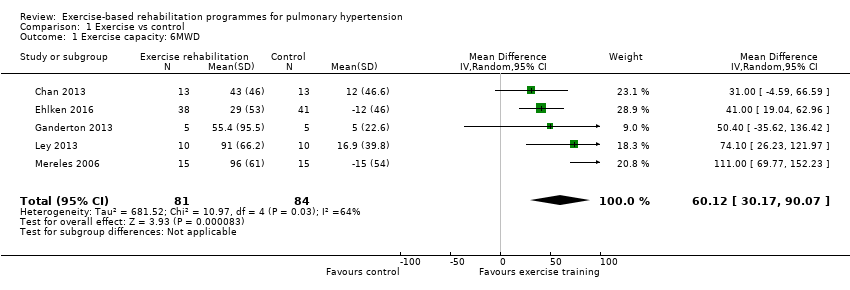 Comparison 1 Exercise vs control, Outcome 1 Exercise capacity: 6MWD. | ||||
| 2 Exercise capacity: VO2peak Show forest plot | 4 | 145 | Mean Difference (IV, Random, 95% CI) | 2.41 [1.38, 3.44] |
| Analysis 1.2  Comparison 1 Exercise vs control, Outcome 2 Exercise capacity: VO2peak. | ||||
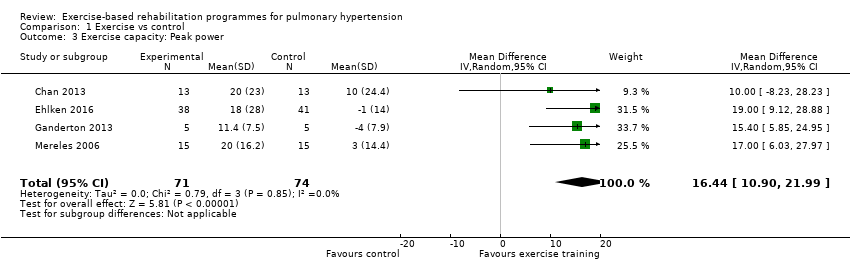
| 3 Exercise capacity: Peak power Show forest plot | 4 | 145 | Mean Difference (IV, Random, 95% CI) | 16.44 [10.90, 21.99] |
| Analysis 1.3  Comparison 1 Exercise vs control, Outcome 3 Exercise capacity: Peak power. | ||||
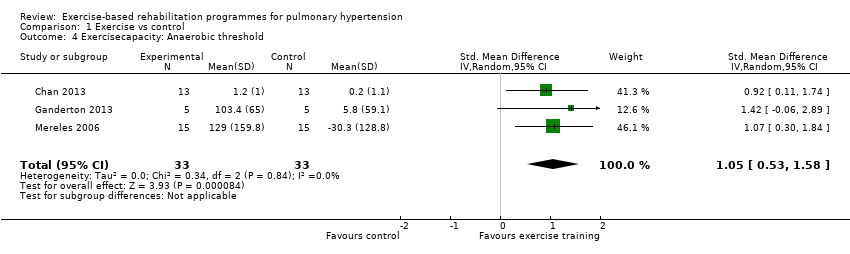
| 4 Exercisecapacity: Anaerobic threshold Show forest plot | 3 | 66 | Std. Mean Difference (IV, Random, 95% CI) | 1.05 [0.53, 1.58] |
| Analysis 1.4  Comparison 1 Exercise vs control, Outcome 4 Exercisecapacity: Anaerobic threshold. | ||||
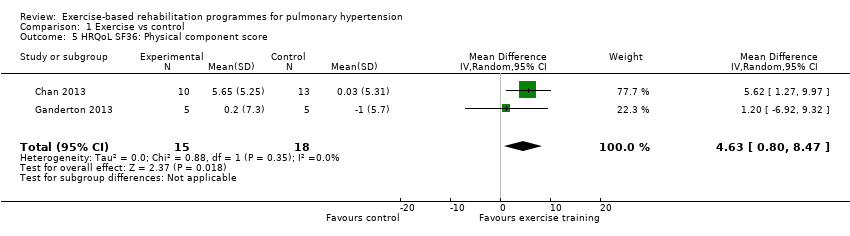
| 5 HRQoL SF36: Physical component score Show forest plot | 2 | 33 | Mean Difference (IV, Random, 95% CI) | 4.63 [0.80, 8.47] |
| Analysis 1.5  Comparison 1 Exercise vs control, Outcome 5 HRQoL SF36: Physical component score. | ||||
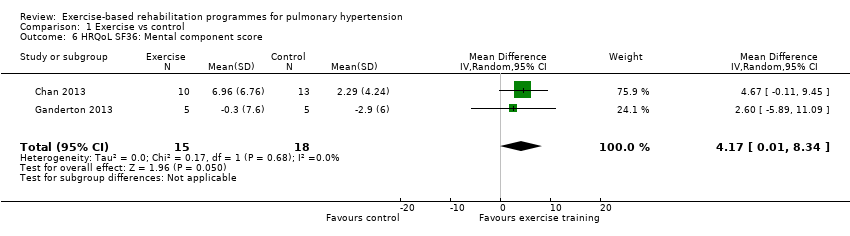
| 6 HRQoL SF36: Mental component score Show forest plot | 2 | 33 | Mean Difference (IV, Random, 95% CI) | 4.17 [0.01, 8.34] |
| Analysis 1.6  Comparison 1 Exercise vs control, Outcome 6 HRQoL SF36: Mental component score. | ||||
| 7 Adverse events Show forest plot | 5 | 165 | Risk Difference (M‐H, Random, 95% CI) | 0.00 [‐0.04, 0.04] |
| Analysis 1.7 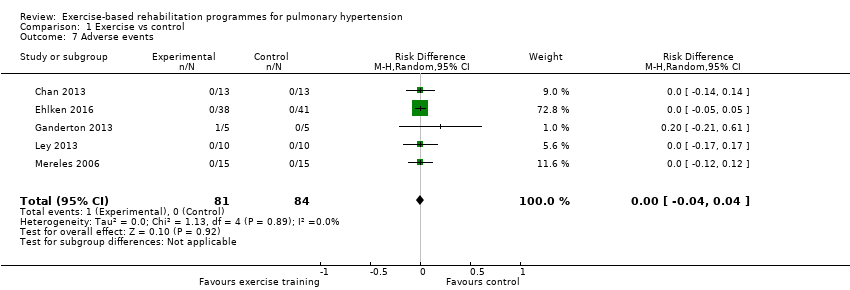 Comparison 1 Exercise vs control, Outcome 7 Adverse events. | ||||
| 8 HRQoL SF36: Physical function Show forest plot | 4 | 118 | Mean Difference (IV, Random, 95% CI) | 6.13 [‐3.73, 16.00] |
| Analysis 1.8  Comparison 1 Exercise vs control, Outcome 8 HRQoL SF36: Physical function. | ||||
| 9 HRQoL SF36: Role physical Show forest plot | 4 | 116 | Mean Difference (IV, Random, 95% CI) | 21.81 [14.40, 29.23] |
| Analysis 1.9 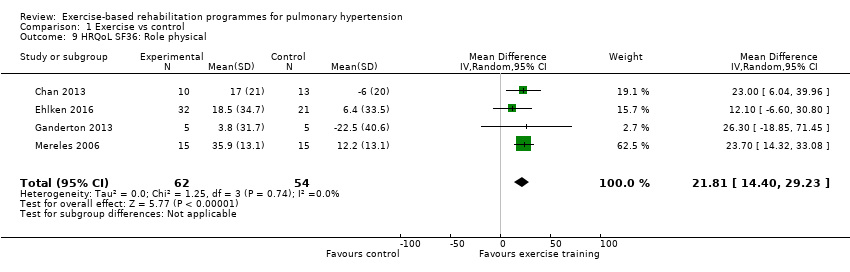 Comparison 1 Exercise vs control, Outcome 9 HRQoL SF36: Role physical. | ||||
| 10 HRQoL SF36: Bodily pain Show forest plot | 3 | 88 | Mean Difference (IV, Random, 95% CI) | 5.64 [‐3.09, 14.36] |
| Analysis 1.10  Comparison 1 Exercise vs control, Outcome 10 HRQoL SF36: Bodily pain. | ||||
| 11 HRQoL SF36: General health Show forest plot | 3 | 84 | Mean Difference (IV, Random, 95% CI) | 5.76 [‐0.80, 12.32] |
| Analysis 1.11  Comparison 1 Exercise vs control, Outcome 11 HRQoL SF36: General health. | ||||
| 12 HRQoL SF36: Mental health Show forest plot | 3 | 87 | Mean Difference (IV, Random, 95% CI) | 6.21 [‐1.85, 14.27] |
| Analysis 1.12 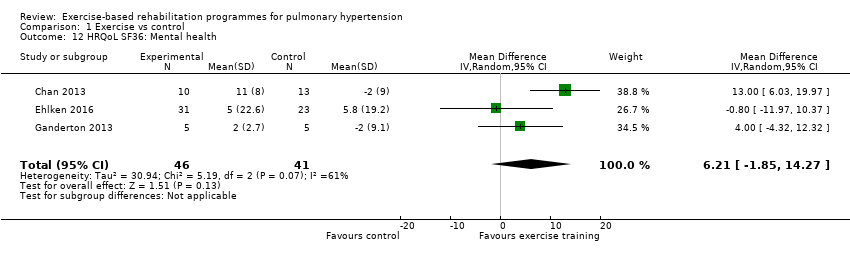 Comparison 1 Exercise vs control, Outcome 12 HRQoL SF36: Mental health. | ||||
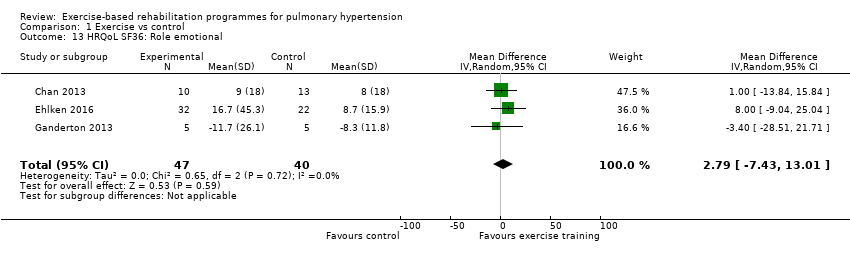
| 13 HRQoL SF36: Role emotional Show forest plot | 3 | 87 | Mean Difference (IV, Random, 95% CI) | 2.79 [‐7.43, 13.01] |
| Analysis 1.13  Comparison 1 Exercise vs control, Outcome 13 HRQoL SF36: Role emotional. | ||||
| 14 HRQol SF36: Vitality Show forest plot | 4 | 115 | Mean Difference (IV, Random, 95% CI) | 13.47 [7.55, 19.40] |
| Analysis 1.14  Comparison 1 Exercise vs control, Outcome 14 HRQol SF36: Vitality. | ||||
| 15 HRQoL SF36: Social function Show forest plot | 4 | 118 | Mean Difference (IV, Random, 95% CI) | 14.01 [9.82, 18.21] |
| Analysis 1.15 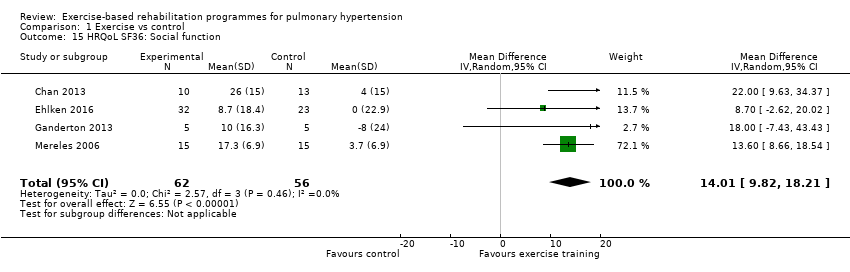 Comparison 1 Exercise vs control, Outcome 15 HRQoL SF36: Social function. | ||||
| 16 HRQoL: CAMPHOR activities Show forest plot | 2 | 33 | Mean Difference (IV, Random, 95% CI) | ‐1.33 [‐3.56, 0.90] |
| Analysis 1.16  Comparison 1 Exercise vs control, Outcome 16 HRQoL: CAMPHOR activities. | ||||
| 17 HRQoL: CAMPHOR symptoms Show forest plot | 2 | 36 | Mean Difference (IV, Random, 95% CI) | ‐3.08 [‐7.78, 1.62] |
| Analysis 1.17  Comparison 1 Exercise vs control, Outcome 17 HRQoL: CAMPHOR symptoms. | ||||
| 18 HRQoL: CAMPHOR QoL Show forest plot | 2 | 36 | Mean Difference (IV, Random, 95% CI) | ‐5.42 [‐8.03, ‐2.81] |
| Analysis 1.18  Comparison 1 Exercise vs control, Outcome 18 HRQoL: CAMPHOR QoL. | ||||
| 19 Cardiopulmonary haemodynamics Show forest plot | 1 | Mean Difference (IV, Random, 95% CI) | Subtotals only | |
| Analysis 1.19 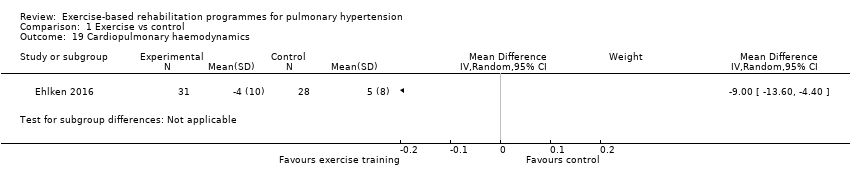 Comparison 1 Exercise vs control, Outcome 19 Cardiopulmonary haemodynamics. | ||||
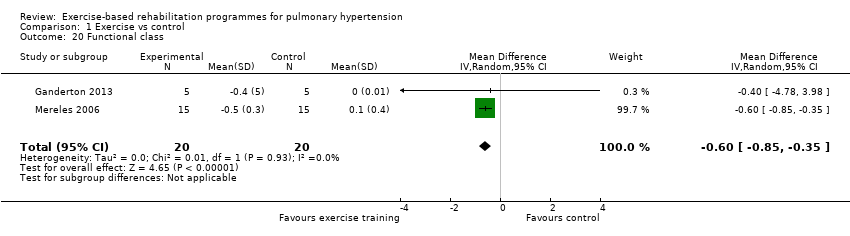
| 20 Functional class Show forest plot | 2 | 40 | Mean Difference (IV, Random, 95% CI) | ‐0.60 [‐0.85, ‐0.35] |
| Analysis 1.20  Comparison 1 Exercise vs control, Outcome 20 Functional class. | ||||
| 21 B‐type natriuretic peptide Show forest plot | 1 | Mean Difference (IV, Random, 95% CI) | Subtotals only | |
| Analysis 1.21  Comparison 1 Exercise vs control, Outcome 21 B‐type natriuretic peptide. | ||||
| 22 Exercise capacity: 6MWD, sensitivity analysis Show forest plot | 4 | 86 | Mean Difference (IV, Random, 95% CI) | 67.91 [27.12, 108.69] |
| Analysis 1.22 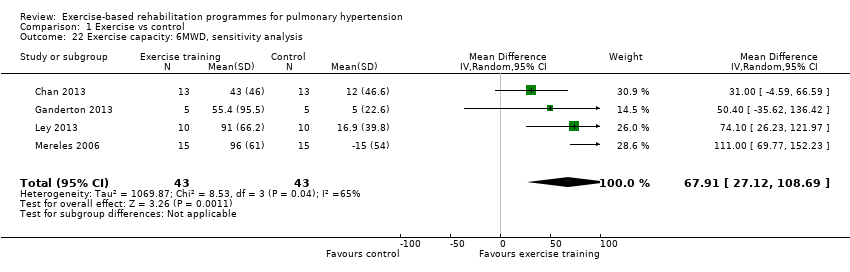 Comparison 1 Exercise vs control, Outcome 22 Exercise capacity: 6MWD, sensitivity analysis. | ||||
| 23 Exercise capacity: VO2peak, sensitivity analysis Show forest plot | 3 | 66 | Mean Difference (IV, Random, 95% CI) | 1.94 [0.86, 3.01] |
| Analysis 1.23  Comparison 1 Exercise vs control, Outcome 23 Exercise capacity: VO2peak, sensitivity analysis. | ||||
| 24 Exercise capacity: Peak power, sensitivity analysis Show forest plot | 3 | 66 | Mean Difference (IV, Random, 95% CI) | 15.27 [8.57, 21.97] |
| Analysis 1.24  Comparison 1 Exercise vs control, Outcome 24 Exercise capacity: Peak power, sensitivity analysis. | ||||
| 25 Exercise capacity 6MWD, PAH subgroup only Show forest plot | 2 | 36 | Mean Difference (IV, Random, 95% CI) | 33.84 [0.95, 66.73] |
| Analysis 1.25  Comparison 1 Exercise vs control, Outcome 25 Exercise capacity 6MWD, PAH subgroup only. | ||||
| 26 Exercise capacity: VO2peak, PAH subgroup only Show forest plot | 2 | 36 | Mean Difference (IV, Random, 95% CI) | 1.28 [‐0.19, 2.75] |
| Analysis 1.26 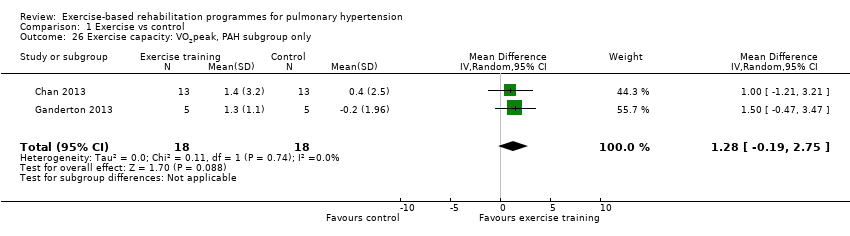 Comparison 1 Exercise vs control, Outcome 26 Exercise capacity: VO2peak, PAH subgroup only. | ||||
| 27 Exercise capacity: Peak power, PAH subgroup only Show forest plot | 2 | 36 | Mean Difference (IV, Random, 95% CI) | 14.24 [5.78, 22.70] |
| Analysis 1.27 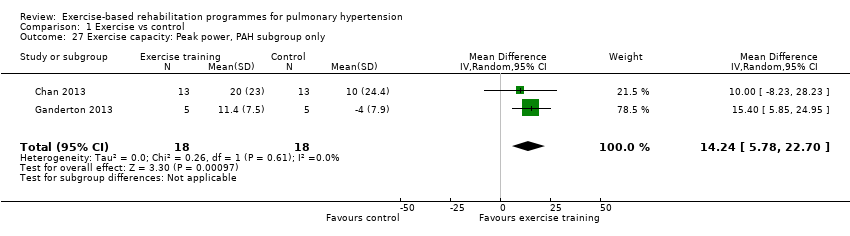 Comparison 1 Exercise vs control, Outcome 27 Exercise capacity: Peak power, PAH subgroup only. | ||||
| 28 Exercise capacity: Anaerobic threshold, PAH subgroup only Show forest plot | 2 | 36 | Mean Difference (IV, Random, 95% CI) | 41.31 [‐52.05, 134.67] |
| Analysis 1.28  Comparison 1 Exercise vs control, Outcome 28 Exercise capacity: Anaerobic threshold, PAH subgroup only. | ||||
| 29 Exercise capacity: 6MWD, subgroup analysis for setting of rehabilitation Show forest plot | 5 | Mean Difference (IV, Random, 95% CI) | Subtotals only | |
| Analysis 1.29  Comparison 1 Exercise vs control, Outcome 29 Exercise capacity: 6MWD, subgroup analysis for setting of rehabilitation. | ||||
| 29.1 Inpatient exercise training | 3 | 129 | Mean Difference (IV, Random, 95% CI) | 72.79 [28.09, 117.49] |
| 29.2 Outpatient exercise training | 2 | 36 | Mean Difference (IV, Random, 95% CI) | 33.84 [0.95, 66.73] |
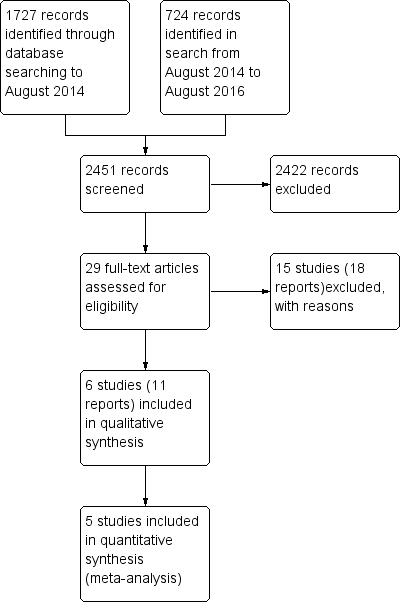
Study flow diagram

Risk of bias graph: review authors' judgements about each risk of bias item presented as percentages across all included studies

Risk of bias summary: review authors' judgements about each risk of bias item for each included study

Forest plot of comparison: 1 Exercise vs control, outcome: 1.1 Exercise capacity: 6MWD

Comparison 1 Exercise vs control, Outcome 1 Exercise capacity: 6MWD.

Comparison 1 Exercise vs control, Outcome 2 Exercise capacity: VO2peak.
Comparison 1 Exercise vs control, Outcome 3 Exercise capacity: Peak power.
Comparison 1 Exercise vs control, Outcome 4 Exercisecapacity: Anaerobic threshold.
Comparison 1 Exercise vs control, Outcome 5 HRQoL SF36: Physical component score.
Comparison 1 Exercise vs control, Outcome 6 HRQoL SF36: Mental component score.

Comparison 1 Exercise vs control, Outcome 7 Adverse events.

Comparison 1 Exercise vs control, Outcome 8 HRQoL SF36: Physical function.

Comparison 1 Exercise vs control, Outcome 9 HRQoL SF36: Role physical.

Comparison 1 Exercise vs control, Outcome 10 HRQoL SF36: Bodily pain.

Comparison 1 Exercise vs control, Outcome 11 HRQoL SF36: General health.

Comparison 1 Exercise vs control, Outcome 12 HRQoL SF36: Mental health.
Comparison 1 Exercise vs control, Outcome 13 HRQoL SF36: Role emotional.

Comparison 1 Exercise vs control, Outcome 14 HRQol SF36: Vitality.

Comparison 1 Exercise vs control, Outcome 15 HRQoL SF36: Social function.

Comparison 1 Exercise vs control, Outcome 16 HRQoL: CAMPHOR activities.

Comparison 1 Exercise vs control, Outcome 17 HRQoL: CAMPHOR symptoms.

Comparison 1 Exercise vs control, Outcome 18 HRQoL: CAMPHOR QoL.

Comparison 1 Exercise vs control, Outcome 19 Cardiopulmonary haemodynamics.
Comparison 1 Exercise vs control, Outcome 20 Functional class.
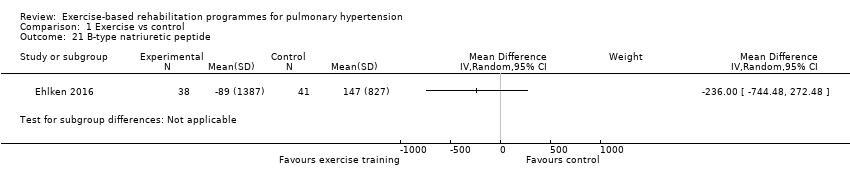
Comparison 1 Exercise vs control, Outcome 21 B‐type natriuretic peptide.

Comparison 1 Exercise vs control, Outcome 22 Exercise capacity: 6MWD, sensitivity analysis.

Comparison 1 Exercise vs control, Outcome 23 Exercise capacity: VO2peak, sensitivity analysis.
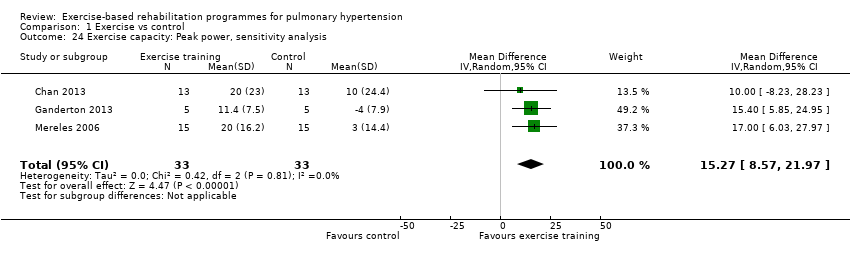
Comparison 1 Exercise vs control, Outcome 24 Exercise capacity: Peak power, sensitivity analysis.
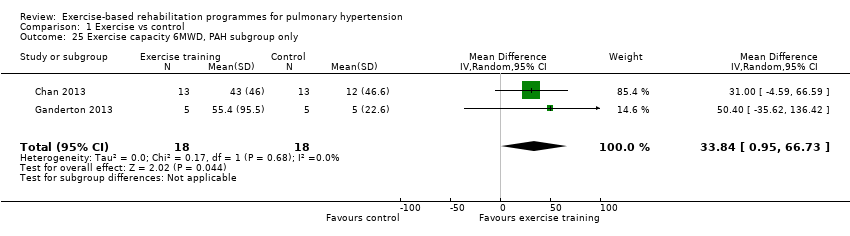
Comparison 1 Exercise vs control, Outcome 25 Exercise capacity 6MWD, PAH subgroup only.

Comparison 1 Exercise vs control, Outcome 26 Exercise capacity: VO2peak, PAH subgroup only.

Comparison 1 Exercise vs control, Outcome 27 Exercise capacity: Peak power, PAH subgroup only.

Comparison 1 Exercise vs control, Outcome 28 Exercise capacity: Anaerobic threshold, PAH subgroup only.
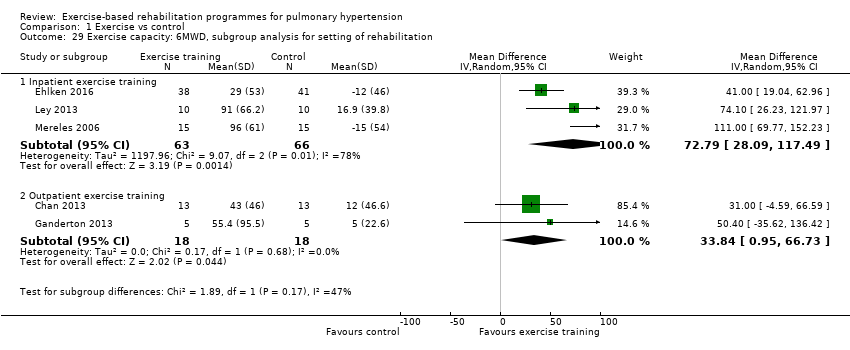
Comparison 1 Exercise vs control, Outcome 29 Exercise capacity: 6MWD, subgroup analysis for setting of rehabilitation.
| Exercise compared to control for pulmonary hypertension | |||||
| Patient or population: people with pulmonary hypertension | |||||
| Outcomes | Illustrative comparative effects* (95% CI) | No of participants | Quality of the evidence | Comments | |
| Response on control | Treatment effect | ||||
| Control | Exercise | ||||
| Change in functional exercise capacity (6MWD) | Median change = 5 m | The mean exercise capacity 6MWD in the intervention groups was 60.12 higher | 165 | ⊕⊕⊝⊝ | Subgroup PAH: (2 studies, n = 36), mean 6MWD for intervention group was 33.84 m higher (0.95 to 66.73 higher); these studies used outpatient exercise rehabilitation whilst other studies contributing to meta‐analysis had an inpatient training component Minimal important difference was 30 metres |
| Exercise capacity: VO2peak Oxygen uptake, ml/kg/min | Median change = ‐0.25 ml/kg/min | The mean VO2peak in the intervention groups was 2.41 ml/kg/min higher | 145 | ⊕⊕⊝⊝ | Subgroup PAH (2 studies, n = 36), the mean VO2peak in the intervention groups was 1.28 ml/kg/min higher (‐0.19 to 2.75 higher); these two studies used outpatient exercise rehabilitation whilst other studies contributing to meta‐analysis had an inpatient training component |
| Exercise capacity: peak power watts | Median change = 1 watt | The mean exercise capacity: peak power in the intervention groups was 16.44 W higher | 145 | ⊕⊕⊝⊝ | Subgroup PAH (2 studies, n = 36), the mean peak power in the intervention groups was 14.24 watts higher (5.78 to 22.70 higher); these two studies used outpatient exercise rehabilitation whilst other studies contributing to meta‐analysis had an inpatient training component |
| HRQoL SF‐36: PCS units Follow‐up median 11 weeks | Median change = ‐0.49 units | The mean HRQoL SF‐36: PCS in the intervention groups was 4.63 higher (0.80 to 8.47 higher) | 33 | ⊕⊕⊝⊝ | Both studies were only PAH |
| HRQoL SF‐36: MCS units Follow‐up median 11 weeks | Median change = ‐0.31 units | The mean HRQoL SF‐36: MCS in the intervention groups was 4.17 higher (0.01 to 8.34 higher) | 33 | ⊕⊕⊝⊝ | Both studies were only PAH |
| *The basis for the response on control is the median control group response across studies | |||||
| GRADE Working Group grades of evidence | |||||
| 1 Two studies did not report random sequence generation, no studies reported allocation concealment 3 Imprecision (2 small studies of 33 participants) and neither reported allocation concealment | |||||
| Outcome or subgroup title | No. of studies | No. of participants | Statistical method | Effect size |
| 1 Exercise capacity: 6MWD Show forest plot | 5 | 165 | Mean Difference (IV, Random, 95% CI) | 60.12 [30.17, 90.07] |
| 2 Exercise capacity: VO2peak Show forest plot | 4 | 145 | Mean Difference (IV, Random, 95% CI) | 2.41 [1.38, 3.44] |
| 3 Exercise capacity: Peak power Show forest plot | 4 | 145 | Mean Difference (IV, Random, 95% CI) | 16.44 [10.90, 21.99] |
| 4 Exercisecapacity: Anaerobic threshold Show forest plot | 3 | 66 | Std. Mean Difference (IV, Random, 95% CI) | 1.05 [0.53, 1.58] |
| 5 HRQoL SF36: Physical component score Show forest plot | 2 | 33 | Mean Difference (IV, Random, 95% CI) | 4.63 [0.80, 8.47] |
| 6 HRQoL SF36: Mental component score Show forest plot | 2 | 33 | Mean Difference (IV, Random, 95% CI) | 4.17 [0.01, 8.34] |
| 7 Adverse events Show forest plot | 5 | 165 | Risk Difference (M‐H, Random, 95% CI) | 0.00 [‐0.04, 0.04] |
| 8 HRQoL SF36: Physical function Show forest plot | 4 | 118 | Mean Difference (IV, Random, 95% CI) | 6.13 [‐3.73, 16.00] |
| 9 HRQoL SF36: Role physical Show forest plot | 4 | 116 | Mean Difference (IV, Random, 95% CI) | 21.81 [14.40, 29.23] |
| 10 HRQoL SF36: Bodily pain Show forest plot | 3 | 88 | Mean Difference (IV, Random, 95% CI) | 5.64 [‐3.09, 14.36] |
| 11 HRQoL SF36: General health Show forest plot | 3 | 84 | Mean Difference (IV, Random, 95% CI) | 5.76 [‐0.80, 12.32] |
| 12 HRQoL SF36: Mental health Show forest plot | 3 | 87 | Mean Difference (IV, Random, 95% CI) | 6.21 [‐1.85, 14.27] |
| 13 HRQoL SF36: Role emotional Show forest plot | 3 | 87 | Mean Difference (IV, Random, 95% CI) | 2.79 [‐7.43, 13.01] |
| 14 HRQol SF36: Vitality Show forest plot | 4 | 115 | Mean Difference (IV, Random, 95% CI) | 13.47 [7.55, 19.40] |
| 15 HRQoL SF36: Social function Show forest plot | 4 | 118 | Mean Difference (IV, Random, 95% CI) | 14.01 [9.82, 18.21] |
| 16 HRQoL: CAMPHOR activities Show forest plot | 2 | 33 | Mean Difference (IV, Random, 95% CI) | ‐1.33 [‐3.56, 0.90] |
| 17 HRQoL: CAMPHOR symptoms Show forest plot | 2 | 36 | Mean Difference (IV, Random, 95% CI) | ‐3.08 [‐7.78, 1.62] |
| 18 HRQoL: CAMPHOR QoL Show forest plot | 2 | 36 | Mean Difference (IV, Random, 95% CI) | ‐5.42 [‐8.03, ‐2.81] |
| 19 Cardiopulmonary haemodynamics Show forest plot | 1 | Mean Difference (IV, Random, 95% CI) | Subtotals only | |
| 20 Functional class Show forest plot | 2 | 40 | Mean Difference (IV, Random, 95% CI) | ‐0.60 [‐0.85, ‐0.35] |
| 21 B‐type natriuretic peptide Show forest plot | 1 | Mean Difference (IV, Random, 95% CI) | Subtotals only | |
| 22 Exercise capacity: 6MWD, sensitivity analysis Show forest plot | 4 | 86 | Mean Difference (IV, Random, 95% CI) | 67.91 [27.12, 108.69] |
| 23 Exercise capacity: VO2peak, sensitivity analysis Show forest plot | 3 | 66 | Mean Difference (IV, Random, 95% CI) | 1.94 [0.86, 3.01] |
| 24 Exercise capacity: Peak power, sensitivity analysis Show forest plot | 3 | 66 | Mean Difference (IV, Random, 95% CI) | 15.27 [8.57, 21.97] |
| 25 Exercise capacity 6MWD, PAH subgroup only Show forest plot | 2 | 36 | Mean Difference (IV, Random, 95% CI) | 33.84 [0.95, 66.73] |
| 26 Exercise capacity: VO2peak, PAH subgroup only Show forest plot | 2 | 36 | Mean Difference (IV, Random, 95% CI) | 1.28 [‐0.19, 2.75] |
| 27 Exercise capacity: Peak power, PAH subgroup only Show forest plot | 2 | 36 | Mean Difference (IV, Random, 95% CI) | 14.24 [5.78, 22.70] |
| 28 Exercise capacity: Anaerobic threshold, PAH subgroup only Show forest plot | 2 | 36 | Mean Difference (IV, Random, 95% CI) | 41.31 [‐52.05, 134.67] |
| 29 Exercise capacity: 6MWD, subgroup analysis for setting of rehabilitation Show forest plot | 5 | Mean Difference (IV, Random, 95% CI) | Subtotals only | |
| 29.1 Inpatient exercise training | 3 | 129 | Mean Difference (IV, Random, 95% CI) | 72.79 [28.09, 117.49] |
| 29.2 Outpatient exercise training | 2 | 36 | Mean Difference (IV, Random, 95% CI) | 33.84 [0.95, 66.73] |