Programas de rehabilitación con ejercicios para la hipertensión pulmonar
Información
- DOI:
- https://doi.org/10.1002/14651858.CD011285.pub2Copiar DOI

- Base de datos:
-
- Cochrane Database of Systematic Reviews
- Versión publicada:
-
- 18 enero 2017see what's new
- Tipo:
-
- Intervention
- Etapa:
-
- Review
- Grupo Editorial Cochrane:
-
Grupo Cochrane de Vías respiratorias
- Copyright:
-
- Copyright © 2017 The Cochrane Collaboration. Published by John Wiley & Sons, Ltd.
Cifras del artículo
Altmetric:
Citado por:
Autores
Contributions of authors
NM drafted the protocol with the assistance from AH and FK. NM and AH identified studies for the review, extracted data from the studies and drafted the review. All authors provided critical feedback on the review.
Sources of support
Internal sources
-
Griffith University, Australia.
Salary support, Norman Morris
-
Queensland Health, Australia.
Salary support, Fiona Kermeen
-
Alfred Health and La Trobe University, Australia.
Salary support, Anne Holland
External sources
-
The authors declare that no such external funding was received for this systematic review, Other.
Declarations of interest
NM: none known
FK: none known
AH: none known
Acknowledgements
Rebecca Normansell was the Editor for this review and commented critically on the review.
The Background and Methods sections of this review are based on a standard template used by Cochrane Airways.
This project was supported by the National Institute for Health Research (NIHR), via Cochrane Infrastructure funding to the Cochrane Airways Group. The views and opinions expressed therein are those of the authors and do not necessarily reflect those of the Systematic Reviews Programme, NIHR, NHS, or the Department of Health.
Version history
| Published | Title | Stage | Authors | Version |
| 2023 Mar 22 | Exercise‐based rehabilitation programmes for pulmonary hypertension | Review | Norman R Morris, Fiona D Kermeen, Arwel W Jones, Joanna YT Lee, Anne E Holland | |
| 2017 Jan 18 | Exercise‐based rehabilitation programmes for pulmonary hypertension | Review | Norman R Morris, Fiona D Kermeen, Anne E Holland | |
| 2014 Oct 10 | Exercise‐based rehabilitation programmes for pulmonary hypertension | Protocol | Norman R Morris, Fiona D Kermeen, Anne E Holland | |
Differences between protocol and review
We had intended to perform a subgroup analysis according to severity of PH, but insufficient data were available. We performed an additional subgroup analysis for setting of exercise rehabilitation programme, as there was marked heterogeneity in exercise outcomes that could have been affected by the programme model.
Keywords
MeSH
Medical Subject Headings (MeSH) Keywords
Medical Subject Headings Check Words
Humans; Middle Aged;
PICO
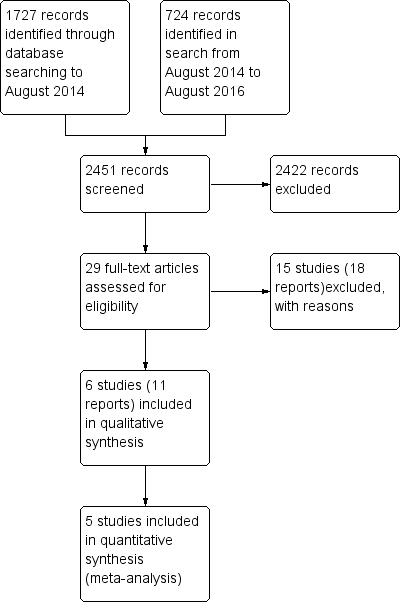
Study flow diagram

Risk of bias graph: review authors' judgements about each risk of bias item presented as percentages across all included studies

Risk of bias summary: review authors' judgements about each risk of bias item for each included study

Forest plot of comparison: 1 Exercise vs control, outcome: 1.1 Exercise capacity: 6MWD

Comparison 1 Exercise vs control, Outcome 1 Exercise capacity: 6MWD.

Comparison 1 Exercise vs control, Outcome 2 Exercise capacity: VO2peak.
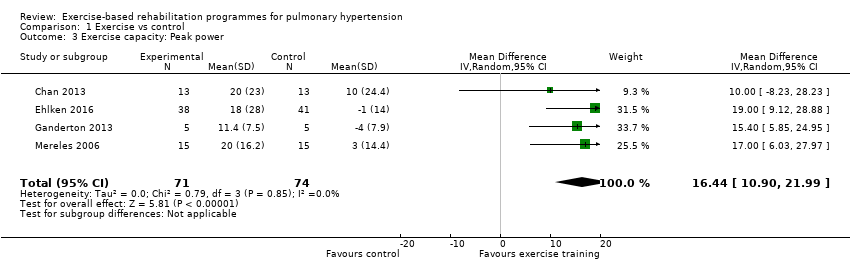
Comparison 1 Exercise vs control, Outcome 3 Exercise capacity: Peak power.
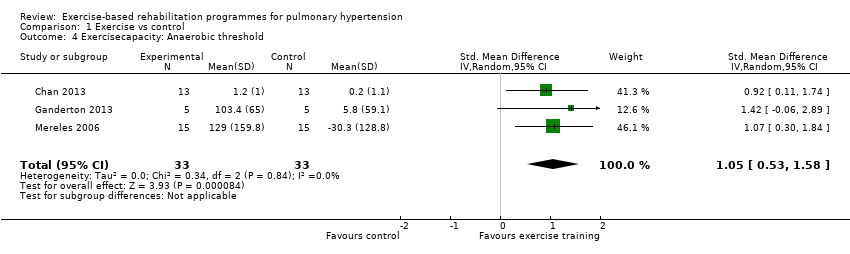
Comparison 1 Exercise vs control, Outcome 4 Exercisecapacity: Anaerobic threshold.
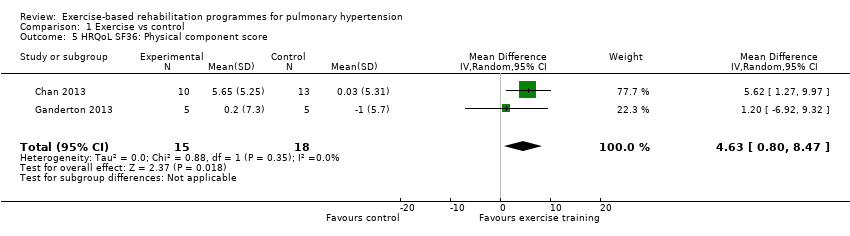
Comparison 1 Exercise vs control, Outcome 5 HRQoL SF36: Physical component score.
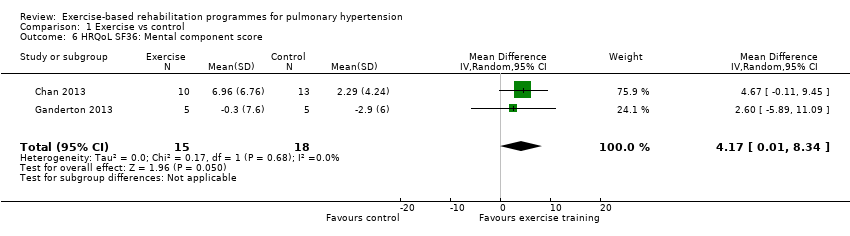
Comparison 1 Exercise vs control, Outcome 6 HRQoL SF36: Mental component score.

Comparison 1 Exercise vs control, Outcome 7 Adverse events.

Comparison 1 Exercise vs control, Outcome 8 HRQoL SF36: Physical function.
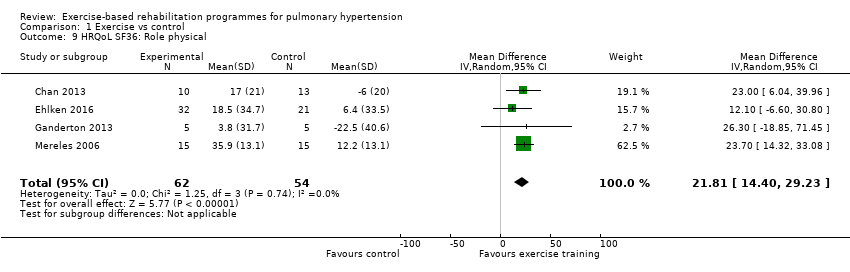
Comparison 1 Exercise vs control, Outcome 9 HRQoL SF36: Role physical.

Comparison 1 Exercise vs control, Outcome 10 HRQoL SF36: Bodily pain.

Comparison 1 Exercise vs control, Outcome 11 HRQoL SF36: General health.

Comparison 1 Exercise vs control, Outcome 12 HRQoL SF36: Mental health.
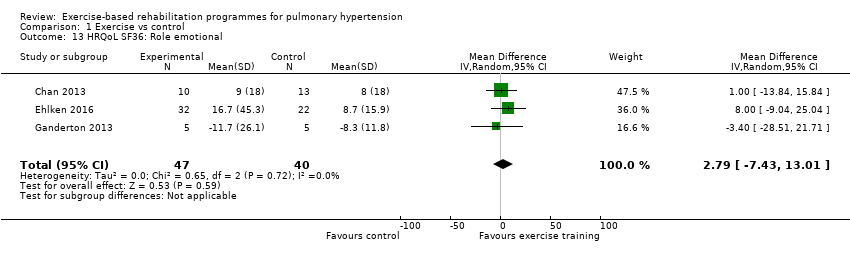
Comparison 1 Exercise vs control, Outcome 13 HRQoL SF36: Role emotional.

Comparison 1 Exercise vs control, Outcome 14 HRQol SF36: Vitality.
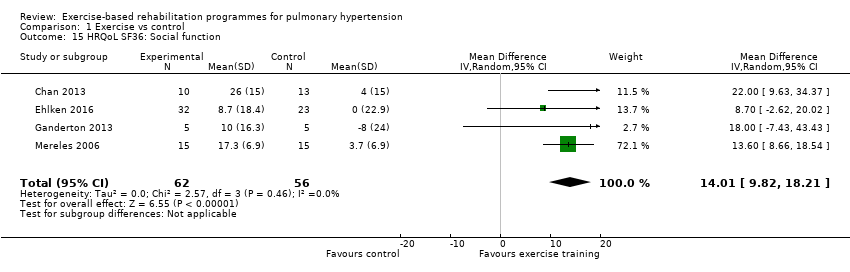
Comparison 1 Exercise vs control, Outcome 15 HRQoL SF36: Social function.

Comparison 1 Exercise vs control, Outcome 16 HRQoL: CAMPHOR activities.

Comparison 1 Exercise vs control, Outcome 17 HRQoL: CAMPHOR symptoms.

Comparison 1 Exercise vs control, Outcome 18 HRQoL: CAMPHOR QoL.

Comparison 1 Exercise vs control, Outcome 19 Cardiopulmonary haemodynamics.
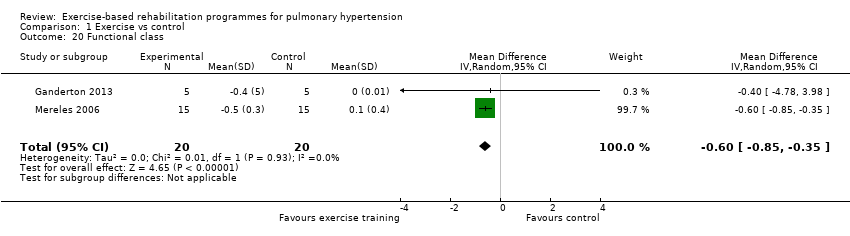
Comparison 1 Exercise vs control, Outcome 20 Functional class.
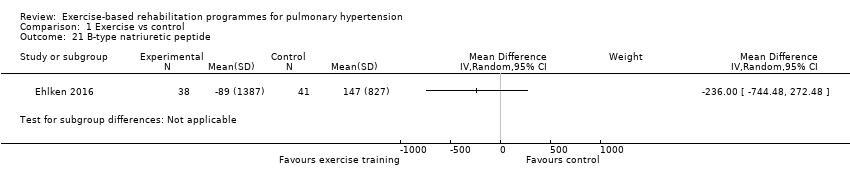
Comparison 1 Exercise vs control, Outcome 21 B‐type natriuretic peptide.

Comparison 1 Exercise vs control, Outcome 22 Exercise capacity: 6MWD, sensitivity analysis.

Comparison 1 Exercise vs control, Outcome 23 Exercise capacity: VO2peak, sensitivity analysis.
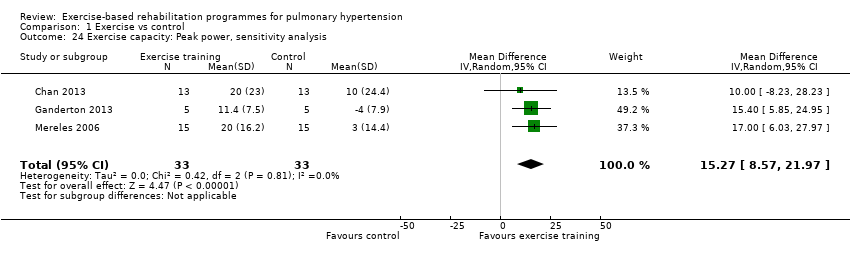
Comparison 1 Exercise vs control, Outcome 24 Exercise capacity: Peak power, sensitivity analysis.
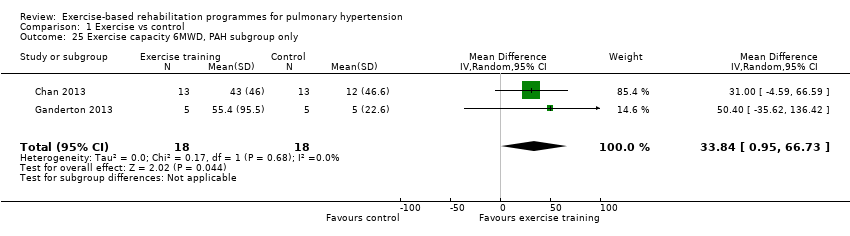
Comparison 1 Exercise vs control, Outcome 25 Exercise capacity 6MWD, PAH subgroup only.
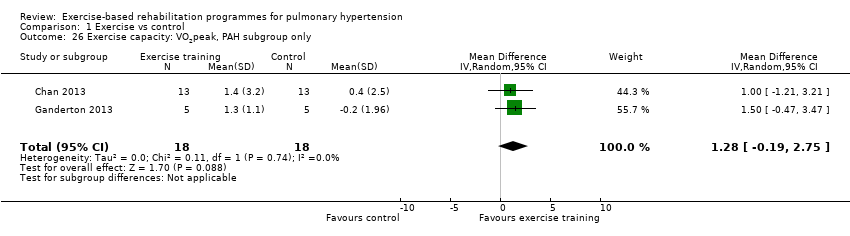
Comparison 1 Exercise vs control, Outcome 26 Exercise capacity: VO2peak, PAH subgroup only.

Comparison 1 Exercise vs control, Outcome 27 Exercise capacity: Peak power, PAH subgroup only.

Comparison 1 Exercise vs control, Outcome 28 Exercise capacity: Anaerobic threshold, PAH subgroup only.
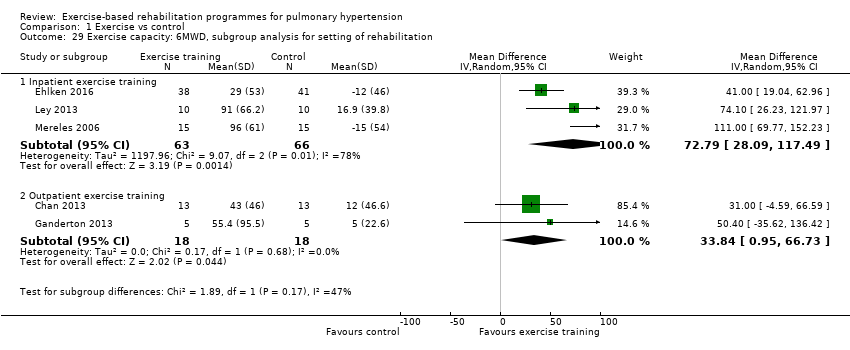
Comparison 1 Exercise vs control, Outcome 29 Exercise capacity: 6MWD, subgroup analysis for setting of rehabilitation.
| Exercise compared to control for pulmonary hypertension | |||||
| Patient or population: people with pulmonary hypertension | |||||
| Outcomes | Illustrative comparative effects* (95% CI) | No of participants | Quality of the evidence | Comments | |
| Response on control | Treatment effect | ||||
| Control | Exercise | ||||
| Change in functional exercise capacity (6MWD) | Median change = 5 m | The mean exercise capacity 6MWD in the intervention groups was 60.12 higher | 165 | ⊕⊕⊝⊝ | Subgroup PAH: (2 studies, n = 36), mean 6MWD for intervention group was 33.84 m higher (0.95 to 66.73 higher); these studies used outpatient exercise rehabilitation whilst other studies contributing to meta‐analysis had an inpatient training component Minimal important difference was 30 metres |
| Exercise capacity: VO2peak Oxygen uptake, ml/kg/min | Median change = ‐0.25 ml/kg/min | The mean VO2peak in the intervention groups was 2.41 ml/kg/min higher | 145 | ⊕⊕⊝⊝ | Subgroup PAH (2 studies, n = 36), the mean VO2peak in the intervention groups was 1.28 ml/kg/min higher (‐0.19 to 2.75 higher); these two studies used outpatient exercise rehabilitation whilst other studies contributing to meta‐analysis had an inpatient training component |
| Exercise capacity: peak power watts | Median change = 1 watt | The mean exercise capacity: peak power in the intervention groups was 16.44 W higher | 145 | ⊕⊕⊝⊝ | Subgroup PAH (2 studies, n = 36), the mean peak power in the intervention groups was 14.24 watts higher (5.78 to 22.70 higher); these two studies used outpatient exercise rehabilitation whilst other studies contributing to meta‐analysis had an inpatient training component |
| HRQoL SF‐36: PCS units Follow‐up median 11 weeks | Median change = ‐0.49 units | The mean HRQoL SF‐36: PCS in the intervention groups was 4.63 higher (0.80 to 8.47 higher) | 33 | ⊕⊕⊝⊝ | Both studies were only PAH |
| HRQoL SF‐36: MCS units Follow‐up median 11 weeks | Median change = ‐0.31 units | The mean HRQoL SF‐36: MCS in the intervention groups was 4.17 higher (0.01 to 8.34 higher) | 33 | ⊕⊕⊝⊝ | Both studies were only PAH |
| *The basis for the response on control is the median control group response across studies | |||||
| GRADE Working Group grades of evidence | |||||
| 1 Two studies did not report random sequence generation, no studies reported allocation concealment 3 Imprecision (2 small studies of 33 participants) and neither reported allocation concealment | |||||
| Outcome or subgroup title | No. of studies | No. of participants | Statistical method | Effect size |
| 1 Exercise capacity: 6MWD Show forest plot | 5 | 165 | Mean Difference (IV, Random, 95% CI) | 60.12 [30.17, 90.07] |
| 2 Exercise capacity: VO2peak Show forest plot | 4 | 145 | Mean Difference (IV, Random, 95% CI) | 2.41 [1.38, 3.44] |
| 3 Exercise capacity: Peak power Show forest plot | 4 | 145 | Mean Difference (IV, Random, 95% CI) | 16.44 [10.90, 21.99] |
| 4 Exercisecapacity: Anaerobic threshold Show forest plot | 3 | 66 | Std. Mean Difference (IV, Random, 95% CI) | 1.05 [0.53, 1.58] |
| 5 HRQoL SF36: Physical component score Show forest plot | 2 | 33 | Mean Difference (IV, Random, 95% CI) | 4.63 [0.80, 8.47] |
| 6 HRQoL SF36: Mental component score Show forest plot | 2 | 33 | Mean Difference (IV, Random, 95% CI) | 4.17 [0.01, 8.34] |
| 7 Adverse events Show forest plot | 5 | 165 | Risk Difference (M‐H, Random, 95% CI) | 0.00 [‐0.04, 0.04] |
| 8 HRQoL SF36: Physical function Show forest plot | 4 | 118 | Mean Difference (IV, Random, 95% CI) | 6.13 [‐3.73, 16.00] |
| 9 HRQoL SF36: Role physical Show forest plot | 4 | 116 | Mean Difference (IV, Random, 95% CI) | 21.81 [14.40, 29.23] |
| 10 HRQoL SF36: Bodily pain Show forest plot | 3 | 88 | Mean Difference (IV, Random, 95% CI) | 5.64 [‐3.09, 14.36] |
| 11 HRQoL SF36: General health Show forest plot | 3 | 84 | Mean Difference (IV, Random, 95% CI) | 5.76 [‐0.80, 12.32] |
| 12 HRQoL SF36: Mental health Show forest plot | 3 | 87 | Mean Difference (IV, Random, 95% CI) | 6.21 [‐1.85, 14.27] |
| 13 HRQoL SF36: Role emotional Show forest plot | 3 | 87 | Mean Difference (IV, Random, 95% CI) | 2.79 [‐7.43, 13.01] |
| 14 HRQol SF36: Vitality Show forest plot | 4 | 115 | Mean Difference (IV, Random, 95% CI) | 13.47 [7.55, 19.40] |
| 15 HRQoL SF36: Social function Show forest plot | 4 | 118 | Mean Difference (IV, Random, 95% CI) | 14.01 [9.82, 18.21] |
| 16 HRQoL: CAMPHOR activities Show forest plot | 2 | 33 | Mean Difference (IV, Random, 95% CI) | ‐1.33 [‐3.56, 0.90] |
| 17 HRQoL: CAMPHOR symptoms Show forest plot | 2 | 36 | Mean Difference (IV, Random, 95% CI) | ‐3.08 [‐7.78, 1.62] |
| 18 HRQoL: CAMPHOR QoL Show forest plot | 2 | 36 | Mean Difference (IV, Random, 95% CI) | ‐5.42 [‐8.03, ‐2.81] |
| 19 Cardiopulmonary haemodynamics Show forest plot | 1 | Mean Difference (IV, Random, 95% CI) | Subtotals only | |
| 20 Functional class Show forest plot | 2 | 40 | Mean Difference (IV, Random, 95% CI) | ‐0.60 [‐0.85, ‐0.35] |
| 21 B‐type natriuretic peptide Show forest plot | 1 | Mean Difference (IV, Random, 95% CI) | Subtotals only | |
| 22 Exercise capacity: 6MWD, sensitivity analysis Show forest plot | 4 | 86 | Mean Difference (IV, Random, 95% CI) | 67.91 [27.12, 108.69] |
| 23 Exercise capacity: VO2peak, sensitivity analysis Show forest plot | 3 | 66 | Mean Difference (IV, Random, 95% CI) | 1.94 [0.86, 3.01] |
| 24 Exercise capacity: Peak power, sensitivity analysis Show forest plot | 3 | 66 | Mean Difference (IV, Random, 95% CI) | 15.27 [8.57, 21.97] |
| 25 Exercise capacity 6MWD, PAH subgroup only Show forest plot | 2 | 36 | Mean Difference (IV, Random, 95% CI) | 33.84 [0.95, 66.73] |
| 26 Exercise capacity: VO2peak, PAH subgroup only Show forest plot | 2 | 36 | Mean Difference (IV, Random, 95% CI) | 1.28 [‐0.19, 2.75] |
| 27 Exercise capacity: Peak power, PAH subgroup only Show forest plot | 2 | 36 | Mean Difference (IV, Random, 95% CI) | 14.24 [5.78, 22.70] |
| 28 Exercise capacity: Anaerobic threshold, PAH subgroup only Show forest plot | 2 | 36 | Mean Difference (IV, Random, 95% CI) | 41.31 [‐52.05, 134.67] |
| 29 Exercise capacity: 6MWD, subgroup analysis for setting of rehabilitation Show forest plot | 5 | Mean Difference (IV, Random, 95% CI) | Subtotals only | |
| 29.1 Inpatient exercise training | 3 | 129 | Mean Difference (IV, Random, 95% CI) | 72.79 [28.09, 117.49] |
| 29.2 Outpatient exercise training | 2 | 36 | Mean Difference (IV, Random, 95% CI) | 33.84 [0.95, 66.73] |