Programmes de rééducation par l'exercice pour le traitement de l'hypertension pulmonaire
Appendices
Appendix 1. Database search strategies
Cochrane Airways Register of Trials
#1 PULM:MISC1
#2 MeSH DESCRIPTOR Hypertension, Pulmonary Explode All
#3 MeSH DESCRIPTOR Pulmonary Heart Disease
#4 "pulmonary vascular disease":TI,AB
#5 #1 or #2 or #3 or #4
#6 MeSH DESCRIPTOR exercise Explode All
#7 MeSH DESCRIPTOR Exercise Therapy Explode All
#8 MeSH DESCRIPTOR Exercise Tolerance
#9 MeSH DESCRIPTOR Physical Fitness
#10 MeSH DESCRIPTOR Physical Exertion
#11 MeSH DESCRIPTOR Ergometry
#12 MeSH DESCRIPTOR Bicycling
#13 MeSH DESCRIPTOR Weight Lifting
#14 MeSH DESCRIPTOR Muscle Strength
#15 exercis*:TI,AB
#16 conditioning or ergometry or treadmill or endurance or "upper limb" or "lower limb":TI,AB
#17 walk* or swim* or cycle* or cycling or bicycl* or jog*:TI,AB
#18 ((strength* or resistance* or weight*) NEAR3 train*):TI,AB
#19 aerobic*:TI,AB
#20 rehabilitat*:TI,AB
#21 #6 OR #7 OR #8 or #9 OR #10 OR #11 OR #12 OR #13 OR #14 OR #15 OR #16 OR #17 OR #18 OR #19 OR #20
#22 #5 and #21
CENTRAL (CRSO)
#1MESH DESCRIPTOR Hypertension, Pulmonary EXPLODE ALL TREES
#2MESH DESCRIPTOR Pulmonary Heart Disease
#3(pulmonary* NEAR3 hypertens*):TI,AB,KY
#4("pulmonary vascular disease*"):TI,AB,KY
#5#1 OR #2 OR #3 OR #4
#6MESH DESCRIPTOR Exercise EXPLODE ALL TREES
#7MESH DESCRIPTOR EXERCISE THERAPY EXPLODE ALL TREES
#8MESH DESCRIPTOR Exercise Tolerance
#9MESH DESCRIPTOR Physical Fitness
#10MESH DESCRIPTOR Physical Exertion
#11MESH DESCRIPTOR Ergometry EXPLODE ALL TREES
#12MESH DESCRIPTOR Bicycling
#13MESH DESCRIPTOR Weight Lifting
#14MESH DESCRIPTOR Muscle Strength EXPLODE ALL TREES
#15exercis*:TI,AB,KY
#16(conditioning or ergometry or treadmill or endurance or "upper limb" or "lower limb"):TI,AB,KY
#17(walk* or swim* or cycle* or cycling or bicycl* or jog*):TI,AB,KY
#18((strength* or resistance* or weight*) NEAR3 train*):TI,AB,KY
#19aerobic*:TI,AB,KY
#20rehabilitat*:TI,AB,KY
#21#6 OR #7 OR #8 OR #9 OR #10 OR #11 OR #12 OR #13 OR #14 OR #15 OR #16 OR #17 OR #18 OR #19 OR #20
#22#5 AND #21
MEDLINE (Ovid)
1. exp Hypertension, Pulmonary/
2. Pulmonary Heart Disease/
3. (pulmonary adj3 hypertens$).ti,ab.
4. pulmonary vascular disease.ti,ab.
5. or/1‐4
6. exp Exercise/
7. exp Exercise Therapy/
8. Exercise Tolerance/
9. Physical Fitness/
10. Physical Exertion/
11. exp Ergometry/
12. Bicycling/
13. Weight Lifting/
14. Muscle Strength/
15. exercis$.ti,ab.
16. (conditioning or ergometry or treadmill or endurance or "upper limb" or "lower limb").ti,ab.
17. (walk$ or swim$ or cycle$ or cycling or bicycl$ or jog$).ti,ab.
18. ((strength$ or resistance$ or weight$) adj3 train$).ti,ab.
19. aerobic$.ti,ab.
20. rehabilitat$.ti,ab.
21. or/6‐20
22. 5 and 21
23. (controlled clinical trial or randomized controlled trial).pt.
24. (randomized or randomised).ab,ti.
25. placebo.ab,ti.
26. randomly.ab,ti.
27. trial.ab,ti.
28. groups.ab,ti.
29. or/23‐28
30. Animals/
31. Humans/
32. 30 not (30 and 31)
33. 29 not 32
34. 22 and 33
Embase (Ovid)
1. exp pulmonary hypertension/
2. (pulmonary adj3 hypertens$).ti,ab.
3. pulmonary vascular disease.ti,ab.
4. or/1‐3
5. exp exercise/
6. exp kinesiotherapy/
7. exp ergometry/
8. exp bicycle/
9. exp weight lifting/
10. muscle strength/
11. exercis$.ti,ab.
12. (conditioning or ergometry or treadmill or endurance or "upper limb" or "lower limb").ti,ab.
13. (walk$ or swim$ or cycle$ or cycling or bicycl$ or jog$).ti,ab.
14. ((strength$ or resistance$ or weight$) adj3 train$).ti,ab.
15. aerobic$.ti,ab.
16. rehabilitat$.ti,ab.
17. or/5‐16
18. 4 and 17
19. Randomized Controlled Trial/
20. randomization/
21. controlled clinical trial/
22. Double Blind Procedure/
23. Single Blind Procedure/
24. Crossover Procedure/
25. (clinica$ adj3 trial$).tw.
26. ((singl$ or doubl$ or trebl$ or tripl$) adj3 (mask$ or blind$ or method$)).tw.
27. exp Placebo/
28. placebo$.ti,ab.
29. random$.ti,ab.
30. ((control$ or prospectiv$) adj3 (trial$ or method$ or stud$)).tw.
31. (crossover$ or cross‐over$).ti,ab.
32. or/19‐31
33. exp animals/ or exp invertebrate/ or animal experiment/ or animal model/ or animal tissue/ or animal cell/ or nonhuman/
34. human/ or normal human/ or human cell/
35. 33 and 34
36. 33 not 35
37. 32 not 36
38. 18 and 37
PEDro
| Field | Search term |
| Abstract & Title | pulmonary hypertension |
| Method | clinical trial |
ClinicalTrials.gov
| search field | search term |
| Study type | Interventional |
| Condition | Pulmonary hypertension |
| intervention | Exercise |
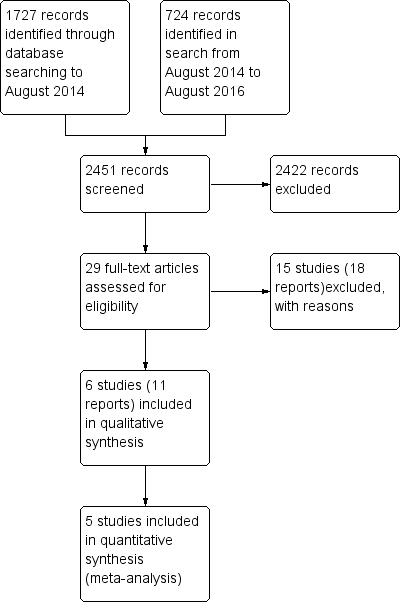
Study flow diagram

Risk of bias graph: review authors' judgements about each risk of bias item presented as percentages across all included studies

Risk of bias summary: review authors' judgements about each risk of bias item for each included study

Forest plot of comparison: 1 Exercise vs control, outcome: 1.1 Exercise capacity: 6MWD

Comparison 1 Exercise vs control, Outcome 1 Exercise capacity: 6MWD.

Comparison 1 Exercise vs control, Outcome 2 Exercise capacity: VO2peak.
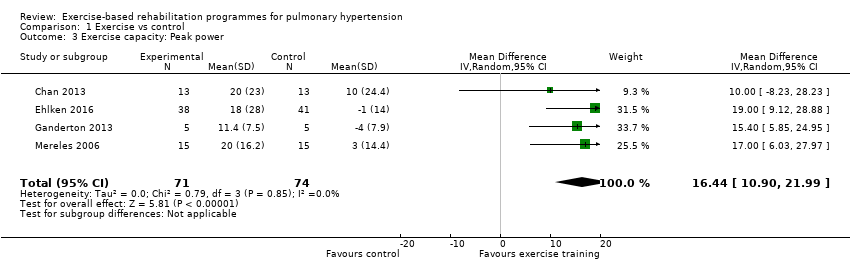
Comparison 1 Exercise vs control, Outcome 3 Exercise capacity: Peak power.
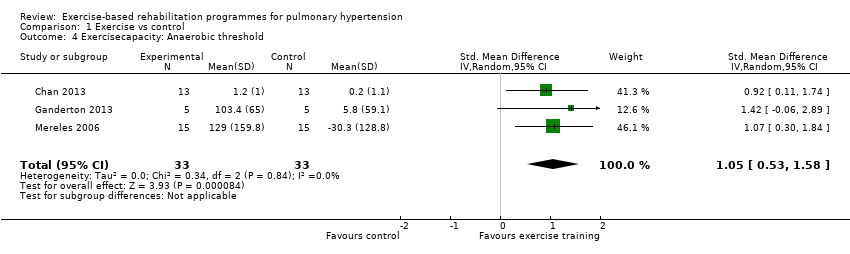
Comparison 1 Exercise vs control, Outcome 4 Exercisecapacity: Anaerobic threshold.
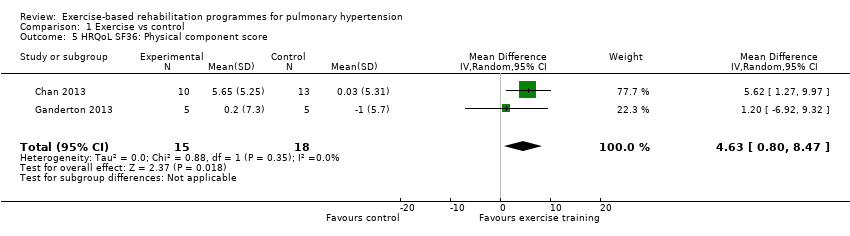
Comparison 1 Exercise vs control, Outcome 5 HRQoL SF36: Physical component score.
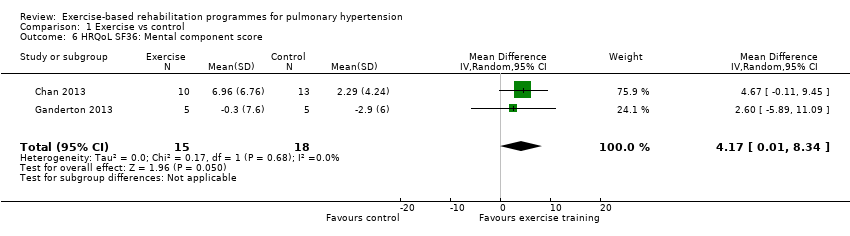
Comparison 1 Exercise vs control, Outcome 6 HRQoL SF36: Mental component score.

Comparison 1 Exercise vs control, Outcome 7 Adverse events.

Comparison 1 Exercise vs control, Outcome 8 HRQoL SF36: Physical function.
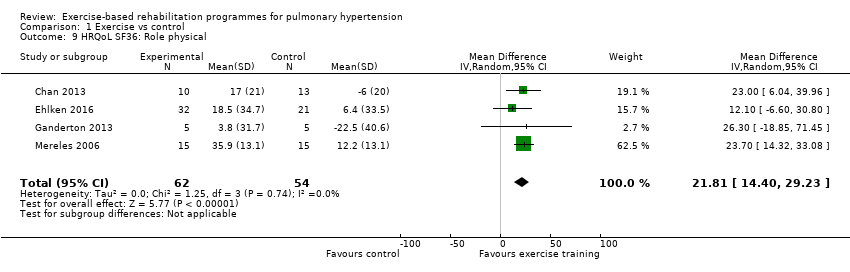
Comparison 1 Exercise vs control, Outcome 9 HRQoL SF36: Role physical.

Comparison 1 Exercise vs control, Outcome 10 HRQoL SF36: Bodily pain.

Comparison 1 Exercise vs control, Outcome 11 HRQoL SF36: General health.

Comparison 1 Exercise vs control, Outcome 12 HRQoL SF36: Mental health.
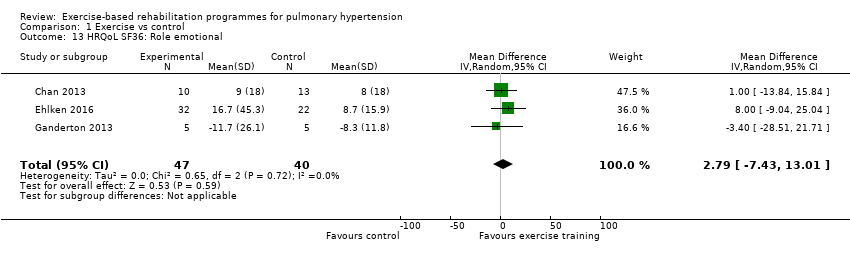
Comparison 1 Exercise vs control, Outcome 13 HRQoL SF36: Role emotional.

Comparison 1 Exercise vs control, Outcome 14 HRQol SF36: Vitality.
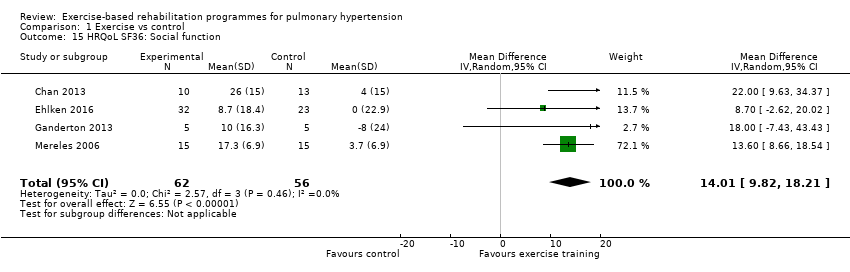
Comparison 1 Exercise vs control, Outcome 15 HRQoL SF36: Social function.

Comparison 1 Exercise vs control, Outcome 16 HRQoL: CAMPHOR activities.

Comparison 1 Exercise vs control, Outcome 17 HRQoL: CAMPHOR symptoms.

Comparison 1 Exercise vs control, Outcome 18 HRQoL: CAMPHOR QoL.

Comparison 1 Exercise vs control, Outcome 19 Cardiopulmonary haemodynamics.
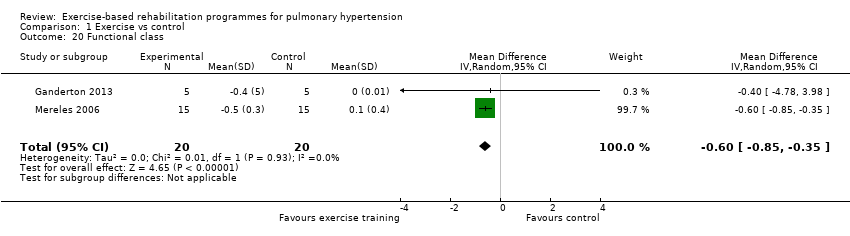
Comparison 1 Exercise vs control, Outcome 20 Functional class.
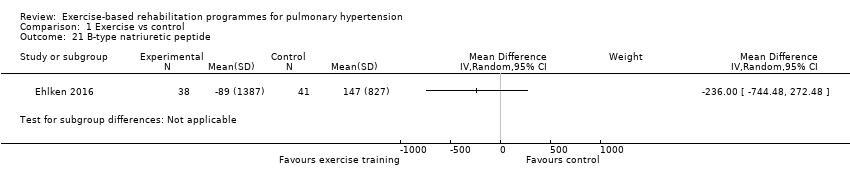
Comparison 1 Exercise vs control, Outcome 21 B‐type natriuretic peptide.

Comparison 1 Exercise vs control, Outcome 22 Exercise capacity: 6MWD, sensitivity analysis.

Comparison 1 Exercise vs control, Outcome 23 Exercise capacity: VO2peak, sensitivity analysis.
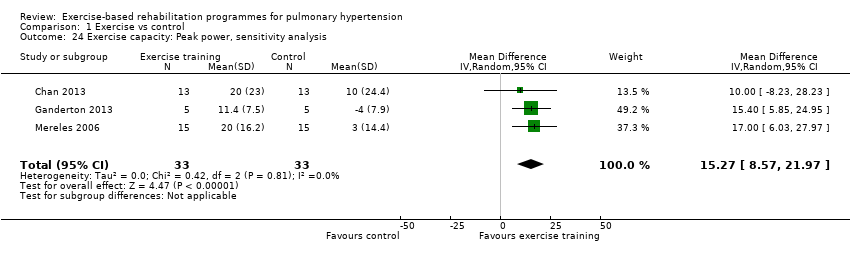
Comparison 1 Exercise vs control, Outcome 24 Exercise capacity: Peak power, sensitivity analysis.
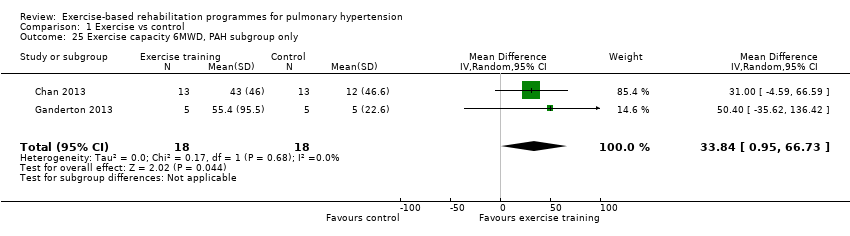
Comparison 1 Exercise vs control, Outcome 25 Exercise capacity 6MWD, PAH subgroup only.
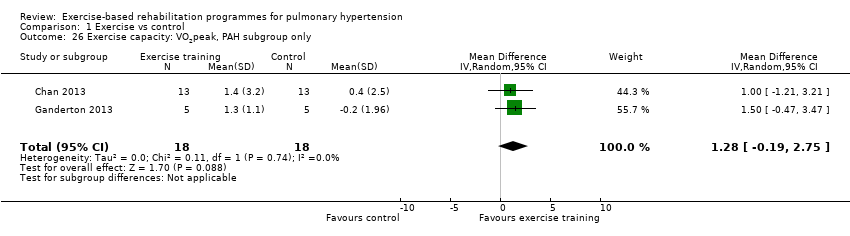
Comparison 1 Exercise vs control, Outcome 26 Exercise capacity: VO2peak, PAH subgroup only.

Comparison 1 Exercise vs control, Outcome 27 Exercise capacity: Peak power, PAH subgroup only.

Comparison 1 Exercise vs control, Outcome 28 Exercise capacity: Anaerobic threshold, PAH subgroup only.
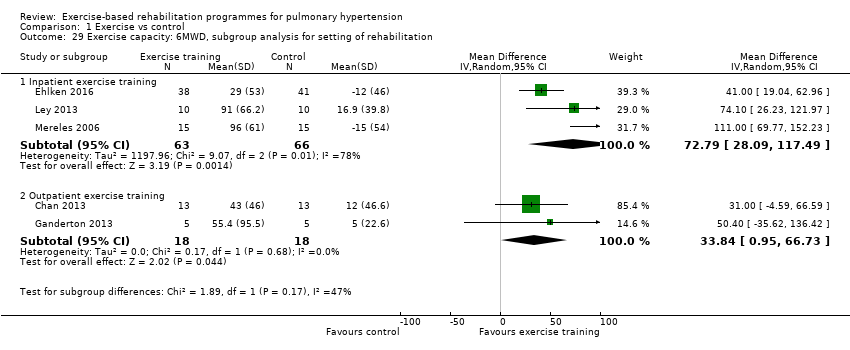
Comparison 1 Exercise vs control, Outcome 29 Exercise capacity: 6MWD, subgroup analysis for setting of rehabilitation.
| Exercise compared to control for pulmonary hypertension | |||||
| Patient or population: people with pulmonary hypertension | |||||
| Outcomes | Illustrative comparative effects* (95% CI) | No of participants | Quality of the evidence | Comments | |
| Response on control | Treatment effect | ||||
| Control | Exercise | ||||
| Change in functional exercise capacity (6MWD) | Median change = 5 m | The mean exercise capacity 6MWD in the intervention groups was 60.12 higher | 165 | ⊕⊕⊝⊝ | Subgroup PAH: (2 studies, n = 36), mean 6MWD for intervention group was 33.84 m higher (0.95 to 66.73 higher); these studies used outpatient exercise rehabilitation whilst other studies contributing to meta‐analysis had an inpatient training component Minimal important difference was 30 metres |
| Exercise capacity: VO2peak Oxygen uptake, ml/kg/min | Median change = ‐0.25 ml/kg/min | The mean VO2peak in the intervention groups was 2.41 ml/kg/min higher | 145 | ⊕⊕⊝⊝ | Subgroup PAH (2 studies, n = 36), the mean VO2peak in the intervention groups was 1.28 ml/kg/min higher (‐0.19 to 2.75 higher); these two studies used outpatient exercise rehabilitation whilst other studies contributing to meta‐analysis had an inpatient training component |
| Exercise capacity: peak power watts | Median change = 1 watt | The mean exercise capacity: peak power in the intervention groups was 16.44 W higher | 145 | ⊕⊕⊝⊝ | Subgroup PAH (2 studies, n = 36), the mean peak power in the intervention groups was 14.24 watts higher (5.78 to 22.70 higher); these two studies used outpatient exercise rehabilitation whilst other studies contributing to meta‐analysis had an inpatient training component |
| HRQoL SF‐36: PCS units Follow‐up median 11 weeks | Median change = ‐0.49 units | The mean HRQoL SF‐36: PCS in the intervention groups was 4.63 higher (0.80 to 8.47 higher) | 33 | ⊕⊕⊝⊝ | Both studies were only PAH |
| HRQoL SF‐36: MCS units Follow‐up median 11 weeks | Median change = ‐0.31 units | The mean HRQoL SF‐36: MCS in the intervention groups was 4.17 higher (0.01 to 8.34 higher) | 33 | ⊕⊕⊝⊝ | Both studies were only PAH |
| *The basis for the response on control is the median control group response across studies | |||||
| GRADE Working Group grades of evidence | |||||
| 1 Two studies did not report random sequence generation, no studies reported allocation concealment 3 Imprecision (2 small studies of 33 participants) and neither reported allocation concealment | |||||
| Outcome or subgroup title | No. of studies | No. of participants | Statistical method | Effect size |
| 1 Exercise capacity: 6MWD Show forest plot | 5 | 165 | Mean Difference (IV, Random, 95% CI) | 60.12 [30.17, 90.07] |
| 2 Exercise capacity: VO2peak Show forest plot | 4 | 145 | Mean Difference (IV, Random, 95% CI) | 2.41 [1.38, 3.44] |
| 3 Exercise capacity: Peak power Show forest plot | 4 | 145 | Mean Difference (IV, Random, 95% CI) | 16.44 [10.90, 21.99] |
| 4 Exercisecapacity: Anaerobic threshold Show forest plot | 3 | 66 | Std. Mean Difference (IV, Random, 95% CI) | 1.05 [0.53, 1.58] |
| 5 HRQoL SF36: Physical component score Show forest plot | 2 | 33 | Mean Difference (IV, Random, 95% CI) | 4.63 [0.80, 8.47] |
| 6 HRQoL SF36: Mental component score Show forest plot | 2 | 33 | Mean Difference (IV, Random, 95% CI) | 4.17 [0.01, 8.34] |
| 7 Adverse events Show forest plot | 5 | 165 | Risk Difference (M‐H, Random, 95% CI) | 0.00 [‐0.04, 0.04] |
| 8 HRQoL SF36: Physical function Show forest plot | 4 | 118 | Mean Difference (IV, Random, 95% CI) | 6.13 [‐3.73, 16.00] |
| 9 HRQoL SF36: Role physical Show forest plot | 4 | 116 | Mean Difference (IV, Random, 95% CI) | 21.81 [14.40, 29.23] |
| 10 HRQoL SF36: Bodily pain Show forest plot | 3 | 88 | Mean Difference (IV, Random, 95% CI) | 5.64 [‐3.09, 14.36] |
| 11 HRQoL SF36: General health Show forest plot | 3 | 84 | Mean Difference (IV, Random, 95% CI) | 5.76 [‐0.80, 12.32] |
| 12 HRQoL SF36: Mental health Show forest plot | 3 | 87 | Mean Difference (IV, Random, 95% CI) | 6.21 [‐1.85, 14.27] |
| 13 HRQoL SF36: Role emotional Show forest plot | 3 | 87 | Mean Difference (IV, Random, 95% CI) | 2.79 [‐7.43, 13.01] |
| 14 HRQol SF36: Vitality Show forest plot | 4 | 115 | Mean Difference (IV, Random, 95% CI) | 13.47 [7.55, 19.40] |
| 15 HRQoL SF36: Social function Show forest plot | 4 | 118 | Mean Difference (IV, Random, 95% CI) | 14.01 [9.82, 18.21] |
| 16 HRQoL: CAMPHOR activities Show forest plot | 2 | 33 | Mean Difference (IV, Random, 95% CI) | ‐1.33 [‐3.56, 0.90] |
| 17 HRQoL: CAMPHOR symptoms Show forest plot | 2 | 36 | Mean Difference (IV, Random, 95% CI) | ‐3.08 [‐7.78, 1.62] |
| 18 HRQoL: CAMPHOR QoL Show forest plot | 2 | 36 | Mean Difference (IV, Random, 95% CI) | ‐5.42 [‐8.03, ‐2.81] |
| 19 Cardiopulmonary haemodynamics Show forest plot | 1 | Mean Difference (IV, Random, 95% CI) | Subtotals only | |
| 20 Functional class Show forest plot | 2 | 40 | Mean Difference (IV, Random, 95% CI) | ‐0.60 [‐0.85, ‐0.35] |
| 21 B‐type natriuretic peptide Show forest plot | 1 | Mean Difference (IV, Random, 95% CI) | Subtotals only | |
| 22 Exercise capacity: 6MWD, sensitivity analysis Show forest plot | 4 | 86 | Mean Difference (IV, Random, 95% CI) | 67.91 [27.12, 108.69] |
| 23 Exercise capacity: VO2peak, sensitivity analysis Show forest plot | 3 | 66 | Mean Difference (IV, Random, 95% CI) | 1.94 [0.86, 3.01] |
| 24 Exercise capacity: Peak power, sensitivity analysis Show forest plot | 3 | 66 | Mean Difference (IV, Random, 95% CI) | 15.27 [8.57, 21.97] |
| 25 Exercise capacity 6MWD, PAH subgroup only Show forest plot | 2 | 36 | Mean Difference (IV, Random, 95% CI) | 33.84 [0.95, 66.73] |
| 26 Exercise capacity: VO2peak, PAH subgroup only Show forest plot | 2 | 36 | Mean Difference (IV, Random, 95% CI) | 1.28 [‐0.19, 2.75] |
| 27 Exercise capacity: Peak power, PAH subgroup only Show forest plot | 2 | 36 | Mean Difference (IV, Random, 95% CI) | 14.24 [5.78, 22.70] |
| 28 Exercise capacity: Anaerobic threshold, PAH subgroup only Show forest plot | 2 | 36 | Mean Difference (IV, Random, 95% CI) | 41.31 [‐52.05, 134.67] |
| 29 Exercise capacity: 6MWD, subgroup analysis for setting of rehabilitation Show forest plot | 5 | Mean Difference (IV, Random, 95% CI) | Subtotals only | |
| 29.1 Inpatient exercise training | 3 | 129 | Mean Difference (IV, Random, 95% CI) | 72.79 [28.09, 117.49] |
| 29.2 Outpatient exercise training | 2 | 36 | Mean Difference (IV, Random, 95% CI) | 33.84 [0.95, 66.73] |