Lichttherapie zur Vorbeugung von saisonal abhängiger Depression
Referencias
References to studies included in this review
References to studies excluded from this review
Additional references
Characteristics of studies
Characteristics of included studies [ordered by study ID]
Ir a:
| Methods | Single‐centre, non‐blinded, randomised controlled trial (duration: 2 winter seasons 1993‐94 and 1994‐95, October‐April each season) conducted in the Netherlands. 8 dropouts (4 bright white visor light, 3 infrared visor light, 1 no light exposure) | |
| Participants | 46 adult outpatients with a history of SAD who were without symptoms at the beginning of the study and were free of drugs Bright white visor light group: n = 18, but participant characteristics of only 14 participants reported: 2 men, mean age 41 years (± 12.7), 12 women, mean age 39.5 years (± 9.3) Infrared visor light group: n = 18, but participant characteristics of only 15 participants reported: 5 men, mean age 35.4 years (± 6.9), 10 women, mean age 36.6 years (± 4.9) No light exposure group: n = 10, but participant characteristics of only 9 participants reported: 4 men, mean age 47.5 years (± 7), 5 women, mean age 39.4 years (± 8) No information about number of prior depressive episodes nor other participant characteristics | |
| Interventions | Bright white visor light (n = 18; 30 minutes/d in the morning except on weekends) vs infrared visor light (n = 18; 30 minutes/d in the morning except on weekends) vs no light exposure (n = 10) from October until April | |
| Outcomes | Development of depression (BDI ≥ 13, SIGH‐SAD‐SR ≥ 20), development of severe depression (BDI ≥ 22, SIGH‐SAD‐SR ≥ 40) | |
| Notes | Study was not funded by pharmaceutical industry; however, equipment was sponsored by Bio Bright, Inc. Study was identified by searches of electronic databases | |
| Risk of bias | ||
| Bias | Authors' judgement | Support for judgement |
| Random sequence generation (selection bias) | Unclear risk | No information about generation of random sequence provided |
| Allocation concealment (selection bias) | Unclear risk | No information about allocation concealment provided |
| Blinding of participants and personnel (performance bias) | High risk | Participants were not blinded to treatment |
| Blinding of outcome assessment (detection bias) | High risk | We assume that the outcome assessment was performed by the participants themselves: "patients stopped participating because of reasons unrelated to their illness, such as a lack of motivation to keep scoring self‐rating scales when in a healthy condition" |
| Incomplete outcome data (attrition bias) | High risk | 17% of dropouts were not taken into account in the data analysis. No participant characteristics (e.g. age, sex) were reported for these 8 dropouts |
| Selective reporting (reporting bias) | Unclear risk | We could not identify a protocol for this study. Therefore, we rated this domain unclear |
| Other bias | High risk | Intervention was implemented by participants on their own at their homes |
BDI: Beck Depression Inventory.
SAD: Seasonal affective disorder.
SIGH‐SAD‐SR: Hamilton Depression Rating Scale‐Seasonal Affective Disorders self rating version.
Characteristics of excluded studies [ordered by study ID]
Ir a:
| Study | Reason for exclusion |
| SAD participants were treated with light therapy when they suffered a depressive episode. They were interviewed again 2 to 5 years later. Treatment started when participants already had depressive symptoms ‐ not when they were free of symptoms; therefore, the study was not relevant for this systematic review | |
| Study included participants without depressive symptoms, but also without a history of SAD. As the study investigated preventive effects of light therapy on healthy participants, it was not relevant for this systematic review | |
| Conference abstract | |
| Study investigated treatment ‐ not prevention ‐ of SAD | |
| Study investigated whether starting light therapy at an early stage of a depressive episode can prevent a full‐blown winter depressive episode. Included participants already had depressive symptoms when the study started; therefore, the study was not relevant for this systematic review | |
| Study investigated whether starting light therapy at an early stage of a depressive episode can prevent a full‐blown winter depressive episode. Included participants already had depressive symptoms when the study started; therefore, the study was not relevant for this systematic review | |
| Study included participants with a history of SAD and investigated preventive effects of light therapy. However, the study included only 1 intervention group and no control group, therefore, the study was not relevant for this systematic review | |
| Study investigated treatment ‐ not prevention ‐ of SAD | |
| Study investigated prevention of depression and sleep disturbances in the elderly with light. Included participants in this study were diagnosed with major depressive disorder without a seasonal pattern. Therefore, the study was not relevant for this systematic review | |
| Study investigated dawn simulation in participants with subsyndromal winter depression. Participants had no history of SAD | |
| Study investigated recurrence ‐ not prevention ‐ of SAD. Included participants already had symptoms when the study started | |
| Study included participants with a history of SAD and investigated preventive effects of light therapy. However, the study included only 1 intervention group and no control group; therefore, the study was not relevant for this systematic review | |
| Study investigated acute and long‐term efficacy of cognitive‐behavioural therapy for SAD alone and in combination with light therapy as compared with solo light therapy. Included participants already had symptoms when interventions were started; therefore, the study was not relevant for this systematic review | |
| Study investigated acute cognitive‐behavioural therapy for SAD alone and in combination with light therapy as compared with solo light therapy. This was a treatment study ‐ not a prevention study | |
| Study investigated recurrence of SAD after 1 year of cognitive‐behavioural therapy, light therapy and a combination of these. Included participants already had depressive symptoms when the study started; therefore, it was not relevant for this systematic review | |
| Study investigated relapse prevention of SAD and compared cognitive‐behavioural therapy, light therapy and a combination of these ‐ not prevention of SAD. Included participants already had symptoms when the study started | |
| Study investigated whether starting light therapy at an early stage of a depressive episode can prevent a full‐blown winter depressive episode. Included participants already had depressive symptoms when the study started, therefore, the study was not relevant for this systematic review | |
| Study investigated relapse prevention ‐ not prevention of SAD. Included participants already had symptoms when the study started | |
| Study investigated relapse prevention of SAD and compared cognitive‐behavioural therapy, light therapy and a combination of these ‐ not prevention of SAD. Included participants already had symptoms when the study started | |
| Study investigated preventive effects of bupropion XL in participants with a history of SAD. It is included in the systematic review on efficacy and safety of second‐generation antidepressants; however, as it does not investigate efficacy nor safety of light therapy as preventive treatment, it is not relevant for this systematic review | |
| Study investigated preventive effects of bupropion XL in participants with a history of SAD. It is included in the systematic review on efficacy and safety of second‐generation antidepressants; however, as it does not investigate efficacy nor safety of light therapy as preventive treatment, it is not relevant for this systematic review | |
| Study investigated preventive effects of bupropion XL in participants with a history of SAD. It is included in the systematic review on efficacy and safety of second‐generation antidepressants; however, as it does not investigate efficacy nor safety of light therapy as preventive treatment, it is not relevant for this systematic review | |
| Study investigated treatment ‐ not prevention ‐ of SAD. Included participants already had symptoms when the study started |
SAD: Seasonal affective disorder.
Data and analyses
| Outcome or subgroup title | No. of studies | No. of participants | Statistical method | Effect size |
| 1 Incidence of SAD (per protocol analysis) Show forest plot | 1 | Risk Ratio (M‐H, Random, 95% CI) | Totals not selected | |
| Analysis 1.1  Comparison 1 Bright light therapy vs no light therapy, Outcome 1 Incidence of SAD (per protocol analysis). | ||||
| 2 Incidence of SAD (ITT, assuming no dropout was depressed) Show forest plot | 1 | Risk Ratio (M‐H, Random, 95% CI) | Totals not selected | |
| Analysis 1.2 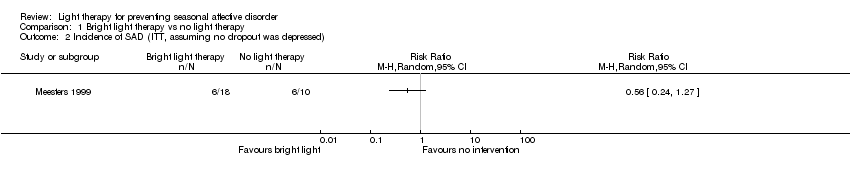 Comparison 1 Bright light therapy vs no light therapy, Outcome 2 Incidence of SAD (ITT, assuming no dropout was depressed). | ||||
| 3 Incidence of SAD (ITT, assuming all dropouts were depressed) Show forest plot | 1 | Risk Ratio (M‐H, Random, 95% CI) | Totals not selected | |
| Analysis 1.3  Comparison 1 Bright light therapy vs no light therapy, Outcome 3 Incidence of SAD (ITT, assuming all dropouts were depressed). | ||||
| 4 Incidence of severe SAD (per protocol analysis) Show forest plot | 1 | Risk Ratio (M‐H, Random, 95% CI) | Totals not selected | |
| Analysis 1.4  Comparison 1 Bright light therapy vs no light therapy, Outcome 4 Incidence of severe SAD (per protocol analysis). | ||||
| 5 Incidence of severe SAD (ITT, assuming no dropout was depressed) Show forest plot | 1 | Risk Ratio (M‐H, Random, 95% CI) | Totals not selected | |
| Analysis 1.5  Comparison 1 Bright light therapy vs no light therapy, Outcome 5 Incidence of severe SAD (ITT, assuming no dropout was depressed). | ||||
| 6 Incidence of severe SAD (ITT, assuming all dropouts were depressed) Show forest plot | 1 | Risk Ratio (M‐H, Random, 95% CI) | Totals not selected | |
| Analysis 1.6  Comparison 1 Bright light therapy vs no light therapy, Outcome 6 Incidence of severe SAD (ITT, assuming all dropouts were depressed). | ||||
| 7 Overall rate of discontinuation Show forest plot | 1 | Risk Ratio (M‐H, Random, 95% CI) | Totals not selected | |
| Analysis 1.7 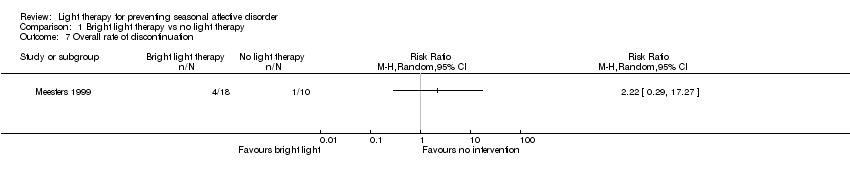 Comparison 1 Bright light therapy vs no light therapy, Outcome 7 Overall rate of discontinuation. | ||||
| Outcome or subgroup title | No. of studies | No. of participants | Statistical method | Effect size |
| 1 Incidence of SAD (per protocol analysis) Show forest plot | 1 | Risk Ratio (M‐H, Random, 95% CI) | Totals not selected | |
| Analysis 2.1  Comparison 2 Infrared light therapy vs no light therapy, Outcome 1 Incidence of SAD (per protocol analysis). | ||||
| 2 Incidence of SAD (ITT, assuming no dropout was depressed) Show forest plot | 1 | Risk Ratio (M‐H, Random, 95% CI) | Totals not selected | |
| Analysis 2.2  Comparison 2 Infrared light therapy vs no light therapy, Outcome 2 Incidence of SAD (ITT, assuming no dropout was depressed). | ||||
| 3 Incidence of SAD (ITT, assuming all dropouts were depressed) Show forest plot | 1 | Risk Ratio (M‐H, Random, 95% CI) | Totals not selected | |
| Analysis 2.3  Comparison 2 Infrared light therapy vs no light therapy, Outcome 3 Incidence of SAD (ITT, assuming all dropouts were depressed). | ||||
| 4 Incidence of severe SAD (per protocol analysis) Show forest plot | 1 | Risk Ratio (M‐H, Random, 95% CI) | Totals not selected | |
| Analysis 2.4  Comparison 2 Infrared light therapy vs no light therapy, Outcome 4 Incidence of severe SAD (per protocol analysis). | ||||
| 5 Incidence of severe SAD (ITT, assuming no dropout was depressed) Show forest plot | 1 | Risk Ratio (M‐H, Random, 95% CI) | Totals not selected | |
| Analysis 2.5  Comparison 2 Infrared light therapy vs no light therapy, Outcome 5 Incidence of severe SAD (ITT, assuming no dropout was depressed). | ||||
| 6 Incidence of severe SAD (ITT, assuming all dropouts were depressed) Show forest plot | 1 | Risk Ratio (M‐H, Random, 95% CI) | Totals not selected | |
| Analysis 2.6  Comparison 2 Infrared light therapy vs no light therapy, Outcome 6 Incidence of severe SAD (ITT, assuming all dropouts were depressed). | ||||
| 7 Overall rate of discontinuation Show forest plot | 1 | Risk Ratio (M‐H, Random, 95% CI) | Totals not selected | |
| Analysis 2.7  Comparison 2 Infrared light therapy vs no light therapy, Outcome 7 Overall rate of discontinuation. | ||||
| Outcome or subgroup title | No. of studies | No. of participants | Statistical method | Effect size |
| 1 Incidence of SAD (per protocol analysis) Show forest plot | 1 | Risk Ratio (M‐H, Fixed, 95% CI) | Totals not selected | |
| Analysis 3.1  Comparison 3 Light therapy (bright white and infrared) vs no light therapy, Outcome 1 Incidence of SAD (per protocol analysis). | ||||
| 2 Incidence of SAD (ITT, assuming no dropout was depressed) Show forest plot | 1 | Risk Ratio (M‐H, Fixed, 95% CI) | Totals not selected | |
| Analysis 3.2  Comparison 3 Light therapy (bright white and infrared) vs no light therapy, Outcome 2 Incidence of SAD (ITT, assuming no dropout was depressed). | ||||
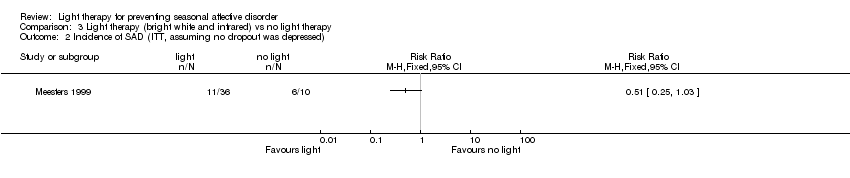
| 3 Incidence of SAD (ITT, assuming all dropouts were depressed) Show forest plot | 1 | Risk Ratio (M‐H, Fixed, 95% CI) | Totals not selected | |
| Analysis 3.3  Comparison 3 Light therapy (bright white and infrared) vs no light therapy, Outcome 3 Incidence of SAD (ITT, assuming all dropouts were depressed). | ||||
| 4 Incidence of severe SAD (per protocol analysis) Show forest plot | 1 | Risk Ratio (M‐H, Fixed, 95% CI) | Totals not selected | |
| Analysis 3.4  Comparison 3 Light therapy (bright white and infrared) vs no light therapy, Outcome 4 Incidence of severe SAD (per protocol analysis). | ||||
| 5 Incidence of severe SAD (ITT, assuming no dropout was depressed) Show forest plot | 1 | Risk Ratio (M‐H, Fixed, 95% CI) | Totals not selected | |
| Analysis 3.5  Comparison 3 Light therapy (bright white and infrared) vs no light therapy, Outcome 5 Incidence of severe SAD (ITT, assuming no dropout was depressed). | ||||
| 6 Incidence of severe SAD (ITT, assuming all dropouts were depressed) Show forest plot | 1 | Risk Ratio (M‐H, Fixed, 95% CI) | Totals not selected | |
| Analysis 3.6  Comparison 3 Light therapy (bright white and infrared) vs no light therapy, Outcome 6 Incidence of severe SAD (ITT, assuming all dropouts were depressed). | ||||
| 7 Overall discontinuation Show forest plot | 1 | Risk Ratio (M‐H, Fixed, 95% CI) | Totals not selected | |
| Analysis 3.7  Comparison 3 Light therapy (bright white and infrared) vs no light therapy, Outcome 7 Overall discontinuation. | ||||
| Outcome or subgroup title | No. of studies | No. of participants | Statistical method | Effect size |
| 1 Incidence of SAD (per protocol) Show forest plot | 1 | Risk Ratio (M‐H, Random, 95% CI) | Totals not selected | |
| Analysis 4.1  Comparison 4 Bright light therapy vs infrared light therapy, Outcome 1 Incidence of SAD (per protocol). | ||||
| 2 Incidence of SAD (ITT, assuming no dropout was depressed) Show forest plot | 1 | Risk Ratio (M‐H, Random, 95% CI) | Totals not selected | |
| Analysis 4.2  Comparison 4 Bright light therapy vs infrared light therapy, Outcome 2 Incidence of SAD (ITT, assuming no dropout was depressed). | ||||
| 3 Incidence of SAD (ITT, assuming all dropouts were depressed) Show forest plot | 1 | Risk Ratio (M‐H, Random, 95% CI) | Totals not selected | |
| Analysis 4.3  Comparison 4 Bright light therapy vs infrared light therapy, Outcome 3 Incidence of SAD (ITT, assuming all dropouts were depressed). | ||||
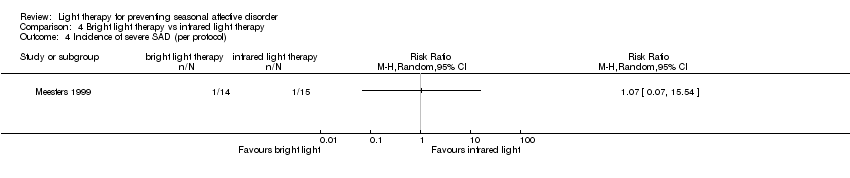
| 4 Incidence of severe SAD (per protocol) Show forest plot | 1 | Risk Ratio (M‐H, Random, 95% CI) | Totals not selected | |
| Analysis 4.4  Comparison 4 Bright light therapy vs infrared light therapy, Outcome 4 Incidence of severe SAD (per protocol). | ||||
| 5 Incidence of severe SAD (ITT, assuming no dropout was depressed) Show forest plot | 1 | Risk Ratio (M‐H, Random, 95% CI) | Totals not selected | |
| Analysis 4.5  Comparison 4 Bright light therapy vs infrared light therapy, Outcome 5 Incidence of severe SAD (ITT, assuming no dropout was depressed). | ||||
| 6 Incidence of severe SAD (ITT, assuming all dropouts were depressed) Show forest plot | 1 | Risk Ratio (M‐H, Random, 95% CI) | Totals not selected | |
| Analysis 4.6  Comparison 4 Bright light therapy vs infrared light therapy, Outcome 6 Incidence of severe SAD (ITT, assuming all dropouts were depressed). | ||||
| 7 Overall discontinuation Show forest plot | 1 | Risk Ratio (M‐H, Random, 95% CI) | Totals not selected | |
| Analysis 4.7  Comparison 4 Bright light therapy vs infrared light therapy, Outcome 7 Overall discontinuation. | ||||

PRISMA flow diagram.
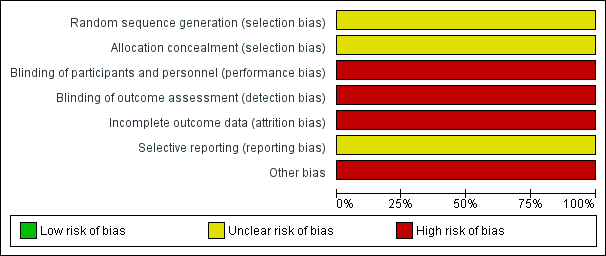
Risk of bias graph: review authors' judgements about each risk of bias item presented as percentages across included studies.
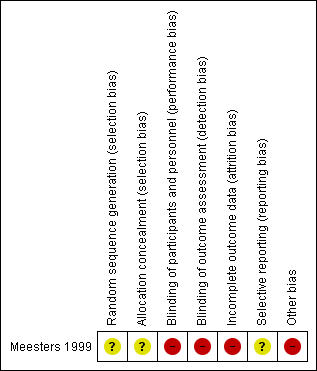
Risk of bias summary: review authors' judgements about each risk of bias item for the included study.

Comparison 1 Bright light therapy vs no light therapy, Outcome 1 Incidence of SAD (per protocol analysis).

Comparison 1 Bright light therapy vs no light therapy, Outcome 2 Incidence of SAD (ITT, assuming no dropout was depressed).

Comparison 1 Bright light therapy vs no light therapy, Outcome 3 Incidence of SAD (ITT, assuming all dropouts were depressed).
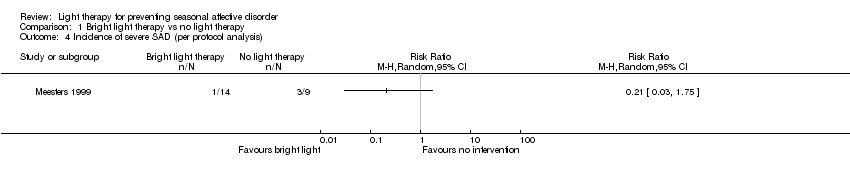
Comparison 1 Bright light therapy vs no light therapy, Outcome 4 Incidence of severe SAD (per protocol analysis).

Comparison 1 Bright light therapy vs no light therapy, Outcome 5 Incidence of severe SAD (ITT, assuming no dropout was depressed).
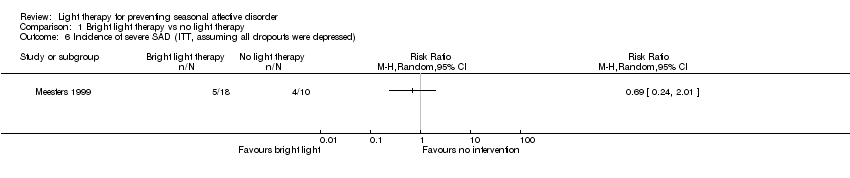
Comparison 1 Bright light therapy vs no light therapy, Outcome 6 Incidence of severe SAD (ITT, assuming all dropouts were depressed).

Comparison 1 Bright light therapy vs no light therapy, Outcome 7 Overall rate of discontinuation.

Comparison 2 Infrared light therapy vs no light therapy, Outcome 1 Incidence of SAD (per protocol analysis).

Comparison 2 Infrared light therapy vs no light therapy, Outcome 2 Incidence of SAD (ITT, assuming no dropout was depressed).

Comparison 2 Infrared light therapy vs no light therapy, Outcome 3 Incidence of SAD (ITT, assuming all dropouts were depressed).

Comparison 2 Infrared light therapy vs no light therapy, Outcome 4 Incidence of severe SAD (per protocol analysis).

Comparison 2 Infrared light therapy vs no light therapy, Outcome 5 Incidence of severe SAD (ITT, assuming no dropout was depressed).

Comparison 2 Infrared light therapy vs no light therapy, Outcome 6 Incidence of severe SAD (ITT, assuming all dropouts were depressed).

Comparison 2 Infrared light therapy vs no light therapy, Outcome 7 Overall rate of discontinuation.

Comparison 3 Light therapy (bright white and infrared) vs no light therapy, Outcome 1 Incidence of SAD (per protocol analysis).
Comparison 3 Light therapy (bright white and infrared) vs no light therapy, Outcome 2 Incidence of SAD (ITT, assuming no dropout was depressed).

Comparison 3 Light therapy (bright white and infrared) vs no light therapy, Outcome 3 Incidence of SAD (ITT, assuming all dropouts were depressed).

Comparison 3 Light therapy (bright white and infrared) vs no light therapy, Outcome 4 Incidence of severe SAD (per protocol analysis).

Comparison 3 Light therapy (bright white and infrared) vs no light therapy, Outcome 5 Incidence of severe SAD (ITT, assuming no dropout was depressed).

Comparison 3 Light therapy (bright white and infrared) vs no light therapy, Outcome 6 Incidence of severe SAD (ITT, assuming all dropouts were depressed).

Comparison 3 Light therapy (bright white and infrared) vs no light therapy, Outcome 7 Overall discontinuation.
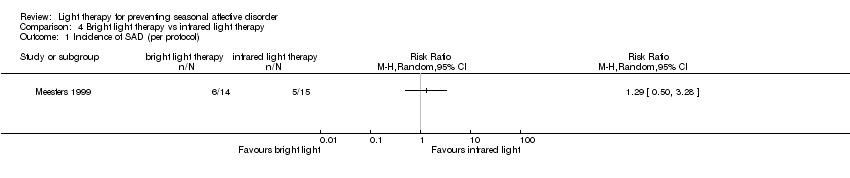
Comparison 4 Bright light therapy vs infrared light therapy, Outcome 1 Incidence of SAD (per protocol).

Comparison 4 Bright light therapy vs infrared light therapy, Outcome 2 Incidence of SAD (ITT, assuming no dropout was depressed).

Comparison 4 Bright light therapy vs infrared light therapy, Outcome 3 Incidence of SAD (ITT, assuming all dropouts were depressed).
Comparison 4 Bright light therapy vs infrared light therapy, Outcome 4 Incidence of severe SAD (per protocol).

Comparison 4 Bright light therapy vs infrared light therapy, Outcome 5 Incidence of severe SAD (ITT, assuming no dropout was depressed).

Comparison 4 Bright light therapy vs infrared light therapy, Outcome 6 Incidence of severe SAD (ITT, assuming all dropouts were depressed).

Comparison 4 Bright light therapy vs infrared light therapy, Outcome 7 Overall discontinuation.
| Bright white light therapy compared with no light therapy for prevention of SAD | ||||||
| Patient or population: All participants were known SAD patients who had been successfully treated with conventional light therapy in previous winters | ||||||
| Outcomes | Illustrative comparative risks* (95% CI) | Relative effect | Number of participants | Quality of the evidence | Comments | |
| Assumed risk | Corresponding risk | |||||
| No light therapy | Light therapy | |||||
| Incidence of SAD (SIGH‐SAD score ≥ 20) (follow‐up 26 weeks) | Low | RR 0.64 | 23 | ⊕⊝⊝⊝ | ||
| 300 per 1000 | 192 per 1000 | |||||
| Moderate | ||||||
| 500 per 1000 | 320 per 1000 (150 to 690) | |||||
| High | ||||||
| 600 per 1000 | 276 per 1000 (210 to 966) | |||||
| Incidence of severe SAD (SIGH‐SAD‐SR (≥ 40)) (follow‐up 26 weeks) | Study population | RR 0.21 | 23 | ⊕⊝⊝⊝ | ||
| 333 per 1000 | 70 per 1000 | |||||
| Overall discontinuation (follow‐up 26 weeks) | Study population | RR 2.22 | 28 | ⊕⊝⊝⊝ | ||
| 100 per 1000 | 222 per 1000 | |||||
| *The basis for the assumed risk (e.g. median control group risk across studies) is provided in footnotes. The corresponding risk (and its 95% confidence interval) is based on the assumed risk in the comparison group and the relative effect of the intervention (and its 95% CI) | ||||||
| GRADE Working Group grades of evidence | ||||||
| aDowngraded 2 steps because of severe risk of bias due to non‐blinding and unclear randomisation process and allocation concealment; no intention‐to‐treat analysis was reported, outcomes were self rated, compliance throughout study duration was not checked and participant characteristics were not reported comprehensively bDowngraded 1 step because of small sample size (lack of power and random error could have influenced results) | ||||||
| Infrared light therapy compared with no light therapy for prevention of SAD | ||||||
| Patient or population: All participants were known SAD patients who had been successfully treated with conventional light therapy in previous winters | ||||||
| Outcomes | Illustrative comparative risks* (95% CI) | Relative effect | Number of participants | Quality of the evidence | Comments | |
| Assumed risk | Corresponding risk | |||||
| No light therapy | Infrared light therapy | |||||
| Incidence of SAD (SIGH‐SAD score ≥ 20) (follow‐up 26 weeks) | Low | RR 0.50 | 24 | ⊕⊝⊝⊝ | ||
| 300 per 1000 | 150 per 1000 (63 to 351) | |||||
| Moderate | ||||||
| 500 per 1000 | 250 per 1000 (105 to 585) | |||||
| High | ||||||
| 600 per 1000 | 300 per 1000 (126 to 702) | |||||
| Incidence of severe SAD (SIGH‐SAD‐SR (≥ 40)) (follow‐up 26 weeks) | Study population | RR 0.20 | 24 | ⊕⊝⊝⊝ | ||
| 333 per 1000 | 67 per 1000 | |||||
| Overall discontinuation (follow‐up 26 weeks) | Study population | RR 1.67 | 28 | ⊕⊝⊝⊝ | ||
| 100 per 1000 | 167 per 1000 | |||||
| *The basis for the assumed risk (e.g. median control group risk across studies) is provided in footnotes. The corresponding risk (and its 95% confidence interval) is based on the assumed risk in the comparison group and the relative effect of the intervention (and its 95% CI) | ||||||
| GRADE Working Group grades of evidence | ||||||
| aDowngraded 2 steps because of severe risk of bias due to non‐blinding and unclear randomisation process and allocation concealment; no intention‐to‐treat analysis was reported, outcomes were self rated, compliance throughout study duration was not checked and participant characteristics were not reported comprehensively bDowngraded 1 step because of small sample size (lack of power and random error could have influenced results) | ||||||
| Light therapy (bright white or infrared) compared with no light therapy for prevention of SAD | ||||||
| Patient or population: All participants were known SAD patients who had been successfully treated with conventional light therapy in previous winters | ||||||
| Outcomes | Illustrative comparative risks* (95% CI) | Relative effect | Number of participants | Quality of the evidence | Comments | |
| Assumed risk | Corresponding risk | |||||
| No light therapy | Infrared light therapy | |||||
| Incidence of SAD (SIGH‐SAD score ≥ 20) (follow‐up 26 weeks) | Low | RR 0.57 | 38 | ⊕⊝⊝⊝ | ||
| 300 per 1000 | 171per 1000 (90 to 330) | |||||
| Moderate | ||||||
| 500 per 1000 | 285 per 1000 (150 to 550) | |||||
| High | ||||||
| 600 per 1000 | 342 per 1000 (180 to 660) | |||||
| Incidence of severe SAD (SIGH‐SAD‐SR (≥ 40)) (follow‐up 26 weeks) | Study population | RR 0.21 | 38 | ⊕⊝⊝⊝ | ||
| 333 per 1000 | 70 per 1000 | |||||
| Overall discontinuation (follow‐up 26 weeks) | Study population | RR 1.94 | 46 | ⊕⊝⊝⊝ | ||
| 100 per 1000 | 194 per 1000 | |||||
| *The basis for the assumed risk (e.g. median control group risk across studies) is provided in footnotes. The corresponding risk (and its 95% confidence interval) is based on the assumed risk in the comparison group and the relative effect of the intervention (and its 95% CI) | ||||||
| GRADE Working Group grades of evidence | ||||||
| aDowngraded 2 steps because of severe risk of bias due to non‐blinding and unclear randomisation process and allocation concealment; no intention‐to‐treat analysis was reported, outcomes were self rated, compliance throughout study duration was not checked and participant characteristics were not reported comprehensively bDowngraded 1 step because of small sample size (lack of power and random error could have influenced results) | ||||||
| Bright white light therapy compared with infrared light therapy for prevention of SAD | ||||||
| Patient or population: All participants were known SAD patients who had been successfully treated with conventional light therapy in previous winters | ||||||
| Outcomes | Risk in both groups | Relative effect | Number of participants | Quality of the evidence | Comments | |
| Risk in this treatment group | Risk in this treatment group | |||||
| Infrared light therapy | Bright white light therapy | |||||
| Incidence of SAD (SIGH‐SAD score ≥ 20) (follow‐up 26 weeks) | Study population | RR 1.29 | 29 | ⊕⊝⊝⊝ | ||
| 333 per 1000 | 357 per 1000 | |||||
| Incidence of severe SAD (SIGH‐SAD‐SR (≥ 40)) (follow‐up 26 weeks) | Study population | RR 1.07 | 29 | ⊕⊝⊝⊝ | ||
| 67 per 1000 | 71 per 1000 | |||||
| Overall discontinuation (follow‐up 26 weeks) | Study population | RR 1.33 | 36 | ⊕⊝⊝⊝ | ||
| 167 per 1000 | 222 per 1000 | |||||
| CI: Confidence interval; RCT: Randomised controlled trial; RR: Risk ratio, SIGH‐SAD‐SR: Structured Interview Guide for the Hamilton Depression Rating Scale‐Seasonal Affective Disorders self rating version | ||||||
| GRADE Working Group grades of evidence | ||||||
| aDowngraded 2 steps because of severe risk of bias due to non‐blinding and unclear randomisation process and allocation concealment; no intention‐to‐treat analysis was reported, outcomes were self rated, compliance throughout study duration was not checked and participant characteristics were not reported comprehensively bDowngraded 1 step because of small sample size (lack of power and random error could have influenced results) | ||||||
| Outcome or subgroup title | No. of studies | No. of participants | Statistical method | Effect size |
| 1 Incidence of SAD (per protocol analysis) Show forest plot | 1 | Risk Ratio (M‐H, Random, 95% CI) | Totals not selected | |
| 2 Incidence of SAD (ITT, assuming no dropout was depressed) Show forest plot | 1 | Risk Ratio (M‐H, Random, 95% CI) | Totals not selected | |
| 3 Incidence of SAD (ITT, assuming all dropouts were depressed) Show forest plot | 1 | Risk Ratio (M‐H, Random, 95% CI) | Totals not selected | |
| 4 Incidence of severe SAD (per protocol analysis) Show forest plot | 1 | Risk Ratio (M‐H, Random, 95% CI) | Totals not selected | |
| 5 Incidence of severe SAD (ITT, assuming no dropout was depressed) Show forest plot | 1 | Risk Ratio (M‐H, Random, 95% CI) | Totals not selected | |
| 6 Incidence of severe SAD (ITT, assuming all dropouts were depressed) Show forest plot | 1 | Risk Ratio (M‐H, Random, 95% CI) | Totals not selected | |
| 7 Overall rate of discontinuation Show forest plot | 1 | Risk Ratio (M‐H, Random, 95% CI) | Totals not selected | |
| Outcome or subgroup title | No. of studies | No. of participants | Statistical method | Effect size |
| 1 Incidence of SAD (per protocol analysis) Show forest plot | 1 | Risk Ratio (M‐H, Fixed, 95% CI) | Totals not selected | |
| 2 Incidence of SAD (ITT, assuming no dropout was depressed) Show forest plot | 1 | Risk Ratio (M‐H, Fixed, 95% CI) | Totals not selected | |
| 3 Incidence of SAD (ITT, assuming all dropouts were depressed) Show forest plot | 1 | Risk Ratio (M‐H, Fixed, 95% CI) | Totals not selected | |
| 4 Incidence of severe SAD (per protocol analysis) Show forest plot | 1 | Risk Ratio (M‐H, Fixed, 95% CI) | Totals not selected | |
| 5 Incidence of severe SAD (ITT, assuming no dropout was depressed) Show forest plot | 1 | Risk Ratio (M‐H, Fixed, 95% CI) | Totals not selected | |
| 6 Incidence of severe SAD (ITT, assuming all dropouts were depressed) Show forest plot | 1 | Risk Ratio (M‐H, Fixed, 95% CI) | Totals not selected | |
| 7 Overall discontinuation Show forest plot | 1 | Risk Ratio (M‐H, Fixed, 95% CI) | Totals not selected | |
| Outcome or subgroup title | No. of studies | No. of participants | Statistical method | Effect size |
| 1 Incidence of SAD (per protocol) Show forest plot | 1 | Risk Ratio (M‐H, Random, 95% CI) | Totals not selected | |
| 2 Incidence of SAD (ITT, assuming no dropout was depressed) Show forest plot | 1 | Risk Ratio (M‐H, Random, 95% CI) | Totals not selected | |
| 3 Incidence of SAD (ITT, assuming all dropouts were depressed) Show forest plot | 1 | Risk Ratio (M‐H, Random, 95% CI) | Totals not selected | |
| 4 Incidence of severe SAD (per protocol) Show forest plot | 1 | Risk Ratio (M‐H, Random, 95% CI) | Totals not selected | |
| 5 Incidence of severe SAD (ITT, assuming no dropout was depressed) Show forest plot | 1 | Risk Ratio (M‐H, Random, 95% CI) | Totals not selected | |
| 6 Incidence of severe SAD (ITT, assuming all dropouts were depressed) Show forest plot | 1 | Risk Ratio (M‐H, Random, 95% CI) | Totals not selected | |
| 7 Overall discontinuation Show forest plot | 1 | Risk Ratio (M‐H, Random, 95% CI) | Totals not selected | |