Laser fotopembekuan bagi retinopati diabetes proliferatif
Información
- DOI:
- https://doi.org/10.1002/14651858.CD011234.pub2Copiar DOI

- Base de datos:
-
- Cochrane Database of Systematic Reviews
- Versión publicada:
-
- 24 noviembre 2014see what's new
- Tipo:
-
- Intervention
- Etapa:
-
- Review
- Grupo Editorial Cochrane:
-
Grupo Cochrane de Salud ocular y de la visión
- Copyright:
-
- Copyright © 2015 The Cochrane Collaboration. Published by John Wiley & Sons, Ltd.
Cifras del artículo
Altmetric:
Citado por:
Autores
Contributions of authors
JE prepared a first draft of the protocol, which was revised by GV.
JE and MM screened search results and extracted data. GV and MM reviewed and commented on various drafts of the review.
Sources of support
Internal sources
-
No sources of support supplied
External sources
-
Italian Ministry of Health and Fondazione Roma, Italy.
The contribution of the IRCCS Fondazione Bietti in this paper was supported by the Italian Ministry of Health and by Fondazione Roma, Italy
-
National Institute for Health Research (NIHR), UK.
-
Richard Wormald, Co‐ordinating Editor for the Cochrane Eyes and Vision Group (CEVG) acknowledges financial support for his CEVG research sessions from the Department of Health through the award made by the National Institute for Health Research to Moorfields Eye Hospital NHS Foundation Trust and UCL Institute of Ophthalmology for a Specialist Biomedical Research Centre for Ophthalmology.
-
The NIHR also funds the CEVG Editorial Base in London.
-
The Cochrane Review Incentive Scheme provided funding for Jennifer Evans to assist with completion of this review.
The views expressed in this publication are those of the authors and not necessarily those of the NIHR, NHS, or the Department of Health.
-
Declarations of interest
JE: none known
MM: none known
GV: none known
Acknowledgements
The Cochrane Eyes and Vision Group (CEVG) created and executed the electronic search strategies. We thank Catey Bunce, Christian Fau, Noemi Lois and Richard Wormald for their comments on the protocol and David Yorston, Andrew Elders and Christian Fau for their comments on the review. We thank Anupa Shah, the Managing Editor, for her assistance throughout the review process.
Version history
| Published | Title | Stage | Authors | Version |
| 2014 Nov 24 | Laser photocoagulation for proliferative diabetic retinopathy | Review | Jennifer R Evans, Manuele Michelessi, Gianni Virgili | |
| 2014 Aug 05 | Laser photocoagulation for diabetic retinopathy | Protocol | Jennifer R Evans, Christian Fau, Gianni Virgili | |
Differences between protocol and review
Title
On the recommendation of a clinical peer reviewer we changed the title of this review from "laser photocoagulation for diabetic retinopathy" to "laser photocoagulation for proliferative diabetic retinopathy". The reviewer felt that clinicians seeing the broader title would expect to see diabetic macular oedema (DMO) included in this review but this is specifically excluded as there is a separate review looking at laser for DMO (Jorge 2013).
Outcomes
We changed 'distance corrected near visual acuity' to 'near visual acuity'. We did not find any data on near visual acuity, either distance corrected or not.
We moved the outcome 'severe visual loss' out of adverse effects and further up the list, refecting the use of this outcome generally as a measure of effect rather than an adverse effect as originally defined in our protocol. We considered this outcome at one year follow‐up as for the other effectiveness outcomes (and not, as originally planned, within three months of treatment).
We removed the outcome 'secondary choroidal neovascularisation' for future updates. This outcome is more of a concern after treatment for diabetic macular oedema. We did not find any data on this outcome.
Measures of effect
We planned to calculate the risk ratio for dichotomous variables where the event risk was greater than 10%, the odds ratio for dichotomous variables where the event risk was less than 10% and for very rare events (less than 1%) the Peto odds ratio. In fact for most analyses the event risk in the control group was greater than, or approximately, 10% and we felt that it would be confusing to report an odds ratio for only one outcome (severe visual loss) where the event rate was 4%. We have therefore only used the risk ratio as the measure of effect for dichotomous variables. This decision has not affected the conclusions drawn. For the outcome of severe visual loss the reported risk ratio was 0.46 (95% CI 0.24 to 0.86) and this is similar to the odds ratio of 0.40 (95% CI 0.18 to 0.88).
Data synthesis
We planned that, in cases of substantial heterogeneity, for example differences in direction of effect, or where the I2 statistic was greater than 50% and the Chi2 statistic less than 0.1, such that the pooled result did not summarize the individual trial results adequately, we would not provide a pooled estimate, unless visual inspection of the forest plot indicated it might be appropriate to do so (for example, if all effect estimates were in the same direction). For one analysis, Analysis 1.1, the effect estimates were reasonably close to 1 and we report a pooled estimate even though the effect estimates were not in the same direction.
Keywords
MeSH
Medical Subject Headings (MeSH) Keywords
Medical Subject Headings Check Words
Humans;
PICO
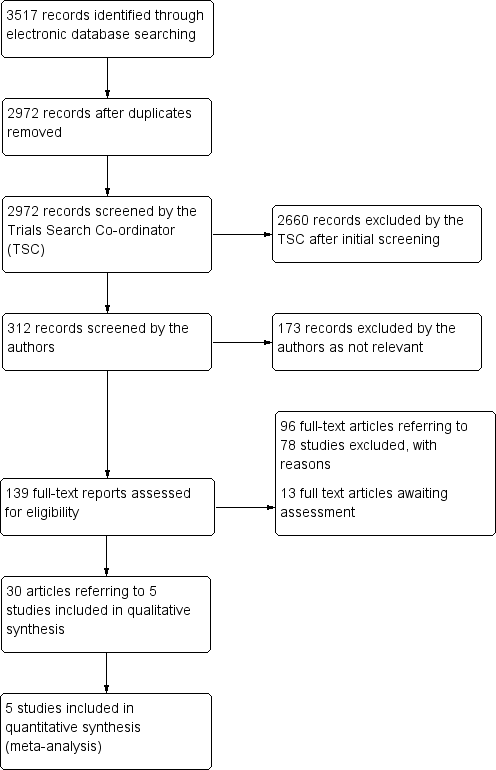
Results from searching for studies for inclusion in the review

Risk of bias summary: review authors' judgements about each risk of bias item for each included study.

Forest plot of comparison: 1 Laser photocoagulation versus control, outcome: 1.1 Loss of 15 or more letters BCVA at 12 months

Forest plot of comparison: 1 Laser photocoagulation versus control, outcome: 1.4 Severe visual loss (BCVA < 6/60)

Forest plot of comparison: 1 Laser photocoagulation versus control, outcome: 1.5 Progression of diabetic retinopathy

Comparison 1 Laser photocoagulation versus control, Outcome 1 Loss of 15 or more letters BCVA at 12 months.

Comparison 1 Laser photocoagulation versus control, Outcome 2 Loss of 15 or more letters BCVA at 2 years.

Comparison 1 Laser photocoagulation versus control, Outcome 3 Loss of 15 or more letters BCVA at 3 years.

Comparison 1 Laser photocoagulation versus control, Outcome 4 Severe visual loss (BCVA < 6/60).

Comparison 1 Laser photocoagulation versus control, Outcome 5 Progression of diabetic retinopathy.
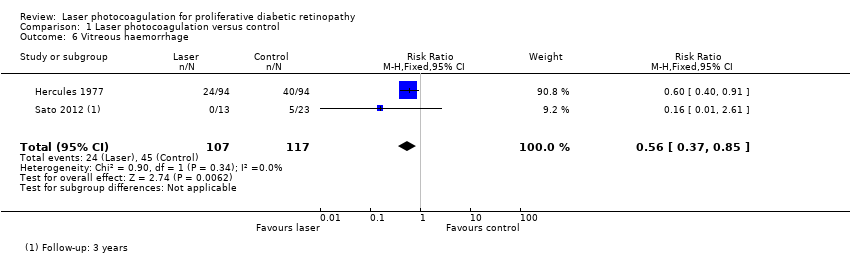
Comparison 1 Laser photocoagulation versus control, Outcome 6 Vitreous haemorrhage.
| Laser photocoagulation compared to no treatment (or deferred treatment) for diabetic retinopathy | ||||||
| Patient or population: people with diabetic retinopathy | ||||||
| Outcomes | Illustrative comparative risks* (95% CI) | Relative effect | No of participants | Quality of the evidence | Comments | |
| Assumed risk* | Corresponding risk | |||||
| No treatment or deferred treatment | Laser photocoagulation | |||||
| Loss of 15 or more letters BCVA Follow‐up: 12 months | Low risk (non‐proliferative DR) | RR 0.99 | 8926 | ⊕⊕⊝⊝ | The pooled RR 0.99 (0.89 to 1.11) is derived from one study with mainly low risk population RR 1.07 (0.92 to 1.23) and one study with mainly high risk population 0.86 (0.71 to 1.04) | |
| 100 per 1000 | 99 per 1000 | |||||
| High risk (proliferative DR) | ||||||
| 250 per 1000 | 248 per 1000 | |||||
| BCVA measured using logMAR acuity (0 = 6/6 visual acuity, higher score is worse visual acuity) Follow‐up: 12 months | The mean BCVA at 12 months in the control group was 0.12 logMAR | The mean BCVA at 12 months in the intervention group was 0.02 logMAR units higher (worse; 0.23 lower to 0.27 higher) | 36 | ⊕⊕⊝⊝ | ||
| Severe visual loss (BCVA < 6/60) Follow‐up: 12 months | Low risk (non‐proliferative DR) | RR 0.46 | 9276 | ⊕⊕⊕⊝ | ||
| 10 per 1000 | 5 per 1000 | |||||
| High risk (proliferative DR) | ||||||
| 50 per 1000 | 23 per 1000 | |||||
| Progression of diabetic retinopathy Follow‐up: 12 months | Low risk (non‐proliferative DR) | RR 0.49 | 8331 | ⊕⊕⊝⊝ | ||
| 100 per 1000 | 49 per 1000 | |||||
| High risk (proliferative DR) | ||||||
| 400 per 1000 | 196 per 1000 (148 to 256) | |||||
| Quality of life Follow‐up: 12 months | See comment | See comment | No studies reported this outcome | |||
| Pain Follow‐up: at time of treatment | See comment | See comment | No studies reported this outcome | |||
| Loss of driving licence Follow‐up: within three months of treatment | See comment | See comment | No studies reported this outcome | |||
| *The basis for the assumed risk (e.g. the median control group risk across studies) is provided in footnotes. The corresponding risk (and its 95% confidence interval) is based on the assumed risk in the comparison group and the relative effect of the intervention (and its 95% CI). | ||||||
| GRADE Working Group grades of evidence | ||||||
| *Estimates of assumed risk are indicative only, as estimates at 12 months were not available in all studies. For the low risk populations they were estimated from ETDRS (but acknowledging that the control group received deferred laser) and for the high risk populations they were estimated from DRS and Hercules 1977. 1Downgraded for risk of bias (‐1): studies were not masked and treatment groups different 2Downgraded for inconsistency (‐1): I2 = 69% and effect estimates were in different directions. See comments for details 3Downgraded for imprecision (‐1): wide confidence intervals 4 There was heterogeneity (I2 = 70%) but all effect estimates favoured laser photocoagulation so we did not downgrade for inconsistency 5Downgraded for indirectness (‐1): study results were reported at 1, 3, 4 and 5 years | ||||||
| Study | Type of laser | Type of photocoagulation | Number (size) of burns | Intensity | Exposure time (seconds) | Number of sessions |
| Argon | Panretinal Focal treatment of new vessels | 800‐1600 (500 µm) or 500‐1000 (1000 µm) | Not reported | 0.1 | 1 (usually) | |
| Argon | Panretinal | Full: 1200‐1600 (500 µm) Mild: 400‐650 (500 µm) | Moderate | 0.1 | Full: 2 or more Mild: 1 | |
| Argon | Panretinal | 800 to 3000 (200 µm and 500 µm) | Minimal retinal blanching | Not reported | Up to 6 | |
| Not reported | Selective photocoagulation of non‐perfusion areas | (400 µm‐500 µm) | Not reported | Not reported | ||
| Argon | Panretinal | As for DRS 1978 | As for DRS 1978 | As for DRS 1978 | As for DRS 1978 |
| Outcome or subgroup title | No. of studies | No. of participants | Statistical method | Effect size |
| 1 Loss of 15 or more letters BCVA at 12 months Show forest plot | 2 | 8926 | Risk Ratio (M‐H, Fixed, 95% CI) | 0.99 [0.89, 1.11] |
| 2 Loss of 15 or more letters BCVA at 2 years Show forest plot | 2 | 8306 | Risk Ratio (M‐H, Fixed, 95% CI) | 0.88 [0.80, 0.97] |
| 3 Loss of 15 or more letters BCVA at 3 years Show forest plot | 2 | 7458 | Risk Ratio (M‐H, Fixed, 95% CI) | 1.07 [0.93, 1.23] |
| 4 Severe visual loss (BCVA < 6/60) Show forest plot | 4 | 9276 | Risk Ratio (M‐H, Random, 95% CI) | 0.46 [0.24, 0.86] |
| 5 Progression of diabetic retinopathy Show forest plot | 4 | 8331 | Risk Ratio (M‐H, Random, 95% CI) | 0.49 [0.37, 0.64] |
| 6 Vitreous haemorrhage Show forest plot | 2 | 224 | Risk Ratio (M‐H, Fixed, 95% CI) | 0.56 [0.37, 0.85] |