Лазерная фотокоагуляция при пролиферативной диабетической ретинопатии
Appendices
Appendix 1. CENTRAL search strategy
#1 MeSH descriptor: [Diabetic Retinopathy] explode all trees
#2 diabet* near/3 retinopath*
#3 proliferat* near/3 retinopath*
#4 diabet* near/3 maculopath*
#5 neovasculari?ation
#6 #1 or #2 or #3 or #4 or #5
#7 MeSH descriptor: [Light Coagulation] explode all trees
#8 photocoagulat*
#9 photo next coagulat*
#10 (focal or grid) near/3 laser*
#11 coagulat* or argon or krypton or YAG or diode or micropulse or panretinal
#12 #7 or #8 or #9 or #10 or #11
#13 #6 and #12
Appendix 2. MEDLINE (OvidSP) search strategy
1. randomized controlled trial.pt.
2. (randomized or randomised).ab,ti.
3. placebo.ab,ti.
4. dt.fs.
5. randomly.ab,ti.
6. trial.ab,ti.
7. groups.ab,ti.
8. or/1‐7
9. exp animals/
10. exp humans/
11. 9 not (9 and 10)
12. 8 not 11
13. exp diabetic retinopathy/
14. (diabet$ adj3 retinopath$).tw.
15. (proliferat$ adj3 retinopath$).tw.
16. (diabet$ adj3 maculopath$).tw.
17. neovasculari?ation.tw.
18. or/13‐17
19. exp light coagulation/
20. photocoagulat$.tw.
21. (photo adj1 coagulat$).tw.
22. ((focal or grid) adj3 laser$).tw.
23. (coagulat$ or argon or krypton or YAG or diode or micropulse or panretinal).tw.
24. or/19‐23
25. 18 and 24
26. 12 and 25
The search filter for trials at the beginning of the MEDLINE strategy is from the published paper by Glanville et al (Glanville 2006).
Appendix 3. EMBASE (OvidSP) search strategy
1. exp randomized controlled trial/
2. exp randomization/
3. exp double blind procedure/
4. exp single blind procedure/
5. random$.tw.
6. or/1‐5
7. (animal or animal experiment).sh.
8. human.sh.
9. 7 and 8
10. 7 not 9
11. 6 not 10
12. exp clinical trial/
13. (clin$ adj3 trial$).tw.
14. ((singl$ or doubl$ or trebl$ or tripl$) adj3 (blind$ or mask$)).tw.
15. exp placebo/
16. placebo$.tw.
17. random$.tw.
18. exp experimental design/
19. exp crossover procedure/
20. exp control group/
21. exp latin square design/
22. or/12‐21
23. 22 not 10
24. 23 not 11
25. exp comparative study/
26. exp evaluation/
27. exp prospective study/
28. (control$ or prospectiv$ or volunteer$).tw.
29. or/25‐28
30. 29 not 10
31. 30 not (11 or 23)
32. 11 or 24 or 31
33. exp diabetic retinopathy/
34. (diabet$ adj3 retinopath$).tw.
35. (proliferat$ adj3 retinopath$).tw.
36. (diabet$ adj3 maculopath$).tw.
37. neovasculari?ation.tw.
38. or/33‐37
39. exp laser coagulation/
40. argon laser/
41. photocoagulat$.tw.
42. (photo adj1 coagulat$).tw.
43. ((focal or grid) adj3 laser$).tw.
44. (coagulat$ or argon or krypton or YAG or diode or micropulse or panretinal).tw.
45. or/39‐44
46. 38 and 45
47. 32 and 46
Appendix 4. metaRegister of Controlled Trials search strategy
diabetic retinopathy AND (laser OR photocoagulation OR coagulation OR argon OR krypton OR YAG OR diode micropulse OR panretinal)
Appendix 5. ClinicalTrials.gov search strategy
diabetic retinopathy AND (laser OR photocoagulation OR coagulation OR argon OR krypton OR YAG OR diode micropulse OR panretinal)
Appendix 6. ICTRP search strategy
diabetic retinopathy = Condition AND laser OR photocoagulation OR coagulation OR argon OR krypton OR YAG OR diode micropulse OR panretinal = Intervention
Appendix 7. Data extraction sheet on trial characteristics
| Table heading in RevMan 2014 | Subheadings for CEVG reviews | Comment |
| Methods | Trial design | Parallel group RCT (i.e. people randomised to treatment) Paired eye or intra‐individual RCT (i.e. eyes randomised to treatment) Cluster RCT (i.e. communities randomised to treatment) Cross‐over RCT Other, specify |
| Eyes | One eye included in trial ‐ Specify how eye selected Both eyes included in trial, eyes received same treatment ‐ Briefly specify how analysed (best/worst/average/both and adjusted for within‐person correlation/both and not adjusted for within‐person correlation) ‐ Specify if mixture one eye and two eye Both eyes included in trial, eyes received different treatments (pair matched) ‐ Specify if correct pair‐matched analysis done | |
| Participants | Country | |
| Number of participants | ||
| % women | ||
| Average age | ||
| Age range | ||
| Inclusion criteria | ||
| Exclusion criteria | ||
| Interventions | Intervention Comparator | Including number of participants randomly allocated to each |
| Outcomes | List | Outcomes reported in methods and results, identify primary outcome if specified |
| Notes | Date conducted | Dates of recruitment of participants month/year to month/year |
| Sources of funding | If reported | |
| Declaration of interest | If reported |
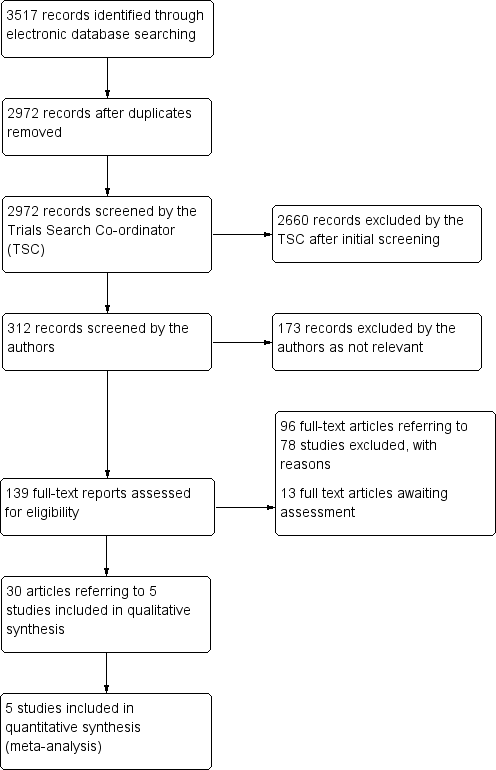
Results from searching for studies for inclusion in the review

Risk of bias summary: review authors' judgements about each risk of bias item for each included study.

Forest plot of comparison: 1 Laser photocoagulation versus control, outcome: 1.1 Loss of 15 or more letters BCVA at 12 months

Forest plot of comparison: 1 Laser photocoagulation versus control, outcome: 1.4 Severe visual loss (BCVA < 6/60)

Forest plot of comparison: 1 Laser photocoagulation versus control, outcome: 1.5 Progression of diabetic retinopathy

Comparison 1 Laser photocoagulation versus control, Outcome 1 Loss of 15 or more letters BCVA at 12 months.

Comparison 1 Laser photocoagulation versus control, Outcome 2 Loss of 15 or more letters BCVA at 2 years.

Comparison 1 Laser photocoagulation versus control, Outcome 3 Loss of 15 or more letters BCVA at 3 years.

Comparison 1 Laser photocoagulation versus control, Outcome 4 Severe visual loss (BCVA < 6/60).

Comparison 1 Laser photocoagulation versus control, Outcome 5 Progression of diabetic retinopathy.
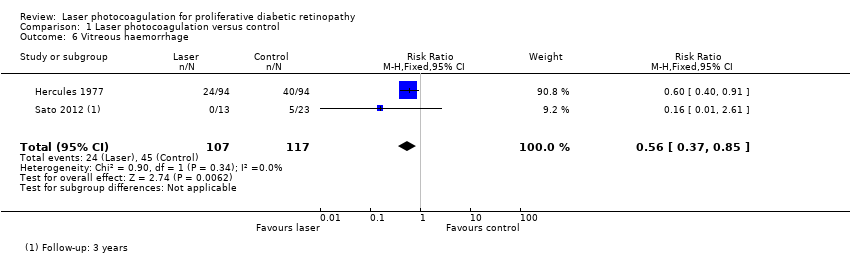
Comparison 1 Laser photocoagulation versus control, Outcome 6 Vitreous haemorrhage.
| Laser photocoagulation compared to no treatment (or deferred treatment) for diabetic retinopathy | ||||||
| Patient or population: people with diabetic retinopathy | ||||||
| Outcomes | Illustrative comparative risks* (95% CI) | Relative effect | No of participants | Quality of the evidence | Comments | |
| Assumed risk* | Corresponding risk | |||||
| No treatment or deferred treatment | Laser photocoagulation | |||||
| Loss of 15 or more letters BCVA Follow‐up: 12 months | Low risk (non‐proliferative DR) | RR 0.99 | 8926 | ⊕⊕⊝⊝ | The pooled RR 0.99 (0.89 to 1.11) is derived from one study with mainly low risk population RR 1.07 (0.92 to 1.23) and one study with mainly high risk population 0.86 (0.71 to 1.04) | |
| 100 per 1000 | 99 per 1000 | |||||
| High risk (proliferative DR) | ||||||
| 250 per 1000 | 248 per 1000 | |||||
| BCVA measured using logMAR acuity (0 = 6/6 visual acuity, higher score is worse visual acuity) Follow‐up: 12 months | The mean BCVA at 12 months in the control group was 0.12 logMAR | The mean BCVA at 12 months in the intervention group was 0.02 logMAR units higher (worse; 0.23 lower to 0.27 higher) | 36 | ⊕⊕⊝⊝ | ||
| Severe visual loss (BCVA < 6/60) Follow‐up: 12 months | Low risk (non‐proliferative DR) | RR 0.46 | 9276 | ⊕⊕⊕⊝ | ||
| 10 per 1000 | 5 per 1000 | |||||
| High risk (proliferative DR) | ||||||
| 50 per 1000 | 23 per 1000 | |||||
| Progression of diabetic retinopathy Follow‐up: 12 months | Low risk (non‐proliferative DR) | RR 0.49 | 8331 | ⊕⊕⊝⊝ | ||
| 100 per 1000 | 49 per 1000 | |||||
| High risk (proliferative DR) | ||||||
| 400 per 1000 | 196 per 1000 (148 to 256) | |||||
| Quality of life Follow‐up: 12 months | See comment | See comment | No studies reported this outcome | |||
| Pain Follow‐up: at time of treatment | See comment | See comment | No studies reported this outcome | |||
| Loss of driving licence Follow‐up: within three months of treatment | See comment | See comment | No studies reported this outcome | |||
| *The basis for the assumed risk (e.g. the median control group risk across studies) is provided in footnotes. The corresponding risk (and its 95% confidence interval) is based on the assumed risk in the comparison group and the relative effect of the intervention (and its 95% CI). | ||||||
| GRADE Working Group grades of evidence | ||||||
| *Estimates of assumed risk are indicative only, as estimates at 12 months were not available in all studies. For the low risk populations they were estimated from ETDRS (but acknowledging that the control group received deferred laser) and for the high risk populations they were estimated from DRS and Hercules 1977. 1Downgraded for risk of bias (‐1): studies were not masked and treatment groups different 2Downgraded for inconsistency (‐1): I2 = 69% and effect estimates were in different directions. See comments for details 3Downgraded for imprecision (‐1): wide confidence intervals 4 There was heterogeneity (I2 = 70%) but all effect estimates favoured laser photocoagulation so we did not downgrade for inconsistency 5Downgraded for indirectness (‐1): study results were reported at 1, 3, 4 and 5 years | ||||||
| Study | Type of laser | Type of photocoagulation | Number (size) of burns | Intensity | Exposure time (seconds) | Number of sessions |
| Argon | Panretinal Focal treatment of new vessels | 800‐1600 (500 µm) or 500‐1000 (1000 µm) | Not reported | 0.1 | 1 (usually) | |
| Argon | Panretinal | Full: 1200‐1600 (500 µm) Mild: 400‐650 (500 µm) | Moderate | 0.1 | Full: 2 or more Mild: 1 | |
| Argon | Panretinal | 800 to 3000 (200 µm and 500 µm) | Minimal retinal blanching | Not reported | Up to 6 | |
| Not reported | Selective photocoagulation of non‐perfusion areas | (400 µm‐500 µm) | Not reported | Not reported | ||
| Argon | Panretinal | As for DRS 1978 | As for DRS 1978 | As for DRS 1978 | As for DRS 1978 |
| Outcome or subgroup title | No. of studies | No. of participants | Statistical method | Effect size |
| 1 Loss of 15 or more letters BCVA at 12 months Show forest plot | 2 | 8926 | Risk Ratio (M‐H, Fixed, 95% CI) | 0.99 [0.89, 1.11] |
| 2 Loss of 15 or more letters BCVA at 2 years Show forest plot | 2 | 8306 | Risk Ratio (M‐H, Fixed, 95% CI) | 0.88 [0.80, 0.97] |
| 3 Loss of 15 or more letters BCVA at 3 years Show forest plot | 2 | 7458 | Risk Ratio (M‐H, Fixed, 95% CI) | 1.07 [0.93, 1.23] |
| 4 Severe visual loss (BCVA < 6/60) Show forest plot | 4 | 9276 | Risk Ratio (M‐H, Random, 95% CI) | 0.46 [0.24, 0.86] |
| 5 Progression of diabetic retinopathy Show forest plot | 4 | 8331 | Risk Ratio (M‐H, Random, 95% CI) | 0.49 [0.37, 0.64] |
| 6 Vitreous haemorrhage Show forest plot | 2 | 224 | Risk Ratio (M‐H, Fixed, 95% CI) | 0.56 [0.37, 0.85] |