Scolaris Content Display Scolaris Content Display

Study flow diagram.
Figuras y tablas -
Figure 1

Study flow diagram.

'Risk of bias' summary: review authors' judgements about each risk of bias item for each included study.
Figuras y tablas -
Figure 2

'Risk of bias' summary: review authors' judgements about each risk of bias item for each included study.

Forest plot of comparison: 1 Non‐medical prescribing group versus usual care, Outcome: 1.2 Systolic blood pressure mmHg.
Figuras y tablas -
Figure 3

Forest plot of comparison: 1 Non‐medical prescribing group versus usual care, Outcome: 1.2 Systolic blood pressure mmHg.

Forest plot of comparison: 1 Non‐medical prescribing group versus usual care, Outcome: 1.1 HbA1c (%).
Figuras y tablas -
Figure 4

Forest plot of comparison: 1 Non‐medical prescribing group versus usual care, Outcome: 1.1 HbA1c (%).

Forest plot of comparison: 1 Non‐medical prescribing group versus usual care, Outcome: 1.3 Low‐density lipoprotein (LDL) mmol/L.
Figuras y tablas -
Figure 5

Forest plot of comparison: 1 Non‐medical prescribing group versus usual care, Outcome: 1.3 Low‐density lipoprotein (LDL) mmol/L.

Comparison 1 Non‐medical prescribing group versus usual care, Outcome 1 Systolic blood pressure mmHg.
Figuras y tablas -
Analysis 1.1

Comparison 1 Non‐medical prescribing group versus usual care, Outcome 1 Systolic blood pressure mmHg.

Comparison 1 Non‐medical prescribing group versus usual care, Outcome 2 HbA1c (%).
Figuras y tablas -
Analysis 1.2

Comparison 1 Non‐medical prescribing group versus usual care, Outcome 2 HbA1c (%).

Comparison 1 Non‐medical prescribing group versus usual care, Outcome 3 Low‐density lipoprotein (LDL) mmol/L.
Figuras y tablas -
Analysis 1.3

Comparison 1 Non‐medical prescribing group versus usual care, Outcome 3 Low‐density lipoprotein (LDL) mmol/L.

Comparison 1 Non‐medical prescribing group versus usual care, Outcome 4 Low‐density lipoprotein pharmacist vs nurse 6 mths.
Figuras y tablas -
Analysis 1.4

Comparison 1 Non‐medical prescribing group versus usual care, Outcome 4 Low‐density lipoprotein pharmacist vs nurse 6 mths.

Comparison 1 Non‐medical prescribing group versus usual care, Outcome 5 Adherence (continuous).
Figuras y tablas -
Analysis 1.5

Comparison 1 Non‐medical prescribing group versus usual care, Outcome 5 Adherence (continuous).

Comparison 1 Non‐medical prescribing group versus usual care, Outcome 6 Adherence (dichotomous).
Figuras y tablas -
Analysis 1.6

Comparison 1 Non‐medical prescribing group versus usual care, Outcome 6 Adherence (dichotomous).

Comparison 1 Non‐medical prescribing group versus usual care, Outcome 7 Health‐related quality of life.
Figuras y tablas -
Analysis 1.7

Comparison 1 Non‐medical prescribing group versus usual care, Outcome 7 Health‐related quality of life.

Comparison 1 Non‐medical prescribing group versus usual care, Outcome 8 Health facility resource use.
Figuras y tablas -
Analysis 1.8

Comparison 1 Non‐medical prescribing group versus usual care, Outcome 8 Health facility resource use.

Summary of findings for the main comparison. Non‐medical prescribing compared to medical prescribing for acute and chronic disease management in primary and secondary care

Non‐medical prescribing compared to medical prescribing for acute and chronic disease management in primary and secondary care

Patient or population: patients with acute and chronic disease
Settings: secondary care and ambulatory/primary care in low‐, middle‐ and high‐income counties
Intervention: non‐medical prescribing
Comparison: medical prescribing

Outcomes

Illustrative comparative risks* (95% CI)

Relative effect
(95% CI)

No of Participants
(studies)

Certainty of the evidence
(GRADE)

Comments

Assumed risk

Corresponding risk

Medical prescribing

Non‐medical prescribing

Systolic blood pressure (mmHg) at 12 months

The mean systolic blood pressure in the control group ranged from 124 mmHg to 149 mmHg

The mean systolic blood pressure in the intervention group was 5.31 mmHg lower (‐6.46 lower to ‐4.16 lower)

4229
(12 RCTs)

⊕⊕⊕⊝
Moderate
1,2,3

Random‐effects analysis: MD ‐5.91 mmHg lower (95% CI ‐7.71 lower to ‐4.10 lower)

Glycated haemoglobin (HbA1c, %) at 12 months

The mean change in glycated haemoglobin in the control group ranged from ‐0.90% to 9.7%

The mean change in glycated haemoglobin in the intervention group was 0.62% lower (‐0.85 lower to ‐0.38 lower)

775
(6 RCTs)

⊕⊕⊕⊕
High2,3

Random‐effects analysis:

MD ‐0.62 (95% CI ‐0.85 to ‐0.38)

Low‐density lipoprotein (mmol/L) at 12 months

The mean low‐density lipoprotein in the control group ranged from ‐0.26 to 3.41 mmol/L

The mean low‐density lipoprotein in the intervention group was 0.21 mmol/L lower (‐0.29 lower to ‐0.14 lower)

1469
(7 RCTs)

⊕⊕⊕⊝
Moderate1,2,3

Random‐effects analysis: MD ‐0.30 (95% CI ‐0.62 to 0.02)

Adherence (continuous)

6 months follow‐up

The mean adherence (continuous) in the control group was 0.79

The mean adherence in the intervention group was 0.15 higher (0.00 higher to 0.30 higher)

700
(4 RCTs)

⊕⊕⊕⊝
Moderate4,5

Patient satisfaction

Patient satisfaction was reported in 14 studies (Table 4). The majority of surveys were either not referenced or developed locally. Validated questionnaires assessing overall non‐medical practitioner satisfaction with care were reported in six studies rather than patient satisfaction with prescribing. An exception was the study by Bruhn 2013, which found for the prescribing intervention, patients were generally positive about the pharmacist prescribing service, 85% (39/46) were totally satisfied, while 9% (4/44) would have preferred to see their GP

Not estimable

7514

(14 RCTs)

⊕⊕⊕⊝
Moderate8,9

Adverse events

There was little or no difference in adverse events between treatment groups in nine studies. Two studies reported higher rates of adverse events in the usual care group. It was difficult to determine effects in the remaining studies because limited data were reported

Not estimable

18,400

(18 RCTs)

⊕⊕⊝⊝
Low6,7

Health‐related quality of life measured with SF‐12/36

The mean health‐related quality of life in the control group was 0

The mean health‐related quality of life in the intervention group:

physical component was 1.17 higher (0.16 to 2.17)

mental component was 0.58 higher (‐0.40 to 1.55)

4631
(8 RCTs)

⊕⊕⊕⊝

Moderate10

*The basis for the assumed risk (e.g. the median control group risk across studies) is provided in footnotes. The corresponding risk (and its 95% CI) is based on the assumed risk in the comparison group and the relative effect of the intervention (and its 95% CI).
CI: confidence interval; GP: general practitioner; MD: mean difference; RCT: randomised controlled trial.

GRADE Working Group grades of evidence
High‐certainty: Further research is very unlikely to change our confidence in the estimate of effect.
Moderate‐certainty: Further research is likely to have an important impact on our confidence in the estimate of effect and may change the estimate.
Low‐certainty: Further research is very likely to have an important impact on our confidence in the estimate of effect and is likely to change the estimate.
Very low‐certainty: We are very uncertain about the estimate.

1Downgraded one level due to serious inconsistency (considerable heterogeneity was found).
2Multifaceted interventions.
3Variable prescribing autonomy.
4Downgraded one level due to serious risk of bias (high risk of performance bias).
5Variable reporting measures of adherence.
6Downgraded one level due to indirectness (range of adverse events; may not be related to the intervention).
7Downgraded one level due to selective outcome reporting (adverse events not reported in many studies).
8Downgraded one level due to indirectness (prescribing component not adequately assessed across studies).
9Variability in satisfaction measures.
10Downgraded one level due to indirectness (prescribing component effect on quality of life difficult to determine).

Figuras y tablas -
Summary of findings for the main comparison. Non‐medical prescribing compared to medical prescribing for acute and chronic disease management in primary and secondary care
Table 1. Fixed‐effect outcomes versus random‐effects for clinical surrogate markers

Outcome or subgroup

Fixed‐effect estimate

Random‐effects estimate

1.1 Systolic blood pressure (mmHg)

‐5.85 (‐6.76 to ‐4.94)

‐6.59 (‐8.48 to ‐4.71)

1.1.1 6 months

‐6.76 (‐8.24 to ‐5.27)

‐7.34 (‐11.09 to ‐3.60)

1.1.2 12 months

‐5.31 (‐6.46 to ‐4.16)

‐5.91 (‐7.71 to ‐4.10)

1.2 HbA1c (%)

‐0.55 (‐0.74 to ‐0.36)

‐0.55 (‐0.76 to ‐0.35)

1.2.1 HbA1c (6 months)

‐0.42 (‐0.75 to ‐0.09)

‐0.45 (‐0.09 to ‐0.01)

1.2.2 HbA1c (12 months)

‐0.62 (‐0.85 to ‐0.38)

‐0.62 (‐0.85 to ‐0.38)

1.3 LDL (mmol/L)

‐0.23 (‐0.28 to ‐0.17)

‐0.22 (‐0.42 to ‐0.02)

1.3.1 LDL (6 months)

‐0.25 (‐0.34 to ‐0.17)

‐0.13 (‐0.39 to 0.12)

1.3.2 LDL (12 months)

‐0.21 (‐0.29 to ‐0.14)

‐0.3 (‐0.62 to 0.02)

LDL: low‐density lipoprotein

Figuras y tablas -
Table 1. Fixed‐effect outcomes versus random‐effects for clinical surrogate markers
Table 2. Outcomes of studies not included in meta‐analyses

Study

Patient group

Comparison

Outcome

Bruhn 2013

Chronic pain

To compare the effectiveness of pharmacist medication review with or without pharmacist prescribing with standard care

Compared with baseline the Chronic Pain Grade improved in prescribing arm 47.7% (21/44; P = 0.003) and review arm 38.6% (17/44; P = 0.001) but not TAU 31.3% (15/48; ns) SF‐12 mental component score showed no effect for prescribing or review arms and deterioration in TAU arm. Hospital Anxiety and Depression scores improved in prescribing arm for depression (P = 0.022) and anxiety (P = 0.007) and between groups (P = 0.022 and P = 0.045 respectively).

Chenella 1983

Anticoagulation

Pharmacist versus physician independent management of anticoagulant therapy for inpatients

There were no differences between groups for mean heparin and warfarin doses, partial thromboplastin time, days to reach therapeutic levels, mean prescribed and simulated heparin doses.

Choe 2005

Type 2 diabetes

Pharmacist case management versus usual medical care

Patients in the pharmacist case managed group received greater reductions in HbA1c (2.1% vs 0.9%, P = 0.03). Three of five process measures were conducted more frequently in the intervention group than control group. LDL measurement (100% vs 85.7%, P = 0.02), retinal examination (97.3% vs 74.3%, P = 0.004), monofilament foot screening, (92.3% vs 62.9%, P = 0.002).

Einhorn 1978

Family planning

Family planning services provided by nurses versus physicians

Nurses' clients were as equally as successful as physicians in continuing contraceptive use and preventing pregnancy. Nurses were less likely than physicians to provide patients on their first visit with IUDs, prescribe oral contraceptives, or sterilisation. Nurses were more likely to give temporary prescriptions than physicians until the next visit (25% vs 16%, P < 0.001) for reasons including possible pregnancy and patients not menstruating.

Ellis 2000

Dyslipidaemia

Clinical pharmacists providing pharmaceutical care in addition to usual medical care versus usual medical care

The absolute change in total cholesterol (17.7 vs 7.4 mg/dL, P = 0.028) and LDL (23.4 vs 12.8 mg/dL, P = 0.042) was greater in the intervention than control group.

Fairall 2008

HIV

Prescribing of antiretroviral treatment by nurses versus doctors

Cohort 1 ‐ not receiving antiretrovirals. Time to death did not differ (HR 0.94, 95% CI 0.76 to1.15).

Cohort 2 ‐ received antiretrovirals for at least six months. Viral load suppression 12 months after enrolment was equivalent in intervention and control. Risk difference 1.1% (95% CI ‐2.4 to 4.6).

Finley 2003

Depression

Collaborative care model of clinical pharmacists providing drug therapy management and treatment follow‐up versus usual care

Clinical improvements noted in both groups but not significant. Intervention group had higher drug adherence at six months (67% vs 48%; OR 2.17, 95% CI 1.04 to 4.51; P = 0.038)

Fischer 2012

Lipid control in diabetes

Algorithm‐driven telephone care by nurses as an adjunct to usual care versus usual care

The percentage of patients with an LDL < 100 mg/dL increased from 52% to 58.5% in the intervention group and decreased from 55.6% to 46.7% in the control group (P < 0.01). The intervention did not affect glycaemic and BP outcomes

Heisler 2012

Blood pressure control in diabetes

A pharmacist‐led intervention (Adherence and Intensification of Medications) in patients with diabetes and poor BP control versus usual care

The mean systolic BP decrease from 6 months before to 6 months after the 14‐month intervention was not different (8.9 mmHg decline in the intervention arm and 9.0 mmHg decline in the control arm). There was no difference in the mean HbA1c and LDL levels between groups after the end of the intervention period (examining 12 months). At the end of the first quarter after activation, there was a significantly greater drop in systolic BP in the intervention group versus control, 9.7 mmHg vs 7.2 mmHg; MD 2.4 mmHg (95% CI 1.5 to 3.4 P < 0.001).

Houweling 2011

Type 2 diabetes

Primary care nurse management of type two diabetes versus management by GPs

After 14 months between‐group differences for reduction in HbA1c, BP, and lipid profile were not significant. Mean systolic and diastolic BPs were lower in both groups. Most process indicators were significantly better in the nurse care group. More patients were satisfied with their care in the nurse group however the physical component of the SF‐26 was better in the GP group.

Ishani 2011

Cardiovascular risk factors in diabetes

Nurse case management versus usual care to improve hypertension, hyperglycaemia, and hyperlipidaemia in veterans with diabetes

A greater number of patients in the nurse case management had all three measures under control (21.9% vs 10.1%, P < 0.01). A greater number of intervention group participants achieved individual treatment goals. HbA1c < 8% (73.7% vs 65.8% P = 0.04), BP < 130/80 mmHg (45% versus 25.4%, P < 0.01) but not for LDL < 100 mg/dL (57.6% vs 55.4%, P = 0.61).

Jaber 1996

Non‐insulin dependent diabetes

Pharmacists providing pharmaceutical care versus physicians

Improvement was seen in glycated haemoglobin in the intervention group at 4 months (9.2% ± 2.1 vs 12.1% ± 3.7, P = 0.003), and fasting plasma glucose (8.5 ± 2.3 vs 11.0 ± 3.9 mmol/L, P = 0.015). There was little or no change within or between groups for BP, lipid profile, renal function, weight, or quality of life measures.

Klingberg‐Allvin 2015

Women with signs of incomplete abortion

Midwives diagnosing and treating incomplete abortion with misoprostol compared to physicians

452 (95.8%) women in the midwife group and 467 (96.7%) in the physician group had complete abortion. The model risk difference for midwife versus physician group was ‐0.8% (95% CI ‐2.9 to 1.4) falling within the predefined equivalence range (‐4% to 4%).

Kuethe 2011

Children with asthma

Non‐inferiority of care provided by a hospital‐based specialised asthma nurse versus a GP or paediatrician

The corrected daily dose of inhaled corticosteroids as well as the percentage of children prescribed long‐acting beta agonists/inhaled corticosteroids was not significantly different between groups at one and two years.

Logan 1979

Hypertension

Treatment of hypertension in the workplace by nurses versus treatment in the community by the family doctor

Patients in the nurse group were more likely to be put on antihypertensive medications (94.7% vs 62.7%, P < 0.001), to reach goal BP in the first six months (48.5 vs 27.5%, P < 0.001) and to take drugs prescribed (67.6 vs 49.1%, P < 0.005).

Marotti 2011

Postoperative patients

Pharmacist medication history and supplementary prescribing versus pharmacist medication history versus usual care

The marginal mean number of missed doses per patient was 3.21 (95% CI 2.89 to 3.52) in the control group, which was reduced in the pharmacist prescribing group 1.07 (95% CI 0.90 to 1.25, P = 0.002) but not in the pharmacist history group 3.30 (95% CI 2.98 to 3.63). The number of medications charted at an incorrect dose or frequency was reduced in the pharmacist history group. The pharmacist prescribing group had less dose errors than the pharmacist history group (P = 0.004).

Moher 2001

Secondary prevention of coronary heart disease in primary care

Audit group verus GP recall group versus nurse recall group (disease register and patient recall to nurse‐led clinic)

Little or no difference occurred in assessment between the nurse and GP recall group. Mean BP, total cholesterol, cotinine levels varied little between groups as did prescribing of hypotensive and lipid‐lowering agents. Prescribing of antiplatelet drugs was higher in the nurse recall group vs GP recall group, MD 8% (95% CI 1% to 15%, P = 0 .031).

Pagaiya 2005

Primary care nurses

Education and implementation of prescribing and clinical guidelines by nurses in rural health centres versus usual nurse care

Antibiotic prescribing in children 0 to 5 years for respiratory tract infections fell, (42% at baseline to 27% at follow‐up, control 27% to 30%, P = 0.022). Guidelines had no effect on prescribing antibiotics for diarrhoea but oral rehydration prescribing increased. Diazepam prescribing for adults fell, (intervention 17% to 10%, control 21% to 18%, P = 0.029).

Spitzer 1974

Patients attending primary care

Nurse practitioners versus physicians plus conventional nurse in primary care

Similar mortality experience, no differences in physical functioning capacity, social or emotional function. Quality of care similar. In 510 prescriptions, an adequate rating was given to 75% of conventional group and 71% in the nurse practitioner group, probably leading to little difference between groups.

Taveira 2010

Type 2 diabetes

A pharmacist‐led Veterans affairs Multidisciplinary Education and Diabetes Intervention for Cardiac risk reduction (VA‐MEDIC) plus usual care versus usual care

After four months there was a difference (P < 0.05) in the percentage of VA‐MEDIC patients versus controls in attaining target goals for systolic BP < 130 mmHg and HbA1c < 7% but not lipid control or tobacco use.

Thompson 1984

Drug therapy in a geriatric setting

Drug therapy prescribing and patient care management by clinical pharmacists versus usual care

The clinical pharmacist group probably had a lower number of deaths (P = 0.05), a higher number of patients being discharged to lower levels of care (P = 0.03) and a lower average number of drugs per patient (P = 0.04).

Tsuyuki 2016

Patients with cardiovascular risk factors associated with hypertension, diabetes, dyslipidaemia and smoking

Community pharmacist care versus usual care

At 3 months the intervention group patients had greater improvements in LDL cholesterol (‐ 0.2 mmol/L, P < 0.001, systolic BP (‐9.37 mmHg, P < 0.001), glycosylated haemoglobin (‐0.92%, P < 0.001) and smoking cessation (20.2%, P < 0.002).

BP: blood pressure
CI: confidence interval
GP: general practitioner
HbA1c: glycated haemoglobin
HR: hazard ratio
IUD: inter uterine device
LDL: low‐density lipoprotein
MD: mean difference
OR: odds ratio
TAU: treatment as usual

Figuras y tablas -
Table 2. Outcomes of studies not included in meta‐analyses
Table 3. Primary outcome ‐ medication adherence

Study

Medication adherence measure

Outcome

Bruhn 2013

Morisky Medication Adherence
Scale

Assessed adherence at baseline with patients in both groups reporting full adherence.

Cohen 2011

Medication possession ratios

The medication possession ratio (total days' supply of medication divided by total number of expected medication intake days) used in this study found little or no difference between the pharmacist prescribing arm and usual care, even though more medications were prescribed in the pharmacist arm. Adherence was high and ranked above 80%.

Finley 2003

Medication possession ratios

Determined the medication possession ratio from computerised prescription refill records. Full drug adherence was defined as a medication possession ratio value of 0.83 or more during the six‐month follow‐up. Medication possession ratios at three and six months were probably not different between intervention and control arms even though patients in the intervention group were more likely to change antidepressants. An additional measure, the Health Plan Employer Data Information Set guidelines for successful antidepressant treatment, showed there was little or no difference between groups in compliance with the early phase of treatment, but there was a significant difference in compliance in the intervention group continuation phase.

Hunt 2008

Morisky Medication Adherence

Scale

Reported no differences at study end in the proportions of subjects reporting high medication adherence. There was an improvement in adherence with the groups from baseline to study end. Adherence did not predict goal attainment.

Hirsch 2014

Not described

Non‐adherence was identified in five of 33 patients with drug therapy problems at baseline, one of 12 patients at six months and one of four patients at nine months.

Logan 1979

Patient claim and pill counts

High adherence was judged if patients claimed to be taking their medication as instructed and 80% or more of drugs prescribed were consumed as determined by pill counts. In the nurse intervention group patients were more adherent than the control group.

Magid 2013

Medication possession ratios

Little or no difference between groups in the mean medication possession ratio adherence score over the six‐month study.

Margolis 2013

Morisky Medication Adherence

Scale

Reported adherence measured by the Morisky scale modified for blood pressure medications.

Adherence to antihypertensive medications at six months increased in the pharmacist intervention telemonitoring group but decreased in the usual care group. There was probably no difference between groups at 12 and 18 months.

Rudd 2004

Electronic drug event monitor

The drug event monitor provided the average number of days on which patients took the correct number of doses prescribed. While adherence was high in both groups, the nurse‐managed patient group had higher adherence than usual care.

Vivian 2002

Patient self‐reporting and drug refill information from the pharmacy

Non‐adherence was judged as missing more than three doses a week or pharmacy records indicated a failure to refill drugs within two weeks after the scheduled refill date. Little or no difference in adherence between or within the two groups at baseline or the end of the study was found. Over 90% of patients in both groups indicated they took their drugs as directed. The study was underpowered to detect a significant difference in adherence.

Figuras y tablas -
Table 3. Primary outcome ‐ medication adherence
Table 4. Secondary outcomes ‐ patient and provider satisfaction

Study

Satisfaction tool measure

Outcome

Barr Taylor 2003

Not specified

19/57 respondents stated that the nurse care management programme was moderately helpful.

32/57 found it extremely helpful.

9/13 physicians with two or more patients recommended adoption of the nurse management programme.

In other health care settings: 9 physicians felt the programme decreased their time with patients, while 4 thought it increased the time spent.

Bruhn 2013

11 patient satisfaction statements derived from a local prescribing feasibility study

For the prescribing intervention, patients were generally positive about the pharmacist prescribing service ‐ 85% (39/46) were totally satisfied, while 9% (4/44) would have preferred to see their GP. In semi‐structured interviews with GPs and pharmacists, all pharmacists and most GPs were positive about the intervention. Pharmacists found their role satisfying, interesting, and challenging. 17 of 23 GPs were positive about the pharmacists’ role. The cost‐effectiveness of the pharmacists' role, given limited resources, was one issue raised in the GP focus group.

Finley 2003

Not specified

Patients reported greater treatment satisfaction with the collaborative care model than the control group in 6 of 11 measures including the overall treatment for depression, personal nature of the care, listening to concerns, explanations about why antidepressants were prescribed and how to take them, availability for advice, and overall satisfaction with the organisation.

18/37 primary care provider questionnaire respondents were satisfied with workflow, patient welfare. and the pharmacists' abilities.

Houweling 2009

Patient Evaluation of the Quality of Diabetes Care (PEQD)

Patients' evaluations of their satisfaction with diabetes care from the specialist diabetes nurse were significantly more positive than the control group.

Houweling 2011

Patient Evaluation of the Quality of Diabetes Care (PEQD)

The total satisfaction sum score for 14 PEQD measures for practice nurses was 66.4%, compared to 51.7% in the GP group which may be confounded by the amount of time given to each patient. On average GPs spent a total of 28 minutes per patient, whereas practice nurses spent 128 minutes per patient.

Hunt 2008

Satisfation in the SF‐36 healthcare domain

Satisfaction with hypertension care was high in both groups, but with little or no difference in any of the 11 satisfaction measures. Satisfaction was not associated with blood pressure goal attainment.

Hirsch 2014

22‐item Pharmacist Service Questionnaire.

0‐100 scale

Patient satisfaction with the clinical pharmacist were high, with mean scores 92.4 (±10.9) at 6 months (n = 49) and 92.7 (±11) at 9 months (n = 44).

Litaker 2003

Patient Satisfaction Questionaire

Improvements in four areas of satisfaction in the intervention group linked to an increased time spent with patients and an emphasis on patient‐centred education and self‐management (i.e. quality and quantity of contact) from base line to study end. Between‐group comparisons at study end demonstrated little or no significant difference in patient satisfaction measures, including overall care and general satisfaction.

Logan 1979

Not specified

6% of patients were dissatisfied with care provided by nurses but details of the survey instrument were not provided: (assumed 12/206 intervention patients at 6 months but not specified).

McAlister 2014

Not specified

Little or no difference in overall health care satisfaction between pharmacist‐ and nurse‐led care.

Magid 2013

Not specified

Patients at 6 months reporting they were very or completely satisfied with their hypertension care was probably higher in the intervention group than the usual care group.

Margolis 2013

Six items from the Consumer Assessment of Healthcare Providers and Systems adult survey (version 4)

Satisfaction items concerning clinicians listening carefully, explaining things clearly, and respecting what patients said showed larger improvements amongst patients in the telemonitoring intervention group than usual care at 6 months but not at 12 or 18 months.

Spitzer 1974

Not specified

96% of patients in the nurse practitioner group and 97% of patients in the conventional care group were satisfied with the health services received in the experimental period.

Vivian 2002

Not specified

Little or no significant differences in patient satisfaction between groups. More patients in the intervention group felt that the pharmacist spent more time with them than did control patients, although there was little difference. There was no difference in satisfaction with pharmacy services or changes in patient satisfaction in either group from baseline to study end. This study was underpowered to detect a significant difference in patient satisfaction.

GP: general practitioner

Figuras y tablas -
Table 4. Secondary outcomes ‐ patient and provider satisfaction
Table 5. Primary outcome ‐ adverse events

Study

Adverse event

Ansari 2003

There was little or no difference in the proportions of patients between control (provider education), nurse facilitator and provider/patient notification for hospitalisations and emergency room visits. There were few deaths with the higher number (7) in the control group which had more patients on haemodialysis, two of whom died.

Aubert 1998

There appeared little or no difference between intervention and usual care groups for severe low blood glucose events at baseline and during the study period. Mean weight gain differences from insulin treatment in each group or mean weight loss differences with oral agents showed little or no difference.

Chenella 1983

Reported no patients had major bleeding, but four patients in the pharmacist prescriber group had minor bleeding (one laceration before hospital). One patient in physician prescriber group died, after receiving heparin and warfarin for a stroke in evolution but there was no evidence of bleeding.

DeBusk 1994

The first year mortality was 3.4% in usual care and 4.1% in the intervention group. However, a longer study is required to show a difference, namely, 2 years plus a 5‐ to 10‐year follow‐up.

Fairall 2008

The time to death did not differ between primary care nurses and doctors initiating therapy.

Hirsch 2014

Pharmacists identified two adverse drug reactions from 33 drug therapy problems at baseline, two from 12 at six months and none at nine months.

Ishani 2011

Adverse events were similar between groups, with no participants withdrawing from the study due to an adverse event, and there was no difference in the rate of hospitalisation or death between the groups.

Jaber 1996

Reported 17 hypoglycaemic reactions in the intervention group and two in the control group. All were considered mild to moderate. The difference was possibly related to increased training in recognition, documentation, and questioning in the intervention group. Three patients were hospitalised, two in the control and one in the intervention group, and these appear unrelated to treatment.

Klingberg‐Allvin 2015

In treating incomplete abortion bleeding, the same or less than normal menstrual cycle was probably not different between the intervention midwife and usual care physician groups. There was little difference in pain after treatment as assessed by a visual analogue scale. 30 (6%) of women reported unscheduled visits in the midwife group and 18 (4%) in the physician group. Reasons included vaginal bleeding and abdominal pain. Reported side‐effects after treatment were similar in both groups (nausea, vomiting, abdominal pain, chills, and fever).

Kuethe 2011

There were no differences between groups (general practitioner, paediatrician, asthma nurse) with respect to the number of severe asthma exacerbations as expressed by the number of prednisolone courses.

MacMahon Tone 2009

Forty drug‐related adverse events occurred in the intensive intervention group as compared to 10 in the standard group. While the adverse events are known for the drugs in question no further comment was offered.

McAlister 2014

Reported few clinical events at six months in a pharmacist‐led intervention for secondary prevention after ischaemic stroke. There were nine cardiovascular events and no deaths in the pharmacist group versus eight cardiovascular events and one death in the nurse‐led group.

Margolis 2013

There were 60 adverse events in usual care and 49 in the telemonitoring group; most events were non‐cardiac hospitalisations. There were two allergic reactions to blood pressure medication in the usual care group, six events in the telemonitoring group related to hypotension, dizziness, loss of consciousness which compared to one in the usual care group, four events in usual care related to hypertension versus one in the intervention group.

New 2003

In patients randomised to specialist nurse‐led clinics for blood pressure control, lipid control or both, there were less deaths in the intervention group (25, (3.2%) versus 36 (5.7%) in the usual care group) odds ratio 0.55 (95% confidence interval 0.32 to 0.92) P = 0.02.

Spitzer 1974

During the 12‐month experimental period, there were four deaths in the nurse practitioner group and 18 in the conventional care group. There was probably little or no difference in the crude death rate between groups.

Taveira 2011

There were no diabetes‐related admissions or deaths for either group during the six‐month study.

Thompson 1984

The pharmacist prescribing group in a geriatric setting may have had a slightly lower 12‐month mortality than usual care (3/67 versus 10/72, P = 0.05).

Tobe 2006

The incidence of adverse events probably did not differ between the intervention (home care nurse group) and control (primary care physician group) in First Nations people with diabetes and hypertension. Ten patients in the intervention group and seven in the control group required admission to hospital for adverse events.

Figuras y tablas -
Table 5. Primary outcome ‐ adverse events
Table 6. Secondary outcome ‐ quality of life

Study

Measures

Outcome

Aubert 1998

Four generic quality of life measures from the

Behavioural Risk Factor Surveillance System

Intervention and control groups reported improved perception of health status after 12 months, but intervention patients were twice as likely to report this.

Barr Taylor 2003

SF‐36, the Duke Activity Status Index for QoL, and the BDI for depression

Little or no differences for any of the variables, but an improved mood for both groups was found.

Bruhn 2013

SF‐12, HUI, CPG, and HADS‐D

No one measure was seen as the primary outcome. In the prescribing arm there was a within‐arm improvement for CPG intensity and disability effect size subscales and between arms on the intensity subscale but not the disability subscale. There was a within‐arm improvement in overall CPG in the prescribing and review arms but not the TAU arm. The SF‐12 and HADS‐D showed deterioration in the TAU arm. Compared with baseline, patients had an improved CPG in the prescribing and review arms but not the TAU arm. The SF‐12 physical score difference showed no effect in prescribing or review arms but improvement in the TAU arm. SF‐12 mental score showed no effect in prescribing or review arms and deterioration in the TAU arm. HADS‐D scores within the prescribing arm showed improvement for depression and anxiety which were also significant between groups.

Cohen 2011

SF‐36 for Veterans

Little or no change in quality of life scores over 6 months.

Finley 2003

The Brief Inventory for depressive symptoms and Work and Social Disability Scale

Liitle or no difference at 6 months between intervention and control groups.

Houweling 2009

SF‐36 and the revised version of the Type 2 Diabetes Symptom Checklist to measure the presence and perceived burden of diabetes‐related symptoms

Little or no differences over 12 months between groups in either survey.

Houweling 2011

SF‐36 and the revised version of the Type 2 Diabetes Symptom Checklist to measure the presence and perceived burden of diabetes‐related symptoms

In the control group there were little or no differences between baseline and follow‐up SF‐36 measures, however in the practice nurse intervention group there were differences in physical functioning, role physical, vitality, and the physical component score. Little or no differences were seen in the QoL results over time between the two groups except for the physical component score which was lower in the intervention group. After 14 months responses to the revised Type 2 Diabetes Symptom Checklist revealed little or no differences between groups.

Hunt 2008

SF‐36

Little or no difference except in the general health domain with scores higher in the control group.

Jaber 1996

Health Status Questionnaire version 2 derived from the SF‐36

Little or no difference between or within groups.

Khunti 2007

SF‐36, Seattle Angina Questionnaire and LVD‐36 questionnaire

Differences favouring the intervention group were found in the SF‐36 for physical functioning, general health, vitality, social functioning, and mental health. Seattle Angina Questionnaire scores in patients with angina were significantly better for intervention patients compared to controls for exertional capacity and borderline differences were found for angina frequency and QoL. There was little or no difference in any of the SF‐36 health status domains or LVD‐36 scores for patients with a confirmed diagnosis of left ventricular diastolic dysfunction.

Litaker 2003

SF‐12

Diabetes Quality of Life

Little or no difference between groups in either measure at study end.

McAlister 2014

Self‐related health using a Likert scale

The EQ‐5D as an index of health

Little or no difference between the pharmacist‐ and nurse‐led groups in participants overall self‐related health.

Margolis 2013

SF‐12

Little or no differences between groups.

Moher 2001

Dartmouth COOP charts EuroQol scores

Little or no or clinically important differences between groups for any dimension.

Spitzer 1974

Not described

Patients in the nurse practitioner and usual care groups had similar values at baseline and study end for physical, emotional, and social function.

Taveira 2011

Change from baseline in depression symptoms by the PHQ‐9

Even though no pharmacologic treatments for depression symptoms were offered as part of the intervention, the mean change in PHQ‐9 scores was probably not different for intervention and standard care participants.

Vivian 2002

SF‐36

Little or no significant differences either between or within the two groups from baseline to study end, although patients in the control group reported more bodily pain .

BDI: Beck Depression Index
CPG: Chronic Pain Grade
EQ‐5D: EuroQol five dimensions questionnaire
HADS‐D: Hospital Anxiety and Depression Scale
HUI: Health Utilities Index
LVD‐36: Left Ventricular Dysfunction
PHQ‐9: Patient Health Questionnaire‐9
QoL: quality of life
SF‐12: Short‐Form‐12
SF‐36: Short‐Form‐36
TAU: treatment as usual

Figuras y tablas -
Table 6. Secondary outcome ‐ quality of life
Table 7. Secondary outcome ‐ resource use

Medication and related therapy

Study

Outcome

Ansari 2003

β‐blocker use was higher in the nurse facilitator group with two‐thirds of patients either initiated or up‐titrated on β‐blockers versus fewer than one‐third of patients in the other two study arms (control provider education and provider/patient notification).

Chenella 1983

Little or no difference in amount of anticoagulant drugs prescribed by pharmacists compared to a physician.
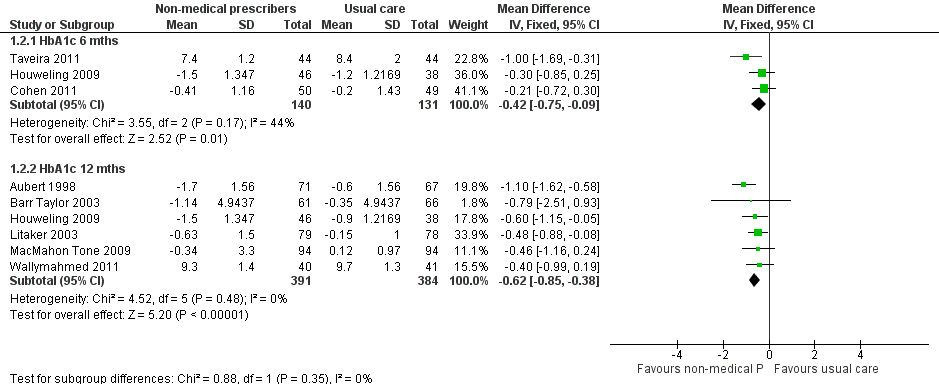
Cohen 2011

More patients in the pharmacist prescribing arm were prescribed diuretics and sulphonylureas compared to usual care. Overall there was an increase in the number of medications prescribed by pharmacists for hypertension, diabetes, and cholesterol from baseline to six months, but little or no change in the usual care arm.

Denver 2003

In nurse‐led clinic for hypertension management in diabetics at six months there were increased changes in the proportions of patients receiving new prescriptions for calcium channel blockers and thiazide diuretics as intensification therapy. The median number of drugs per patient increased in the intervention group compared to conventional primary care.

Einhorn 1978

In a family medicine clinic in Bogota, nurses were less likely than physicians to provide intrauterine devices, prescribe oral contraceptives, and sterilisation on the patient's first visit. Nurses were more likely than physicians to provide temporary prescriptions and defer intrauterine devices and contraceptive measures if the patient on their first visit was not menstruating or believed to be pregnant.

Heisler 2012

Observational cohort results taken six months following the quarter start date showed intervention patients had more blood pressure medication changes.

Hirsch 2014

Pharmacists identified at least one hypertension drug therapy problem in 33/73 (45.2%) patients at baseline requiring additional therapy in 14/33 (42.4%) and dosage increases in 11/33 (33.3%).
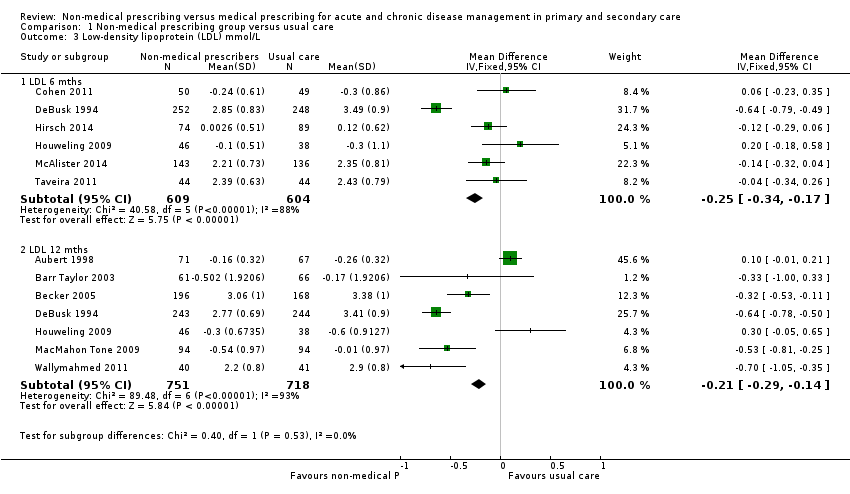
Houweling 2009

The nurse specialist in diabetes prescribed significantly more antihypertensive agents and the internist (doctor control) prescribed more cholesterol‐lowering agents.

Hunt 2008

The mean number of antihypertensive medications per patient and use of generic antihypertensive agents was higher in the intervention group.

Logan 1979

Patients in the nurse‐managed group were more likely to be put on antihypertensive medications, prescribed more than two pills per day, and to be on more than one antihypertensive medication.

MacMahon Tone 2009

There were more intervention intensive group patients on three or more antihypertensive drugs (at the study beginning more patients in the standard care group were on three or more antihypertensive agents). At the end of the study more patients with dyslipidaemia in the intensive group were receiving statin therapy. More patients in the intervention group were on aspirin antiplatelet therapy at the end of the study.

McAlister 2014

The median number of antihypertensive medications taken at six months was probably not different in the pharmacist‐ and nurse‐led groups. There was a difference favouring pharmacists in maximal dosing of angiotensin‐converting enzyme inhibitors or angiotensin receptor blockers at six months, but not the percentage of patients using these drugs.

Magid 2013

In patients completing the six‐month visit, there were more intervention patients that had an antihypertensive medication added to their regimen and a dose increased for existing medication, than usual care patients. There was an increase in the usage of specific antihypertensive drugs.

Margolis 2013

There were increases in the mean number of antihypertensive medication classes at 6, 12, and 18 months in the intervention group compared to baseline and compared to usual care.

Moher 2001

There was minimal change in prescribing antihypertensive drugs in the three groups. All groups increased prescribing of lipid‐lowering drugs but there was little or no difference between groups. There was an increase of 10% more patients’ prescribed antiplatelet treatment in the nurse recall group versus the audit group and 8% more in the nurse recall group versus the general practitioner recall group.

Pagaiya 2005

In examining the effects of training and guidelines on prescribing by nurses, the mean change in antibiotic prescribing for all patients showed little or no difference. The mean change for antibiotic prescribing for respiratory infections in children (0 to 5 years) fell. No change was detected in prescribing antibiotics for diarrhoea. There was a mean fall in diazepam prescribing in the intervention group.

Rudd 2004

In the nurse management patient group at six months there was an increased number and variety of antihypertensive medications and an increased number of medication changes than in the usual care group.

Taveira 2010

The intervention arm group (VA‐MEDIC) had greater dose titrations of antihypertensive medications, insulin, statins, and niacin compared to the usual care arm.

Taveira 2011

Intervention arm participants (VA‐MEDIC‐D) had more dose increases or initiation of any antihypertensive agents and more dose increases or initiation of antihyperglycaemic agents. There was little or no difference in the initiation or dose titration of any antihyperlipidaemic agent or antidepressants.

Thompson 1984

The average number of drugs prescribed per patient was lower in the pharmacist group compared to the physician group. The number of drugs was reduced by an average of 2.2 drugs per patient from the pre‐study to the study year. The practice of clinical pharmacists prescribing drug therapy under physician supervision has the potential to save the healthcare system USD 70,000 per 100 skilled nursing facility beds.

Tsuyuki 2015

In the pharmacist prescribing arm proportionally more new antihypertensive agents were initiated, more dose changes occurred, more antihypertensives were discontinued, and more patients were prescribed low‐dose aspirin and a statin than in the usual care group.

Vivian 2002

There was little or no difference in the type of antihypertensives prescribed to intervention and control patients during the study.

Wallymahmed 2011

Compared with baseline there were more patients in both groups taking antihypertensive medications but this difference was probably only important in the nurse‐led intervention group.

Healthcare visits, health resources, and associated costs

Ansari 2003

There was no difference in hospitalisations and emergency room visits between the three groups of control (provider education), nurse facilitator, and provider/patient notification.

Aubert 1998

Hospital admissions were rare and did not differ between the intervention and usual care groups. ED visits did not differ between groups or from baseline. No hospital or ED visits were related to diabetes. The average number of outpatient visits during the study was similar. The nurse managed a case load of 71 patients, but it was estimated that a 300 patient case load could be managed.

Barr Taylor 2003

There was no change in health utilisation (physician visits, ED visits, days of hospitalisation) for the year before and after the intervention and between groups.

Choe 2005

In reporting process measures for the clinical pharmacist’s case management of patients there was a difference between pharmacist intervention and control in the frequency of low‐density lipoprotein measurements, retinal examinations, and monofilament foot examinations but not glycated haemoglobin measurement or urine albumin screen.

Cohen 2011

Over six months there were a higher number of primary care visits in the usual care arm; an average 1.65 visits per patient versus 1.56 in the intervention arm. It was suggested the difference in the higher number of primary care visits may offset the intervention cost.

DeBusk 1994

The nursing time spent in the year after myocardial infarction was nine hours per patient; a per patient cost of USD 500 which included the nurse salary, office costs, and other associated costs. This compared with cardiac rehabilitation programmes in the San Francisco Bay area costing USD 1800 to USD 2700 to participate for three months.

Ellis 2000

In investigating the impact of clinical pharmacist interventions in patients with dyslipidaemia there was little or no difference in physician or nurse visits between control and the intervention patients at 12 months. At 12 months the intervention group had more pharmacist visits than the control group. There were little or no difference in costs for hospitalisations, clinic visits, laboratory costs, drug costs, and costs of lipid therapy between groups. The intervention group had a USD 370 greater difference per patient in total costs which was probably not important and approximately 5% of total costs.

Fairall 2008

In the cohort of patients not yet receiving antiretroviral therapy there was little or no difference in clinic visits with a nurse but clinic visits with a doctor were probably higher in the intervention group.

In the cohort of patients who had already received at least six months of antiretroviral therapy clinic visits with a nurse probably higher in the intervention group. Economic data from the study is the subject of further analysis by Barton 2013 (see Studies awaiting classification).

Finley 2003

Although the collaborative care model experienced a decrease in the total number of primary care visits, the between‐group difference was probably not important. ED visits increased more in the usual care group but this was probably not important and neither was the difference in utilisation of psychiatric services. The institutional cost of drugs, the cost of antidepressants and the cost of psychotropic drugs overall was higher in the intervention group, but this was not important.

Fischer 2012

Hospital admissions (while trending to fewer admissions) in the nurse intervention group showed little or no difference to the control group. Nurse case management was not associated with a significant difference in the number of outpatient or ED visits. There was a decrease in total costs in the nurse telephone intervention group comparing the period before and after randomisation. In contrast, there was an increase for the same comparison in the control group. Similar results were seen with hospitalisation and ED costs which were lower in the intervention group. There was probably not an intervention effect on outpatient costs. The difference in average per patient cost between the intervention group (USD 6600) and control group (USD 9033) of USD 2433 was important. The control group had higher baseline hospitalisation rates and total costs cautioning interpretation of the result.

Heisler 2012

Little or no difference in health services utilisation (hospitalisations, primary care visits, ED visits) between intervention and control patients during the 14‐month study of blood pressure control through a clinical pharmacist outreach programme in diabetic patients.

Hirsch 2014

The pharmacist collaborative group (PharmD‐PCP MTM) had fewer primary care physician visits during the intervention period than did the usual care group. The mean total combined visits of primary care physician and pharmacist was not greater in the PharmD‐PCP MTM group than in usual care.

Houweling 2009

There was a lower number of visits in the NSD group compared with standard care but not in the duration of visits. Significantly more patients were referred back to their GP by the NSD when meeting treatment goals. Personnel and laboratory costs were lower in the intervention group than the control group. The average per month increase in medication costs between the groups was probably not important apart from the cholesterol‐lowering medications. The average time saving per internist was 61.4 minutes (meaning the internist could supervise 11 patients with the NSD in the time he/she could treat one patient).

Houweling 2011

The mean number of visits and duration of visits was higher in the practice nurse intervention group than the control group.

Hunt 2008

The total number of clinic visits (physician plus pharmacist) was higher in the intervention arm compared to the control arm. The number of physician visits was lower in the intervention arm.

Ishani 2011

Little or no difference in the hospitalisation rate between intervention and control groups.

Kuethe 2011

In testing the non‐inferiority of asthma care in children with stable asthma provided by a hospital‐based specialised asthma nurse versus a GP or paediatrician, there was little or no differences between the groups for medication, school absence or parental work absence after two years. There was little or no difference in unplanned visits and no hospital admissions during the study.

Litaker 2003

Medium number of outpatient visits were higher for the team based intervention patients. Average personnel costs for one year's treatment were significantly higher in the intervention group (USD 134.68 vs USD 93.70, P < 0.001).

Magid 2013

There was little or no difference in the mean number of outpatient clinic visits, total number of ED visits, and hospitalisations between the two groups. The intervention group probably had a higher number of email and telephone encounters.

Margolis 2013

Over 12 months in the telemonitoring intervention group all 228 patients used a mean of 11.4 ± 3.9 pharmacist visits lasting a mean of 34.2 minutes and 217 used telemonitoring services with a mean of 9.8 ± 2.5 months of use. It was estimated direct programme costs would total USD 1350 per patient.

Spitzer 1974

A reported five per cent drop in gross practice revenue was explained by the absence of billing for services provided by the nurse practitioner. Billing for unsupervised practice was not permitted in Ontario at the time of the study. During the trial year the services rendered by the nurse practitioner were worth approximately USD 16,000 of which almost 50% was for unsupervised practice.

Taveira 2011

There was little or no differences in primary carer visits, use of ED services for all cause visits, diabetes‐related ED visits or hospital admission rates.

Thompson 1984

There was little or no difference in the average length of stay or hospitalisations although the latter trended lower in the pharmacist group. Differences favouring the pharmacist group were found in the rate of discharge to home or to a lower level of care.

Vivian 2002

Little or no differences between intervention and control groups in appointments with the primary care provider during the 6 months of the study.

ED: emergency department
GP: general practitioner
NSD: nurse specialised in diabetes

Figuras y tablas -
Table 7. Secondary outcome ‐ resource use
Comparison 1. Non‐medical prescribing group versus usual care

Outcome or subgroup title

No. of studies

No. of participants

Statistical method

Effect size

1 Systolic blood pressure mmHg Show forest plot

21

Mean Difference (IV, Fixed, 95% CI)

Subtotals only

1.1 6 months

11

2076

Mean Difference (IV, Fixed, 95% CI)

‐6.76 [‐8.24, ‐5.27]

1.2 12 months

12

4229

Mean Difference (IV, Fixed, 95% CI)

‐5.31 [‐6.46, ‐4.16]

1.3 6 months systolic blood pressure removing cluster effect (Margolis)

10

1628

Mean Difference (IV, Fixed, 95% CI)

‐6.13 [‐7.83, ‐4.44]

1.4 12 months systolic blood pressure excluding cluster trials (Khunti and Margolis)

10

2627

Mean Difference (IV, Fixed, 95% CI)

‐4.84 [‐6.29, ‐3.39]

1.5 Systolic blood pressure at 6 months (more NMP prescribing autonomy)

4

695

Mean Difference (IV, Fixed, 95% CI)

‐2.98 [‐5.36, ‐0.59]

2 HbA1c (%) Show forest plot

8

Mean Difference (IV, Fixed, 95% CI)

Subtotals only

2.1 HbA1c 6 mths

3

271

Mean Difference (IV, Fixed, 95% CI)

‐0.42 [‐0.75, ‐0.09]

2.2 HbA1c 12 mths

6

775

Mean Difference (IV, Fixed, 95% CI)

‐0.62 [‐0.85, ‐0.38]

3 Low‐density lipoprotein (LDL) mmol/L Show forest plot

11

Mean Difference (IV, Fixed, 95% CI)

Subtotals only

3.1 LDL 6 mths

6

1213

Mean Difference (IV, Fixed, 95% CI)

‐0.25 [‐0.34, ‐0.17]

3.2 LDL 12 mths

7

1469

Mean Difference (IV, Fixed, 95% CI)

‐0.21 [‐0.29, ‐0.14]

4 Low‐density lipoprotein pharmacist vs nurse 6 mths Show forest plot

6

1213

Mean Difference (IV, Fixed, 95% CI)

‐0.25 [‐0.34, ‐0.17]

4.1 Pharmacist

4

629

Mean Difference (IV, Fixed, 95% CI)

‐0.09 [‐0.20, 0.02]

4.2 Nurse

2

584

Mean Difference (IV, Fixed, 95% CI)

‐0.52 [‐0.67, ‐0.38]

5 Adherence (continuous) Show forest plot

4

700

Std. Mean Difference (IV, Fixed, 95% CI)

0.15 [0.00, 0.30]

6 Adherence (dichotomous) Show forest plot

4

935

Risk Difference (M‐H, Fixed, 95% CI)

0.06 [‐0.00, 0.12]

7 Health‐related quality of life Show forest plot

8

Mean Difference (IV, Fixed, 95% CI)

Subtotals only

7.1 Physical component (SF12 or 36)

8

2385

Mean Difference (IV, Fixed, 95% CI)

1.17 [0.16, 2.17]

7.2 Mental component (SF‐12 or 36)

6

2246

Mean Difference (IV, Fixed, 95% CI)

0.58 [‐0.40, 1.55]

8 Health facility resource use Show forest plot

5

Risk Difference (M‐H, Fixed, 95% CI)

Subtotals only

8.1 Emergency Department visits

3

4626

Risk Difference (M‐H, Fixed, 95% CI)

0.01 [‐0.02, 0.03]

8.2 Hospitalisations

5

4870

Risk Difference (M‐H, Fixed, 95% CI)

‐0.01 [‐0.03, 0.01]

Figuras y tablas -
Comparison 1. Non‐medical prescribing group versus usual care