Przepisywanie leków przez lekarzy, w porównaniu z przepisywaniem leków przez innych pracowników ochrony zdrowia, w procesie leczenia ostrych i przewlekłych chorób w warunkach podstawowej i specjalistycznej opieki zdrowotnej
Referencias
References to studies included in this review
References to studies excluded from this review
References to studies awaiting assessment
References to ongoing studies
Additional references
References to other published versions of this review
Characteristics of studies
Characteristics of included studies [ordered by study ID]
| Methods | Randomised controlled trial | |
| Participants | San Francisco Veterans Affairs Medical Center, San Francisco, USA Patients receiving primary care for CHF who met the Framingham criteria for CHF and had a left ventricular ejection fraction ≤ 45% or moderate or severe left ventricular systolic dysfunction on their latest evaluation and no contraindications to β‐blockers 74 health professionals randomised to one of three groups Group 1 Health professionals provided education on initiation and up‐titration of β‐blockers Group 2 Nurse facilitator group Group 3 Provider and patient notification on β‐blocker therapy Patients 169 randomised (51 control, 54 nurse facilitator, 64 provider/patient notification) Health professional delivering intervention ‐ study nurse practitioner who with other providers received substantial education on the use of β‐blockers in heart failure | |
| Interventions | PATIENTS The nurse practitioner assumed responsibility for initiating, titrating, and stabilising appropriate CHF patients on β‐blockers to target or maximum tolerated dose | |
| Outcomes | PATIENTS Proportion of patients who were initiated or up‐titrated and maintained on β‐blockers Proportion of patients reaching target doses of β‐blockers Adverse events ‐ hospitalisations, emergency room visits, deaths RESOURCE USE Hospitalisations, emergency room visits Drug use | |
| Notes | Median follow‐up 12 months. | |
| Risk of bias | ||
| Bias | Authors' judgement | Support for judgement |
| Random sequence generation (selection bias) | Low risk | "A stratified randomisation using computer‐generated, random numbers." |
| Allocation concealment (selection bias) | Unclear risk | Allocation concealment was not reported. |
| Blinding of participants and personnel (performance bias) | High risk | All patients and health professionals were aware of the group allocation. |
| Blinding of outcome assessment (detection bias) | Low risk | "An independent research assistant assessed the use of beta‐blocker therapy." |
| Incomplete outcome data (attrition bias) | Unclear risk | Incomplete outcome data were not reported. Intention‐to‐treat. |
| Selective reporting (reporting bias) | Unclear risk | Specific adverse drug‐related events were not reported. |
| Other bias | Unclear risk | Degree of supervision of two cardiologists, although nurse practitioner assumed responsibility for β‐blocker therapy. |
| Methods | Randomised controlled trial | |
| Participants | Two primary care clinics within the Jacksonville Health Care Group, Jacksonville, Florida, USA Patients with diabetes mellitus (type 1 or 2) Patients 138, (71 in nurse case management, 67 usual care) Health professional delivering intervention ‐ registered nurse with 14 years of clinical experience and certified diabetes educator trained to follow a set of detailed management algorithms under direction of a family care physician and an endocrinologist who were responsible for diabetes management decisions No unit of analysis errors | |
| Interventions | PATIENTS To compare diabetes control in patients receiving nurse case management versus usual care Nurse‐led management at baseline, 2 weeks and quarterly, telephone calls weekly (insulin) or 2‐weekly (oral agents, diet/exercise) Patients referred to 5 week,12‐hour multidisciplinary diabetes education programme PROVIDER Twice‐weekly meeting with physicians to review patient progress, medication adjustments, and other issues Medication adjustments or changes were communicated to the patients' primary care physician | |
| Outcomes | PATIENTS Change in HbA1c at 12 months Fasting glucose Fasting lipids Serum creatinine Weight Health‐related quality of life (Behavioural Risk Factor Surveillance System, BRFSS) Adverse events RESOURCE USE Hospital admissions Emergency department visits Outpatient visits | |
| Notes | 12‐month study. A complex intervention, not just prescribing and not just nurses involved e.g. dieticians. | |
| Risk of bias | ||
| Bias | Authors' judgement | Support for judgement |
| Random sequence generation (selection bias) | Low risk | Patients randomly assigned in blocks based on a 1:1 allocation ratio and a block size of three. |
| Allocation concealment (selection bias) | Unclear risk | No details provided. |
| Blinding of participants and personnel (performance bias) | High risk | Not feasible with study design. |
| Blinding of outcome assessment (detection bias) | Low risk | Laboratory measures. Unclear if the quality of life questionnaire was influenced by the group to which the patients were randomised. |
| Incomplete outcome data (attrition bias) | High risk | Total attrition 38/138 (27.5%) at 12 months, exact numbers in each group not stated but stated 'patients lost to follow‐up did not significantly differ by treatment group.' Two intention‐to‐treat analyses. |
| Selective reporting (reporting bias) | Low risk | All outcomes reported. |
| Other bias | Unclear risk | Influence of collaborative meetings with physicians on outcomes unclear. Increased loss to follow‐up of younger patients in the intervention group. |
| Methods | Randomised controlled trial | |
| Participants | Kaiser Permanente Medical Center Santa Clara California, USA Patients with long‐standing diabetes, one or more major comorbid conditions, HbA1c > 10% Patients 169, (intervention 84, usual medical care 85) Health professional delivering intervention ‐ nurse care managers who had extensive experience in managing lipids and hypertension and attended several days training on local protocols for diabetes and cholesterol. They also attended diabetes group classes and shadowed diabetes case managers and physicians treating diabetes No unit of analysis errors | |
| Interventions | PATIENTS The nurse reviewed the patients' medical, lifestyle, and psychosocial status, performed a foot examination, recorded BP, pulse and developed a self‐management plan for the patient. Patients attended group classes (1‐2 hrs) once a week for 4 weeks. Telephone follow‐up calls reviewed patient goals, medication use, symptoms, glucose monitoring, BP monitoring, and self‐management. Calls were made before the fourth group session and at 5, 8, 12, 16, 20, 28, 36, 44 weeks. The nurses used treatment algorithms to titrate the patients medications for diabetes, cholesterol and hypertension. The primary care physician was called if new medication was indicated or to report any unusual findings. | |
| Outcomes | PATIENTS HbA1c Lipids (total cholesterol, LDL, HDL, triglycerides) Fasting glucose BP (systolic BP, diastolic BP) Microalbuminuria BMI Psychosocial (Duke Activity Status Index and the SF‐36 health survey) Depression (Beck Depression Index) Satisfaction RESOURCE USE Number of physician visits PROCESS Percentage with foot exam, dilated eye exam, flu shot, pneumovax PROVIDER Satisfaction | |
| Notes | 12‐month study Does not permit an analysis of the specific need for various intervention components. | |
| Risk of bias | ||
| Bias | Authors' judgement | Support for judgement |
| Random sequence generation (selection bias) | Unclear risk | Patients were randomised, method of random sequence generation not described. |
| Allocation concealment (selection bias) | Unclear risk | Method of concealment not described. |
| Blinding of participants and personnel (performance bias) | High risk | Not feasible with study design. |
| Blinding of outcome assessment (detection bias) | Low risk | Laboratory values low risk. Unclear if questionnaire completion can be biased by the group allocation. |
| Incomplete outcome data (attrition bias) | Unclear risk | Attrition ‐ 14/85 (16.5%) usual care,17/84 (20%) nurse‐managed. Analysis on patients completing the study. |
| Selective reporting (reporting bias) | Low risk | Predefined outcomes reported (apart from urinalysis). |
| Other bias | Unclear risk | Patient and physician satisfaction surveys not validated surveys. |
| Methods | Cluster‐randomised controlled trial | |
| Participants | Ten Baltimore Hospitals, USA Black 30‐59 year‐old siblings with no known CHD, (systolic BP ≥ 140 or diastolic BP ≥ 90 mmHg, cholesterol ≥ 3.37 mmol/L or current smoking) of a proband with CHD aged < 60 years Patients 364, (community‐based care 196, "enhanced" primary care 168) Health professional delivering intervention ‐ nurse practitioner and community health worker | |
| Interventions | PATIENTS Community‐based care versus "enhanced" primary care (control) to reduce CHD risk Patients randomised to community‐based care received care from a nurse practitioner in a non‐clinical site with an exercise room. BP, pharmacotherapy and compliance were assessed. A community health worker provided dietary counselling, smoking cessation and exercise counselling. Progress was reviewed by the study physician twice monthly. Changes in pharmacotherapy were communicated to the primary care physician who treated conditions outside the risk factors and were asked not to change risk factor medication. Decisions on how to apply the guidelines were within the full purview of the nurse practitioner. Prescriptions for risk factor therapy were provided free at any pharmacy. Telephone monitoring was available. The enhanced primary care group received the same risk specific materials and free risk factor pharmacotherapy. | |
| Outcomes | PATIENTS changes in LDL Systolic BP and diastolic BP 10‐year Framingham risk scores for CHD Lifestyle (dietary fats, sweets, smoking) | |
| Notes | 12‐month study. Randomised at family level. | |
| Risk of bias | ||
| Bias | Authors' judgement | Support for judgement |
| Random sequence generation (selection bias) | Low risk | Computer‐generated randomisation schema. |
| Allocation concealment (selection bias) | Unclear risk | Not specified. |
| Blinding of participants and personnel (performance bias) | High risk | Not feasible with the study design. |
| Blinding of outcome assessment (detection bias) | Low risk | Laboratory values low. BP by nurse practitioner (not blinded). |
| Incomplete outcome data (attrition bias) | High risk | Intention‐to‐treat, Attrition 27% community‐based care, 26% enhanced primary care 12 months. |
| Selective reporting (reporting bias) | Low risk | None evident. |
| Other bias | Unclear risk | Application of guidelines rested with nurse practitioner but multifactorial intervention with effect of prescribing on outcomes unclear. |
| Methods | Randomised controlled trial (exploratory) | |
| Participants | Six general practices with prescribing pharmacists in Grampian (3) and East Anglia (3), UK Patients over 18 years with chronic pain, living in their own houses and who had received two or more acute prescriptions and/or one repeat prescription in the last 120 days for an analgesic and or an non‐steroidal anti‐inflammatory drug Patients 196, (70 pharmacist medication review with face‐to‐face prescribing, 63 pharmacist medication review and feedback to GP, 63 treatment as usual) Health professional delivering intervention ‐ prescribing and review arms were supplementary or independent prescribing pharmacists who also undertook a 2‐day course updating them on pain management No unit of analysis errors | |
| Interventions | PATIENTS To compare the effectiveness of pharmacist medication review with or without pharmacist prescribing with standard care for patients with chronic pain Prescribing arm ‐ medication and pain diary review, pharmaceutical care plan agreed, prescribing of medications Review arm ‐ medication review focused on pain‐related prescription medications and pharmaceutical care plan detailing recommended medication changes for the GP Treatment as usual ‐ standard general practice care | |
| Outcomes | PATIENTS SF‐12 v2 general health and functioning scale Health Utilities Index, (HUI3) health status and health‐related quality of life Clinical Practice Guidelines pain severity scale Health Anxiety and Depression Scale (HADS) Patient satisfaction PROVIDERS Semi‐structured interviews with staff | |
| Notes | Exploratory 6‐month trial and no power calculation done. | |
| Risk of bias | ||
| Bias | Authors' judgement | Support for judgement |
| Random sequence generation (selection bias) | Low risk | Telephone randomisation service with a random number allocation which ensured allocation concealment. The allocation was 1:1:1. |
| Allocation concealment (selection bias) | Low risk | Telephone randomisation service with a random number allocation which ensured allocation concealment. |
| Blinding of participants and personnel (performance bias) | High risk | No blinding of participants due to the nature of the intervention. |
| Blinding of outcome assessment (detection bias) | Unclear risk | Unclear if questionnaire completion by patients can be biased according to the group to which they were randomised. Outcome measures self‐reported. |
| Incomplete outcome data (attrition bias) | High risk | 3 months attrition. Prescribing group 24.3% (17/70), review 15.9% (10/63), treatment as usual 12.7% (8/63). 6 months attrition 28.6% (20/70), 23.8%(15/63), 14.3% (9/63), respectively. |
| Selective reporting (reporting bias) | Low risk | Predefined outcome measures reported. |
| Other bias | Unclear risk | Recruitment rate 14% (196/1397) and only 25% of eligible patients entered the trial. Unclear if patient satisfaction questionnaire validated. HADS is a screening tool, but used to classify people by severity of depression and anxiety. |
| Methods | Randomised controlled trial | |
| Participants | A general hospital inpatient unit, Los Angeles County‐University of Southern California Medical Center, USA Hospital patients referred to the anticoagulant service by their primary physicians Patients 81, (42 in the pharmacist prescriber group, 39 in the physician prescriber group) Health professional delivering intervention ‐ 7 certified pharmacist prescribers. Each prescribing pharmacist had a minimum of six months clinical experience treating patients with anticoagulants and had undergone a certification process. one physician undertook the physician prescribing. Practice ‐1 No unit of analysis errors | |
| Interventions | PATIENTS Pharmacist versus physician independent management of anticoagulant therapy of inpatients Patients in the pharmacist prescriber group had a pharmacist write daily heparin and warfarin dosage adjustments which were administered to the patients. The physician independently monitored laboratory results for the pharmacist patient group and simulated heparin and warfarin doses. In the physician group roles were reversed. Pharmacists and physician recorded dosage adjustments in a blinded fashion. Interaction between pharmacist and physician and vice‐versa if clinical safety a concern. | |
| Outcomes | PATIENTS Heparin dosage (units/24 hours) Warfarin dosage (mg) Partial thromboplastin time (sec) Number of days to achieve therapeutic proconversion and prothrombin Adverse events | |
| Notes | Study period 5 months. | |
| Risk of bias | ||
| Bias | Authors' judgement | Support for judgement |
| Random sequence generation (selection bias) | Unclear risk | Randomisation process not reported. Patients were randomised to one of two treatment groups. |
| Allocation concealment (selection bias) | Unclear risk | Method of concealment not reported. Protocol not located. |
| Blinding of participants and personnel (performance bias) | Unclear risk | Patients probably blinded. Pharmacists and physician not blinded. |
| Blinding of outcome assessment (detection bias) | Low risk | Laboratory measures of anticoagulation. Unclear method of reporting adverse events. |
| Incomplete outcome data (attrition bias) | Low risk | All 81 consecutive hospitalised patients had results reported. |
| Selective reporting (reporting bias) | Low risk | All predefined outcomes reported. |
| Other bias | Unclear risk | Familiarity and interaction of physician and pharmacist may have influenced results. |
| Methods | Randomised controlled trial | |
| Participants | A university affiliated ambulatory care clinic, USA Patients with poorly controlled type 2 diabetes (HbA1c 8% or above) Patients 80, (41 intervention, 39 control patients) Single practice Health professional delivering intervention ‐ one pharmacist who was already established as a pharmacotherapy consultant at the clinic. All therapeutic recommendations were discussed with the primary care physician before significant therapy alterations. Medication management protocols provided guidance. Some autonomy of prescribing No unit of analysis issues | |
| Interventions | PATIENTS Pharmacist case management versus usual medical care A clinical pharmacist provided evaluation and modification of pharmacotherapy, self‐management diabetes education and reinforcement of diabetes complications, screening processes through clinic visits and telephone follow‐up | |
| Outcomes | PATIENTS HbA1c PROCESS Rates of diabetes process measures ‐ HbA1c and LDL measurement, dilated retinal examination, urine microalbuminuria screening or use of ACE inhibitors, monofilament testing | |
| Notes | Follow‐up HbA1c measurement was 13.6 months for intervention group and 14.9 months for control group. | |
| Risk of bias | ||
| Bias | Authors' judgement | Support for judgement |
| Random sequence generation (selection bias) | Low risk | Hand drawing of lots, zero control, 1 for intervention, stratified into 4 groups based on baseline HbA1c. |
| Allocation concealment (selection bias) | Unclear risk | Method of concealment not described. |
| Blinding of participants and personnel (performance bias) | High risk | Patients, providers and case managers were not blinded to the intervention. |
| Blinding of outcome assessment (detection bias) | Low risk | Objective laboratory outcome measures. |
| Incomplete outcome data (attrition bias) | Unclear risk | Outcome measures obtained for 81% of patients, attrition 5/41 (12%) intervention,10/39 (26%) control. Data imputed. |
| Selective reporting (reporting bias) | Low risk | Expected outcomes reported. |
| Other bias | High risk | Unclear level of autonomous prescribing practice. i.e. some autonomy in decision making versus a great deal of autonomy to make medication adjustments. Physicians could discuss non‐intervention cases with the pharmacist. |
| Methods | Randomised controlled trial | |
| Participants | Ambulatory care clinic, Providence Veterans Affairs Medical Center, Providence Rhode Island, USA Patients were veterans with type 2 diabetes and cardiovascular risk factors. HbA1c > 7%, LDL > 2.59 mmol/L (or > 1.81 mmol/L for those with coronary artery disease), and BP > 130/80 mmHg documented in last 6 months Patients 99, (50 intervention, 49 control) Health professional delivering intervention ‐ pharmacists (number not reported) with prescribing privileges No unit of analysis errors | |
| Interventions | PATIENTS A complex multiprofessional intervention (pharmacist, nurse, dietician etc) with pharmacist prescribing activity a small part of the intervention versus standard care Regular visits to primary care provider plus 4 once‐weekly 2‐hour sessions followed by 5 monthly booster sessions with 4‐6 participants. Educational component for first hour by multidisciplinary team covering chronic conditions and complications and recommendations on care. Session delivered by pharmacist, dietician, nurse, physical therapist. Second hour intervention delivered by a clinical pharmacist (nationally certified diabetes educator or a Rhode Island certified diabetes outpatient educator) that aimed to achieve behavioural change. Medication regimens were modified as required by the pharmacist. Individual assistance with exercise /diet was available after 4 weekly sessions. | |
| Outcomes | PATIENTS Change in proportion of participants achieving target glycaemic and cardiac risk factor goals as recommended by the ADA (systolic BP < 130 mmHg, LDL < 100 mg/dL (2.59 mmol/L), HbA1c < 7%), absolute change from baseline for health‐related quality of life, SF‐36 for Veterans (VR‐36) Assessment of perceived competence Summary of Diabetes Self‐Care Activities Medication adherence PROCESS Prescribed medicines RESOURCE USE Primary care provider visits | |
| Notes | 6‐month study. Complex multifactorial intervention and cannot relate findings solely to pharmacist prescribing activity. | |
| Risk of bias | ||
| Bias | Authors' judgement | Support for judgement |
| Random sequence generation (selection bias) | Low risk | 'randomised controlled trial', participants assigned to intervention or standard primary care on a 1:1 ratio. |
| Allocation concealment (selection bias) | Unclear risk | Not described. |
| Blinding of participants and personnel (performance bias) | High risk | Not feasible with study design. |
| Blinding of outcome assessment (detection bias) | Low risk | Objective outcome laboratory results. Unclear if provider undertaking BP readings was blinded. Unclear if questionnaire completion by patients can be biased according to the group to which they were randomised. |
| Incomplete outcome data (attrition bias) | Low risk | 103 patients randomised, 4 participants withdrew consent, one standard care, 3 intervention. These were not included in the analysis. 3 patients died during the study, 2 in intervention, 1 standard care and included in analysis. |
| Selective reporting (reporting bias) | Low risk | Expected outcomes reported. |
| Other bias | Unclear risk | LDL significantly lower in intervention arm at baseline. Multifactorial intervention with effect of prescribing on outcomes unclear. |
| Methods | Randomised controlled trial | |
| Participants | 5 Kaiser Permanente Medical centres in San Francisco Bay area, USA Men and women aged 70 years or younger hospitalised for acute myocardial infarction. Patient enlisted on hospital day 3 or when stabilised Patients 585, (intervention 293, usual medical care 292) Health professional delivering the intervention ‐ programme nurses who participated in 80 hours of training by specialists in cardiology, psychiatry, lipid therapy, nutrition and nursing practice. Training focused on exercise testing, and training, diet, drug management of hyperlipidaemia, smoking cessation and psychosocial interventions. Lipid drug therapy by algorithm. | |
| Interventions | PATIENTS Effectiveness of physician‐directed nurse‐managed home‐based case management for coronary risk factor modification versus usual medical care. In addition to usual care, patients were encouraged to monitor health habits (self‐reports) and set subgoals. Patients ‐ After discharge, follow‐up by nurse initiated telephone contacts, computer‐generated progress reports and visits to the nurse. Nursing effort involved 9 hours per patient in the first year covering lifestyle, lipid‐lowering drug therapy (2.5 hours) and liaison. Changes in drug therapy at 120, 150, and 180 days based on response. Nurses could change a drug dosage or discontinue a drug but required permission from the primary care physician to add a new drug. Nurses provided detailed counselling on drug therapy. | |
| Outcomes | PATIENTS Smoking cessation Nutritional management Lipid‐lowering therapy Exercise training Adverse events | |
| Notes | 12‐month study. | |
| Risk of bias | ||
| Bias | Authors' judgement | Support for judgement |
| Random sequence generation (selection bias) | Low risk | Randomly assigned using a computer programme, done centrally. |
| Allocation concealment (selection bias) | Low risk | Nurses notified of assignments by telephone from co‐ordinating centre staff. |
| Blinding of participants and personnel (performance bias) | High risk | Not feasible with study design. |
| Blinding of outcome assessment (detection bias) | Low risk | Laboratory measures low risk. Unclear risk of nurse manager influence on other outcome assessments (smoking cessation, nutrition, exercise). |
| Incomplete outcome data (attrition bias) | Unclear risk | Dropouts at 12 months, intervention 11.6%, usual care 15.4%, reasons given. |
| Selective reporting (reporting bias) | Low risk | None apparent. |
| Other bias | High risk | Influence on prescribing by primary care physician for new drugs and telephone consultations from lipid specialist and senior nurse co‐ordinator. |
| Methods | Controlled trial | |
| Participants | Outpatient nurse‐led clinic, Whittington Hospital North Islington, London, UK Adult patients with type 2 diabetes and BP ≥ 140/80 mmHg, in receipt of BP treatment and without any serious or life‐threatening conditions Patients 120, (nurse‐led clinic 60, conventional primary care 60) Health professional delivering intervention ‐ hypertension nurse No unit of analysis errors | |
| Interventions | PATIENTS Effectiveness of a nurse‐led hypertension clinic versus conventional primary care in general practice on lowering BP in type 2 diabetic patients with uncontrolled hypertension at risk of cardiovascular disease. Nurse‐led clinic patients were seen monthly for 3 months and then 6‐weekly for 3 months. At each visit BP was measured and compliance with the drug regimen reviewed (based on agreed guidelines). Advice on healthy living was provided and side‐effects of existing antihypertensive treatment discussed. Intervention focused on intensifying antihypertensive treatment. Hypertension nurses and primary care physicians used the same guidelines. The nurse could initiate treatment changes (drug titration or new drug added).New prescriptions were provided by attending physicians. Patients in both groups reviewed by the nurse at six months and baseline measures repeated. | |
| Outcomes | PATIENTS Change in systolic BP Lipids (total cholesterol, HDL, total triglycerides) HbA1c Urinary albumin excretion Serum creatinine Changes in absolute stroke and CHD risk scores | |
| Notes | 6‐month study Influence of attending physician on prescribing unclear Multifactorial intervention. Importance of changing treatment to achieve target BP | |
| Risk of bias | ||
| Bias | Authors' judgement | Support for judgement |
| Random sequence generation (selection bias) | Unclear risk | Three investigators independently assessed and randomly referred patients from their clinic. Patients were then allocated to conventional primary care or nurse‐led clinic on an alternate basis. |
| Allocation concealment (selection bias) | Unclear risk | Allocation concealment not specified. |
| Blinding of participants and personnel (performance bias) | High risk | Not feasible with study design. |
| Blinding of outcome assessment (detection bias) | Unclear risk | Laboratory measures low. BP ‐ high as nurse measured intervention group BP at each visit and both groups at 6 months. Unclear if CHD and stroke risk scoring influenced by provider. |
| Incomplete outcome data (attrition bias) | Low risk | Intention‐to‐treat analysis, low attrition 4/60 conventional primary care, 1/60 nurse‐led clinic. |
| Selective reporting (reporting bias) | Low risk | Predefined outcomes reported. |
| Other bias | Unclear risk | Influence of attending physician on prescribing. |
| Methods | Randomised controlled trial | |
| Participants | Profamilia (Colombian Association for Family Welfare) central clinic, Bogota, Colombia New clients seeking contraceptive services Clients 1532, (physician 769, nurse 763) Health professional delivering intervention ‐ family planning nurses Practice ‐ 1 No unit of analysis issues | |
| Interventions | CLIENTS Family planning services provided by nurses versus physicians Prescription of oral contraceptives Insertion of intrauterine devices (IUD) Breast, pelvic, vaginal, and abdominal examinations Treatment of cervico‐vaginitis | |
| Outcomes | CLIENTS Unwanted pregnancy Side‐effects PROCESS Method prescribed to client at first and next visit Incidence of interim method prescriptions Deferment of IUD insertions Changing of methods by provider Number and reason for clinic revisits | |
| Notes | 6‐month study. | |
| Risk of bias | ||
| Bias | Authors' judgement | Support for judgement |
| Random sequence generation (selection bias) | Unclear risk | During a six‐week period clients attending the clinic were randomly assigned to either a physician group or a family planning nurse group. Method of sequence generation unclear. |
| Allocation concealment (selection bias) | Unclear risk | Concealment not explained. |
| Blinding of participants and personnel (performance bias) | High risk | Not feasible with study design. |
| Blinding of outcome assessment (detection bias) | Unclear risk | Not explained. |
| Incomplete outcome data (attrition bias) | High risk | 36.3% of clients had no revisits. No details of number recruited. |
| Selective reporting (reporting bias) | Unclear risk | Outcomes stated are rather vague. |
| Other bias | Unclear risk | Bias related to sex, all nurses female and most physicians male. |
| Methods | Randomised controlled trial | |
| Participants | Nine Veterans Affairs medical centres (VMAC), USA (subanalysis using data from the IMPROVE study) VAMC patients at high risk for drug‐related adverse events who had a diagnosis of dyslipidaemia at baseline in the IMPROVE study High risk if three or more of the following: 5 or more drugs, 12 or more doses/day, 4 or more drug changes in the previous year, 3 or more concurrent diseases, history of noncompliance, treatment with drugs requiring therapeutic monitoring. Patients 437, (208 intervention group, 229 control group) Health professional delivering intervention ‐ 78 ambulatory care clinical pharmacists No unit of analysis errors | |
| Interventions | PATIENTS Clinical pharmacists providing pharmaceutical care in addition to usual medical care versus usual medical care in the management of dyslipidaemia. Pharmacists adjusted drug regimens to improve care and disease control and identify and prevent drug‐related problems. Pharmacists followed patients until outcome goals achieved. Each clinical pharmacist was to practice according to the defined scope of practice in the institution. Depending on the site and scope of practice drug therapy could be adjusted and laboratory tests ordered. Collaboration with physicians varied. Pharmacists determined frequency of follow‐up appointments but patients were to be seen at least 3 times, baseline, 6 months, 12 months. | |
| Outcomes | PATIENTS The percentage of patients achieving guideline LDL goals RESOURCE USE Cost estimation of pharmacist versus usual care for hospitalisations, clinic visits, all drugs, lipid agents, laboratory Healthcare visits | |
| Notes | Pharmacists managed entire pharmaceutical care needs rather than just managing dyslipidaemia. | |
| Risk of bias | ||
| Bias | Authors' judgement | Support for judgement |
| Random sequence generation (selection bias) | Unclear risk | Potential participants for the IMPROVE study were randomised by the central co‐ordinating centre at the University of Colorado Health Science Center. This study analysed only patients with a diagnosis of dyslipidaemia at baseline therefore randomisation was not conducted strictly for patients with lipid disorders. |
| Allocation concealment (selection bias) | Unclear risk | Concealment process not stated. |
| Blinding of participants and personnel (performance bias) | High risk | Not feasible with study design. |
| Blinding of outcome assessment (detection bias) | Low risk | Objective outcome laboratory and cost measure. |
| Incomplete outcome data (attrition bias) | Low risk | Intention‐to‐treat analysis used. |
| Selective reporting (reporting bias) | Low risk | Predefined outcomes reported. |
| Other bias | Unclear risk | Effect on patient management of close collaboration between pharmacists and physicians at some sites unclear. |
| Methods | Cluster‐randomised controlled trial | |
| Participants | 31 primary care antiretroviral clinics, (16 intervention, 15 control) Free State Province South Africa Cohort 1. Adults ≥ 16 years with CD4 counts of 350 cells per μL or less who were not receiving antiretroviral therapy ‐ 5390 patients enrolled for intervention, 3862 control Cohort 2 . Adults who had received antiretroviral therapy for at least six months and were being treated at enrolment. 3029 intervention patients, 3202 control Healthcare professional delivering intervention ‐ prescribing nurses who received at least four educational outreach training sessions about antiretroviral therapy prescribing and side‐effects with guidelines and algorithms (PALSA PLUS) to start and monitor patients on antiretroviral therapy and identify those needing referral to a doctor | |
| Interventions | PATIENTS Prescribing of antiretroviral treatment by nurses versus doctors Training delivered and trial co‐ordinator visited every intervention clinic to establish a team responsible for support of decentralised care (phase 1). Nurses assumed responsibility for prescribing antiretroviral therapy for patients already receiving treatment (phase 2). Nurses began to initiate antiretroviral therapy for eligible patients (phase 3) Equivalence trial ‐ nurse‐led antiretroviral therapy would be as effective in maintenance of viral suppression as doctor‐led treatment | |
| Outcomes | PATIENTS Cohort 1: Primary outcome Time to death from enrolment Secondary outcomes Measures of health status (changes in weight, CD4 cell counts, viral loads, hospital admissions, inpatient days) Indicators of quality of care (antiretroviral therapy initiation, time from enrolment to start of antiretroviral therapy, detection of tuberculosis, co‐trimoxazole provision, programme retention 1 year after enrolment, baseline CD4 cell count in patients who started antiretroviral therapy, clinic consultations with nurses and doctors) Cohort 2: Primary outcome Proportion with undetectable viral loads (< 400 copies/mL) 12 months after enrolment Secondary outcomes Measures of health status (time to death censored 12‐18 months after enrolment, changes in weight and CD4 cell counts, hospital admissions, inpatient days) Indicators of quality of care (programme retention, diagnosis of tuberculosis, co‐trimoxazole provision, switching of antiretroviral therapy regimens, clinic consultations with doctors and nurses) | |
| Notes | 12‐18 month follow‐up. Equivalence trial. | |
| Risk of bias | ||
| Bias | Authors' judgement | Support for judgement |
| Random sequence generation (selection bias) | Low risk | Clinics and their patients were randomly assigned. Within each stratum clinics were randomly assigned to intervention and control according to sequences of random numbers in a random number table (even for control, odd for intervention). |
| Allocation concealment (selection bias) | Low risk | Trial statistician undertook randomisation before trial started. |
| Blinding of participants and personnel (performance bias) | High risk | Patients and clinicians could not be masked to group assignment. |
| Blinding of outcome assessment (detection bias) | Low risk | Register of deaths and laboratory values. All interim analysis was blind but data analysts were not masked after the database was locked for final analysis. |
| Incomplete outcome data (attrition bias) | Low risk | Data for primary outcomes available for 94% of participants. Intention‐to‐treat analysis. |
| Selective reporting (reporting bias) | Low risk | Predefined outcomes reported. |
| Other bias | Unclear risk | Control group unintentionally favoured by Governement programme to improve access to doctors during the trial. Hesitency of nurses to initiate antiretroviral therapy when they had the option to refer to doctors (only a quarter of patients who started antiretroviral therapy had treatment initiated by nurses) |
| Methods | Randomised controlled trial | |
| Participants | Kaiser Permanente Medical Center, San Rafael, California, USA Patients who were members of the health maintenance organisation had just started antidepressant therapy for depressive symptoms and referred to the protocol by their primary care provider. Patients 125, (75 intervention, 50 control) Health professional delivering intervention ‐ two clinical pharmacists. Both had doctor of pharmacy degrees with several years of direct patient care. One was board certified as a psychiatric pharmacy who mentored the other investigator during a 2‐month training period. | |
| Interventions | PATIENTS Collaborative care model of clinical pharmacists providing drug therapy management and treatment follow‐up versus usual care. Pharmacist care manager undertook a 30‐minute intake interview to assess severity of psychopathology, identify potential stressors and other predisposing factors. Medical, psychiatric, and drug therapy histories recorded and whether any exclusion criteria were present. Patient education undertaken. Pharmacists could prescribe ancillary drugs e.g. for sleep and titrate antidepressant drugs but if a change in antidepressant drug was indicated approval from the primary care provider was required. If changes to the antidepressant regimen were warranted the pharmacists communicated this recommendation to the provider. The designated psychiatric mentor met with the clinical pharmacists each week and was available for consultation. Pharmacy care managers made follow‐up telephone calls to patients at weeks 1, 2, 4, 10, 16. Patients had clinic visits at weeks 6 and 24. | |
| Outcomes | PATIENTS Adherence to antidepressant drug therapy Clinical and functional severity (Brief Inventory for Depressive Symptoms (BIDS) and Work and Social Disability Scale) Patient satisfaction RESOURCE USE Change in all clinic or emergency department visits Drug costs PROVIDERS Experience and satisfaction of primary care providers | |
| Notes | 6‐month study | |
| Risk of bias | ||
| Bias | Authors' judgement | Support for judgement |
| Random sequence generation (selection bias) | Unclear risk | Participants were randomly assigned to the collaborative care model or back to usual care in a 3:2 ratio (sequence generation not described). |
| Allocation concealment (selection bias) | Low risk | The investigators opened a sealed envelope that determined study group assignment. |
| Blinding of participants and personnel (performance bias) | High risk | Participants and providers aware of study group assignments. |
| Blinding of outcome assessment (detection bias) | Unclear risk | Unclear if questionnaires completed by patients can be biased according to the group to which they were randomised. |
| Incomplete outcome data (attrition bias) | High risk | Clinical outcome surveys incomplete or not available. control 26/50 (52%), intervention 21/75 (28%). Patient satisfaction survey attrition high, control 17/50 (34%), intervention 16/75 (21%). Provider satisfaction attrition 12/30 (40%) |
| Selective reporting (reporting bias) | Low risk | Predefined outcomes reported. |
| Other bias | High risk | High female population (85% intervention, 84% control). Physican practices may have improved after establishing the clinical pharmacy services. Unclear if patient and provider satisfaction surveys were validated surveys. Effect of USD 20 reimbursement for returning surveys. Influence of the psychiatric mentor on prescribing unclear. |
| Methods | Randomised controlled trial | |
| Participants | Community health centre ‐ Denver Health's Westside Family Health Center (Westside Clinic) Denver, Colorado, USA Patients aged > 17 years with diabetes with at least two visits in the past year (Latino ethnicity 59%, African America 21%) Patients 762, (381 intervention, 381 control) Health professional delivering intervention ‐ 3 nurses sharing role No unit of analysis errors | |
| Interventions | PATIENTS An algorithm‐driven telephone care by nurses as an adjunct to usual care versus usual care to improve lipid control in patients with diabetes. Nurses independently checked laboratory results and initiated and titrated lipid therapy over the telephone with a 2‐week follow‐up call to assess side‐effects and a 6‐week call to recheck lipids after medication changes. Nurses also promoted behavioural change through motivational interviewing and self‐management techniques. The nurses used algorithms for glycaemic and BP control and vaccinations. The nurse used pre‐printed prescriptions signed by the physician who offered educational and management support. | |
| Outcomes | PATIENTS Proportion of patients with an LDL less than 100 mg/dL (2.59 mmol/L) Proportion of patients with cardiovascular disease and an LDL < 70 mg/dL (1.8 mmol/L) Percentage of patients with HbA1c < 7 mg/dL Percentage of patients with BP < 130/80 mmHg RESOURCE USE Hospital inpatient admissions Emergency department visits Outpatient visits Average hospital charges per patient | |
| Notes | 20‐month study but unclear time points for measurements. | |
| Risk of bias | ||
| Bias | Authors' judgement | Support for judgement |
| Random sequence generation (selection bias) | Unclear risk | This randomised controlled trial but no detail on sequence generation. |
| Allocation concealment (selection bias) | Unclear risk | Allocation concealment not specified. |
| Blinding of participants and personnel (performance bias) | High risk | Not feasible with study design. |
| Blinding of outcome assessment (detection bias) | Low risk | Laboratory measures low risk. Investigators doing analysis were not blinded to control versus intervention groups. |
| Incomplete outcome data (attrition bias) | Low risk | Intention‐to‐treat analysis. Missing data on medication analysis, side‐effects, adherence due to incomplete data base. Nurse unable to contact 65/381 (17%) intervention patients. |
| Selective reporting (reporting bias) | Unclear risk | Some secondary outcome detail not reported e.g. post‐intervention BP, HbA1c. |
| Other bias | High risk | Baseline differences ‐ higher rate of cardiovascular disease and insulin use in control group, higher percentage of females in intervention group. Nurses interacted with control patients. No data provided on the input of physician champion to decision making, changing prescriptions etc. |
| Methods | Cluster‐randomised controlled trial | |
| Participants | Sixteen primary care teams at 5 medical centres (3 Veterans Affairs (VA) and 2 Kaiser Permanente (KP)), USA Eight intervention primary care teams (1797 patients), 8 usual care primary care teams (2303 patients) | |
| Interventions | PATIENTS A pharmacist‐led intervention (Adherence and Intensification of Medications) in patients with diabetes and poor BP control versus usual care Pharmacists used electronic prescribing and clinical data systems to reach out to patients with uncontrolled hypertension and either poor refill adherence or insufficient medication intensification in response to high BP. Supported by up‐to‐date medication refill information pharmacists delivered tailored adherence counselling by use of motivational interviewing and medication management with follow‐up once a behaviour or pharmacological change was made Health professional delivering the intervention ‐ five clinical pharmacists, two part‐time (2 full‐time equivalent at KP and 2 full‐time equivalent at VA). Pharmacists undertook a 3‐day interactive training focusing on motivational interviewing and the study protocol, procedures and the medication management tool (MMT). Fidelity was assessed during the intervention. A booster session occurred six months into the intervention with feedback on one or more telephone encounters by an expert in motivational interviewing Pharmacist encounters were offered at 3‐month intervals (0, 3, 6, 9, 12 months) Encounters took place at the clinic or by phone. At intake the pharmacist assessed adherence, explored barriers to adherence, discussed BP, HbA1c, LDL levels, explored goals, set a short‐term action step if there were barriers to adherence. If no adherence problems the pharmacist could make BP medication changes by using site approved algorithms Clinical pharmacists copied the patient's primary care physician on medication changes. Pharmacists consulted or referred back to the primary care physician those patients requiring more than 3 antihypertensive medications Patients were eligible for discharge when medication adherence issues had been addressed and target BP reached or the patient was on maximum tolerated medications | |
| Outcomes | PATIENTS Relative change in systolic BP from 6 months preceding to 6 months after the 14‐month intervention Shorter‐term changes in BP RESOURCE USE Hospitalisations, primary care visits, emergency room visit PROCESS Proportion of patients with BP medication changes | |
| Notes | High performing setting with at least 80% BP control Randomisation 2‐stage cluster sampling ‐ first team clusters at each site were selected and then primary care teams within the 5 sites were randomly assigned to treatment versus control. 16 primary care teams were randomly assigned for 8 intervention, and 8 control teams, 2+2 at three sites, 1+1 at two sites In the second stage, participants within each team were randomly sampled for activation by a priority order for outreach. | |
| Risk of bias | ||
| Bias | Authors' judgement | Support for judgement |
| Random sequence generation (selection bias) | Unclear risk | Not reported. |
| Allocation concealment (selection bias) | Unclear risk | Not reported. |
| Blinding of participants and personnel (performance bias) | High risk | Not feasible with study design. |
| Blinding of outcome assessment (detection bias) | Low risk | Laboratory values low risk. Systolic BP came from the sites usual clinical care electronic database (excluded BP by Adherence and Intensification of Medications pharmacists). |
| Incomplete outcome data (attrition bias) | High risk | Intention‐to‐treat analysis ‐ all contacted patients included in the analysis. In the intervention arm only 53% of participants had a pharmacist encounter. |
| Selective reporting (reporting bias) | Low risk | Predefined outcomes reported. |
| Other bias | Unclear risk | Multifactorial intervention with effect of prescribing on outcomes unclear. |
| Methods | Randomised controlled trial | |
| Participants | Outpatient General Clinical Research Center, Johns Hopkins, Baltimore, USA Hypertensive urban African American men aged 21 to 54 with systolic BP ≥ 140 mmHg or diastolic BP ≥ 90 mmHg on or off hypertensive medication Patients 309 (157 intensive intervention, 152 less intensive) Health professional delivering intervention ‐ nurse practitioner/community health worker/physician | |
| Interventions | PATIENTS A more intensive comprehensive and individualised educational‐behavioural‐pharmacological intervention by a nurse practitioner/community health worker/physician team versus a less intensive education and referral intervention in the community. Nurse practitioner visits every 1‐3 months. Men in the more intensive group received free medication from the nurse practitioner who made therapeutic decisions including medication titration in accordance with a protocol based on JNC‐V1 guidelines. The community health worker made at least one home visit and assisted with support referrals. The physician was available for consultation. Therapy further individualised with primary providers (where present) | |
| Outcomes | PATIENTS Changes at 36 months in: BP Left ventricular mass Serum creatinine Socio‐demographic and behavioural risk factors (items from National Health Interview Survey and Hill‐Bone Compliance Scale) RESOURCE USE Healthcare utilisation by asking if there was a provider for hypertension and whether they were on antihypertensive medication | |
| Notes | 36‐month study. | |
| Risk of bias | ||
| Bias | Authors' judgement | Support for judgement |
| Random sequence generation (selection bias) | Low risk | Computer‐generated randomisation. |
| Allocation concealment (selection bias) | Unclear risk | Not described. |
| Blinding of participants and personnel (performance bias) | High risk | Not feasible with study design. |
| Blinding of outcome assessment (detection bias) | Low risk | Personnel blinded to group assignment for BP and left ventricular mass. Laboratory measures. |
| Incomplete outcome data (attrition bias) | Low risk | 70% follow‐up at 12, 24, 36 months. |
| Selective reporting (reporting bias) | Low risk | Predefined outcomes reported. |
| Other bias | High risk | Multifaceted intervention by team. Unclear influence on prescribing of nurse practitioner by physicians. Medications free to the more intensive intervention group. |
| Methods | A randomised controlled trial | |
| Participants | University of California‐San Diego general internal medical clinic, USA Patients drawn form the electronic medical record of 10 primary care physicians who were ≥ 18 years with uncontrolled hypertension ( ≥ 140/90 mmHg or ≥ 130/≥ 80 mmHg if diabetic) on current treatment with at least one antihypertensive medication and had continuous active status with the clinic Patients 166 (75 intervention group, 91 usual care) Health provider delivering intervention ‐ two clinical pharmacists with a Doctor of Pharmacy degree, at least one year of pharmacy practice residency training and at least 7 years experience in ambulatory care Practice ‐ 1 No unit of analysis errors | |
| Interventions | PATIENTS Pharmacist‐managed BP control of hypertensive patients by the PharmD‐primary care physician medication management team versus usual care The clinical practice protocol allowed the pharmacist to independently initiate, adjust or discontinue treatment with antihypertensive medications. A physician was available for consultation Number of interventions ‐ four 30‐minute pharmacist visits (baseline 3, 6, 9 months) and as needed, independent of primary care physician visits | |
| Outcomes | PATIENTS Systolic BP (change at 6 months) Percentage of patients at BP goal Change in diastolic BP LDL and HDL cholesterol Patient satisfaction using the 22‐item Pharmacist Service Questionnaire PROCESS Number and types of medication changes Number and types of antihypertensive drug therapy problems | |
| Notes | Patients received USD 22 for each pharmacist visit, USD 25 for the 9‐month visit. | |
| Risk of bias | ||
| Bias | Authors' judgement | Support for judgement |
| Random sequence generation (selection bias) | Low risk | Patients were randomly assigned via a computer‐generated random sequence. A random subset of usual care patients was selected for retrospective chart review (process unclear). |
| Allocation concealment (selection bias) | Unclear risk | Concealment not described. |
| Blinding of participants and personnel (performance bias) | High risk | Not feasible with study design. Primary care physicians had patients in both groups. |
| Blinding of outcome assessment (detection bias) | Unclear risk | Pharmacist measured BP at each study visit. |
| Incomplete outcome data (attrition bias) | Unclear risk | After enrolment 11/75 (15%) of intervention group lost at 6 months, 23/75 (31%) of intervention group lost at 9 months versus 91/91 in usual care. 19 intervention patients returned to primary care physicians with measured data included. |
| Selective reporting (reporting bias) | Low risk | Predefined outcomes reported. |
| Other bias | Unclear risk | Baseline Intervention group younger, lower Charlson comorbidity index, more likely to be male, and lower total number of medications. Payment of patients for pharmacist visit. |
| Methods | Randomised controlled trial | |
| Participants | Diabetes outpatient clinics of two hospitals, Isala Clinics, Zwolle and Bethesda General Hospital, Hoogeveen, the Netherlands Patients with type 2 diabetes referred by GPs Patients 93 (intervention 50, standard care 43) Health professional delivering intervention ‐ nurse specialising in diabetes trained to follow a detailed treatment and management protocol aimed at optimising glycaemia, BP, and lipids. Protocols allowed nurse specialising in diabetes to prescribe medication and order laboratory tests, initiate therapy with 14 medications and change doses for 30 medications | |
| Interventions | PATIENTS Secondary care management of diabetes by supervised nurses versus medical care | |
| Outcomes | PATIENTS Mean decrease in HbA1c from baseline to one year BP Total cholesterol LDL LDL/HDL Proportion of patients meeting targets Health‐related quality of life SF‐36 Diabetes‐related symptoms (Diabetes Symptom Checklist‐type 2, DSC‐type 2) Patient satisfaction (Patient Evaluation of the Quality of Diabetes Care, PEQD) RESOURCE USE Healthcare consumption Costs | |
| Notes | In some cases the protocol specified consultation with medical internist. 12‐month study. | |
| Risk of bias | ||
| Bias | Authors' judgement | Support for judgement |
| Random sequence generation (selection bias) | Low risk | Population randomised with sequential numbers in closed envelopes with even numbers assigned to the intervention group and odd numbers to control. |
| Allocation concealment (selection bias) | Low risk | Non‐transparent closed envelopes. |
| Blinding of participants and personnel (performance bias) | High risk | Not feasible with study design. |
| Blinding of outcome assessment (detection bias) | Low risk | Laboratory measures (low risk). Independent medical investigator saw patients at baseline, 6 months, 12 months. Unclear if completion of questionnaires can be biased according to randomisation group. |
| Incomplete outcome data (attrition bias) | Low risk | Attrition‐low: intervention group 4/50 (8%), standard care 5/43 (12%). SF‐36 4/84, 4/84 satisfaction survey. Data analysis excludes lost to follow‐up. |
| Selective reporting (reporting bias) | Low risk | Predefined outcomes reported. |
| Other bias | Unclear risk | Unclear impact of consultation of nurse specialising in diabetes with internist as per protocol. |
| Methods | Randomised controlled trial | |
| Participants | A primary care group general practice with five GPs, north‐east region of the Netherlands Patients with type 2 diabetes mellitus, on medication and whose HbA1c levels had been measured in the last three years Patients 230 (intervention 116, GP 114) Health professional delivering intervention ‐ practice nurses (primarily 2) who received one week of training on a detailed treatment and management protocol aimed at optimising glucose, BP, lipids, eye and foot care. Practice nurses could prescribe 14 different medications, adjust doses for 30 medications, order laboratory tests, adjust doses but not order insulin | |
| Interventions | PATIENTS Primary care nurse management of type two diabetes versus management by GPs | |
| Outcomes | PATIENTS HbA1c (mean decrease after 14 months) BP Cholesterol and cholesterol/HDL ratio Health‐related quality of life (SF‐36) Diabetes‐related symptoms (DSC‐type 2) Patient satisfaction (PEQD) PROCESS Proportion of patients achieving target ranges of glycaemic control (HbA1c below 7.5% and 8.5%) BP below 14/90 mmHg Opthalmologist referrals Measures for feet at risk Referral to internist for starting insulin Proportion with drug intensification RESOURCE Healthcare consumption | |
| Notes | 14‐month study. | |
| Risk of bias | ||
| Bias | Authors' judgement | Support for judgement |
| Random sequence generation (selection bias) | Low risk | Population randomised by two independent medical investigators using sequential numbers in closed envelopes with even numbers assigned to the intervention group and odd numbers to control group. |
| Allocation concealment (selection bias) | Low risk | Non‐transparent closed envelopes. |
| Blinding of participants and personnel (performance bias) | High risk | Not feasible by study design. |
| Blinding of outcome assessment (detection bias) | Unclear risk | Laboratory measures (low risk). BP not blinded (high risk). Unclear if completion of questionnaires can be biased according to randomisation group. |
| Incomplete outcome data (attrition bias) | Low risk | Low lost to follow‐up ‐ practice nurse intervention group 14/116 (12%), GP usual care 10/114 (9%). Data analysis excludes lost to follow‐up. |
| Selective reporting (reporting bias) | Low risk | Outcomes outlined in methods reported. Patient satisfaction results summarised. |
| Other bias | Unclear risk | Mean number of visits in practice nurse group 6.1 versus 2.8 in the GP group (P < 0.001). Visits also longer. |
| Methods | Randomised controlled trial | |
| Participants | Nine community‐based primary care clinics (Providence Primary Care Research Network), Oregon, USA Patients with hypertension and uncontrolled BP Patients 463 (pharmacist arm 230, usual care 233) Health professional delivering intervention ‐ 5 pharmacy practitioners with a post‐baccalaureate doctor of pharmacy degree, 1‐2 years ambulatory medicine residency training and was board certified in pharmacotherapy | |
| Interventions | PATIENTS Pharmacists participating in the active management of hypertension in the primary care office according to collaborative treatment protocols versus usual care Pharmacists reviewed the participants' medications and lifestyle habits, assessed vital signs, screened for adverse drug reactions, identified barriers to adherence, provided education, optimised the antihypertensive regimen and scheduled follow‐up appointments. Antihypertensive regimen optimisation included alterations to titrate the dose of an existing medication, add a new agent, switch a medication or consolidate antihypertensive therapy. The pharmacist had access to the patients' medical record as well as to the primary care physician to discuss the hypertension treatment plan or other medical issues | |
| Outcomes | PATIENTS Difference in mean systolic and diastolic BP between team‐based care and usual care Proportion achieving BP goal attainment (< 140/90 mmHg) Self‐management knowledge and behaviour (internally designed) Medication adherence (Morisky scale) Home BP monitoring Quality of life (Medical Outcomes Study SF‐36) Satisfaction (six healthcare and five specific hypertension domain questions) RESOURCE UTILISATION Clinic visits to primary care physician and pharmacist in intervention and control arms PROCESS Antihypertensive use | |
| Notes | 12‐month study. Did not need to consult physician to change medications. | |
| Risk of bias | ||
| Bias | Authors' judgement | Support for judgement |
| Random sequence generation (selection bias) | Low risk | Participants randomly assigned with equal allocation and without restriction to intervention or control using a computer‐generated random sequence. |
| Allocation concealment (selection bias) | Unclear risk | Not specified. |
| Blinding of participants and personnel (performance bias) | High risk | Not feasible with study design. |
| Blinding of outcome assessment (detection bias) | Low risk | At study‐end BP was assessed by registered nurses blinded to the participants randomisation allocation. |
| Incomplete outcome data (attrition bias) | Unclear risk | Intention‐to‐treat analysis. 191 participants (41%) withdrew after randomisation 88/230 (38.3%) intervention, 103/233 (44.2%) usual care but groups comparable ‐ 142 pharmacist, 130 usual care. Reasons discussed. Only factor associated with higher withdrawal rate was enrolment in commercial insurance. |
| Selective reporting (reporting bias) | Unclear risk | Predefined outcomes reported. |
| Other bias | Unclear risk | Physcians in this study cared for patients in both groups and co‐signed the chart note following every pharmacist‐patient interaction. Six control patients also received a pharmacist consultation (at primary care physician request). This may bias toward null hypothesis. Control patients were also offered a number of active interventions e.g. mailed educational material, appointment prompts, physician prompts where BP elevated. |
| Methods | Randomised controlled trial | |
| Participants | Minneapolis VA Health Care System, Minneapolis, Minnesota, USA Diabetic veterans who had BP > 140/90 mmHg, HbA1c > 9%, or LDL > 100 mg/dL Patients 556 (278 intervention, 278 usual care) Health professional delivering intervention ‐ nurse case managers who made adjustments to medications according to protocols established for the study | |
| Interventions | PATIENTS To determine whether nurse case management with a therapeutic algorithm could effectively improve rates of control for hypertension, hyperglycaemia and hyperlipidaemia compared with usual care among veterans with diabetes. Intervention group patients in collaboration with the study nurse established lifestyle goals, were provided with home BP monitors and had medications adjusted. The nurse case managers contacted patients initially two‐weekly, decreasing as targets were reached to review and adjust therapy | |
| Outcomes | PATIENTS Percentage of patients with control of all three cardiovascular risk factors (BP < 130/80 mmHg, LDL < 100 mg/dL, HbA1c < 8%) Percentage of individuals achieving individual treatment goals Change in absolute values for BP, LDL, HbA1c between groups at one year | |
| Notes | 12‐month study. | |
| Risk of bias | ||
| Bias | Authors' judgement | Support for judgement |
| Random sequence generation (selection bias) | Low risk | Randomisation according to a computer‐generated randomisation schedule with a block size of six. |
| Allocation concealment (selection bias) | Unclear risk | Allocation concealment not specified. |
| Blinding of participants and personnel (performance bias) | High risk | Not feasible with study design. |
| Blinding of outcome assessment (detection bias) | Low risk | Laboratory measures low risk. Unclear risk around independence and blinding to study group of those performing final BP measurement. |
| Incomplete outcome data (attrition bias) | Unclear risk | Intention‐to‐treat analysis. Attrition at final visit: intervention 55/278 (20%), usual care 70/278 (25%). |
| Selective reporting (reporting bias) | Low risk | Not evident. |
| Other bias | Unclear risk | Nineteen patients included who were randomised in error as a value for entry did not exceed the threshold. |
| Methods | Randomised controlled trial | |
| Participants | General internal medicine clinic, Detroit Receiving Hospital, University Health Center, Detroit, USA Urban African‐American patients with non‐insulin dependant diabetes mellitus (NIDDM) Patients 39 (17 intervention, 22 controls) Health professional delivering intervention ‐ a pharmacist delegated full prescribing authority under an approved hyperglycaemic agents protocol No unit of analysis errors | |
| Interventions | PATIENTS Pharmacists providing pharmaceutical care versus physicians Diabetes‐related management aspects were solely provided by a pharmacist including pharmacotherapeutic evaluation and dosage adjustments, individualised education on diabetes and its complications, training on the recognition and treatment of hypoglycaemia and hyperglycaemia, medication counselling, instructions on dietary regulation and an exercise plan, training for self‐monitoring of blood glucose. Weekly follow‐up until target glycaemia control then 2‐4 weekly visits | |
| Outcomes | PATIENTS Fasting plasma glucose HbA1c BP Serum creatinine Creatinine clearance Microalbumin to creatinine ratio Lipids (total cholesterol, triglycerides, HDL, LDL) Quality of life (Health Status Questionnaire V2 derived from the SF‐36) Patient compliance Adverse events PROCESS Medication use | |
| Notes | 4‐month study. | |
| Risk of bias | ||
| Bias | Authors' judgement | Support for judgement |
| Random sequence generation (selection bias) | Low risk | Eligible patients were assigned to an intervention or control group in a randomised, parallel design fashion. |
| Allocation concealment (selection bias) | Unclear risk | Allocation concealment not explained. |
| Blinding of participants and personnel (performance bias) | High risk | Not feasible with study design. |
| Blinding of outcome assessment (detection bias) | Low risk | Laboratory values low risk. Unclear if questionnaire results can be biased by the group allocation. |
| Incomplete outcome data (attrition bias) | High risk | Attrition: 6/23 (26%) intervention group dropped out or were discharged. Reasons provided. |
| Selective reporting (reporting bias) | Unclear risk | Predefined outcomes reported. |
| Other bias | Unclear risk | Multifactorial intervention with effect of prescribing on outcomes unclear. |
| Methods | Cluster‐randomised controlled trial | |
| Participants | Twenty primary care practices with 53 GPs, Leicester, UK Patients with CHD, CHF or both Patients 1316. Intervention 608 (final cases included 505 ‐ CHD 461, heart failure 147, confirmed left ventricular systolic dysfunction 51, excluded 103). Controls 708 (final cases included ‐ 658, CHD 691, heart failure 215, confirmed left ventricular systolic dysfunction 75, excluded 50) Health professional delivering intervention ‐ two specialist nurses trained in the management of CHD and CHF No unit of analysis errors | |
| Interventions | PATIENTS Specialist nurse care versus usual care by the healthcare team in the control practices for secondary prevention of CHD and CHF Nurse intervention included patient assessment, confirmation of diagnosis by investigations, medication management and titration, home visits for house bound patients and liaison between primary and secondary care | |
| Outcomes | PATIENTS The proportion of patients with a history of myocardial infarction receiving a beta‐blocker in patients with CHD a recorded serum cholesterol < 5 mmol/L in the previous year The proportion of patients with left ventricular systolic dysfunction being treated with an ACE inhibitor Quality of life (SF‐36) Seattle Angina Questionnaire Left Ventricular Dysfunction Questionnaire (LVD‐36) PROCESS CHD ‐ BMI, BP control CHF ‐ proportion of patients with a presumed diagnosis of CHF having an echocardiogram, proportion of patients having confirmation or rejection of the diagnosis of left ventricular systolic dysfunction by an echocardiogram Medication use ‐ secondary prevention, appropriate left ventricular systolic dysfunction medications | |
| Notes | Practices matched as closely as possible for size, number of GP partners, measure of deprivation, teaching and training status. Control group practices provided the same open access echocardiography and access to the secondary care cardiology clinic as the intervention group. 12‐month study. It is difficult to determine which facet or facets of a complex multifactorial intervention led to improvements in care. | |
| Risk of bias | ||
| Bias | Authors' judgement | Support for judgement |
| Random sequence generation (selection bias) | Low risk | Randomisation procedure used computer‐generated case control pairs. Pairing of GP practices based on list size, number of GPs, Jarman deprivation indicator, teaching and training status. |
| Allocation concealment (selection bias) | Unclear risk | Not practical. |
| Blinding of participants and personnel (performance bias) | High risk | Not feasible with study design. |
| Blinding of outcome assessment (detection bias) | Unclear risk | Unclear if questionnaire responses and some secondary prevention measures were biased by the group allocation. Low risk with laboratory and process measures. Data extracted by trained nurse data collectors. |
| Incomplete outcome data (attrition bias) | High risk | Attrition ‐ intervention 103/608, control 50/708. Intention‐to‐treat analysis of 1163 patients, 505 intervention, 658 control and of these: 39/505 intervention and 15/658 control patients did not complete trial per protocol (reasons provided); higher attrition rate in the intervention group. |
| Selective reporting (reporting bias) | Low risk | Predefined outcomes reported. |
| Other bias | Unclear risk | Multifactorial intervention with effect of prescribing on outcomes unclear. |
| Methods | Randomised controlled trial | |
| Participants | Women with signs of first trimester incomplete abortion at six healthcare facilities in six districts in rural, peri‐urban and urban settings in central Uganda Patients 1010, midwife group 506, physician group 504 Health professional delivering the intervention ‐ midwives involved in post‐abortion care at the facilities and who underwent a five day training module focusing on diagnosing incomplete abortion, treatment with misoprostol, manual vacuum aspiration, contraceptive methods and counselling | |
| Interventions | PATIENTS Clinical assessment and treatment with misoprostol by a physician or midwife Provision of analgesics (ibuprofen or paracetamol) and oral antibiotics according to national guidelines for post‐abortion care | |
| Outcomes | PATIENTS Abortion not needing surgical intervention within 14‐28 days after initial treatment | |
| Notes | ||
| Risk of bias | ||
| Bias | Authors' judgement | Support for judgement |
| Random sequence generation (selection bias) | Low risk | Computer random number generator to generate a list of codes with each code linked to one of the two study groups. |
| Allocation concealment (selection bias) | Low risk | Sequentially numbered opaque sealed envelopes used. |
| Blinding of participants and personnel (performance bias) | High risk | Not feasible with study design. |
| Blinding of outcome assessment (detection bias) | Unclear risk | Unclear if research assistants who were midwives measured primary and secondary outcomes and treated patients. |
| Incomplete outcome data (attrition bias) | Low risk | Low exclusion, 11 of 1010 women excluded after randomisation. Low loss to follow‐up. Per protocol and intention‐to‐treat population almost identical. |
| Selective reporting (reporting bias) | Low risk | Not evident. |
| Other bias | Low risk | Larger loss to follow‐up in the midwife group, but the difference with the physician group was small. |
| Methods | Randomised controlled trial (three arms, non‐inferiority design) | |
| Participants | Large general hospital and 18 GPs' practices in Noord Brabant, the Netherlands Children 6‐16 years old with moderate stable asthma using inhaled corticosteroid for at least 9 months prior to study Patients 107 (45 from general practice, 62 from hospital practice randomised in 3 arms to GP 37, paediatrician 34, asthma nurse 36) Health professional delivering intervention ‐ hospital‐based specialised asthma nurse No unit of analysis errors | |
| Interventions | PATIENTS To test non‐inferiority of care by a specialised asthma nurse versus standard care (GP or paediatrician) Nurse used guidelines of the Dutch Paediatric Association with support from a paediatrician at any time | |
| Outcomes | PATIENTS Lung function tests including ‐ airway hyper‐responsiveness ( PD20), FENO FEV1 Asthma control ‐ Asthma Control Questionnaire Exacerbations PROCESS Medication use ‐ dose, % use of long‐acting beta agonists/inhaled corticosteroid RESOURCE USE Planned visits Unplanned visits School absence Parental absence from work | |
| Notes | Two‐year follow‐up. The asthma nurse could consult the paediatrician at all times (15 (42%) of asthma nurse participants required a consultation with a paediatrician). Extra emergency visits as required. | |
| Risk of bias | ||
| Bias | Authors' judgement | Support for judgement |
| Random sequence generation (selection bias) | Low risk | Randomised computer‐generated list (stratified by type of treating physician before recruitment). |
| Allocation concealment (selection bias) | Low risk | Sealed numbered envelopes with designated follow‐up arms. |
| Blinding of participants and personnel (performance bias) | High risk | Not feasible with study design. |
| Blinding of outcome assessment (detection bias) | Low risk | Lung function parameters low risk but no mention of blinding assessors. Unclear if completion of questionnaire can be biased by group randomisation. |
| Incomplete outcome data (attrition bias) | Low risk | Attrition at 2 years ‐ GP 2/37, paediatrician 1/34, asthma nurse 3/36 (explanation provided). |
| Selective reporting (reporting bias) | Low risk | Predefined outcomes reported. |
| Other bias | Unclear risk | GPs with a special interest in paediatric asthma selected. Results may differ from an unselected sample of GPs. Consultations with paediatricians influence on outcomes. Unclear medical influence on nurse prescribing. |
| Methods | Randomised controlled trial | |
| Participants | Department of General Internal Medicine, Cleveland Clinic Foundation (a tertiary care teaching hospital) Ohio, USA Patients with mild or moderate hypertension and type 2 diabetes without end‐organ complications Patients 157 (nurse practitioner ‐ physician team 79 versus usual care (primary care physician) 78) Health professional delivering intervention ‐ nurse practitioner with training on use of treatment algorithms. Issues outside algorithms discussed with primary care physician | |
| Interventions | PATIENTS Chronic disease management involving nurse practitioner‐physician versus primary care physician Use of treatment algorithms, patient education on self‐management, monitoring and feedback primarily by nurse practitioner | |
| Outcomes | PATIENTS HbA1c HDL Satisfaction with care Health‐related quality of life ‐ Health Survey Short Form (SF‐12) Diabetes quality of life, PROCESS Preventive care (vaccinations, foot, eye exams) Patient education (e.g. smoking cessation, weight control, adherence) RESOURCE USE Costs for personnel involved in management Time spent | |
| Notes | 12‐month study. Team management beneficial effect on HDL. Effect on diabetic control disappeared 12 months after study completion. Study terminated at 16 months. Multifactorial intervention. | |
| Risk of bias | ||
| Bias | Authors' judgement | Support for judgement |
| Random sequence generation (selection bias) | Unclear risk | Not described. |
| Allocation concealment (selection bias) | Unclear risk | Not described. |
| Blinding of participants and personnel (performance bias) | High risk | Not feasible with study design. |
| Blinding of outcome assessment (detection bias) | Low risk | Laboratory values. BP assessment not blinded. Unclear if group allocation affected survey results. |
| Incomplete outcome data (attrition bias) | Low risk | Not evident. |
| Selective reporting (reporting bias) | Low risk | Predefined outcomes reported. |
| Other bias | High risk | Physicians involved in 216 (40%) of nurse practitioner visits. Influence of physician on prescribing unclear. |
| Methods | Randomised controlled trial | |
| Participants | Government or industry workplaces, Metropolitan Toronto, Canada Volunteers with untreated hypertension Patients 457 (232 worksite care by nurse, 225 regular care by family physician) Health professional delivering intervention ‐ two experienced nurses who were taught to treat hypertension according to a standard protocol. Nurses were allowed to prescribe and change drug therapy at the worksite without prior physician approval. Every week patient charts were reviewed at the hospital with the supervising physician No unit of analysis errors | |
| Interventions | PATIENTS Treatment of hypertension in the workplace by nurses versus treatment in the community by the family doctor Nurses saw their patients every two weeks if diastolic BP was 105 mmHg or higher or every month if less until target goal reached. Visits were then lengthened to two to three months | |
| Outcomes | PATIENTS Reduction in diastolic BP to less than 90 mmHg if entry BP > 95 mmHg or reduction in BP of at least 6 mmHg if entry diastolic BP of 95 mmHg or less Medication compliance | |
| Notes | 6‐month study. Comparing an intervention, not just prescribing versus standard care. | |
| Risk of bias | ||
| Bias | Authors' judgement | Support for judgement |
| Random sequence generation (selection bias) | Unclear risk | Eligible participants stratified for age, sex, diastolic BP and site of work and randomised within strata but no details of sequence generation given. |
| Allocation concealment (selection bias) | Unclear risk | Details not provided. |
| Blinding of participants and personnel (performance bias) | High risk | Not feasible with study design. |
| Blinding of outcome assessment (detection bias) | Low risk | BP ‐ work evaluations at 6 months were done by a specially trained BP technician who was unaware of group allocation. Insufficient information given on compliance questionnaire. Pill count at home cannot be 'unobtrusive'. |
| Incomplete outcome data (attrition bias) | Low risk | Explanation provided, dropouts or not having a 6‐month assessment ‐ worksite care by nurse 26/232, regular care 21/225. Intention‐to‐treat. |
| Selective reporting (reporting bias) | Low risk | Predefined outcomes reported. |
| Other bias | Unclear risk | Unclear whether weekly chart review by supervising physician had any influence on outcomes. Standard group measured less frequently. |
| Methods | Randomised controlled trial | |
| Participants | Hospital‐based diabetes service, Beaumont Hospital, Dublin, Ireland Patients with type 2 diabetes and one additional cardiovascular risk factor (smoking, persistent microalbuminuria or previously diagnosed macrovascular disease). Total cholesterol > 4.8 mmol/L or LDL > 2.6 mmol/L or BP > 130/80 mmHg or both. Patients were recruited if over 30 years, treated with diet, oral hypoglycaemic agents or treated with oral hypoglycaemic agents for at least 1 year prior to commencing insulin Patients 200 (intensive nurse‐led 101, standard care 99) Health professional delivering intervention ‐ nurse with 5 years experience as a diabetes nurse specialist and a higher diploma in diabetes | |
| Interventions | PATIENTS Intensive nurse‐led clinic versus standard diabetes management (annual review) in achieving recommended vascular risk reduction targets in patients with type 2 diabetes. Patients seen every 2‐3 months and annual review in the diabetes clinic At each visit lifestyle advice was reinforced (diet, weight reduction, exercise, alcohol consumption, smoking cessation). Patient feedback on achieving targets. Mediactions were titrated in response to BP, blood glucose readings, and biochemical results | |
| Outcomes | PATIENTS BP Total cholesterol LDL HDL Triglycerides HbA1c Weight Smoking Adverse events PROCESS Antihypertensive use Aspirin prescribing | |
| Notes | One‐year study. Difficult to evaluate which single intervention or combination of interventions responsible for risk reduction. | |
| Risk of bias | ||
| Bias | Authors' judgement | Support for judgement |
| Random sequence generation (selection bias) | Unclear risk | Standard randomisation table used. Patients randomised on the basis of the date of presentation for their first visit and last digit of their hospital number. |
| Allocation concealment (selection bias) | Unclear risk | Not reported. |
| Blinding of participants and personnel (performance bias) | High risk | Not feasible with study design. |
| Blinding of outcome assessment (detection bias) | Low risk | Laboratory values low risk. BP not reported as blinded. |
| Incomplete outcome data (attrition bias) | Low risk | Low attrition 7/101, 5/99. |
| Selective reporting (reporting bias) | Unclear risk | Predefined outcomes reported. |
| Other bias | Unclear risk | Confounding factors ‐ intensive education and more regular reviews. Multifactorial intervention with effect of prescribing on outcomes unclear. |
| Methods | Randomised controlled trial | |
| Participants | Ten Kaiser Permanente Colorado primary care clinics, USA Adults 18 to 79 years with a diagnosis of hypertension and their two most recent clinic BP readings were above goal, systolic BP ≥ 140 mmHg or diastolic BP ≥ 90mmHg (systolic BP ≥ 130 mmHg or diastolic BP ≥ 80 mmHg for DM or chronic kidney disease), were prescribed ≤ 3 antihypertensive medications, had a primary care provider at one of the 10 participating clinics and had access to a computer and Internet Patients 348 (175 intervention, 173 usual care) Health professional delivering intervention ‐ clinical pharmacy specialist (at least one at each clinic) No unit of analysis errors | |
| Interventions | PATIENTS A pharmacist‐led Heart360 Web enabled home BP monitoring (HBPM) verus usual care in patients with uncontrolled hypertension Both groups received the same educational material Clinical pharmacist reviewed current BP medications, provided counselling on lifestyle changes and adjusted or changed antihypertensive medications as needed. Patients measured and uploaded BP into web‐based monitoring programme 3 times per week. The clinical pharmacy specialist reviewed home BP measurements and adherence, made medication adjustments (initiate, change, adjust doses, order laboratory tests), communicated with patients via telephone or secure email. Medication changes were notified to the primary care physician | |
| Outcomes | PATIENTS Proportion of patients who attained their goal BP at 6 months Change in systolic and diastolic BP between baseline and 6 months Patient satisfaction Adherence PROCESS Change in antihypertensive medication intensity Ease of system use RESOURCE USE Clinic visits, emergency department visits, hospitalisations, telephone encounters, email encounters | |
| Notes | ||
| Risk of bias | ||
| Bias | Authors' judgement | Support for judgement |
| Random sequence generation (selection bias) | Low risk | A random allocation sequence was computer‐generated using stratified randomisation with an allocation ratio of 1:1. |
| Allocation concealment (selection bias) | Unclear risk | The sequence was concealed from the patient until the baseline visit. Concealment from investigators not described. |
| Blinding of participants and personnel (performance bias) | High risk | Blinding not feasible with study design. Patients self‐reported BP. Intervention and usual care patients could be treated by the same physician and may have treated usual care patients more aggressively. Primary care physicians consulted pharmacists for 22 usual care patients. |
| Blinding of outcome assessment (detection bias) | Low risk | BP at 6 months taken by a research assistant blinded to study group assignment using baseline measurement protocol. Baseline measurement by clinic nurse. |
| Incomplete outcome data (attrition bias) | Low risk | Intention‐to‐treat analysis of randomised patients and estimates made for data of 22 missing patients 9/173 usual care (5%), 13/175 (7%) intervention. |
| Selective reporting (reporting bias) | Low risk | Predefined outcomes reported. |
| Other bias | Unclear risk | Trend to higher mean baseline BP in intervention group. |
| Methods | Cluster‐randomised controlled trial | |
| Participants | Sixteen primary care clinics (Health Partners Medical Group), Minneapolis‐St Paul, Minnesota, USA Patients with uncontrolled BP (≥ 140/90 mmHg or ≥ 130/80 mmHg if diabetic or chronic kidney disease was present) Patients 450 adults (8 clinics telephone intervention 228, 8 clinics usual care 222) Health professional delivering intervention ‐ 4 doctoral pharmacists with 8 hours formal training on the study protocol and observed conducting a telephone visit on two occasions. Clinical practice agreements allowed pharmacists to prescribe and change antihypertensive therapy within specified parameters | |
| Interventions | PATIENTS Home BP telemonitoring with pharmacist case management of BP versus usual care Patients were instructed to transmit at least 6 BP measurements weekly. During the first 6 months patients and pharmacists met every 2 weeks via telephone until BP was sustained for 6 weeks then reduced to monthly. During intervention months 7 to 12, telephone visits occurred every 2 months. After 12 months telemonitoring was discontinued and patients' care was returned to their primary care physician with no support from a study pharmacist During telephone visits pharmacists emphasised lifestyle change, and medication adherence. They assessed and adjusted antihypertensive drug therapy based on an algorithm using the percentage of home BP readings meeting goal ( ≥ 75% no change, ≤ 75% treatment intensification). If the patient experienced adverse effects the dose would be lowered or drugs switched. Usual care could include referral by the primary care physician to a pharmacist for medication management | |
| Outcomes | PATIENTS Control of systolic BP to less than 140 mmHg and diastolic BP to less than 90 mmHg at 6 and 12 months (< 130/80 mmHG in patients with diabetes or chronic kidney disease) Change in BP Quality of life (Medical Outcomes Study Short Form‐12 V2) Self‐efficacy for measuring BP Patient satisfaction (six items from the Consumer Assessment of Healthcare Providers and Systems adult survey v4) BP control at 18 months Adherence (Morisky scale) Safety and adverse effects (hospitalisations, emergency department visits, urgent care, same day medical visits for BP problems, hypotension, fainting, loss of consciousness and allergic reactions) PROCESS Medication use (number and type) RESOURCE USE Programme costs per patient | |
| Notes | 12‐month intervention and 6 months follow‐up. | |
| Risk of bias | ||
| Bias | Authors' judgement | Support for judgement |
| Random sequence generation (selection bias) | Low risk | Cluster‐randomisation (clinics matched by size and clinic BP control at baseline). |
| Allocation concealment (selection bias) | High risk | Not possible to conceal. |
| Blinding of participants and personnel (performance bias) | High risk | Not feasible with study design after randomisation. |
| Blinding of outcome assessment (detection bias) | Unclear risk | At 6, 12, 18 months research staff were not blinded to study group but trained to treat both groups identically. Record of medication events reviewed independently. |
| Incomplete outcome data (attrition bias) | Low risk | Low attrition at follow‐up visits 6 months, 90% telemonitoring, 89% usual care. 12 months 86% both groups. 18 months 82% both groups. |
| Selective reporting (reporting bias) | Unclear risk | Predefined outcomes reported. |
| Other bias | Unclear risk | Difficult to distinguish effect of telemonitoring from pharmacist case management. Participants generally well‐educated with higher‐income levels (not representative of broader community). |
| Methods | Randomised controlled three arm parallel‐group trial | |
| Participants | John Hunter Hopsital. New South Wales. Australia Elective surgical patients taking regular medications with a postoperative stay of one night or more Patients 357 (control 118, pharmacist medication history 119, pharmacist medication history and prescribing 120) Healthcare delivering intervention ‐ pharmacist | |
| Interventions | PATIENTS Pharmacist medication history and supplementary prescribing versus pharmacist medication history versus usual care to determine whether the number of missed doses of regular medication was significantly different between the three arms The pharmacist medication history in both groups was taken at the time of admission on the day of surgery. In the supplementary prescribing group the pharmacist prescribed the patients' regular medicines on the inpatient medication chart (without medical review). Local protocols guided which medications were to be withheld and for how long for each type of surgery | |
| Outcomes | PATIENTS Reduction in the number of medication doses missed inappropriately during the inpatient stay The number of medications charted at an incorrect dose The number of medications charted at an incorrect frequency The number of missed doses postoperatively of significant medications (beta blockers, HMG‐CoA reductase inhibitors, antiplatelets, anticoagulants) | |
| Notes | Training/experience not stated, numbers of pharmacists not specified. 5‐month study. | |
| Risk of bias | ||
| Bias | Authors' judgement | Support for judgement |
| Random sequence generation (selection bias) | Low risk | Patients were randomised via a computer‐generated list. |
| Allocation concealment (selection bias) | Unclear risk | List held by an independent investigator. |
| Blinding of participants and personnel (performance bias) | High risk | Not feasible with study design. |
| Blinding of outcome assessment (detection bias) | Low risk | Outcome measures were collected after discharge by an independent technician (retrospective chart review and patient records). |
| Incomplete outcome data (attrition bias) | Low risk | Cancelled surgery or lost to follow‐up: control 9/118, pharmacist medication history 10/119, pharmacist medication history and supplementary prescribing 8/120. Intention‐to‐treat analysis. Patients who had surgery cancelled had no postoperative data and were excluded from part of the analysis. |
| Selective reporting (reporting bias) | Unclear risk | Predefined outcomes reported. |
| Other bias | Unclear risk | Post‐discharge taking of the medication history over the phone in the control group may have resulted in medications being omitted from the medication history. Reasons were not collected for missed doses (potentially missing appropriate reasons). |
| Methods | Randomised controlled trial | |
| Participants | Stroke prevention clinics Edmonton, Alberta, Canada Patients older than 18 years who had an ischaemic stroke or transient ischaemic attack confirmed by a stroke specialist at one of 3 stroke prevention clinics Patients 279 (pharmacist intervention 143, nurse control 136) Health professional delivering intervention ‐ 4 pharmacists ‐ no standardised training but similar career stage | |
| Interventions | PATIENTS Nurse‐led case management from a stroke prevention clinic i.e. screening, monthly visits, and feedback to primary care physician (the control) versus pharmacist‐led case management with active prescribing (intervention) Pharmacists saw patients monthly for 6 months. Pharmacists performed same tasks as nurses in the control arm as well as initiating or titrating antihypertensive and or lipid‐lowering therapy using treatment algorithms and targets. The nurse in the control arm saw patients monthly and provided lifestyle advice (exercise, low‐salt diet, smoking cessation, medication adherence) and checked BP and LDL | |
| Outcomes | PATIENTS The proportion of participants at 6 months who attained optimal BP & lipid control (systolic BP < 140 mmHG & fasting LDL ≤ 2 mmol/L) Mortality Self‐reported adherence BMI Smoking status Quality of life (EQ‐5D) Disability (Modified Rankin score) Overall self‐rated health Overall rating of health satisfaction Physical activity Adverse events PROCESS Medication (changes, numbers, type) | |
| Notes | 6‐month study. | |
| Risk of bias | ||
| Bias | Authors' judgement | Support for judgement |
| Random sequence generation (selection bias) | Low risk | Randomisation was done centrally by use of computer‐generated random numbers with variable‐sized block randomisation stratified by stroke prevention clinic to preserve allocation concealment. |
| Allocation concealment (selection bias) | Low risk | Secure Internet‐based allocation method that ensures allocation concealment from research personnel. |
| Blinding of participants and personnel (performance bias) | High risk | Not feasible with study design. All participants and nurses/pharmacists/doctors aware of treatment groups. |
| Blinding of outcome assessment (detection bias) | Low risk | The primary and secondary outcomes collected and analysed in an independent and blinded manner by research personnel who were not involved in the patient's care and blinded to patient's randomisation group and baseline measurements. Laboratory measurements independently analysed. |
| Incomplete outcome data (attrition bias) | Unclear risk | 31/143 (22%) excluded form intervention versus 9/136 (7%) from control (reasons provided) but unlikely to bias result as similar numbers remained in the trial, 130 intervention and 136 nurse control. Intention‐to‐treat analysis. Bias toward the null hypothesis as data for 225/279 patients. |
| Selective reporting (reporting bias) | Low risk | Predefined outcomes reported. |
| Other bias | Unclear risk | Multifactorial intervention with effect of prescribing on outcomes unclear. |
| Methods | Cluster‐randomised controlled trial | |
| Participants | 21 general practices, Warwickshire, England Practice level randomisation 7 audit, 7 GP recall, 7 nurse recall Patients aged 55 to 75 with established CHD Patients at final audit 1906 (559 audit, 682 GP recall, 665 nurse recall) Health professional delivering intervention ‐ nurse in the nurse recall arm who received education to implement guidelines for secondary prevention | |
| Interventions | PATIENTS Assessing three different methods of promoting secondary prevention of CHD in primary care Audit group (audit of notes and summary feedback to primary healthcare team) versus GP recall group (disease register and systematic recall to GP) versus nurse recall group (disease register and patient recall to nurse‐led clinic). Agreed clinic protocol for secondary prevention. | |
| Outcomes | PATIENTS 3 risk factors (BP target, cholesterol, smoking status) BP > 140 mmHg systolic BP or > 90 mmHg diastolic BP Cholesterol ≥ 5.5 mmol/L Continine levels Quality of life (Dartmouth COOP charts, EuroQol scores) PROCESS Prescribing (antihypertensives, lipid‐lowering drugs, antiplatelet drugs) | |
| Notes | 18‐month study. | |
| Risk of bias | ||
| Bias | Authors' judgement | Support for judgement |
| Random sequence generation (selection bias) | Low risk | Randomisation based on computer‐generated random numbers. |
| Allocation concealment (selection bias) | Low risk | Randomisation was carried out under observation of a statistician blind to the identity of the practice. |
| Blinding of participants and personnel (performance bias) | High risk | Not feasible with study design. |
| Blinding of outcome assessment (detection bias) | Low risk | Laboratory values and BP carried out by a research nurse blind to allocation group and no previous involvement. |
| Incomplete outcome data (attrition bias) | Unclear risk | Attrition at follow‐up. Proprtions adequately assessed: nurse recall 85% (556/665), GP recall 76% (521/682) audit group, audit group 52% (293/559). |
| Selective reporting (reporting bias) | Low risk | Not apparent. |
| Other bias | Unclear risk | Unclear autonomy of nurse prescribing in nurse recall group. |
| Methods | Randomised controlled trial | |
| Participants | Hope Hospital, Salford, UK Patients with diabetes and raised BP (≥ 140/80 mmHg) or raised total cholesterol (≥ 5.0 mmol/L) or both. Patients were receiving shared care with their GP and Hope Hospital for their annual diabetes review Patients 1407 (nurse hypertension clinic 506, usual care 508, nurse hyperlipidaemia clinic 345, usual care 338) Health professional delivering intervention ‐ two nurse specialists, trained to degree level and previous experience of managing diabetes, hypertension and dyslipidaemia and patient education. Local training by clinicians | |
| Interventions | PATIENTS Independent specialist nurse‐led clinics (one for hypertension, one for hyperlipidaemia) versus usual care Patients were randomised to receive the hypertension or hypercholesterolaemia interventions separately and patients with both were randomised to one intervention and were a control for the other Nurses provided lifestyle advice, and titration of drug therapies according to local guidelines. Patients attended nurse‐led clinics every 4‐6 weeks until targets were achieved. Lifestyle modifications were reinforced and medications titrated according to response. The specialist nurse discussed patients who required additional medications with the doctor who initiated additional therapy when appropriate. The protocol forbade the nurse from managing the other intervention e.g. cholesterol in the BP arm | |
| Outcomes | PATIENTS The odds ratio of achieving targets in hypertension and hyperlipidaemia attributable to the specialist nurse‐led intervention Cholesterol control BP control Adverse events ‐ mortality | |
| Notes | 12‐month study | |
| Risk of bias | ||
| Bias | Authors' judgement | Support for judgement |
| Random sequence generation (selection bias) | Low risk | Remote randomisation service. Separate randomisation's for each condition. |
| Allocation concealment (selection bias) | Low risk | Fully concealed process. Emailed randomisation to respective nurses. |
| Blinding of participants and personnel (performance bias) | High risk | Not feasible with study design. |
| Blinding of outcome assessment (detection bias) | Low risk | Data abstracted at 1‐year by staff blinded to allocation. Laboratory measurement low risk. |
| Incomplete outcome data (attrition bias) | Unclear risk | BP clinic attrition 99/506 (19.6%) usual care 132/508 (26%). Lipid clinic 34/345 (9.8%), usual care 41/338 (12%). Intention‐to‐treat. |
| Selective reporting (reporting bias) | Low risk | None apparent. |
| Other bias | Unclear risk | Nurse discussed additional therapies with doctor who initiated them when appropriate. |
| Methods | Cluster‐randomised controlled trial | |
| Participants | Eighteen nurse‐led health centres in Khon Kaen, Thailand Practice ‐ 18, matched pairs, 9 intervention, 9 control, 220 patients per centre Health centre unit of allocation and analysis | |
| Interventions | PROVIDERS Education and implementation of prescribing and clinical guidelines by nurses in rural health centres versus usual nurse care Intervention centres received an initial 3‐day training course around four clinical guidelines. For children ‐ acute respiratory infections and diarrhoea, for adults ‐ diazepam prescribing and management of diabetes mellitus. Training strategies were lectures, group discussions, role‐play and presentations. Educational outreach visits by nurse supervisors occurred 3‐4 months after training. Each visit lasted 1.5‐2 hours with discussion on use of the guidelines, problems, adequacy of drugs and equipment. Random auditing and feedback followed | |
| Outcomes | PROCESS Antibiotic prescribing Diazepam prescribing Prescribing costs per patient PATIENT Management of diabetes | |
| Notes | 6‐month study. Analysis adjusted for clustering effect. | |
| Risk of bias | ||
| Bias | Authors' judgement | Support for judgement |
| Random sequence generation (selection bias) | Low risk | Eighteen nurse‐led health centres were matched and sent to the second author blind to the identity of the health centres, to allocate at random into nine intervention and nine control centres using random number tables. |
| Allocation concealment (selection bias) | Unclear risk | Randomisation per centre. Author could not foresee allocation using random number tables. The choice of intervention sites was concealed from health centre staff. |
| Blinding of participants and personnel (performance bias) | Unclear risk | While the intervention site was concealed from staff they would have been aware through training that they were an intervention site and this may have affected performance. Similarly control centres would be aware of their status. |
| Blinding of outcome assessment (detection bias) | Unclear risk | Random selection of patient records but unclear who undertook the assessment. |
| Incomplete outcome data (attrition bias) | Low risk | Data reported for all centres. |
| Selective reporting (reporting bias) | Low risk | Not evident. |
| Other bias | Unclear risk | Diabetes management outcome ‐ limited data. |
| Methods | Randomised controlled trial | |
| Participants | Two primary care medical clinics, Kaiser Permanente Mountain View Clinic and Primary Care Clinics of the Standford University Medical Center, California, USA Patients with hypertension eligible for drug therapy (threshold 150 mmHg systolic BP, 95 mmHg diastolic BP or both) Patients 150 (usual care plus nurse management intervention 74, usual care 76) Health professional delivering intervention ‐ nurse | |
| Interventions | PATIENTS Nurse‐managed home‐based management of hypertension versus usual care Nurse care manager counselled intervention patients on use of automated BP device and reporting, drug adherence and recognition of side‐effects. Printed material provided. Follow‐up phone contacts 1 week and 1, 2, 4 months. Patients could phone the nurse with questions or concerns. Patients monitored their BP twice a day The nurse used standardised algorithms to modulate drug therapy based on patients' reports of home BP. The nurse contacted the physician to obtain permission to initiate any new BP drug but could change medication dosage. When 80% of home BP reading achieved 130/85 mmHg over 2 weeks no further changes to drug therapy were made. The cardiologist could be consulted by phone about problematic cases | |
| Outcomes | PATIENTS Change in BP from baseline to 6‐month visit Adherence PROCESS BP medication use (number, variety, changes) Frequency of drug changes | |
| Notes | 6‐month study. | |
| Risk of bias | ||
| Bias | Authors' judgement | Support for judgement |
| Random sequence generation (selection bias) | Low risk | Randomisation using computer‐generated assignment. |
| Allocation concealment (selection bias) | Unclear risk | Not specified. |
| Blinding of participants and personnel (performance bias) | High risk | Not feasible with study design. |
| Blinding of outcome assessment (detection bias) | Low risk | At 3 and 6 months a research assistant blinded to group assignment measured clinic BP and interviewed patients about medications taken. |
| Incomplete outcome data (attrition bias) | Low risk | 8 patients (6%) in usual care group and 5 patients (4%) in the intervention group were classed as dropouts at 6 months. Reasons provided. |
| Selective reporting (reporting bias) | Low risk | None apparent. |
| Other bias | Unclear risk | Effect of medical advice and approval of new drugs on BP and nurse prescribing. Reported < 5% of treatment decisions required telephone discussions with the physician. |
| Methods | Randomised controlled trial | |
| Participants | Two family practices, Ontario, Canada Families 1598 (4325 members), nurse practitioner group 540 families (1529 members), conventional group 1058 families (2769 members) Health professional delivering intervention ‐ two nurse practitioners who attended special training conducted by the schools of nursing and medicine at McMaster University to become co‐practitioners | |
| Interventions | PATIENTS Nurse practitioners versus physicians plus conventional nurse in primary care | |
| Outcomes | PATIENTS Quality of care (assessing 10 indicator conditions and the manner in which 13 common drugs were prescribed) Health status Satisfaction with health service Deaths PROVIDERS Clinical judgement (management of ten indicator conditions and prescribing of 13 common drugs) Clinician activities PROCESS Practice activities RESOURCE USE Financial performance | |
| Notes | 12‐month experimental period (12‐month follow‐up). | |
| Risk of bias | ||
| Bias | Authors' judgement | Support for judgement |
| Random sequence generation (selection bias) | Low risk | Eligible families were stratified by practice of origin and randomly allocated in a ratio of 2:1. |
| Allocation concealment (selection bias) | Unclear risk | Concealment not specified. |
| Blinding of participants and personnel (performance bias) | High risk | No feasible with study design. |
| Blinding of outcome assessment (detection bias) | Low risk | Interviewers and data gatherers divorced from experimental participant. |
| Incomplete outcome data (attrition bias) | Low risk | Attrition ‐ only seven families out of 1598 eligible families refused their assignment (two conventional, five nurse practitioner group). |
| Selective reporting (reporting bias) | Low risk | Predefined outcomes reported. |
| Other bias | High risk | Doctors involved in high percentage of nurse practitioner visits. Unclear effects on prescribing. |
| Methods | Randomisd controlled trial | |
| Participants | Ambulatory care clinic ‐ Providence Veterans Affairs Medical Center, Rhode Island, USA Veterans 18 years or older with type 2 diabetes with HbA1c between 7% and 9% within the last 6 months and willing to participate and discuss their diabetes and cardiac risk factors in a group setting Patients 109 (58 intervention, 51 usual care) Health professional delivering intervention ‐ clinical pharmacist who completed one year of postdoctoral pharmacy practice residency as well as certification in diabetes education and physical assessment and underwent 6 months of clinic‐based internist‐supervised pharmacologic management of diabetes, dyslipidaemia, and hypertension) No unit of analysis errors | |
| Interventions | PATIENTS A pharmacist‐led Veterans affairs Multidisciplinary Education and Diabetes Intervention for Cardiac risk reduction (VA‐MEDIC) plus usual care versus usual care VA‐MEDIC consisted of 4 weekly 2‐hour sessions in a classroom setting with 4 to 8 participants. Family and friends could attend. Each session consisted of two parts. Part 1: Education session of 40‐60 minutes provided by nurse, nutritionist, physical therapist or pharmacist focused on 1 or 2 diabetes self‐care behaviours. Part 2: A behavioural and pharmacologic intervention of 60‐80 minutes conducted by a clinical pharmacist who treated hypertension, dyslipidaemia & tobacco use. Medication titration based on algorithms | |
| Outcomes | PATIENTS Percentage of patients attaining target goals for HbA1c (< 7%), BP (systolic BP < 130 mmHg, diastolic BP < 80 mmHg), non‐HDL cholesterol < 3.4 mmol/L, LDL cholesterol < 2.6 mmol/L, smoking cessation Self‐care behaviours PROCESS Medication changes | |
| Notes | Data obtained from the electronic medical record at 4 months. Small number of smokers. | |
| Risk of bias | ||
| Bias | Authors' judgement | Support for judgement |
| Random sequence generation (selection bias) | Low risk | Participants were assigned to intervention arm or standard care using a simple coin toss randomisation. |
| Allocation concealment (selection bias) | Unclear risk | Method of concealment not described. |
| Blinding of participants and personnel (performance bias) | High risk | Not feasible with study design. |
| Blinding of outcome assessment (detection bias) | Low risk | Outcome group: no blinding but physiological outcomes unlikely to be influenced by lack of blinding. |
| Incomplete outcome data (attrition bias) | Low risk | Intention‐to‐treat analysis. Low attrition 6/64 intervention (9%) and 3/44 (7%) standard care withdrew. Data on self‐care behaviours not formally collected. |
| Selective reporting (reporting bias) | Low risk | Predefined outcomes reported. |
| Other bias | High risk | Self‐care behaviours survey not validated. Population white male Veterans. Limited duration of 4‐week intervention and 4‐month follow‐up. Multifactorial intervention with effect of prescribing on outcomes unclear. |
| Methods | Randomised controlled trial | |
| Participants | Ambulatory care clinic ‐ Providence Veterans Affairs Medical Center, Rhode island, USA Veterans with type 1 and type 2 diabetes with HbA1c > 6.5% within the last 6 months and concomitant depression as defined by the International Classification of Diseases (ICD) codes 311, 296.2 and 296.3 who were willing to participate and discuss their diabetes and cardiovascular risk factors in a group setting and able to provide written informed consent Patients 86 (44 intervention, 42 standard care) Zero type 1 diabetic patients recruited Health professional delivering intervention ‐ a clinical pharmacist who had at least 1 year of ambulatory care/clinical training experience and was certified in diabetes education at state or national level | |
| Interventions | PATIENTS Veterans Affiars Multidisciplinary Education in Diabetes and Intervention in for Cardiac Risk Reduction in Depression (VA‐MEDIC‐D) plus standard care versus standard care VA‐MEDIC‐D consisted of participants attending 4 once‐weekly sessions of 2 hours followed by 5 monthly booster 90‐minute group sessions held in a classroom with 4‐6 participants. Family friends could attend Each session consisted of two parts. Part 1: Standardised education session of 40‐60 minutes by a nurse, nutritionist, clinical pharmacist focusing on 1 or 2 self‐care behaviours e.g. goals for healthy eating Part 2: Pharmacist conducted behavioural and pharmacologic intervention for hypertension, hyperlipidaemia, hyperglycaemia and tobacco use. 60‐80 minute sessions. A group assessment of daily self‐care activities was made and self‐care enhanced through group counselling. Individual risk report of laboratory tests and medication was reviewed and drugs initiated or titrated by the pharmacist according to established algorithms for BP, cholesterol, diabetes and tobacco cessation. The pharmacist undertook behavioural change goal setting. No changes were made for psychiatric medications | |
| Outcomes | PATIENTS Change in the proportion of participants who attained a HbA1c < 7% at 6 months Proportion of participants who attained ADA guidelines for BP and fasting lipids and the absolute change in values Self‐care (Perceived Competence for Diabetes Scale PCDS) Adherence to self‐care behaviours (Summary of Diabetes Self‐Care Activities SDSCA) Change from baseline in depression symptoms (assessed by the Patient Health Questionnaire ‐PHQ9) even though depression treatment was not part of the intervention Deaths RESOURCE USE Emergency department visits and hospitalisations | |
| Notes | Complex multifactorial intervention. 6‐month study. | |
| Risk of bias | ||
| Bias | Authors' judgement | Support for judgement |
| Random sequence generation (selection bias) | Low risk | Participants were assigned to intervention arm or standard care using a simple coin toss randomisation. |
| Allocation concealment (selection bias) | Unclear risk | Method of concealment not described. |
| Blinding of participants and personnel (performance bias) | High risk | Not feasible with study design. |
| Blinding of outcome assessment (detection bias) | Low risk | No blinding of assessment but outcome (HbA1c), cholesterol unlikely to be influenced by lack of blinding. Unclear who measured BP. It is unclear if response to questionnaires were influenced by the group allocation. |
| Incomplete outcome data (attrition bias) | Low risk | Intention‐to‐treat analysis. 0/44 intervention and 2/44 standard care lost to follow‐up. |
| Selective reporting (reporting bias) | Low risk | Predefined outcomes reported. |
| Other bias | Unclear risk | Multifactorial intervention with effect of prescribing on outcomes unclear. |
| Methods | Controlled before‐and‐after study | |
| Participants | A purposively selected skilled nursing facility, Los Angeles, USA Patients in a skilled nursing care facility with a length of stay > 2 months Patients, pre‐study year (treatment group 60, control group 75). Study year (pharmacist treatment group 67, control group 72) Health professional delivering intervention ‐ two clinical pharmacists who were University of Southern California School of Pharmacy faculty members with six or more years experience in clinical patient care. Each was trained in physical assessment and basic diagnostic skills | |
| Interventions | PATIENTS Drug therapy prescribing and patient care management by clinical pharmacists versus usual care Each patient's medical, social, functional and drug history was reviewed. Physical assessment was performed. Appropriate laboratory tests ordered and physical assessment parameters determined. Medications were reviewed with the options of continuing present medications, making dose adjustments or entirely discontinuing or changing the type or class of medication. Patients were examined monthly. Supervising physician refrained from prescribing any medications, changing any of the clinical pharmacists orders or ordering any drug‐related laboratory tests | |
| Outcomes | PATIENTS Deaths RESOURCE USE Average number of drugs per patients Discharge to lower level care Hospitalisations | |
| Notes | 12‐month study. | |
| Risk of bias | ||
| Bias | Authors' judgement | Support for judgement |
| Random sequence generation (selection bias) | High risk | Participants could not be randomly assigned to treatment or control groups because of logistic limitations imposed by the organisation of medical care. Control and treatment patients were matched with no significant differences between the pre‐study year and study years for sex, age, length of stay, number of medications, diagnoses, discharge rate, hospitalisations, and mortality rate. |
| Allocation concealment (selection bias) | High risk | As above. |
| Blinding of participants and personnel (performance bias) | High risk | Not feasible with study design. |
| Blinding of outcome assessment (detection bias) | Low risk | Numerical counts with low risk of bias. |
| Incomplete outcome data (attrition bias) | Low risk | Data complete. |
| Selective reporting (reporting bias) | Low risk | Predefined outcomes reported. |
| Other bias | Unclear risk | Different physicians were involved in both groups and some improved treatment effects potentially due to the influence on and collaboration with prescribing pharmacist. |
| Methods | Randomised controlled trial (open‐label study with 2 parallel groups) | |
| Participants | Battlefords Tribal Council Indian Health Services, Saskatchewan, Canada First Nations people 18 and older with existing hypertension (systolic BP ≥ 130 mmHg, diastolic BP ≥ 80 mmHg) and diabetes Patients 99 (intervention 50, control 49) ‐ included in analysis: 48 intervention, 47 control Healthcare professional delivering intervention ‐ home care nurse following a predefined treatment algorithm of pharmacologic antihypertensive therapy. Hypertension specialist consulted if BP not controlled or for accelerated titration No unit of analysis errors | |
| Interventions | PATIENTS Community‐based treatment strategy implemented by home care nurses to control hypertension versus home care visits and follow‐up by primary care physicians Patients seen at baseline, 6 weeks, 3, 6, 9, 12 months | |
| Outcomes | PATIENTS Difference between the groups in the change in systolic BP after 12 months All participants received healthy lifestyle classes Change in diastolic BP Change in urine albumin Adverse events | |
| Notes | 12‐month study. | |
| Risk of bias | ||
| Bias | Authors' judgement | Support for judgement |
| Random sequence generation (selection bias) | Low risk | Randomisation used a permuted block design stratified by the seven reserves. |
| Allocation concealment (selection bias) | Low risk | Randomisation was performed by means of opaque sealed envelopes opened at the end of the baseline visit by the home care nurse in the presence of the physician and patient. |
| Blinding of participants and personnel (performance bias) | High risk | Not feasible with study design. Randomisation opened in front of home care nurse, physician, patient. |
| Blinding of outcome assessment (detection bias) | Unclear risk | BP taken by home care nurses. Low risk ‐ laboratory tests. |
| Incomplete outcome data (attrition bias) | Low risk | Intention‐to‐treat. 2 participants withdrew from both intervention and control groups (reasons provided and participants not included in analysis). Intervention analysis includes 1 lost to follow‐up and 3 stopped, control 2 lost to follow‐up and 3 stopped intervention. |
| Selective reporting (reporting bias) | Low risk | Predefined outcomes reported. |
| Other bias | Unclear risk | Unclear level of influence of the supervising hypertension specialist on nurse titration of medication. Both groups shared family physicians. |
| Methods | Randomised controlled trial | |
| Participants | Twenty‐three sites (community pharmacies, hospital outpatient clinics, primary care settings) in Alberta, Canada Community pharmacists (20), hospital pharmacists (2) primary care clinic pharmacists (6) Adults with uncontrolled BP as defined by Canadian Hypertension Education Program guidelines (140/90 mmHg for most and130/80 mmHg for those with diabetes) Patients 248 (181 intervention, 67 usual care) Healthcare professional delivering intervention ‐ pharmacists with authorisation to prescribe (Health Professions Act of Alberta) entailing a minimum of one year of practice experience and completion of an application process to demonstrate skills in patient assessment, judgement, care planning and follow‐up. Prescribing decisions required to be communicated to the patient's primary care physician. Pharmacists received training in BP assessment and treatment and had access to hypertension experts for consultation as required | |
| Interventions | PATIENTS Pharmacist prescribing for community‐dwelling patients with uncontrolled hypertension versus usual care BP control by pharmacist care (assessment of and counselling about cardiovascular risk and BP control, review of antihypertensive medications and prescribing/titrating drug therapy, BP wallet record card, lifestyle advice, written information) | |
| Outcomes | PATIENTS Change in systolic BP from base line to 6 months between intervention and usual care Change in diastolic BP Number of patients at Canadian Hypertension Education Program target RESOURCE USE Number of new antihypertensive medication starts Number of antihypertensive dose changes Number of antihypertensive drug changes Number of new prescriptions for aspirin and cholesterol‐lowering medications | |
| Notes | 6‐month study. | |
| Risk of bias | ||
| Bias | Authors' judgement | Support for judgement |
| Random sequence generation (selection bias) | Low risk | Centralised secure website (EPICORE). |
| Allocation concealment (selection bias) | Unclear risk | Method of concealment not described. |
| Blinding of participants and personnel (performance bias) | High risk | Not feasible with study design. |
| Blinding of outcome assessment (detection bias) | Unclear risk | Performed by patients via automated device, study pharmacists requested to leave room. |
| Incomplete outcome data (attrition bias) | Low risk | While sample size of 340 in protocol was not reached due to funding limits this affected the remuneration substudy, not the main study with a priori sample size of 240. Attrition 26 (14%) intervention, 6 (9%) usual care. |
| Selective reporting (reporting bias) | Low risk | Not evident. |
| Other bias | Unclear risk | The usual care group received pharmacist education at the discretion of the pharmacist and BP measurement at three months in addition to usual medical care which may represent greater than usual care. Intervention patients were seen more frequently. Cluster‐randomisation not employed. Effect of fee for service. |
| Methods | Randomised controlled trial | |
| Participants | 723 patients who were at high risk of cardiovascular events in 56 community pharmacies in Alberta, Canada Adults with diabetes, chronic kidney disease, atherosclerotic vascular disease, primary prevention patients with multiple risk factors. Subjects had at least one uncontrolled risk factor, BP > 140/90 mmHg or > 130/80 mmHg if diabetic, LDL‐c > 2.0 mmol/L, HbA1c > 7% or current smoker Patients 723 (370 pharmacist intervention, 353 usual pharmacist/physician care) Healthcare professional delivering intervention ‐ community pharmacists prescribing within their scope of practice and undergoing an online training programme in cardiovascular risk reduction | |
| Interventions | PATIENTS The pharmacist intervention group received a medication therapy management consultation comprising a patient assessment, laboratory assessment and individualised assessment with education. Pharmacists prescribed medications and ordered laboratory tests as per their scope of practice to achieve treatment targets. Patients received monthly follow‐up visits for three months | |
| Outcomes | PATIENTS Change in risk for cardiovascular disease events at 3 months Improvement in LDL Improvement in systolic BP Improvement in HbA1c Improvement in smoking cessation | |
| Notes | The study duration was 3 months. | |
| Risk of bias | ||
| Bias | Authors' judgement | Support for judgement |
| Random sequence generation (selection bias) | Low risk | Patients were randomised in a 1:1 ratio to intervention or usual care groups using a centralised secure website (EPICORE). |
| Allocation concealment (selection bias) | Unclear risk | Method of concealment not described. |
| Blinding of participants and personnel (performance bias) | High risk | Not feasible with study design. |
| Blinding of outcome assessment (detection bias) | Unclear risk | Low risk laboratory tests. Unclear risk with BP assessment. |
| Incomplete outcome data (attrition bias) | Low risk | Loss to follow‐up or withdrawals 2.8% usual care, 5.1% intervention group. |
| Selective reporting (reporting bias) | Low risk | Not evident. |
| Other bias | Unclear risk | Limited duration study of 3 months. |
| Methods | Randomised controlled trial | |
| Participants | General medicine clinic for the management of hypertension at a Veterans Affairs Medical Center, Philadelphia, USA Patients over 18 years with a confirmed diagnosis of essential hypertension (systolic BP > 140 mmHg or diastolic BP > 90 mmHg), receiving antihypertensive drug therapy and BP > 140/90 mmHg), receiving all drugs from the VA Medical Center pharmacy and not receiving care at the pharmacist‐managed clinic Patients 56 (27 intervention, 29 control) Health professional delivering intervention ‐ one pharmacist Practice ‐ 1 No unit of analysis errors | |
| Interventions | PATIENTS BP control in a pharmacist‐managed hypertension clinic versus traditional care from a primary care physician Patients were scheduled to meet monthly with the pharmacist who had prescribing authority to make appropriate changes in prescribed drugs, adjust dosages, and provide drug counselling in accordance with guidelines. The pharmacist did not make changes in other drugs that may affect BP. Primary care providers cared for comorbid conditions but could not change antihypertensive medication Control group ‐ care from traditional pharmacy services and primary care providers as needed (at least once a year) | |
| Outcomes | PATIENTS BP Changes in compliance ‐ compliance evaluation survey Patient satisfaction Quality of life (Medical Outcomes Study Short Form‐36 survey) | |
| Notes | Study period 6 months. | |
| Risk of bias | ||
| Bias | Authors' judgement | Support for judgement |
| Random sequence generation (selection bias) | Unclear risk | Sequence generation not described 'patients were randomly assigned'. |
| Allocation concealment (selection bias) | Unclear risk | Concealment process not described. |
| Blinding of participants and personnel (performance bias) | High risk | Not feasible with study design. |
| Blinding of outcome assessment (detection bias) | Unclear risk | Measurement of BP at start and end undertaken 'by a clinical pharmacist' (one of three). Patient completed surveys. Unclear effect of filling satisfaction forms in the pharmacy clinic and influence of group to which patient randomised. Compliance evaluation questionnaire not validated. |
| Incomplete outcome data (attrition bias) | Low risk | Low attrition. Two patients in the control group withdrew, 2/29, one in the intervention arm, 1/27. Reasons provided. No intention‐to‐treat analysis. |
| Selective reporting (reporting bias) | Low risk | All predefined outcomes reported. |
| Other bias | Unclear risk | Monthly follow‐up in intervention arm versus 'at least yearly' in the control arm. Most patients African Americans and all men. |
| Methods | Randomised controlled trial | |
| Participants | Diabetes Centre, Aintree University Hospitals, Liverpool, England Patients > 18 years with type 1 diabetes for at least 5 years, HbA1c ≥ 8%, and at least one other risk factor for the development of cardiovascular disease Patients 81 (nurse‐led group 40, routine group 41) Health professional delivering intervention ‐ single diabetes nurse consultant in an outpatient clinic No unit of analysis errors | |
| Interventions | PATIENTS Nurse‐led cardiovascular risk reduction versus routine care with review by doctors in a diabetes clinic with follow‐up and referral to the multidisciplinary team for diabetes control problems. In nurse‐led management included lifestyle advice, information and advice on injection technique, and pharmacological interventions (glycaemic control, hypertension, lipids). Management was protocol driven on a 'treat to target' basis. Changes in medications were made by a letter to the GP with a copy to the patient. In usual care recommendations for initiation or changes to medication were communicated to the patients' GP. Patients were reviewed monthly for the first 6 months then 6‐monthly for 2 years. Review in the routine diabetic clinic occurred annually | |
| Outcomes | PATIENTS (at baseline, 6, 12, and 24 months) HbA1c Lipids (total cholesterol, LDL, HDL) Serum creatinine Urinary albumin/creatinine ratio Weight BMI BP (systolic and diastolic BP) Daily insulin dose Medication ‐ nurse‐led group, serum creatinine and potassium (ACE inhibitors or angiotensin 2 receptor blockers), liver function tests for statins PROCESS Medication use | |
| Notes | ||
| Risk of bias | ||
| Bias | Authors' judgement | Support for judgement |
| Random sequence generation (selection bias) | Low risk | Patients were randomised. |
| Allocation concealment (selection bias) | Low risk | Computer‐generated blind envelope system. |
| Blinding of participants and personnel (performance bias) | High risk | Not feasible with study design. |
| Blinding of outcome assessment (detection bias) | Low risk | Laboratory measures low risk. Provider measuring BP not reported. |
| Incomplete outcome data (attrition bias) | Low risk | 96.2% (78/81) completed the 2‐year study, low attrition 1/40 nurse‐led, 2/41 routine care. During the study non‐attendance was high, nurse‐led 22%, consultant routine care 26%, routine care by diabetes nursing service for glycaemic control 40%. |
| Selective reporting (reporting bias) | Unclear risk | Pedefined outcomes reported apart from 6‐month routine care data. |
| Other bias | Unclear risk | In routine care, initiation or changes to lipid‐lowering and antihypertensive medication were communicated by letter to the GP and may not have been actioned. Unclear detail of nurse prescribing method. Unclear influence on prescribing outcomes of multidisciplinary team and annual clinic review. |
ACE: angiotensin‐converting enzyme
ADA: American Diabetes Association
BMI: body mass index
BP: blood pressure
CD4: cluster of differentiation 4
CHD: coronary heart disease
CHF: congestive heart failure
DM: diabetes mellitus
DSC: diabetes symptom checklist
GP: general practitioner
HbA1c: glycated haemoglobin
HDL: high‐density lipoprotein
LDL: low‐density lipoprotein
PEQD: patients' evaluation of the quality of diabetes care
SF‐12: 12 item Short Form health survey
SF‐36: 36 item Short Form health survey
Characteristics of excluded studies [ordered by study ID]
| Study | Reason for exclusion |
| No pharmacist prescribing element. | |
| Not RCT, CBA, or ITS. | |
| Does not meet CBA criteria. | |
| Single centre non‐RCT. | |
| No non‐medical (pharmacist) prescribing element. | |
| Unclear medical input into pharmacist prescribing. Does not have three time point measurements before and after intervention. | |
| Retrospective chart review of pharmacist clinical interventions, single centre not randomised, no control group, not ITS. | |
| Not randomised, no control group, reference to a historical control. | |
| Pharmacists did not undertake a prescribing role. | |
| Unclear and varied use of prescribing algorithm by doctors and nurses. | |
| Doctor wrote script. | |
| Medical consultation with non‐medical prescriber on prescribing changes. | |
| Not RCT, CBA, or ITS. | |
| Medical role in prescribing decisions. | |
| No nurse prescribing. | |
| No pharmacist prescribing role. | |
| Physician and nurse proposed treatment. | |
| Independence of non‐medical prescribing role by pharmacist unclear. | |
| Not RCT, CBA, or ITS. | |
| Unclear non‐medical prescribing role of pharmacist. | |
| Pharmacist could not independently prescribe. | |
| Even though a RCT the aim of this study was to test the effect of experiencing the intervention and then discontinuing it versus continuing the intervention. There was no control group that never received a pharmacist intervention, which is the basis for exclusion. | |
| Transcribing where medical staff primary decision maker. | |
| Pharmacist discharge prescriptions reviewed, electronically co‐signed, edited, or cancelled by a physician. | |
| Review only. | |
| Single site, not contemporaneous data collection. | |
| Not RCT, CBA, or ITS. | |
| Not RCT, CBA, or ITS. | |
| Medication prescription by doctors. | |
| Not RCT, CBA, or ITS and doctor signed prescription. | |
| Nurse had no authority to prescribe. | |
| Cardiologist reviwed treatment and completed prescriptions. | |
| Physician signature required on pharmacist prescription. | |
| Not RCT, CBA, or ITS. | |
| Joint nurse and physician up‐titration of medication. | |
| Medical signature required. | |
| Unclear nurse prescribing autonomy. Prescriptions managed within care home and associated general practice. | |
| Does not meet ITS criteria of three data points before and after intervention. | |
| Pharmacist prescribing intervention unclear. Focus on compliance support rather than drug selection or change. | |
| Non‐randomised pharmacist transcription. | |
| No pharmacist prescribing. | |
| No non‐medical (pharmacist) prescribing. | |
| No prescribing by health workers. | |
| Medical consultation on pharmacological management. | |
| Non‐randomised study with mixed prescribers in control group. | |
| Not RCT, CBA, or ITS. | |
| Primary care physician approved any changes in medication or therapy. Pharmacist could adjust insulin doses as needed. | |
| Descriptive study. | |
| Autonomy and method of nurse prescribing by algorithm not clear. | |
| Unclear nurse prescribing autonomy. | |
| Nurse prescriptions signed by doctor. | |
| Nurse practitioner's medication changes required approval by the primary care (medical) provider. | |
| Physician determined and signed medication orders. | |
| No pharmacist prescribing element. | |
| No nurse prescribing. | |
| No comparison group or period for pharmacist intervention. | |
| Consulation by pharmacist with family doctor before medication changes. | |
| No pharmacist prescribing role. | |
| Retrospective single site study. | |
| Not RCT or CBA. | |
| Not RCT, CBA, or ITS. | |
| Non‐randomised study. Retrospective chart review. | |
| Not RCT, CBA, or ITS. | |
| Non‐randomised study, no pre‐intervention for CBA. | |
| Pharmacist made treatment recommendations ‐ no prescribing. | |
| CBA study with a delayed intervention in the control group. Extent of nurse prescribing and autonomy unclear. | |
| Does not meet CBA criteria. | |
| Cross‐sectional study of chart documentation. | |
| Not RCT, CBA, or ITS. | |
| Not RCT, CBA, or ITS. | |
| Unclear if any prescribing role by pharmacist. | |
| Non‐randomised study, no pre‐intervention for CBA study. | |
| Unclear medical and nursing use of prescribing algorithm. | |
| No prescribing by pharmacist. | |
| Unclear pharmacist prescribing role. | |
| Pharmacist prescribing authorisation not evident. | |
| No prescribing by pharmacist. | |
| Not RCT, CBA, or ITS. | |
| Not RCT, CBA, or ITS. | |
| Does not meet CBA or ITS criteria. | |
| All medication changes required the approval of the primary care proivider. | |
| Single centre retrospective medical record review. | |
| No pharmacist prescribing. | |
| No pharmacist prescribing role. | |
| Medical prescribing only. | |
| Shadow prescribing by pharmacist. | |
| Extent and outcomes of discharge transcribing role by pharmacists unclear. | |
| Retrospective review. | |
| No pharmacist prescribing. | |
| Nurse prescriptions required medical signature. | |
| Physician authorised medication changes. | |
| Physician role in prescribing. | |
| Prescribing role in pharmaceutical care unclear. | |
| Non‐randomised, not CBA or ITS. | |
| Not RCT, CBA, or ITS. | |
| Adjustment of medications by nurse practitioner medically supervised. | |
| Cardiologist consulted on changes to medications. | |
| Clinical pharmacist made prescribing recommendations to physicians. | |
| Does not meet ITS criteria. | |
| Retrospective analysis. | |
| Not RCT, CBA, or ITS. | |
| Unclear pharmacist prescribing role. | |
| Not RCT, CBA, or ITS. | |
| Non‐medical prescribing nurses required doctor to sign prescriptions. | |
| Patient self‐management versus usual care. | |
| Nurses did not have direct prescribing rights. | |
| Does not meet CBA criteria. | |
| Not RCT, CBA, or ITS. | |
| Unclear degree of physician and pharmacist prescribing roles in intervention group. | |
| Non‐randomised study with no non‐medical prescribing. | |
| No non‐medical prescribing. | |
| Non‐randomised, not CBA or ITS. |
CBA: controlled before‐and‐after
ITS: interrupted time series
RCT: randomised controlled trial
Characteristics of studies awaiting assessment [ordered by study ID]
| Methods | Cost‐effectiveness analysis alongside a pragmatic cluster‐randomised controlled trial in 31 primary care clinics (16 intervention, 15 controls) |
| Participants | HIV‐infected patients in South Africa. Cohort one: patients not yet receiving anti‐retroviral therapy. 5390 intervention patients, 3862 controls. Cohort 2: patients receiving at least six months antiretroviral therapy; 3029 intervention patients, 3202 controls |
| Interventions | Nurses who received at least four educational outreach training sessions about antiretroviral therapy prescribing and undertook initiation and represcribing of antiretroviral therapy versus usual medical care |
| Outcomes | A cost‐effectiveness study of nurse‐led versus doctor‐led antiretroviral treatment in South Africa was undertaken on data derived from Fairall 2008. Nurse‐led antiretroviral therapy was found to be associated with higher mean health service costs than doctor‐led care but the levels of uncertainty were high given the wide confidence intervals around the incremental costs and effects. There may have also been an underestimation of the benefit of the intervention. The increased costs were largely explained by more frequent clinic visits with longer consultations for intervention patients. Total nurse and doctor costs were higher for intervention patients in the two cohorts (those not receiving and those already receiving antiretroviral therapy). In the cohort not receiving antiretroviral therapy at enrolment the mean antiretroviral prescription costs were higher in the intervention group. |
| Notes |
| Methods | Regression analysis of costs and effects using intention‐to‐treat and expected value of sample information |
| Participants | 125 patients with chronic pain and with complete resource use and SF‐6 dimension questionnaire data at baseline, three and six months |
| Interventions | Patients were randomised to either pharmacist medication review with face‐to‐face pharmacist prescribing or pharmacists medication review with feedback to general practitioner or treatment as usual |
| Outcomes | The differences in costs and effects in terms of QALYs associated with pharmacist prescribing and or review compared with treatment as usual in managing chronic pain in primary care was undertaken on data derived from Bruhn 2013. Adjusted mean cost differences per patient relative to treatment as usual were GBP 77 for prescribing (95% CI ‐82 to 237) and GBP 54 for review (95% CI ‐103 to 212). Pharmacist‐led interventions for chronic pain appeared more costly and provide similar QALYs. The estimates were imprecise due to the small size of the pilot trial. |
| Notes |
| Methods | Randomised controlled trial |
| Participants | 99 adult patients from 14 community pharmacies in Alberta, Canada with uncontrolled dyslipidaemia (as defined by the 2009 Canadian Dyslipidaemia Guidelines) |
| Interventions | Pharmacist prescribing versus usual pharmacist, physician care. Follow‐up at 6, 12, 18, and 24 weeks |
| Outcomes | Unadjusted proportion of patients achieving LDL‐c target was higher in the intervention group (43% versus 18%, P < 0.007) and the intervention group had a greater reduction in LDL‐c (1.59 mmol/L, SE 0.15 mmol/L versus 0.42 mmol/L, SE 0.1, P < 0.0001) |
| Notes |
CI: confidence interval
LDL‐c: low‐density lipoprotein
QALYs: quality‐adjusted‐life‐years
SE: standard error
SF‐6: Short Form‐6
Characteristics of ongoing studies [ordered by study ID]
| Trial name or title | A pragmatic cluster‐randomised controlled trial of an automated, pharmacy‐based intervention to optimise allopurinol therapy in gout |
| Methods | Cluster‐randomised controlled trial of 103 clusters comparing pharmacist‐led interventions versus usual care An expert panel endorsed allopurinol treatment algorithms for pharmacist‐led interventions to adjust allopurinol dosing |
| Participants | Patients 441 intervention, 810 usual care Patients with gout receiving new allopurinol prescriptions |
| Interventions | Dose titration to treat to target to achieve and maintain a serum urate ≤ 6.0 mg/dL |
| Outcomes | |
| Starting date | July 2014 |
| Contact information | Ted R Mikuls, University of Nebraska Medical Center, Omaha, NE |
| Notes | Ongoing study |
Data and analyses
| Outcome or subgroup title | No. of studies | No. of participants | Statistical method | Effect size |
| 1 Systolic blood pressure mmHg Show forest plot | 21 | Mean Difference (IV, Fixed, 95% CI) | Subtotals only | |
| Analysis 1.1 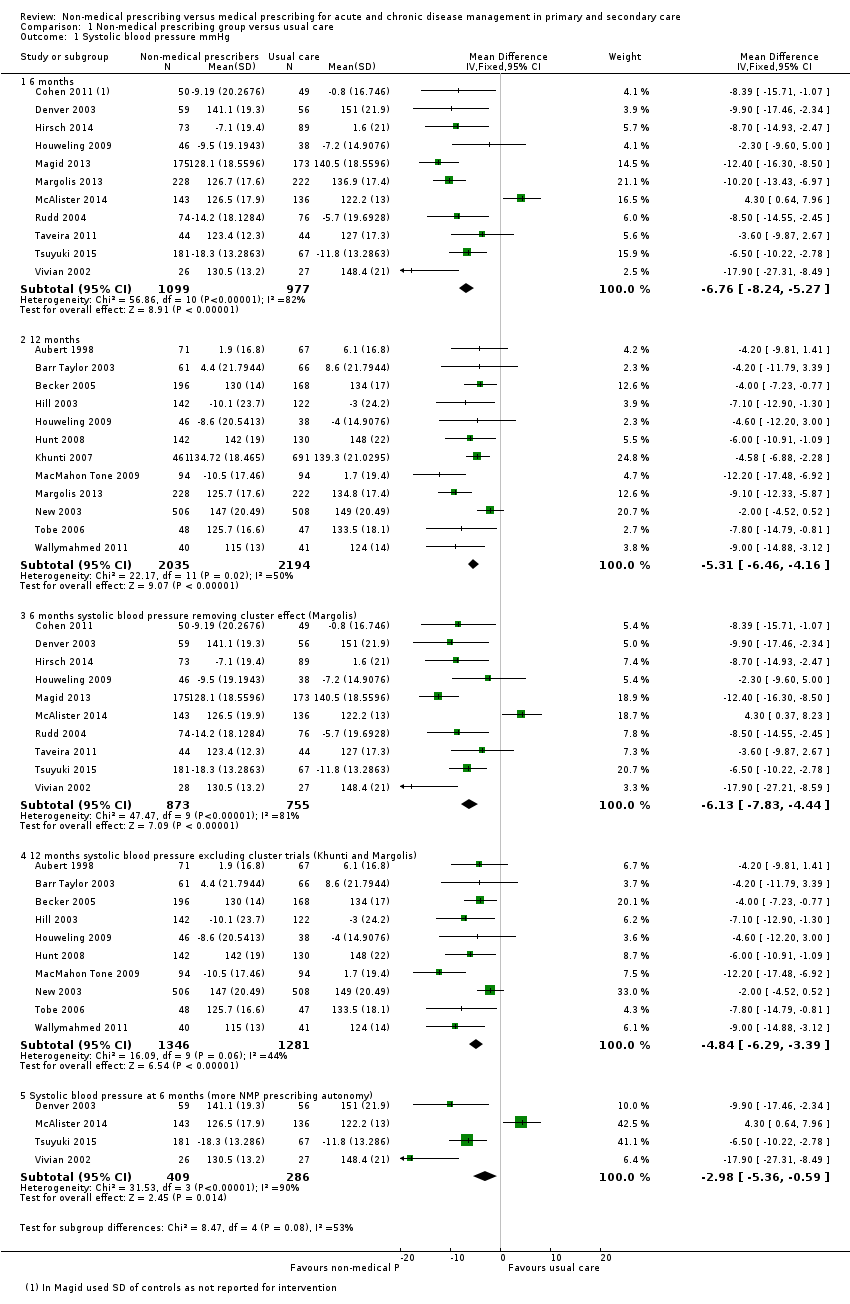 Comparison 1 Non‐medical prescribing group versus usual care, Outcome 1 Systolic blood pressure mmHg. | ||||
| 1.1 6 months | 11 | 2076 | Mean Difference (IV, Fixed, 95% CI) | ‐6.76 [‐8.24, ‐5.27] |
| 1.2 12 months | 12 | 4229 | Mean Difference (IV, Fixed, 95% CI) | ‐5.31 [‐6.46, ‐4.16] |
| 1.3 6 months systolic blood pressure removing cluster effect (Margolis) | 10 | 1628 | Mean Difference (IV, Fixed, 95% CI) | ‐6.13 [‐7.83, ‐4.44] |
| 1.4 12 months systolic blood pressure excluding cluster trials (Khunti and Margolis) | 10 | 2627 | Mean Difference (IV, Fixed, 95% CI) | ‐4.84 [‐6.29, ‐3.39] |
| 1.5 Systolic blood pressure at 6 months (more NMP prescribing autonomy) | 4 | 695 | Mean Difference (IV, Fixed, 95% CI) | ‐2.98 [‐5.36, ‐0.59] |
| 2 HbA1c (%) Show forest plot | 8 | Mean Difference (IV, Fixed, 95% CI) | Subtotals only | |
| Analysis 1.2  Comparison 1 Non‐medical prescribing group versus usual care, Outcome 2 HbA1c (%). | ||||
| 2.1 HbA1c 6 mths | 3 | 271 | Mean Difference (IV, Fixed, 95% CI) | ‐0.42 [‐0.75, ‐0.09] |
| 2.2 HbA1c 12 mths | 6 | 775 | Mean Difference (IV, Fixed, 95% CI) | ‐0.62 [‐0.85, ‐0.38] |
| 3 Low‐density lipoprotein (LDL) mmol/L Show forest plot | 11 | Mean Difference (IV, Fixed, 95% CI) | Subtotals only | |
| Analysis 1.3  Comparison 1 Non‐medical prescribing group versus usual care, Outcome 3 Low‐density lipoprotein (LDL) mmol/L. | ||||
| 3.1 LDL 6 mths | 6 | 1213 | Mean Difference (IV, Fixed, 95% CI) | ‐0.25 [‐0.34, ‐0.17] |
| 3.2 LDL 12 mths | 7 | 1469 | Mean Difference (IV, Fixed, 95% CI) | ‐0.21 [‐0.29, ‐0.14] |
| 4 Low‐density lipoprotein pharmacist vs nurse 6 mths Show forest plot | 6 | 1213 | Mean Difference (IV, Fixed, 95% CI) | ‐0.25 [‐0.34, ‐0.17] |
| Analysis 1.4  Comparison 1 Non‐medical prescribing group versus usual care, Outcome 4 Low‐density lipoprotein pharmacist vs nurse 6 mths. | ||||
| 4.1 Pharmacist | 4 | 629 | Mean Difference (IV, Fixed, 95% CI) | ‐0.09 [‐0.20, 0.02] |
| 4.2 Nurse | 2 | 584 | Mean Difference (IV, Fixed, 95% CI) | ‐0.52 [‐0.67, ‐0.38] |
| 5 Adherence (continuous) Show forest plot | 4 | 700 | Std. Mean Difference (IV, Fixed, 95% CI) | 0.15 [0.00, 0.30] |
| Analysis 1.5  Comparison 1 Non‐medical prescribing group versus usual care, Outcome 5 Adherence (continuous). | ||||
| 6 Adherence (dichotomous) Show forest plot | 4 | 935 | Risk Difference (M‐H, Fixed, 95% CI) | 0.06 [‐0.00, 0.12] |
| Analysis 1.6 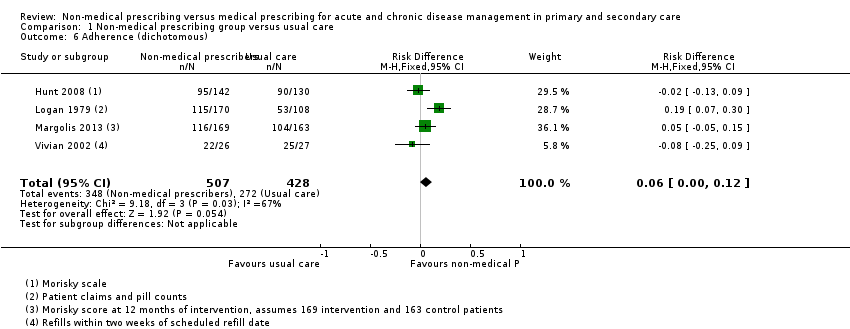 Comparison 1 Non‐medical prescribing group versus usual care, Outcome 6 Adherence (dichotomous). | ||||
| 7 Health‐related quality of life Show forest plot | 8 | Mean Difference (IV, Fixed, 95% CI) | Subtotals only | |
| Analysis 1.7  Comparison 1 Non‐medical prescribing group versus usual care, Outcome 7 Health‐related quality of life. | ||||
| 7.1 Physical component (SF12 or 36) | 8 | 2385 | Mean Difference (IV, Fixed, 95% CI) | 1.17 [0.16, 2.17] |
| 7.2 Mental component (SF‐12 or 36) | 6 | 2246 | Mean Difference (IV, Fixed, 95% CI) | 0.58 [‐0.40, 1.55] |
| 8 Health facility resource use Show forest plot | 5 | Risk Difference (M‐H, Fixed, 95% CI) | Subtotals only | |
| Analysis 1.8  Comparison 1 Non‐medical prescribing group versus usual care, Outcome 8 Health facility resource use. | ||||
| 8.1 Emergency Department visits | 3 | 4626 | Risk Difference (M‐H, Fixed, 95% CI) | 0.01 [‐0.02, 0.03] |
| 8.2 Hospitalisations | 5 | 4870 | Risk Difference (M‐H, Fixed, 95% CI) | ‐0.01 [‐0.03, 0.01] |

Study flow diagram.

'Risk of bias' summary: review authors' judgements about each risk of bias item for each included study.

Forest plot of comparison: 1 Non‐medical prescribing group versus usual care, Outcome: 1.2 Systolic blood pressure mmHg.
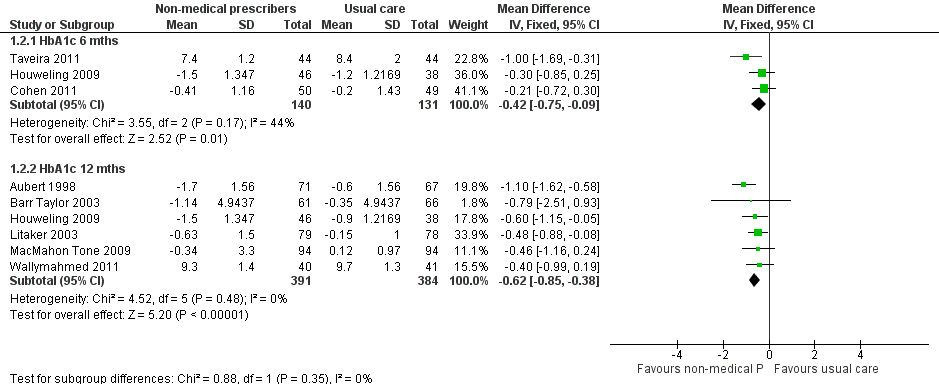
Forest plot of comparison: 1 Non‐medical prescribing group versus usual care, Outcome: 1.1 HbA1c (%).

Forest plot of comparison: 1 Non‐medical prescribing group versus usual care, Outcome: 1.3 Low‐density lipoprotein (LDL) mmol/L.

Comparison 1 Non‐medical prescribing group versus usual care, Outcome 1 Systolic blood pressure mmHg.

Comparison 1 Non‐medical prescribing group versus usual care, Outcome 2 HbA1c (%).
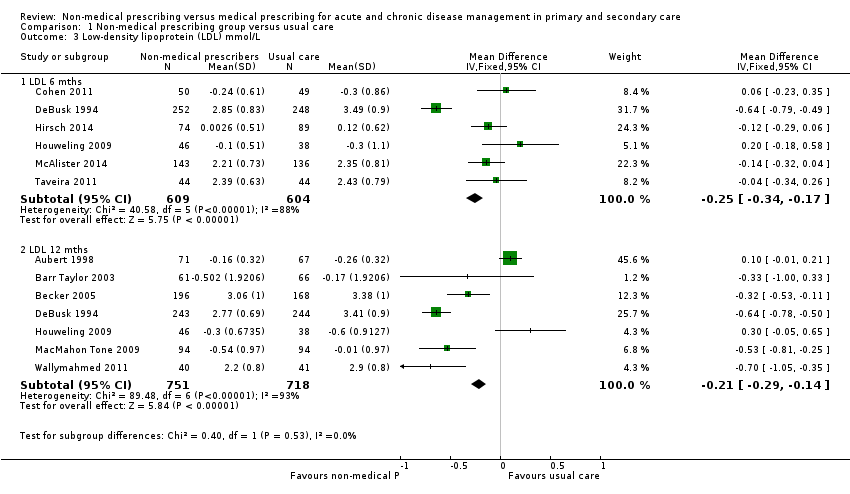
Comparison 1 Non‐medical prescribing group versus usual care, Outcome 3 Low‐density lipoprotein (LDL) mmol/L.

Comparison 1 Non‐medical prescribing group versus usual care, Outcome 4 Low‐density lipoprotein pharmacist vs nurse 6 mths.

Comparison 1 Non‐medical prescribing group versus usual care, Outcome 5 Adherence (continuous).

Comparison 1 Non‐medical prescribing group versus usual care, Outcome 6 Adherence (dichotomous).

Comparison 1 Non‐medical prescribing group versus usual care, Outcome 7 Health‐related quality of life.

Comparison 1 Non‐medical prescribing group versus usual care, Outcome 8 Health facility resource use.
| Non‐medical prescribing compared to medical prescribing for acute and chronic disease management in primary and secondary care | ||||||
| Patient or population: patients with acute and chronic disease | ||||||
| Outcomes | Illustrative comparative risks* (95% CI) | Relative effect | No of Participants | Certainty of the evidence | Comments | |
| Assumed risk | Corresponding risk | |||||
| Medical prescribing | Non‐medical prescribing | |||||
| Systolic blood pressure (mmHg) at 12 months | The mean systolic blood pressure in the control group ranged from 124 mmHg to 149 mmHg | The mean systolic blood pressure in the intervention group was 5.31 mmHg lower (‐6.46 lower to ‐4.16 lower) | ‐ | 4229 | ⊕⊕⊕⊝ | Random‐effects analysis: MD ‐5.91 mmHg lower (95% CI ‐7.71 lower to ‐4.10 lower) |
| Glycated haemoglobin (HbA1c, %) at 12 months | The mean change in glycated haemoglobin in the control group ranged from ‐0.90% to 9.7% | The mean change in glycated haemoglobin in the intervention group was 0.62% lower (‐0.85 lower to ‐0.38 lower) | ‐ | 775 | ⊕⊕⊕⊕ | Random‐effects analysis: MD ‐0.62 (95% CI ‐0.85 to ‐0.38) |
| Low‐density lipoprotein (mmol/L) at 12 months | The mean low‐density lipoprotein in the control group ranged from ‐0.26 to 3.41 mmol/L | The mean low‐density lipoprotein in the intervention group was 0.21 mmol/L lower (‐0.29 lower to ‐0.14 lower) | ‐ | 1469 | ⊕⊕⊕⊝ | Random‐effects analysis: MD ‐0.30 (95% CI ‐0.62 to 0.02) |
| Adherence (continuous) 6 months follow‐up | The mean adherence (continuous) in the control group was 0.79 | The mean adherence in the intervention group was 0.15 higher (0.00 higher to 0.30 higher) | ‐ | 700 | ⊕⊕⊕⊝ | |
| Patient satisfaction | Patient satisfaction was reported in 14 studies (Table 4). The majority of surveys were either not referenced or developed locally. Validated questionnaires assessing overall non‐medical practitioner satisfaction with care were reported in six studies rather than patient satisfaction with prescribing. An exception was the study by Bruhn 2013, which found for the prescribing intervention, patients were generally positive about the pharmacist prescribing service, 85% (39/46) were totally satisfied, while 9% (4/44) would have preferred to see their GP | Not estimable | 7514 (14 RCTs) | ⊕⊕⊕⊝ | ||
| Adverse events | There was little or no difference in adverse events between treatment groups in nine studies. Two studies reported higher rates of adverse events in the usual care group. It was difficult to determine effects in the remaining studies because limited data were reported | Not estimable | 18,400 (18 RCTs) | ⊕⊕⊝⊝ | ||
| Health‐related quality of life measured with SF‐12/36 | The mean health‐related quality of life in the control group was 0 | The mean health‐related quality of life in the intervention group: physical component was 1.17 higher (0.16 to 2.17) mental component was 0.58 higher (‐0.40 to 1.55) | ‐ | 4631 | ⊕⊕⊕⊝ Moderate10 | |
| *The basis for the assumed risk (e.g. the median control group risk across studies) is provided in footnotes. The corresponding risk (and its 95% CI) is based on the assumed risk in the comparison group and the relative effect of the intervention (and its 95% CI). | ||||||
| GRADE Working Group grades of evidence | ||||||
| 1Downgraded one level due to serious inconsistency (considerable heterogeneity was found). | ||||||
| Outcome or subgroup | Fixed‐effect estimate | Random‐effects estimate |
| 1.1 Systolic blood pressure (mmHg) | ‐5.85 (‐6.76 to ‐4.94) | ‐6.59 (‐8.48 to ‐4.71) |
| 1.1.1 6 months | ‐6.76 (‐8.24 to ‐5.27) | ‐7.34 (‐11.09 to ‐3.60) |
| 1.1.2 12 months | ‐5.31 (‐6.46 to ‐4.16) | ‐5.91 (‐7.71 to ‐4.10) |
| 1.2 HbA1c (%) | ‐0.55 (‐0.74 to ‐0.36) | ‐0.55 (‐0.76 to ‐0.35) |
| 1.2.1 HbA1c (6 months) | ‐0.42 (‐0.75 to ‐0.09) | ‐0.45 (‐0.09 to ‐0.01) |
| 1.2.2 HbA1c (12 months) | ‐0.62 (‐0.85 to ‐0.38) | ‐0.62 (‐0.85 to ‐0.38) |
| 1.3 LDL (mmol/L) | ‐0.23 (‐0.28 to ‐0.17) | ‐0.22 (‐0.42 to ‐0.02) |
| 1.3.1 LDL (6 months) | ‐0.25 (‐0.34 to ‐0.17) | ‐0.13 (‐0.39 to 0.12) |
| 1.3.2 LDL (12 months) | ‐0.21 (‐0.29 to ‐0.14) | ‐0.3 (‐0.62 to 0.02) |
| LDL: low‐density lipoprotein | ||
| Study | Patient group | Comparison | Outcome |
| Chronic pain | To compare the effectiveness of pharmacist medication review with or without pharmacist prescribing with standard care | Compared with baseline the Chronic Pain Grade improved in prescribing arm 47.7% (21/44; P = 0.003) and review arm 38.6% (17/44; P = 0.001) but not TAU 31.3% (15/48; ns) SF‐12 mental component score showed no effect for prescribing or review arms and deterioration in TAU arm. Hospital Anxiety and Depression scores improved in prescribing arm for depression (P = 0.022) and anxiety (P = 0.007) and between groups (P = 0.022 and P = 0.045 respectively). | |
| Anticoagulation | Pharmacist versus physician independent management of anticoagulant therapy for inpatients | There were no differences between groups for mean heparin and warfarin doses, partial thromboplastin time, days to reach therapeutic levels, mean prescribed and simulated heparin doses. | |
| Type 2 diabetes | Pharmacist case management versus usual medical care | Patients in the pharmacist case managed group received greater reductions in HbA1c (2.1% vs 0.9%, P = 0.03). Three of five process measures were conducted more frequently in the intervention group than control group. LDL measurement (100% vs 85.7%, P = 0.02), retinal examination (97.3% vs 74.3%, P = 0.004), monofilament foot screening, (92.3% vs 62.9%, P = 0.002). | |
| Family planning | Family planning services provided by nurses versus physicians | Nurses' clients were as equally as successful as physicians in continuing contraceptive use and preventing pregnancy. Nurses were less likely than physicians to provide patients on their first visit with IUDs, prescribe oral contraceptives, or sterilisation. Nurses were more likely to give temporary prescriptions than physicians until the next visit (25% vs 16%, P < 0.001) for reasons including possible pregnancy and patients not menstruating. | |
| Dyslipidaemia | Clinical pharmacists providing pharmaceutical care in addition to usual medical care versus usual medical care | The absolute change in total cholesterol (17.7 vs 7.4 mg/dL, P = 0.028) and LDL (23.4 vs 12.8 mg/dL, P = 0.042) was greater in the intervention than control group. | |
| HIV | Prescribing of antiretroviral treatment by nurses versus doctors | Cohort 1 ‐ not receiving antiretrovirals. Time to death did not differ (HR 0.94, 95% CI 0.76 to1.15). Cohort 2 ‐ received antiretrovirals for at least six months. Viral load suppression 12 months after enrolment was equivalent in intervention and control. Risk difference 1.1% (95% CI ‐2.4 to 4.6). | |
| Depression | Collaborative care model of clinical pharmacists providing drug therapy management and treatment follow‐up versus usual care | Clinical improvements noted in both groups but not significant. Intervention group had higher drug adherence at six months (67% vs 48%; OR 2.17, 95% CI 1.04 to 4.51; P = 0.038) | |
| Lipid control in diabetes | Algorithm‐driven telephone care by nurses as an adjunct to usual care versus usual care | The percentage of patients with an LDL < 100 mg/dL increased from 52% to 58.5% in the intervention group and decreased from 55.6% to 46.7% in the control group (P < 0.01). The intervention did not affect glycaemic and BP outcomes | |
| Blood pressure control in diabetes | A pharmacist‐led intervention (Adherence and Intensification of Medications) in patients with diabetes and poor BP control versus usual care | The mean systolic BP decrease from 6 months before to 6 months after the 14‐month intervention was not different (8.9 mmHg decline in the intervention arm and 9.0 mmHg decline in the control arm). There was no difference in the mean HbA1c and LDL levels between groups after the end of the intervention period (examining 12 months). At the end of the first quarter after activation, there was a significantly greater drop in systolic BP in the intervention group versus control, 9.7 mmHg vs 7.2 mmHg; MD 2.4 mmHg (95% CI 1.5 to 3.4 P < 0.001). | |
| Type 2 diabetes | Primary care nurse management of type two diabetes versus management by GPs | After 14 months between‐group differences for reduction in HbA1c, BP, and lipid profile were not significant. Mean systolic and diastolic BPs were lower in both groups. Most process indicators were significantly better in the nurse care group. More patients were satisfied with their care in the nurse group however the physical component of the SF‐26 was better in the GP group. | |
| Cardiovascular risk factors in diabetes | Nurse case management versus usual care to improve hypertension, hyperglycaemia, and hyperlipidaemia in veterans with diabetes | A greater number of patients in the nurse case management had all three measures under control (21.9% vs 10.1%, P < 0.01). A greater number of intervention group participants achieved individual treatment goals. HbA1c < 8% (73.7% vs 65.8% P = 0.04), BP < 130/80 mmHg (45% versus 25.4%, P < 0.01) but not for LDL < 100 mg/dL (57.6% vs 55.4%, P = 0.61). | |
| Non‐insulin dependent diabetes | Pharmacists providing pharmaceutical care versus physicians | Improvement was seen in glycated haemoglobin in the intervention group at 4 months (9.2% ± 2.1 vs 12.1% ± 3.7, P = 0.003), and fasting plasma glucose (8.5 ± 2.3 vs 11.0 ± 3.9 mmol/L, P = 0.015). There was little or no change within or between groups for BP, lipid profile, renal function, weight, or quality of life measures. | |
| Women with signs of incomplete abortion | Midwives diagnosing and treating incomplete abortion with misoprostol compared to physicians | 452 (95.8%) women in the midwife group and 467 (96.7%) in the physician group had complete abortion. The model risk difference for midwife versus physician group was ‐0.8% (95% CI ‐2.9 to 1.4) falling within the predefined equivalence range (‐4% to 4%). | |
| Children with asthma | Non‐inferiority of care provided by a hospital‐based specialised asthma nurse versus a GP or paediatrician | The corrected daily dose of inhaled corticosteroids as well as the percentage of children prescribed long‐acting beta agonists/inhaled corticosteroids was not significantly different between groups at one and two years. | |
| Hypertension | Treatment of hypertension in the workplace by nurses versus treatment in the community by the family doctor | Patients in the nurse group were more likely to be put on antihypertensive medications (94.7% vs 62.7%, P < 0.001), to reach goal BP in the first six months (48.5 vs 27.5%, P < 0.001) and to take drugs prescribed (67.6 vs 49.1%, P < 0.005). | |
| Postoperative patients | Pharmacist medication history and supplementary prescribing versus pharmacist medication history versus usual care | The marginal mean number of missed doses per patient was 3.21 (95% CI 2.89 to 3.52) in the control group, which was reduced in the pharmacist prescribing group 1.07 (95% CI 0.90 to 1.25, P = 0.002) but not in the pharmacist history group 3.30 (95% CI 2.98 to 3.63). The number of medications charted at an incorrect dose or frequency was reduced in the pharmacist history group. The pharmacist prescribing group had less dose errors than the pharmacist history group (P = 0.004). | |
| Secondary prevention of coronary heart disease in primary care | Audit group verus GP recall group versus nurse recall group (disease register and patient recall to nurse‐led clinic) | Little or no difference occurred in assessment between the nurse and GP recall group. Mean BP, total cholesterol, cotinine levels varied little between groups as did prescribing of hypotensive and lipid‐lowering agents. Prescribing of antiplatelet drugs was higher in the nurse recall group vs GP recall group, MD 8% (95% CI 1% to 15%, P = 0 .031). | |
| Primary care nurses | Education and implementation of prescribing and clinical guidelines by nurses in rural health centres versus usual nurse care | Antibiotic prescribing in children 0 to 5 years for respiratory tract infections fell, (42% at baseline to 27% at follow‐up, control 27% to 30%, P = 0.022). Guidelines had no effect on prescribing antibiotics for diarrhoea but oral rehydration prescribing increased. Diazepam prescribing for adults fell, (intervention 17% to 10%, control 21% to 18%, P = 0.029). | |
| Patients attending primary care | Nurse practitioners versus physicians plus conventional nurse in primary care | Similar mortality experience, no differences in physical functioning capacity, social or emotional function. Quality of care similar. In 510 prescriptions, an adequate rating was given to 75% of conventional group and 71% in the nurse practitioner group, probably leading to little difference between groups. | |
| Type 2 diabetes | A pharmacist‐led Veterans affairs Multidisciplinary Education and Diabetes Intervention for Cardiac risk reduction (VA‐MEDIC) plus usual care versus usual care | After four months there was a difference (P < 0.05) in the percentage of VA‐MEDIC patients versus controls in attaining target goals for systolic BP < 130 mmHg and HbA1c < 7% but not lipid control or tobacco use. | |
| Drug therapy in a geriatric setting | Drug therapy prescribing and patient care management by clinical pharmacists versus usual care | The clinical pharmacist group probably had a lower number of deaths (P = 0.05), a higher number of patients being discharged to lower levels of care (P = 0.03) and a lower average number of drugs per patient (P = 0.04). | |
| Patients with cardiovascular risk factors associated with hypertension, diabetes, dyslipidaemia and smoking | Community pharmacist care versus usual care | At 3 months the intervention group patients had greater improvements in LDL cholesterol (‐ 0.2 mmol/L, P < 0.001, systolic BP (‐9.37 mmHg, P < 0.001), glycosylated haemoglobin (‐0.92%, P < 0.001) and smoking cessation (20.2%, P < 0.002). | |
| BP: blood pressure | |||
| Study | Medication adherence measure | Outcome |
| Morisky Medication Adherence | Assessed adherence at baseline with patients in both groups reporting full adherence. | |
| Medication possession ratios | The medication possession ratio (total days' supply of medication divided by total number of expected medication intake days) used in this study found little or no difference between the pharmacist prescribing arm and usual care, even though more medications were prescribed in the pharmacist arm. Adherence was high and ranked above 80%. | |
| Medication possession ratios | Determined the medication possession ratio from computerised prescription refill records. Full drug adherence was defined as a medication possession ratio value of 0.83 or more during the six‐month follow‐up. Medication possession ratios at three and six months were probably not different between intervention and control arms even though patients in the intervention group were more likely to change antidepressants. An additional measure, the Health Plan Employer Data Information Set guidelines for successful antidepressant treatment, showed there was little or no difference between groups in compliance with the early phase of treatment, but there was a significant difference in compliance in the intervention group continuation phase. | |
| Morisky Medication Adherence Scale | Reported no differences at study end in the proportions of subjects reporting high medication adherence. There was an improvement in adherence with the groups from baseline to study end. Adherence did not predict goal attainment. | |
| Not described | Non‐adherence was identified in five of 33 patients with drug therapy problems at baseline, one of 12 patients at six months and one of four patients at nine months. | |
| Patient claim and pill counts | High adherence was judged if patients claimed to be taking their medication as instructed and 80% or more of drugs prescribed were consumed as determined by pill counts. In the nurse intervention group patients were more adherent than the control group. | |
| Medication possession ratios | Little or no difference between groups in the mean medication possession ratio adherence score over the six‐month study. | |
| Morisky Medication Adherence Scale | Reported adherence measured by the Morisky scale modified for blood pressure medications. Adherence to antihypertensive medications at six months increased in the pharmacist intervention telemonitoring group but decreased in the usual care group. There was probably no difference between groups at 12 and 18 months. | |
| Electronic drug event monitor | The drug event monitor provided the average number of days on which patients took the correct number of doses prescribed. While adherence was high in both groups, the nurse‐managed patient group had higher adherence than usual care. | |
| Patient self‐reporting and drug refill information from the pharmacy | Non‐adherence was judged as missing more than three doses a week or pharmacy records indicated a failure to refill drugs within two weeks after the scheduled refill date. Little or no difference in adherence between or within the two groups at baseline or the end of the study was found. Over 90% of patients in both groups indicated they took their drugs as directed. The study was underpowered to detect a significant difference in adherence. |
| Study | Satisfaction tool measure | Outcome |
| Not specified | 19/57 respondents stated that the nurse care management programme was moderately helpful. 32/57 found it extremely helpful. 9/13 physicians with two or more patients recommended adoption of the nurse management programme. In other health care settings: 9 physicians felt the programme decreased their time with patients, while 4 thought it increased the time spent. | |
| 11 patient satisfaction statements derived from a local prescribing feasibility study | For the prescribing intervention, patients were generally positive about the pharmacist prescribing service ‐ 85% (39/46) were totally satisfied, while 9% (4/44) would have preferred to see their GP. In semi‐structured interviews with GPs and pharmacists, all pharmacists and most GPs were positive about the intervention. Pharmacists found their role satisfying, interesting, and challenging. 17 of 23 GPs were positive about the pharmacists’ role. The cost‐effectiveness of the pharmacists' role, given limited resources, was one issue raised in the GP focus group. | |
| Not specified | Patients reported greater treatment satisfaction with the collaborative care model than the control group in 6 of 11 measures including the overall treatment for depression, personal nature of the care, listening to concerns, explanations about why antidepressants were prescribed and how to take them, availability for advice, and overall satisfaction with the organisation. 18/37 primary care provider questionnaire respondents were satisfied with workflow, patient welfare. and the pharmacists' abilities. | |
| Patient Evaluation of the Quality of Diabetes Care (PEQD) | Patients' evaluations of their satisfaction with diabetes care from the specialist diabetes nurse were significantly more positive than the control group. | |
| Patient Evaluation of the Quality of Diabetes Care (PEQD) | The total satisfaction sum score for 14 PEQD measures for practice nurses was 66.4%, compared to 51.7% in the GP group which may be confounded by the amount of time given to each patient. On average GPs spent a total of 28 minutes per patient, whereas practice nurses spent 128 minutes per patient. | |
| Satisfation in the SF‐36 healthcare domain | Satisfaction with hypertension care was high in both groups, but with little or no difference in any of the 11 satisfaction measures. Satisfaction was not associated with blood pressure goal attainment. | |
| 22‐item Pharmacist Service Questionnaire. 0‐100 scale | Patient satisfaction with the clinical pharmacist were high, with mean scores 92.4 (±10.9) at 6 months (n = 49) and 92.7 (±11) at 9 months (n = 44). | |
| Patient Satisfaction Questionaire | Improvements in four areas of satisfaction in the intervention group linked to an increased time spent with patients and an emphasis on patient‐centred education and self‐management (i.e. quality and quantity of contact) from base line to study end. Between‐group comparisons at study end demonstrated little or no significant difference in patient satisfaction measures, including overall care and general satisfaction. | |
| Not specified | 6% of patients were dissatisfied with care provided by nurses but details of the survey instrument were not provided: (assumed 12/206 intervention patients at 6 months but not specified). | |
| Not specified | Little or no difference in overall health care satisfaction between pharmacist‐ and nurse‐led care. | |
| Not specified | Patients at 6 months reporting they were very or completely satisfied with their hypertension care was probably higher in the intervention group than the usual care group. | |
| Six items from the Consumer Assessment of Healthcare Providers and Systems adult survey (version 4) | Satisfaction items concerning clinicians listening carefully, explaining things clearly, and respecting what patients said showed larger improvements amongst patients in the telemonitoring intervention group than usual care at 6 months but not at 12 or 18 months. | |
| Not specified | 96% of patients in the nurse practitioner group and 97% of patients in the conventional care group were satisfied with the health services received in the experimental period. | |
| Not specified | Little or no significant differences in patient satisfaction between groups. More patients in the intervention group felt that the pharmacist spent more time with them than did control patients, although there was little difference. There was no difference in satisfaction with pharmacy services or changes in patient satisfaction in either group from baseline to study end. This study was underpowered to detect a significant difference in patient satisfaction. | |
| GP: general practitioner | ||
| Study | Adverse event |
| There was little or no difference in the proportions of patients between control (provider education), nurse facilitator and provider/patient notification for hospitalisations and emergency room visits. There were few deaths with the higher number (7) in the control group which had more patients on haemodialysis, two of whom died. | |
| There appeared little or no difference between intervention and usual care groups for severe low blood glucose events at baseline and during the study period. Mean weight gain differences from insulin treatment in each group or mean weight loss differences with oral agents showed little or no difference. | |
| Reported no patients had major bleeding, but four patients in the pharmacist prescriber group had minor bleeding (one laceration before hospital). One patient in physician prescriber group died, after receiving heparin and warfarin for a stroke in evolution but there was no evidence of bleeding. | |
| The first year mortality was 3.4% in usual care and 4.1% in the intervention group. However, a longer study is required to show a difference, namely, 2 years plus a 5‐ to 10‐year follow‐up. | |
| The time to death did not differ between primary care nurses and doctors initiating therapy. | |
| Pharmacists identified two adverse drug reactions from 33 drug therapy problems at baseline, two from 12 at six months and none at nine months. | |
| Adverse events were similar between groups, with no participants withdrawing from the study due to an adverse event, and there was no difference in the rate of hospitalisation or death between the groups. | |
| Reported 17 hypoglycaemic reactions in the intervention group and two in the control group. All were considered mild to moderate. The difference was possibly related to increased training in recognition, documentation, and questioning in the intervention group. Three patients were hospitalised, two in the control and one in the intervention group, and these appear unrelated to treatment. | |
| In treating incomplete abortion bleeding, the same or less than normal menstrual cycle was probably not different between the intervention midwife and usual care physician groups. There was little difference in pain after treatment as assessed by a visual analogue scale. 30 (6%) of women reported unscheduled visits in the midwife group and 18 (4%) in the physician group. Reasons included vaginal bleeding and abdominal pain. Reported side‐effects after treatment were similar in both groups (nausea, vomiting, abdominal pain, chills, and fever). | |
| There were no differences between groups (general practitioner, paediatrician, asthma nurse) with respect to the number of severe asthma exacerbations as expressed by the number of prednisolone courses. | |
| Forty drug‐related adverse events occurred in the intensive intervention group as compared to 10 in the standard group. While the adverse events are known for the drugs in question no further comment was offered. | |
| Reported few clinical events at six months in a pharmacist‐led intervention for secondary prevention after ischaemic stroke. There were nine cardiovascular events and no deaths in the pharmacist group versus eight cardiovascular events and one death in the nurse‐led group. | |
| There were 60 adverse events in usual care and 49 in the telemonitoring group; most events were non‐cardiac hospitalisations. There were two allergic reactions to blood pressure medication in the usual care group, six events in the telemonitoring group related to hypotension, dizziness, loss of consciousness which compared to one in the usual care group, four events in usual care related to hypertension versus one in the intervention group. | |
| In patients randomised to specialist nurse‐led clinics for blood pressure control, lipid control or both, there were less deaths in the intervention group (25, (3.2%) versus 36 (5.7%) in the usual care group) odds ratio 0.55 (95% confidence interval 0.32 to 0.92) P = 0.02. | |
| During the 12‐month experimental period, there were four deaths in the nurse practitioner group and 18 in the conventional care group. There was probably little or no difference in the crude death rate between groups. | |
| There were no diabetes‐related admissions or deaths for either group during the six‐month study. | |
| The pharmacist prescribing group in a geriatric setting may have had a slightly lower 12‐month mortality than usual care (3/67 versus 10/72, P = 0.05). | |
| The incidence of adverse events probably did not differ between the intervention (home care nurse group) and control (primary care physician group) in First Nations people with diabetes and hypertension. Ten patients in the intervention group and seven in the control group required admission to hospital for adverse events. |
| Study | Measures | Outcome |
| Four generic quality of life measures from the Behavioural Risk Factor Surveillance System | Intervention and control groups reported improved perception of health status after 12 months, but intervention patients were twice as likely to report this. | |
| SF‐36, the Duke Activity Status Index for QoL, and the BDI for depression | Little or no differences for any of the variables, but an improved mood for both groups was found. | |
| SF‐12, HUI, CPG, and HADS‐D | No one measure was seen as the primary outcome. In the prescribing arm there was a within‐arm improvement for CPG intensity and disability effect size subscales and between arms on the intensity subscale but not the disability subscale. There was a within‐arm improvement in overall CPG in the prescribing and review arms but not the TAU arm. The SF‐12 and HADS‐D showed deterioration in the TAU arm. Compared with baseline, patients had an improved CPG in the prescribing and review arms but not the TAU arm. The SF‐12 physical score difference showed no effect in prescribing or review arms but improvement in the TAU arm. SF‐12 mental score showed no effect in prescribing or review arms and deterioration in the TAU arm. HADS‐D scores within the prescribing arm showed improvement for depression and anxiety which were also significant between groups. | |
| SF‐36 for Veterans | Little or no change in quality of life scores over 6 months. | |
| The Brief Inventory for depressive symptoms and Work and Social Disability Scale | Liitle or no difference at 6 months between intervention and control groups. | |
| SF‐36 and the revised version of the Type 2 Diabetes Symptom Checklist to measure the presence and perceived burden of diabetes‐related symptoms | Little or no differences over 12 months between groups in either survey. | |
| SF‐36 and the revised version of the Type 2 Diabetes Symptom Checklist to measure the presence and perceived burden of diabetes‐related symptoms | In the control group there were little or no differences between baseline and follow‐up SF‐36 measures, however in the practice nurse intervention group there were differences in physical functioning, role physical, vitality, and the physical component score. Little or no differences were seen in the QoL results over time between the two groups except for the physical component score which was lower in the intervention group. After 14 months responses to the revised Type 2 Diabetes Symptom Checklist revealed little or no differences between groups. | |
| SF‐36 | Little or no difference except in the general health domain with scores higher in the control group. | |
| Health Status Questionnaire version 2 derived from the SF‐36 | Little or no difference between or within groups. | |
| SF‐36, Seattle Angina Questionnaire and LVD‐36 questionnaire | Differences favouring the intervention group were found in the SF‐36 for physical functioning, general health, vitality, social functioning, and mental health. Seattle Angina Questionnaire scores in patients with angina were significantly better for intervention patients compared to controls for exertional capacity and borderline differences were found for angina frequency and QoL. There was little or no difference in any of the SF‐36 health status domains or LVD‐36 scores for patients with a confirmed diagnosis of left ventricular diastolic dysfunction. | |
| SF‐12 Diabetes Quality of Life | Little or no difference between groups in either measure at study end. | |
| Self‐related health using a Likert scale The EQ‐5D as an index of health | Little or no difference between the pharmacist‐ and nurse‐led groups in participants overall self‐related health. | |
| SF‐12 | Little or no differences between groups. | |
| Dartmouth COOP charts EuroQol scores | Little or no or clinically important differences between groups for any dimension. | |
| Not described | Patients in the nurse practitioner and usual care groups had similar values at baseline and study end for physical, emotional, and social function. | |
| Change from baseline in depression symptoms by the PHQ‐9 | Even though no pharmacologic treatments for depression symptoms were offered as part of the intervention, the mean change in PHQ‐9 scores was probably not different for intervention and standard care participants. | |
| SF‐36 | Little or no significant differences either between or within the two groups from baseline to study end, although patients in the control group reported more bodily pain . | |
| BDI: Beck Depression Index | ||
| Medication and related therapy | |
| Study | Outcome |
| β‐blocker use was higher in the nurse facilitator group with two‐thirds of patients either initiated or up‐titrated on β‐blockers versus fewer than one‐third of patients in the other two study arms (control provider education and provider/patient notification). | |
| Little or no difference in amount of anticoagulant drugs prescribed by pharmacists compared to a physician. | |
| More patients in the pharmacist prescribing arm were prescribed diuretics and sulphonylureas compared to usual care. Overall there was an increase in the number of medications prescribed by pharmacists for hypertension, diabetes, and cholesterol from baseline to six months, but little or no change in the usual care arm. | |
| In nurse‐led clinic for hypertension management in diabetics at six months there were increased changes in the proportions of patients receiving new prescriptions for calcium channel blockers and thiazide diuretics as intensification therapy. The median number of drugs per patient increased in the intervention group compared to conventional primary care. | |
| In a family medicine clinic in Bogota, nurses were less likely than physicians to provide intrauterine devices, prescribe oral contraceptives, and sterilisation on the patient's first visit. Nurses were more likely than physicians to provide temporary prescriptions and defer intrauterine devices and contraceptive measures if the patient on their first visit was not menstruating or believed to be pregnant. | |
| Observational cohort results taken six months following the quarter start date showed intervention patients had more blood pressure medication changes. | |
| Pharmacists identified at least one hypertension drug therapy problem in 33/73 (45.2%) patients at baseline requiring additional therapy in 14/33 (42.4%) and dosage increases in 11/33 (33.3%). | |
| The nurse specialist in diabetes prescribed significantly more antihypertensive agents and the internist (doctor control) prescribed more cholesterol‐lowering agents. | |
| The mean number of antihypertensive medications per patient and use of generic antihypertensive agents was higher in the intervention group. | |
| Patients in the nurse‐managed group were more likely to be put on antihypertensive medications, prescribed more than two pills per day, and to be on more than one antihypertensive medication. | |
| There were more intervention intensive group patients on three or more antihypertensive drugs (at the study beginning more patients in the standard care group were on three or more antihypertensive agents). At the end of the study more patients with dyslipidaemia in the intensive group were receiving statin therapy. More patients in the intervention group were on aspirin antiplatelet therapy at the end of the study. | |
| The median number of antihypertensive medications taken at six months was probably not different in the pharmacist‐ and nurse‐led groups. There was a difference favouring pharmacists in maximal dosing of angiotensin‐converting enzyme inhibitors or angiotensin receptor blockers at six months, but not the percentage of patients using these drugs. | |
| In patients completing the six‐month visit, there were more intervention patients that had an antihypertensive medication added to their regimen and a dose increased for existing medication, than usual care patients. There was an increase in the usage of specific antihypertensive drugs. | |
| There were increases in the mean number of antihypertensive medication classes at 6, 12, and 18 months in the intervention group compared to baseline and compared to usual care. | |
| There was minimal change in prescribing antihypertensive drugs in the three groups. All groups increased prescribing of lipid‐lowering drugs but there was little or no difference between groups. There was an increase of 10% more patients’ prescribed antiplatelet treatment in the nurse recall group versus the audit group and 8% more in the nurse recall group versus the general practitioner recall group. | |
| In examining the effects of training and guidelines on prescribing by nurses, the mean change in antibiotic prescribing for all patients showed little or no difference. The mean change for antibiotic prescribing for respiratory infections in children (0 to 5 years) fell. No change was detected in prescribing antibiotics for diarrhoea. There was a mean fall in diazepam prescribing in the intervention group. | |
| In the nurse management patient group at six months there was an increased number and variety of antihypertensive medications and an increased number of medication changes than in the usual care group. | |
| The intervention arm group (VA‐MEDIC) had greater dose titrations of antihypertensive medications, insulin, statins, and niacin compared to the usual care arm. | |
| Intervention arm participants (VA‐MEDIC‐D) had more dose increases or initiation of any antihypertensive agents and more dose increases or initiation of antihyperglycaemic agents. There was little or no difference in the initiation or dose titration of any antihyperlipidaemic agent or antidepressants. | |
| The average number of drugs prescribed per patient was lower in the pharmacist group compared to the physician group. The number of drugs was reduced by an average of 2.2 drugs per patient from the pre‐study to the study year. The practice of clinical pharmacists prescribing drug therapy under physician supervision has the potential to save the healthcare system USD 70,000 per 100 skilled nursing facility beds. | |
| In the pharmacist prescribing arm proportionally more new antihypertensive agents were initiated, more dose changes occurred, more antihypertensives were discontinued, and more patients were prescribed low‐dose aspirin and a statin than in the usual care group. | |
| There was little or no difference in the type of antihypertensives prescribed to intervention and control patients during the study. | |
| Compared with baseline there were more patients in both groups taking antihypertensive medications but this difference was probably only important in the nurse‐led intervention group. | |
| Healthcare visits, health resources, and associated costs | |
| There was no difference in hospitalisations and emergency room visits between the three groups of control (provider education), nurse facilitator, and provider/patient notification. | |
| Hospital admissions were rare and did not differ between the intervention and usual care groups. ED visits did not differ between groups or from baseline. No hospital or ED visits were related to diabetes. The average number of outpatient visits during the study was similar. The nurse managed a case load of 71 patients, but it was estimated that a 300 patient case load could be managed. | |
| There was no change in health utilisation (physician visits, ED visits, days of hospitalisation) for the year before and after the intervention and between groups. | |
| In reporting process measures for the clinical pharmacist’s case management of patients there was a difference between pharmacist intervention and control in the frequency of low‐density lipoprotein measurements, retinal examinations, and monofilament foot examinations but not glycated haemoglobin measurement or urine albumin screen. | |
| Over six months there were a higher number of primary care visits in the usual care arm; an average 1.65 visits per patient versus 1.56 in the intervention arm. It was suggested the difference in the higher number of primary care visits may offset the intervention cost. | |
| The nursing time spent in the year after myocardial infarction was nine hours per patient; a per patient cost of USD 500 which included the nurse salary, office costs, and other associated costs. This compared with cardiac rehabilitation programmes in the San Francisco Bay area costing USD 1800 to USD 2700 to participate for three months. | |
| In investigating the impact of clinical pharmacist interventions in patients with dyslipidaemia there was little or no difference in physician or nurse visits between control and the intervention patients at 12 months. At 12 months the intervention group had more pharmacist visits than the control group. There were little or no difference in costs for hospitalisations, clinic visits, laboratory costs, drug costs, and costs of lipid therapy between groups. The intervention group had a USD 370 greater difference per patient in total costs which was probably not important and approximately 5% of total costs. | |
| In the cohort of patients not yet receiving antiretroviral therapy there was little or no difference in clinic visits with a nurse but clinic visits with a doctor were probably higher in the intervention group. In the cohort of patients who had already received at least six months of antiretroviral therapy clinic visits with a nurse probably higher in the intervention group. Economic data from the study is the subject of further analysis by Barton 2013 (see Studies awaiting classification). | |
| Although the collaborative care model experienced a decrease in the total number of primary care visits, the between‐group difference was probably not important. ED visits increased more in the usual care group but this was probably not important and neither was the difference in utilisation of psychiatric services. The institutional cost of drugs, the cost of antidepressants and the cost of psychotropic drugs overall was higher in the intervention group, but this was not important. | |
| Hospital admissions (while trending to fewer admissions) in the nurse intervention group showed little or no difference to the control group. Nurse case management was not associated with a significant difference in the number of outpatient or ED visits. There was a decrease in total costs in the nurse telephone intervention group comparing the period before and after randomisation. In contrast, there was an increase for the same comparison in the control group. Similar results were seen with hospitalisation and ED costs which were lower in the intervention group. There was probably not an intervention effect on outpatient costs. The difference in average per patient cost between the intervention group (USD 6600) and control group (USD 9033) of USD 2433 was important. The control group had higher baseline hospitalisation rates and total costs cautioning interpretation of the result. | |
| Little or no difference in health services utilisation (hospitalisations, primary care visits, ED visits) between intervention and control patients during the 14‐month study of blood pressure control through a clinical pharmacist outreach programme in diabetic patients. | |
| The pharmacist collaborative group (PharmD‐PCP MTM) had fewer primary care physician visits during the intervention period than did the usual care group. The mean total combined visits of primary care physician and pharmacist was not greater in the PharmD‐PCP MTM group than in usual care. | |
| There was a lower number of visits in the NSD group compared with standard care but not in the duration of visits. Significantly more patients were referred back to their GP by the NSD when meeting treatment goals. Personnel and laboratory costs were lower in the intervention group than the control group. The average per month increase in medication costs between the groups was probably not important apart from the cholesterol‐lowering medications. The average time saving per internist was 61.4 minutes (meaning the internist could supervise 11 patients with the NSD in the time he/she could treat one patient). | |
| The mean number of visits and duration of visits was higher in the practice nurse intervention group than the control group. | |
| The total number of clinic visits (physician plus pharmacist) was higher in the intervention arm compared to the control arm. The number of physician visits was lower in the intervention arm. | |
| Little or no difference in the hospitalisation rate between intervention and control groups. | |
| In testing the non‐inferiority of asthma care in children with stable asthma provided by a hospital‐based specialised asthma nurse versus a GP or paediatrician, there was little or no differences between the groups for medication, school absence or parental work absence after two years. There was little or no difference in unplanned visits and no hospital admissions during the study. | |
| Medium number of outpatient visits were higher for the team based intervention patients. Average personnel costs for one year's treatment were significantly higher in the intervention group (USD 134.68 vs USD 93.70, P < 0.001). | |
| There was little or no difference in the mean number of outpatient clinic visits, total number of ED visits, and hospitalisations between the two groups. The intervention group probably had a higher number of email and telephone encounters. | |
| Over 12 months in the telemonitoring intervention group all 228 patients used a mean of 11.4 ± 3.9 pharmacist visits lasting a mean of 34.2 minutes and 217 used telemonitoring services with a mean of 9.8 ± 2.5 months of use. It was estimated direct programme costs would total USD 1350 per patient. | |
| A reported five per cent drop in gross practice revenue was explained by the absence of billing for services provided by the nurse practitioner. Billing for unsupervised practice was not permitted in Ontario at the time of the study. During the trial year the services rendered by the nurse practitioner were worth approximately USD 16,000 of which almost 50% was for unsupervised practice. | |
| There was little or no differences in primary carer visits, use of ED services for all cause visits, diabetes‐related ED visits or hospital admission rates. | |
| There was little or no difference in the average length of stay or hospitalisations although the latter trended lower in the pharmacist group. Differences favouring the pharmacist group were found in the rate of discharge to home or to a lower level of care. | |
| Little or no differences between intervention and control groups in appointments with the primary care provider during the 6 months of the study. | |
| ED: emergency department | |
| Outcome or subgroup title | No. of studies | No. of participants | Statistical method | Effect size |
| 1 Systolic blood pressure mmHg Show forest plot | 21 | Mean Difference (IV, Fixed, 95% CI) | Subtotals only | |
| 1.1 6 months | 11 | 2076 | Mean Difference (IV, Fixed, 95% CI) | ‐6.76 [‐8.24, ‐5.27] |
| 1.2 12 months | 12 | 4229 | Mean Difference (IV, Fixed, 95% CI) | ‐5.31 [‐6.46, ‐4.16] |
| 1.3 6 months systolic blood pressure removing cluster effect (Margolis) | 10 | 1628 | Mean Difference (IV, Fixed, 95% CI) | ‐6.13 [‐7.83, ‐4.44] |
| 1.4 12 months systolic blood pressure excluding cluster trials (Khunti and Margolis) | 10 | 2627 | Mean Difference (IV, Fixed, 95% CI) | ‐4.84 [‐6.29, ‐3.39] |
| 1.5 Systolic blood pressure at 6 months (more NMP prescribing autonomy) | 4 | 695 | Mean Difference (IV, Fixed, 95% CI) | ‐2.98 [‐5.36, ‐0.59] |
| 2 HbA1c (%) Show forest plot | 8 | Mean Difference (IV, Fixed, 95% CI) | Subtotals only | |
| 2.1 HbA1c 6 mths | 3 | 271 | Mean Difference (IV, Fixed, 95% CI) | ‐0.42 [‐0.75, ‐0.09] |
| 2.2 HbA1c 12 mths | 6 | 775 | Mean Difference (IV, Fixed, 95% CI) | ‐0.62 [‐0.85, ‐0.38] |
| 3 Low‐density lipoprotein (LDL) mmol/L Show forest plot | 11 | Mean Difference (IV, Fixed, 95% CI) | Subtotals only | |
| 3.1 LDL 6 mths | 6 | 1213 | Mean Difference (IV, Fixed, 95% CI) | ‐0.25 [‐0.34, ‐0.17] |
| 3.2 LDL 12 mths | 7 | 1469 | Mean Difference (IV, Fixed, 95% CI) | ‐0.21 [‐0.29, ‐0.14] |
| 4 Low‐density lipoprotein pharmacist vs nurse 6 mths Show forest plot | 6 | 1213 | Mean Difference (IV, Fixed, 95% CI) | ‐0.25 [‐0.34, ‐0.17] |
| 4.1 Pharmacist | 4 | 629 | Mean Difference (IV, Fixed, 95% CI) | ‐0.09 [‐0.20, 0.02] |
| 4.2 Nurse | 2 | 584 | Mean Difference (IV, Fixed, 95% CI) | ‐0.52 [‐0.67, ‐0.38] |
| 5 Adherence (continuous) Show forest plot | 4 | 700 | Std. Mean Difference (IV, Fixed, 95% CI) | 0.15 [0.00, 0.30] |
| 6 Adherence (dichotomous) Show forest plot | 4 | 935 | Risk Difference (M‐H, Fixed, 95% CI) | 0.06 [‐0.00, 0.12] |
| 7 Health‐related quality of life Show forest plot | 8 | Mean Difference (IV, Fixed, 95% CI) | Subtotals only | |
| 7.1 Physical component (SF12 or 36) | 8 | 2385 | Mean Difference (IV, Fixed, 95% CI) | 1.17 [0.16, 2.17] |
| 7.2 Mental component (SF‐12 or 36) | 6 | 2246 | Mean Difference (IV, Fixed, 95% CI) | 0.58 [‐0.40, 1.55] |
| 8 Health facility resource use Show forest plot | 5 | Risk Difference (M‐H, Fixed, 95% CI) | Subtotals only | |
| 8.1 Emergency Department visits | 3 | 4626 | Risk Difference (M‐H, Fixed, 95% CI) | 0.01 [‐0.02, 0.03] |
| 8.2 Hospitalisations | 5 | 4870 | Risk Difference (M‐H, Fixed, 95% CI) | ‐0.01 [‐0.03, 0.01] |