Alemtuzumab para la esclerosis múltiple
Información
- DOI:
- https://doi.org/10.1002/14651858.CD011203.pub2Copiar DOI

- Base de datos:
-
- Cochrane Database of Systematic Reviews
- Versión publicada:
-
- 15 abril 2016see what's new
- Tipo:
-
- Intervention
- Etapa:
-
- Review
- Grupo Editorial Cochrane:
-
Grupo Cochrane de Esclerosis múltiple y enfermedades raras del sistema nervioso central
- Copyright:
-
- Copyright © 2016 The Cochrane Collaboration. Published by John Wiley & Sons, Ltd.
Cifras del artículo
Altmetric:
Citado por:
Autores
Contributions of authors
-
RR was the contact person with the editorial base who co‐ordinated the contributions from co‐authors and was responsible for the final draft of the review.
-
RR, GJMP and MRT worked on study selection, data extraction, 'Risk of bias' assessment and GRADE.
-
RR and GJMP performed the results analyses.
-
RR, GJMP and MRT wrote the discussion and conclusions.
-
RR responded to the clinical comments of the referees.
-
RR, GJMP and MRT answered the methodological and statistical questions of the referees.
-
RR, GJMP and MRT will be in charge of further updating.
Sources of support
Internal sources
-
Brazilian Cochrane Centre, Brazil.
External sources
-
No sources of support supplied
Declarations of interest
RR: none
GJMP: none
MRT: none
Acknowledgements
The review authors would like to thank:
-
the Cochrane Multiple Sclerosis and Rare Diseases of the Central Nervous System Review Group, especially Liliana Coco (Managing Editor) and Andrea Fittipaldo (Trials Search Co‐ordinator) for their kind help;
-
the reviewers (content experts and consumer representative), who provided useful comments and suggestions, including Loredana La Mantia and Lorenzo Brait.
-
the Handbook Study Group from the Brazilian Cochrane Centre for methodological support;
-
Cristine Migliorini for her effort and dedication in publishing the protocol for this review.
Version history
| Published | Title | Stage | Authors | Version |
| 2023 Jun 05 | Alemtuzumab for multiple sclerosis | Review | Rachel Riera, Maria Regina Torloni, Ana Luiza C Martimbianco, Rafael L Pacheco | |
| 2016 Apr 15 | Alemtuzumab for multiple sclerosis | Review | Rachel Riera, Gustavo JM Porfírio, Maria R Torloni | |
| 2014 Jul 08 | Alemtuzumab for multiple sclerosis | Protocol | Rachel Riera, Gustavo Porfirio, Cristine R Migliorini, Maria R Torloni | |
Differences between protocol and review
-
One of the co‐authors of the protocol, for unforeseen reasons, could no longer collaborate on the review and asked to be excluded from authoring.
-
We planned the following subgroup analyses at the protocol stage but did not perform them due to lack of sufficient data: different doses and regimens, disease type (relapsing‐remitting, primary‐progressive, secondary‐progressive or progressive‐relapsing), disability at baseline (EDSS scores ≤ 5.0 or ≥ 5.5).
-
We did not plan the subgroup analysis taking into account previous treatment (naive versus pre‐treated patients) at the protocol stage but as it seemed to be clinically relevant, we performed it when there were sufficient data.
-
In the protocol, we proposed to assess 'number of participants without relapse' and 'number of progression‐free participants' as primary outcomes. However, we found available data only for 'relapse‐free survival' and 'sustained disease progression‐free survival'. We decided to use both of these measures in the final review, since they are the opposite of the same measurement and this change would not influence the effect of the intervention nor its interpretation.
-
In the protocol, we proposed to assess the 'Changes in the number of MRI T2‐ and T1‐weighted lesions after treatment'. However, we discussed among the review authors and peer reviewers whether 'Patients with new or enlarging T2‐hyperintense lesions' could more relevant for decision‐making, since it comprises the total area of all MS lesions. Moreover, since this is a dichotomous measure, it could be easier for physicians and consumers to interpret. We considered this outcome relevant enough (despite the fact that it is a secondary outcome) to warrant a change in its presentation regardless of the tool/measurement used to assess it. Therefore we decided to change the way it was measured, leading to the presentation of the existing results.
-
We planned the following outcomes for the 'Summary of findings' table at the protocol stage but we did not include them due to lack of data: one‐point EDSS score increase confirmed at three months' follow‐up and quality of life. We included the outcome dropout rate in the 'Summary of findings' table.
-
In the protocol we did not pre‐define the use of the hazard ratio to estimate the effect size of time‐to‐event outcomes. We added this information in the final version of the review because we used this measure for the outcomes relapse‐free survival and sustained disease progression.
Keywords
MeSH
Medical Subject Headings (MeSH) Keywords
Medical Subject Headings Check Words
Adult; Humans;
PICO

Study flow diagram.

'Risk of bias' summary: review authors' judgements about each risk of bias item for each included study.

'Risk of bias' graph: review authors' judgements about each risk of bias item presented as percentages across all included studies.

Forest plot of comparison: 1 Alemtuzumab 12 mg versus interferon beta‐1a, outcome: 1.1 Relapse‐free survival.

Forest plot of comparison: 1 Alemtuzumab 12 mg versus interferon beta‐1a, outcome: 1.2 Sustained disease progression‐free survival.

Forest plot of comparison: 1 Alemtuzumab 12 mg versus interferon beta‐1a, outcome: 1.2 Rate of participants with at least one adverse event.

Comparison 1 Alemtuzumab 12 mg versus interferon beta‐1a, Outcome 1 Relapse‐free survival.

Comparison 1 Alemtuzumab 12 mg versus interferon beta‐1a, Outcome 2 Sustained disease progression‐free survival.

Comparison 1 Alemtuzumab 12 mg versus interferon beta‐1a, Outcome 3 Number of participants with at least one adverse event.

Comparison 1 Alemtuzumab 12 mg versus interferon beta‐1a, Outcome 4 Change in EDSS score.

Comparison 1 Alemtuzumab 12 mg versus interferon beta‐1a, Outcome 5 Number of participants with new or enlarging T2‐hyperintense lesions.
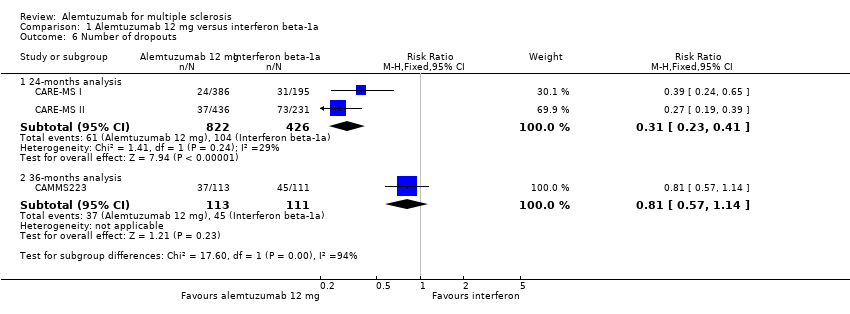
Comparison 1 Alemtuzumab 12 mg versus interferon beta‐1a, Outcome 6 Number of dropouts.
| Alemtuzumab 12 mg compared to interferon beta‐1a for multiple sclerosis | ||||||
| Patient or population: patients with multiple sclerosis | ||||||
| Outcomes | Illustrative comparative risks* (95% CI) | Relative effect | No of participants | Quality of the evidence | Comments | |
| Assumed risk | Corresponding risk | |||||
| Interferon beta‐1a | Alemtuzumab 12 mg | |||||
| Relapse‐free survival | Not estimated | Not estimated | HR 0.50 (0.41 to 0.60) | 1248 | ⊕⊕⊕⊝ | — |
| Sustained disease progression‐free survival | Not estimated | Not estimated | HR 0.62 (0.44 to 0.87) | 1191 | ⊕⊕⊕⊝ | — |
| Number of participants with at least one adverse event | Study population | RR 1.04 | 1248 | ⊕⊕⊕⊝ | — | |
| 94 per 100 | 98 per 100 | |||||
| Moderate | ||||||
| 94 per 100 | 98 per 100 | |||||
| Change in EDSS score | — | The mean change in EDSS score in the intervention groups was | — | 1199 | ⊕⊝⊝⊝ | — |
| Number of participants with new or enlarging T2‐hyperintense lesions | 69 per 100 | 51 per 100 | RR 0.74 | 1238 | ⊕⊕⊕⊝ | — |
| Dropouts | Study population | RR 0.31 | 1248 | ⊕⊕⊝⊝ | — | |
| 24 per 100 | 8 per 100 | |||||
| Moderate | ||||||
| 24 per 100 | 7 per 100 | |||||
| *The basis for the assumed risk (e.g. the median control group risk across studies) is provided in footnotes. The corresponding risk (and its 95% confidence interval) is based on the assumed risk in the comparison group and the relative effect of the intervention (and its 95% CI). | ||||||
| GRADE Working Group grades of evidence | ||||||
| 1Participants and personnel were not blinded and this outcome could be affected by this fact. | ||||||
| Outcome or subgroup title | No. of studies | No. of participants | Statistical method | Effect size |
| 1 Relapse‐free survival Show forest plot | 2 | Hazard Ratio (Fixed, 95% CI) | Subtotals only | |
| 1.1 24‐month analysis | 2 | Hazard Ratio (Fixed, 95% CI) | 0.50 [0.41, 0.60] | |
| 2 Sustained disease progression‐free survival Show forest plot | 3 | Hazard Ratio (Fixed, 95% CI) | Subtotals only | |
| 2.1 24‐month analysis | 2 | Hazard Ratio (Fixed, 95% CI) | 0.62 [0.44, 0.87] | |
| 2.2 36‐month analysis | 1 | Hazard Ratio (Fixed, 95% CI) | 0.25 [0.11, 0.57] | |
| 3 Number of participants with at least one adverse event Show forest plot | 3 | Risk Ratio (M‐H, Fixed, 95% CI) | Subtotals only | |
| 3.1 24‐month analysis | 2 | 1248 | Risk Ratio (M‐H, Fixed, 95% CI) | 1.04 [1.01, 1.06] |
| 3.2 36‐month analysis | 1 | 224 | Risk Ratio (M‐H, Fixed, 95% CI) | 1.0 [0.98, 1.02] |
| 4 Change in EDSS score Show forest plot | 3 | Mean Difference (IV, Random, 95% CI) | Subtotals only | |
| 4.1 24‐month analysis | 2 | 1199 | Mean Difference (IV, Random, 95% CI) | ‐0.20 [‐0.60, 0.20] |
| 4.2 36‐month analysis | 1 | 223 | Mean Difference (IV, Random, 95% CI) | ‐0.7 [‐1.04, ‐0.36] |
| 5 Number of participants with new or enlarging T2‐hyperintense lesions Show forest plot | 2 | 1238 | Risk Ratio (M‐H, Random, 95% CI) | 0.74 [0.59, 0.91] |
| 6 Number of dropouts Show forest plot | 3 | Risk Ratio (M‐H, Fixed, 95% CI) | Subtotals only | |
| 6.1 24‐months analysis | 2 | 1248 | Risk Ratio (M‐H, Fixed, 95% CI) | 0.31 [0.23, 0.41] |
| 6.2 36‐months analysis | 1 | 224 | Risk Ratio (M‐H, Fixed, 95% CI) | 0.81 [0.57, 1.14] |