| 1 Global symptoms of dyspepsia (2 to 8 weeks) Show forest plot | 16 | 5968 | Risk Ratio (M‐H, Random, 95% CI) | 0.88 [0.82, 0.94] |
|
| 2 Global symptoms of dyspepsia by duration of treatment Show forest plot | 16 | | Risk Ratio (M‐H, Random, 95% CI) | Subtotals only |
|
| 2.1 2 weeks' therapy | 4 | 1169 | Risk Ratio (M‐H, Random, 95% CI) | 0.78 [0.70, 0.87] |
| 2.2 4 weeks' therapy | 10 | 3540 | Risk Ratio (M‐H, Random, 95% CI) | 0.93 [0.84, 1.03] |
| 2.3 8 weeks' therapy | 2 | 1259 | Risk Ratio (M‐H, Random, 95% CI) | 0.89 [0.84, 0.94] |
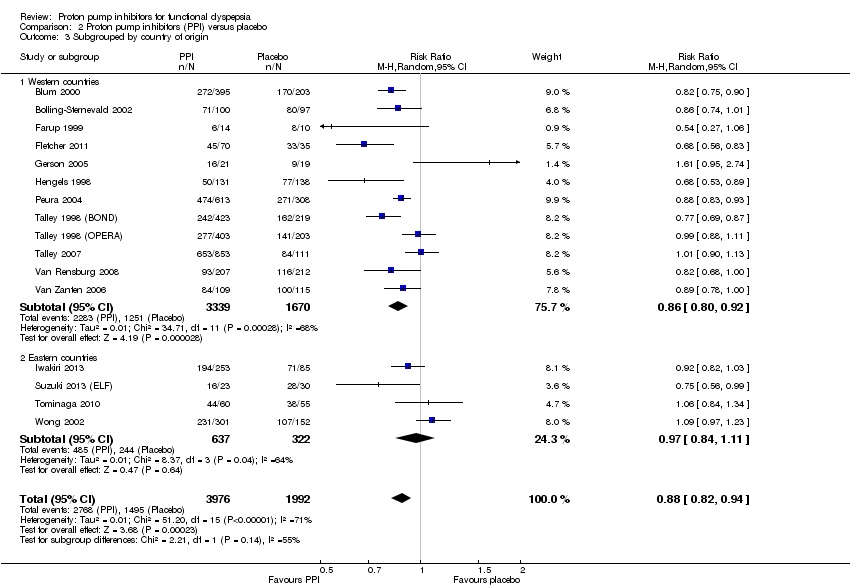
| 3 Subgrouped by country of origin Show forest plot | 16 | 5968 | Risk Ratio (M‐H, Random, 95% CI) | 0.88 [0.82, 0.94] |
|
| 3.1 Western countries | 12 | 5009 | Risk Ratio (M‐H, Random, 95% CI) | 0.86 [0.80, 0.92] |
| 3.2 Eastern countries | 4 | 959 | Risk Ratio (M‐H, Random, 95% CI) | 0.97 [0.84, 1.11] |
| 4 Subgrouped byHelicobacter pylori status Show forest plot | 6 | 3023 | Risk Ratio (M‐H, Random, 95% CI) | 0.89 [0.82, 0.96] |
|
| 4.1 H. pylori negative | 6 | 1721 | Risk Ratio (M‐H, Random, 95% CI) | 0.94 [0.83, 1.06] |
| 4.2 H. pylori positive | 6 | 1302 | Risk Ratio (M‐H, Random, 95% CI) | 0.84 [0.76, 0.93] |
| 5 Subgroup by PPI subtype Show forest plot | 16 | 5968 | Risk Ratio (M‐H, Random, 95% CI) | 0.88 [0.82, 0.94] |
|
| 5.1 Omeprazole vs placebo | 6 | 2107 | Risk Ratio (M‐H, Random, 95% CI) | 0.87 [0.77, 0.98] |
| 5.2 Esomeprazole vs placebo | 2 | 1188 | Risk Ratio (M‐H, Random, 95% CI) | 0.95 [0.83, 1.08] |
| 5.3 Lansoprazole vs placebo | 5 | 1801 | Risk Ratio (M‐H, Random, 95% CI) | 0.82 [0.70, 0.97] |
| 5.4 Pantoprazole vs placebo | 1 | 419 | Risk Ratio (M‐H, Random, 95% CI) | 0.82 [0.68, 1.00] |
| 5.5 Rabeprazole vs placebo | 2 | 453 | Risk Ratio (M‐H, Random, 95% CI) | 0.95 [0.84, 1.08] |
| 6 Subgrouped by 24‐hour pH study Show forest plot | 2 | 168 | Risk Ratio (M‐H, Random, 95% CI) | 1.03 [0.73, 1.47] |
|
| 6.1 Abnormal 24‐hour pH test (> 4% pH < 4) | 2 | 75 | Risk Ratio (M‐H, Random, 95% CI) | 0.91 [0.70, 1.19] |
| 6.2 Normal 24‐hour pH test (< 4% pH < 4) | 2 | 93 | Risk Ratio (M‐H, Random, 95% CI) | 1.27 [0.49, 3.29] |
| 7 Subgrouped by Rome III dyspepsia subtypes Show forest plot | 2 | 326 | Risk Ratio (M‐H, Random, 95% CI) | 0.91 [0.80, 1.03] |
|
| 7.1 Epigastric pain syndrome | 2 | 77 | Risk Ratio (M‐H, Random, 95% CI) | 0.99 [0.76, 1.28] |
| 7.2 Postprandial distress syndrome | 2 | 249 | Risk Ratio (M‐H, Random, 95% CI) | 0.89 [0.77, 1.03] |
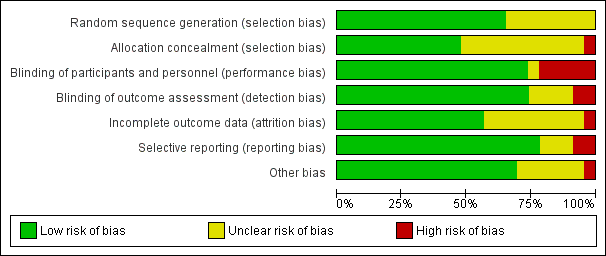
| 8 Subgrouped by low vs unclear vs high risk of bias Show forest plot | 16 | 5968 | Risk Ratio (M‐H, Random, 95% CI) | 0.88 [0.82, 0.94] |
|
| 8.1 Low risk of bias | 5 | 1744 | Risk Ratio (M‐H, Random, 95% CI) | 0.83 [0.72, 0.95] |
| 8.2 Unclear risk of bias | 8 | 3196 | Risk Ratio (M‐H, Random, 95% CI) | 0.89 [0.82, 0.96] |
| 8.3 High risk of bias | 3 | 1028 | Risk Ratio (M‐H, Random, 95% CI) | 1.00 [0.64, 1.56] |
| 9 Quality of life Show forest plot | 3 | | Mean Difference (IV, Random, 95% CI) | Subtotals only |
|
| 9.1 Psychological General Well‐Being Index | 2 | 1177 | Mean Difference (IV, Random, 95% CI) | 0.54 [‐1.55, 2.63] |
| 9.2 36‐item Short Form | 1 | 453 | Mean Difference (IV, Random, 95% CI) | ‐1.11 [‐5.32, 3.10] |
| 10 Adverse events Show forest plot | 7 | 2917 | Risk Ratio (M‐H, Random, 95% CI) | 1.04 [0.80, 1.35] |
|