Methylphenidate untuk kanak‐kanak dan remaja dengan gangguan spektrum autisme
Appendices
Appendix 1. Search strategies
Cochrane Central Register of Controlled Trials (CENTRAL) in the Cochrane Library
#1MeSH descriptor: [Central Nervous System Stimulants] this term only
#2MeSH descriptor: [Methylphenidate] this term only
#3methylphenidate*
#4(Attenta* or Biphentin* or Centedrin* or Concerta* or Daytrana* or dexmethylphenidat* or Equasym*)
#5(Focalin* or Medikinet* or Metadate* or Methylin* or Penid* or Phenidyl* or Ritalin* or Rubifen or tranquilyn* or Tsentedrin*)
#6{or #1‐#5}
#7[mh "child development disorders, pervasive"]
#8[mh "Developmental Disabilities"]
#9(pervasive next development* next disorder)
#10(pervasive and child*)
#11(PDD or PDDs or PDD‐NOS or ASD or ASDs)
#12autis*
#13asperger*
#14kanner*
#15"childhood schizophrenia "
#16Rett*
#17{or #7‐#16}
#18 #6 and #17
MEDLINE Ovid
1 Central Nervous System Stimulants/
2 Methylphenidate/
3 Methylphenidat$.mp.
4 (Attenta$ or Biphentin$ or Centedrin$ or Concerta$ or Daytrana$ or dexmethylphenidat$ or Equasym$).mp.
5 (Focalin$ or Medikinet$ or Metadate$ or Methylin$ or Methylphenidat$ or Penid$ or Phenidyl$ or Ritalin$ or Rubifen or tranquilyn$ or Tsentedrin$).mp.
6 or/1‐5
7 exp child development disorders, pervasive/
8 Developmental Disabilities/
9 pervasive development$ disorder$.tw.
10 (pervasive adj3 child$).tw.
11 (PDD or PDDs or PDD‐NOS or ASD or ASDs).tw.
12 autis$.tw.
13 asperger$.tw.
14 kanner$.tw.
15 childhood schizophrenia.tw.
16 Rett$.tw.
17 or/7‐16
18 6 and 17
MEDLINE In‐ Process Ovid
1 Methylphenidat$.mp.
2 (Attenta$ or Biphentin$ or Centedrin$ or Concerta$ or Daytrana$ or dexmethylphenidat$ or Equasym$).mp.
3 (Focalin$ or Medikinet$ or Metadate$ or Methylin$ or Methylphenidat$ or Penid$ or Phenidyl$ or Ritalin$ or Rubifen or tranquilyn$ or Tsentedrin$).mp.
4 pervasive development$ disorder$.tw.
5 (pervasive adj3 child$).tw.
6 (PDD or PDDs or PDD‐NOS or ASD or ASDs).tw.
7 autis$.tw.
8 asperger$.tw.
9 kanner$.tw.
10 childhood schizophrenia.tw.
11 Rett$.tw.
12 or/1‐3
13 or/4‐11
14 12 and 13
MEDLINE Epub Ahead of Print Ovid
1 Methylphenidat$.mp.
2 (Attenta$ or Biphentin$ or Centedrin$ or Concerta$ or Daytrana$ or dexmethylphenidat$ or Equasym$).mp.
3 (Focalin$ or Medikinet$ or Metadate$ or Methylin$ or Methylphenidat$ or Penid$ or Phenidyl$ or Ritalin$ or Rubifen or tranquilyn$ or Tsentedrin$).mp.
4 pervasive development$ disorder$.tw.
5 (pervasive adj3 child$).tw.
6 (PDD or PDDs or PDD‐NOS or ASD or ASDs).tw.
7 autis$.tw.
8 asperger$.tw.
9 kanner$.tw.
10 childhood schizophrenia.tw.
11 Rett$.tw.
12 or/1‐3
13 or/4‐11
14 12 and 13
Embase Ovid
1 Central nervous system stimulants/
2 methylphenidate/
3 Methylphenidat$.mp.
4 (Attenta$ or Biphentin$ or Centedrin$ or Concerta$ or Daytrana$ or dexmethylphenidat$ or Equasym$).mp.
5 (Focalin$ or Medikinet$ or Metadate$ or Methylin$ or Methylphenidat$ or Penid$ or Phenidyl$ or Ritalin$ or Rubifen or tranquilyn$ or Tsentedrin$).mp.
6 or/1‐5
7 exp autism/
8 pervasive development$ disorder$.tw.
9 (PDD or PDDs or ASD or ASDs).tw.
10 autis$.tw.
11 asperger$.tw.
12 kanner$.tw.
13 childhood schizophreni$.tw.
14 Rett$.tw. (3687)
15 (pervasive adj3 child$).tw.
16 or/7‐15
17 6 and 16
18 Clinical trial/
19 Randomized controlled trial/
20 Single blind procedure/
21 Double blind procedure/
22 triple blind procedure/
23 Crossover procedure/
24 Randomi#ed.tw.
25 (random$ adj3 (allocat$ or assign$)).tw.
26 randomly.ab.
27 groups.ab.
28 trial.ab.
29 ((singl$ or doubl$ or trebl$ or tripl$) adj3 (blind$ or mask$)).tw.
30 Placebo$.tw.
31 (crossover or cross‐over).tw.
32 or/18‐31
33 (animal/ or nonhuman/ or animal experiment/) and human/
34 animal/ or nonhuman/ or animal experiment/
35 34 not 33
36 32 not 35
CINAHL Plus EBSCOhost (Cumulative Index to Nursing and Allied Health Literature)
S15 S5 AND S14
S14 S6 OR S7 OR S8 OR S9 OR S10 OR S11 OR S12 OR S13
S13 Rett*
S12 childhood schizophren*
S11 kanner*
S10 (PDD or PDDs or PDD‐NOS or ASD or ASDs)
S9 (pervasive N3 child*)
S8 pervasive development* disorder*
S7 autis* or asperger*
S6 (MH "Child Development Disorders, Pervasive+")
S5 S1 OR S2 OR S3 OR S4
S4 (Attenta* or Biphentin* or Centedrin* or Concerta* or Daytrana* or dexmethylphenidat* or Equasym*)
S3 (Focalin* or Medikinet* or Metadate* or Methylin* or Penid* or Phenidyl* or Ritalin* or Rubifen or tranquilyn* or Tsentedrin*)
S2 methylphenidat*
S1 (MH "Methylphenidate")
PsycINFO Ovid
1 CNS stimulating drugs/
2 methylphenidate/
3 Methylphenidat$.mp.
4 (Attenta$ or Biphentin$ or Centedrin$ or Concerta$ or Daytrana$ or dexmethylphenidat$ or Equasym$).mp.
5 (Focalin$ or Medikinet$ or Metadate$ or Methylin$ or Methylphenidat$ or Penid$ or Phenidyl$ or Ritalin$ or Rubifen or tranquilyn$ or Tsentedrin$).mp.
6 or/1‐5
7 exp pervasive developmental disorders/
8 Developmental disabilities/
9 pervasive development$ disorder$.tw.
10 (pervasive adj3 child$).tw.
11 autis$.tw.
12 asperger$.tw.
13 (autis$ or ASD or ASDs).tw.
14 (ASD or ASDs or PDD or PDDs).tw.
15 Rett$.tw.
16 Kanner$.tw.
17 or/7‐16
18 6 and 17
ERIC (Education Resources Information Center)
ERIC Proquest
Searched up to 2014.
(SU.EXACT.EXPLODE("Pervasive Developmental Disorders") OR autis* OR Asperger* OR kanner* OR "pervasive development* disorder*" OR "childhood schizophrenia" OR pervasive NEAR/3 child* OR pdd OR pdds OR asd OR asds OR pdd‐nos)) AND (Attenta* OR Biphentin* OR Centedrin* OR Concerta* OR Daytrana* OR dexmethylphenidat* OR Equasym* OR Focalin* OR Medikinet* OR Metadate* OR Methylphenidat* OR Methylin* OR Penid* OR Phenidyl* OR Ritalin* OR Rubifen OR tranquilyn* OR Tsentedrin*)
ERIC EBSCOhost
Searched after 2014.
S1DE "Developmental Disabilities"
S2DE "Pervasive Developmental Disorders" OR DE "Asperger Syndrome" OR DE "Autism"
S3(pervasive development* disorder* or PDD or PDDs)
S4(autis* or ASD or ASDs)
S5Asperger*
S6Rett*
S7Kanner*
S8childhood schizophren*
S9S1 OR S2 OR S3 OR S4 OR S5 OR S6 OR S7 OR S8
S10methylphenidat*
S11(Attenta* or Biphentin* or Centedrin* or Concerta* or Daytrana* or dexmethylphenidat* or Equasym*)
S12(Focalin* or Medikinet* or Metadate* or Methylin* or Penid* or Phenidyl* or Ritalin* or Rubifen or tranquilyn* or Tsentedrin*)
S13S10 OR S11 OR S12
S14S9 AND S13
Science Citation Index, Social Sciences Citation Index, Conference Proceedings Citation Index ‐ Science, Conference Proceedings Citation Index ‐ Social Sciences & Humanities; all Web of Science
# 7 #6 AND #3
# 6 #5 OR #4
# 5 TS=(Focalin* or Medikinet* or Metadate* or Methylin* or methylphenidat* or Penid* or Phenidyl* or Ritalin* or Rubifen or tranquilyn* or Tsentedrin*)
# 4 TS=(Attenta* or Biphentin* or Centedrin* or Concerta* or Daytrana* or dexmethylphenidat* or Equasym*)
#3 #2 OR #1
# 2 TS=(PDD or PDDs or PDD‐NOS or ASD or ASDs)
# 1 TS=(autis* or asperger* or Rett* or "pervasive developmental " or (pervasive NEAR/3 child) or "childhood schizoprenia")
Cochrane Database of Systematic Reviews (CDSR) part of the Cochrane Library
#1MeSH descriptor: [Central Nervous System Stimulants] this term only
#2MeSH descriptor: [Methylphenidate] this term only
#3methylphenidate*:ti,ab
#4(Attenta* or Biphentin* or Centedrin* or Concerta* or Daytrana* or dexmethylphenidat* or Equasym*):ti,ab
#5(Focalin* or Medikinet* or Metadate* or Methylin* or Penid* or Phenidyl* or Ritalin* or Rubifen or tranquilyn* or Tsentedrin*):ti,ab
#6{or #1‐#5}
#7[mh "child development disorders, pervasive"]
#8[mh "Developmental Disabilities"]
#9(pervasive next development* next disorder):ti,ab
#10(pervasive and child*):ti,ab
#11(PDD or PDDs or PDD‐NOS or ASD or ASDs):ti,ab
#12autis*:ti,ab
#13asperger*:ti,ab
#14kanner*:ti,ab
#15childhood schizophrenia:ti,ab
#16Rett*:ti,ab
#17{or #7‐#16}
Database of Abstracts of Reviews of Effects (DARE) part of the Cochrane Library
#1MeSH descriptor: [Central Nervous System Stimulants] this term only
#2MeSH descriptor: [Methylphenidate] this term only
#3methylphenidate*
#4(Attenta* or Biphentin* or Centedrin* or Concerta* or Daytrana* or dexmethylphenidat* or Equasym*)
#5(Focalin* or Medikinet* or Metadate* or Methylin* or Penid* or Phenidyl* or Ritalin* or Rubifen or tranquilyn* or Tsentedrin*)
#6{or #1‐#5}
#7[mh "child development disorders, pervasive"]
#8[mh "Developmental Disabilities"]
#9(pervasive next development* next disorder)
#10(pervasive and child*)
#11(PDD or PDDs or PDD‐NOS or ASD or ASDs)
#12autis*
#13asperger*
#14kanner*
#15"childhood schizophrenia "
#16Rett*
#17{or #7‐#16}
AutismData
methylphenidate and random*
Proquest Dissertations & Theses
ALL(Attenta* or Biphentin* or Centedrin or Concerta* or Daytrana* or dexmethylphenidat* or Equasym* or Focalin* or Medikinet* or Metadate* or Methylin* or Methylphenidat* or Penid* or Phenidyl* or Ritalin* or Rubifen or tranquilyn* or Tsentedrin*) AND ALL(autis* or asperger* or ASD or pervasive)
ClinicalTrials.gov
methylphenidate AND autism
World Health Organziation International Clinical Trials Registry Platform (WHO ICTRP)
Advanced search Condition : autism OR asperger* OR pervasive Intervention: methylphenidate OR ritalin
Synonyms included automatically : AUTISTIC DISORDER, AUTISTIC DISORDERS, AUTISTIC SPECTRUM DISORDER (ASD), DISORDER, AUTISTIC, DISORDERS, AUTISTIC, KANNER SYNDROME, KANNER'S SYNDROME, KANNERS SYNDROME, PERVASIVE DEVELOPMENTAL DISORDER (PDD), SCHIZOPHRENIC REACTION, SYNDROME, KANNER'S, autism ‐ DAYTRANA, RITALIN, methylphenidate
Appendix 2. Summary of searches
| Database | Date of search | Date range or issue | Number of records | Limits applied to searches |
| Cochrane Central Register of Controlled Trials (CENTRAL) in the Cochrane Library | 16 May 2014 | 2014 Issue 4 | 24 | No limits |
| 21 November 2016 | 2016 Issue 10 | 18 | 2014‐2016 | |
| MEDLINE Ovid | 15 May 2014 | 1946 to May Week 1 2014 | 181 | No limits |
| 21 November 2016 | 1946 to November Week 2 2016 | 52 | From 2014 | |
| MEDLINE In‐Process Ovid | 15 May 2014 | 14 May 2014 | 17 | No limits |
| 21 November 2016 | 18 November 2016 | 13 | No limits | |
| MEDLINE Epub Ahead of Print Ovid | 21 November 2016 | 18 November 2016 | 1 | No limits |
| Embase Ovid | 16 May 2014 | 1980 to 2014 Week 19 | 284 | No limits |
| 21 November 2016 | 1974 to 18 November 2016 | 66 | From 2014 | |
| CINAHLPlus EBSCOhost (Cumulative Index to Nursing and Allied Health Literature) | 16 May 2014 | 1936 to 16 May 2014 | 46 | No limits |
| 21 November 2016 | 1936 to 21 November 2016 | 6 | 2014‐2016 | |
| PsycINFO Ovid | 16 May 2014 | 1806 to May Week 2 2014 | 114 | No limits |
| 21 November 2016 | 1806 to November Week 2 2016 | 20 | From 2014 | |
| ERIC Proquest (Education Resources Information Center) | 16 May 2014 | 1966 to 16 May 2014 | 17 | No limits |
| ERIC EBSCOhost (Education Resources Information Center) | 22 November 2016 | 1966 to 22 November 2016 | 0 | From 2014 |
| Science Citation Index, Social Sciences Citation Index, Conference Proceedings Citation Index ‐ Science, Conference Proceedings Citation Index ‐ Social Sciences & Humanities; all Web of Science | 16 May 2014 | 1970 to 15 May 2014 | 165 | No limits |
| 22 November 2016 | 1970 to 21 November 2016 | 42 | 2014‐2016 | |
| Cochrane Database of Systematic Reviews part of the Cochrane Library | 16 May 2014 | 2014 Issue 5 | 0 | No limits |
| 21 November 2016 | 2016 Issue 11 | 1 | 2014‐2016 | |
| Database of Abstracts of Reviews of Effects part of the Cochrane Library | 16 May 2014 | 2014 Issue 2 | 0 | No limits |
| 21 November 2016 | 2015 Issue 2 (Final issue) | 0 | 2014‐2016 | |
| AutismData www.autism.org.uk/autismdata | 16 May 2014 | All available years | 6 | No limits |
| 22 November 2016 | All available years | 1 | 2014‐2016 | |
| Proquest Dissertations & Theses | 2 December 2016 | All available years | 11 | No limits |
| ClinicalTrials.gov clinicaltrials.gov | 16 May 2014 | All available years | 6 | No limits |
| 22 November 2016 | All available years | 2 | Registered between 1 May 2014 and 22 November 2016 | |
| WHO ICTRP apps.who.int/trialsearch | 16 May 2014 | All available years | 8 | No limits |
| 22 November 2016 | All available years | 1 | Registered between 1 May 2014 and 22 November 2016 | |
| Total | 1102 | |||
Appendix 3. Data extraction workbook
Primary outcome 1: inattention
| Study reference | Trial data | |||||||||||
| Instrument | ||||||||||||
| Subscale | ||||||||||||
| N items | ||||||||||||
| Item rating | ||||||||||||
| Rater | ||||||||||||
| Participant age | ||||||||||||
| N | ||||||||||||
| Treatment duration | ||||||||||||
| Treatment dose | ||||||||||||
| Short acting or CR | ||||||||||||
| Time point at which outcomes measured | ||||||||||||
| Results |
Primary outcome 2: impulsivity
| Study reference | Trial data |
| Instrument | |
| Subscale | |
| N items | |
| Item rating | |
| Rater | |
| Participant age | |
| N | |
| Treatment duration | |
| Treatment dose | |
| Short acting or CR | |
| Time point at which outcomes measured | |
| Results |
Primary outcome 3: hyperactivity
| Study reference | Trial data |
| Instrument | |
| Subscale | |
| N items | |
| Item rating | |
| Rater | |
| Participant age | |
| N | |
| Treatment duration | |
| Treatment dose | |
| Short acting or CR | |
| Time point at which outcomes measured | |
| Results |
Primary outcome 4: impaired social interaction
| Study reference | Trial data |
| Instrument | |
| Subscale | |
| N items | |
| Item rating | |
| Rater | |
| Participant age | |
| N | |
| Treatment duration | |
| Treatment dose | |
| Short acting or CR | |
| Time point at which outcomes measured | |
| Results |
Primary outcome 5: impaired communication
| Study reference | Trial data |
| Instrument | |
| Subscale | |
| N items | |
| Item rating | |
| Rater | |
| Participant age | |
| N | |
| Treatment duration | |
| Treatment dose | |
| Short acting or CR | |
| Time point at which outcomes measured | |
| Results |
Primary outcome 6: stereotypical behaviours
| Study reference | Trial data |
| Instrument | |
| Subscale | |
| N items | |
| Item rating | |
| Rater | |
| Participant age | |
| N | |
| Treatment duration | |
| Treatment dose | |
| Short acting or CR | |
| Time point at which outcomes measured | |
| Results |
Primary outcome 7: overall ASD
| Study reference | Trial data |
| Instrument | |
| Subscale | |
| N items | |
| Item rating | |
| Rater | |
| Participant age | |
| N | |
| Treatment duration | |
| Treatment dose | |
| Short acting or CR | |
| Time point at which outcomes measured | |
| Results |
Secondary outcome: adverse events
| Study reference | Trial data |
| Instrument | |
| Subscale | |
| N items | |
| Item rating | |
| Rater | |
| Participant age | |
| N | |
| Treatment duration | |
| Treatment dose | |
| Short acting or CR | |
| Time point at which outcomes measured | |
| Results |
Footnotes
ASD: autism spectrum disorder;CR: controlled release ; N: number.
Appendix 4. Criteria for assigning 'Risk of bias' judgements
-
Sequence generation ‐ determines whether generation of the random numbers was adequate. We assessed the risk of bias of sequence generation as low, high or unclear.
-
Low – computer‐generated random numbers or random number tables.
-
High – random numbers are generated by sequentially allocating groups.
-
Unclear – when information about the generation of random numbers is described inadequately or not at all.
-
-
Allocation concealment ‐ determines whether the method used to conceal allocation was adequate to prevent selection bias during the randomisation process before allocation. We assessed the risk of bias of allocation and concealment as low, high or unclear.
-
Low – used methods such as central allocation, or sealed opaque envelopes.
-
High – participants or investigators could possibly foresee the allocated treatment. For example, numbering participants and only including even numbers in the control group.
-
Unclear – when the method of allocation concealment is described inadequately or not at all.
-
-
Blinding of participants and personnel. We assessed the risk of bias related to blinding of participants and personnel as low, high or unclear.
-
Low – participants or investigators are unable to determine the treatment allocated.
-
High – participants or investigators could possibly determine the treatment allocated.
-
Unclear – information about blinding is insufficient to make a judgement of low or high risk of bias.
-
-
Blinding of outcome assessment. We assessed the risk of bias related to blinding of outcome assessment as low, high or unclear.
-
Low – outcome assessors are unable to determine the treatment allocated.
-
High – outcome assessors have knowledge or could have knowledge of the allocated treatment, and this could have influenced their assessment (for example, in the case of instruments assessed through interview).
-
Unclear – information about blinding of outcome assessors is insufficient to make a judgement of low or high risk of bias.
-
-
Incomplete outcome data – assesses whether missing data were accounted for. We assessed the risk of bias related to incomplete outcome data as low, high or unclear.
-
Low – no missing outcome data, or reasons for missing outcome data reported and unlikely to be related to true outcome or have a clinically relevant impact on observed effect size.
-
High – reason for missing outcome data likely to be related to true outcome, or plausible effect size among missing outcomes enough to induce clinically relevant bias in observed effect size, or as‐treated analysis with substantial departure of the intervention received from that assigned at randomisation, or potentially inappropriate application of simple imputation.
-
Unclear – insufficient reporting of attrition/exclusions or reasons for missing data to permit judgement of risk.
-
-
Selective reporting – assesses if all planned outcomes are reported. We assessed selective reporting by comparing the reported outcomes with those published in the protocol of the study, if available. If a previously published protocol was not available, we compared the outcomes described in the methods section of the paper with the outcomes reported in the same paper. We assessed risk of bias related to selective reporting as low, high or unclear.
-
Low – all planned outcomes are reported.
-
High – not all planned outcomes are reported and no reasons given.
-
Unclear – insufficient information on planned outcomes available.
-
-
Other sources of bias – assesses other potential sources of bias not captured by the domains above such as funding of the trial and conflicts of interest of the authors or investigators. We assessed other sources of bias as low, high or unclear.
-
Low – studies appear to be free of other sources of bias.
-
High – studies funded by a manufacturer or studies authored by one or more employees of a manufacturer unless there is an explicit and sufficient description of the independence of the funding source and employees in the analysis and reporting of the study results, or potential source of bias related to the specific study design used.
-
Unclear – insufficient information to assess whether an important risk of bias exists (e.g. conflicts of interest not reported, or authors have previously received funding from relevant pharmaceutical companies which are not directly involved in funding of included studies)
-
Appendix 5. Unused methods
Unit of analysis issues
The unit of analysis is typically the individual participant. In situations where this is not the case, for example, repeated observations on participants or in cluster‐randomised trials, we planned to undertake the appropriate analysis (see below) that takes these variations into account (Higgins 2011c).
Cluster‐randomised trials
In cluster‐randomised trials, groups rather than individuals are randomised, which requires an adjustment to be made to account for the clustering effect. If trials used cluster randomisation, we would have expected cluster effects to have been appropriately controlled for (robust standard errors or hierarchical linear models). If it was unclear whether appropriate controls for clustering were applied, we planned to contact the investigators for further details. If appropriate controlling was not used, we planned to request and reanalyse individual participant data using appropriate multilevel models. Following this, we planned to analyse effect sizes and standard errors in Review Manager 5 (RevMan 5) (Review Manager 2014) using the generic inverse method (Deeks 2017). If there was insufficient information to control for clustering, we planned to enter outcome data using individuals as the units of analysis, and then conduct a sensitivity analysis to assess the impact of inadequately controlled cluster‐randomised trials on the effect estimate.
The method for adjustment for clustering suggested in the Cochrane Handbook for Systematic Reviews of Interventions (Higgins 2011c) is based on reducing the size of effect of each clustered trial to its 'effective sample size', which is the original sample size of the cluster‐randomised trial divided by the 'design effect' (i.e. 1 + (M – 1) *ICC, where M is the average cluster size and ICC is the intracluster correlation coefficient) (Higgins 2011c). We planned to estimate the ICC based upon similar studies (in similar populations, but including other treatments). This would have enabled us to pool non‐clustered and clustered trials to obtain an overall estimate of effect.
Trials with repeated measurements
In trials with repeated measurements for the same patient (for example, measurements at different time points), we planned to attempt to reduce the impact of multiple analysis by analysing the most frequently reported or the most clinically relevant time points (usually the longest duration of follow‐up, which is likely to be the best indication of a clinically sustainable effect), or both (Higgins 2011c).
Trials with multiple treatment arms
We planned to attempt to combine arms to create a single pair‐wise comparison where appropriate (for example, slow‐ or controlled‐release and immediate‐release methylphenidate formulations). If this was not possible, we planned to use all treatment groups but split the comparison (placebo) group evenly across the intervention groups (Higgins 2011c). Criteria for assessing the relevance of the treatment arms for each comparison would have included clinical relevance (is the expected clinical effect likely to be different or not?) and clinical availability or use of the treatment in question (for example, transdermal formulations of methylphenidate are not commonly used. Therefore, if a trial has two active treatment arms with one of them a transdermal patch, we might have chosen to consider only the oral formulation).
Dealing with missing data
We planned to perform an intention‐to‐treat (ITT) analysis to account for missing data. The ITT analysis considers all missing participant data of all randomised patients as a treatment failure. We planned to compare ITT analysis results with the results of 'on‐treatment' or 'complete case analysis' (all participants completing treatment) or per protocol (all participants following protocol or at least one dose of the allocated treatment) results to assess the impact of missing data on the overall estimate of effect.
Assessment of reporting bias
We planned to draw a funnel plot if there were 10 or more studies included in the review. We would have visually examined the graph for asymmetry and, if present, assessed whether the association between estimated intervention effects and study size was greater than what could have been attributed to chance, using tests described in the Cochrane Handbook for Systematic Reviews of Interventions (Sterne 2017). We planned to use the 'trim and fill' method, which entails first 'trimming' (removing) the smaller studies causing funnel plot asymmetry, then using the trimmed funnel plot to estimate the true 'centre' of the funnel, and subsequently replacing the omitted studies and their missing 'counterparts' around the centre (filling). As well as providing an estimate of the number of missing studies, we planned to calculate an adjusted intervention effect by performing a meta‐analysis, which would have included the filled studies (Sterne 2017).
Subgroup analysis
We planned to conduct a subgroup analysis based on participant ages (6 to 12 years, and 13 to 18 years), but no studies included participants over the age of 14 years. The one study that included 13‐year‐old participants did not report any individual participant data, so we were unable to extract these results.
We planned to conduct a subgroup analysis based on immediate‐release versus extended‐release formulation, but only study used the extended‐release form (Pearson 2013).
Sensitivity analysis
We planned to perform a sensitivity analysis to assess the impact of risk of bias on the overall result by adding or removing studies with a high risk of bias to the meta‐analysis. We classified studies as being at high risk of bias if one or more of the following items were assessed at high risk: random number generation, allocation concealment, blinding of participants and personnel, and/or blinding outcome assessment.
We planned to explore the impact of heterogeneity on the overall pooled effect estimate by adding or removing studies that were contributing to the heterogeneity. By visually examining the forest plot, studies that are outliers and are potential sources for heterogeneity can be identified. We planned to remove the outliers one by one and assess the impact on the overall outcome.
We planned to perform a sensitivity analysis to explore the impact of missing data on the overall outcome by comparing the analyses with available outcome data with those following the ITT principle (see Dealing with missing data).
Appendix 6. Individual adverse effects
Gastrointestinal events
Abdominal discomfort
Two studies, Handen 2000 and Pearson 2013, included abdominal discomfort in their adverse effects checklist rated by teachers. However, abdominal discomfort was reported for only one child in the treatment group in Pearson 2013, which corresponds to a non‐significant RR of 3.00 (95% CI 0.13 to 70.16). We were not able to pool the results of both studies because abdominal discomfort was not reported in Handen 2000 (Analysis 1.4).
Two studies, Pearson 2013 and RUPP 2005, included abdominal discomfort in their adverse effects checklist rated by parents. The pooled difference in rates between treatment and placebo was not statistically significant (RR 4.30, 95% CI 0.91 to 20.34; 74 participants; Analysis 5.3). There was no clear heterogeneity given the I2 of 0%.
Reduced appetite
Two studies, Handen 2000 and Pearson 2013, both included reduced appetite in their adverse effects checklist rated by teachers. The pooled difference between treatment and placebo was not statistically significant (RR 1.33, 95% CI 0.43 to 4.12; 34 participants; Analysis 1.4).
Only one study, Pearson 2013, reported on weight and found no significant difference in average weight at any dose of methylphenidate. There was no clear heterogeneity given the I2 of 19%. We applied a random‐effects model and this did not change the results.
Two studies, Pearson 2013 and RUPP 2005, both included reduced appetite in their adverse effects checklist rated by parents. The pooled difference between treatment and placebo was statistically significant (RR 8.28, 95% CI 2.57 to 26.73; 74 participants; Analysis 5.3); the risk for reduced appetite was almost eight times higher in the treatment group compared to placebo. This RR is equivalent to a risk difference (RD) of 0.24 (95% CI 0.13 to 0.35), with a number needed to treat for one additional harmful outcome of 4.17 (95% CI 7.69 to 2.86). An I2 of 0% did not indicate heterogeneity.
Other
Other recorded gastrointestinal effects included diarrhoea (RUPP 2005), dry mouth and nausea (Pearson 2013). The difference between treatment and placebo was not statistically significant for any of these symptoms.
General physical adverse events
Dizziness
Two studies, Handen 2000 and Pearson 2013, included symptoms of dizziness in their adverse effects checklist rated by teachers. However, we were not able to pool the results of both studies because dizziness was not reported in the Pearson 2013 study (Analysis 1.4).
Dizziness was not included in any of the studies' adverse effects checklists rated by parents.
Drowsiness
Two studies, Handen 2000 and Pearson 2013, included symptoms of drowsiness in their adverse effects checklist rated by the teachers. The pooled difference between treatment and placebo was not statistically significant (RR 2.00, 95% CI 0.47 to 8.55; 34 participants; Analysis 1.4). An I2 of 10% did not indicate any clear heterogeneity.
Drowsiness was not included in the adverse effects checklists rated by parents in any of the studies.
Headache
Two studies, Handen 2000 and Pearson 2013, included headache in their adverse effects checklists rated by teachers. However, were not able to pool the results of both studies because headache was not reported in the Handen 2000 study (Analysis 1.4).
Two studies, Pearson 2013 and RUPP 2005, included headache in their adverse effects checklists rated by parents. The pooled difference between treatment and placebo was not statistically significant (RR 1.87, 95% CI 0.10 to 33.86; 74 participants; Analysis 5.3). An I2 of 58% indicated moderate heterogeneity. There is no evident clinical explanation for this heterogeneity, although Pearson 2013 used an extended‐release preparation and is likely to have studied less unwell children who may have been more able to communicate the presence of headache.
Sleep disturbance
Sleep disturbance was not included in the adverse effects checklists rated by teachers in any of the studies.
Two studies, Pearson 2013 and RUPP 2005, included sleep disturbance in their adverse effects checklists rated by parents. The pooled difference between treatment and placebo was not statistically significant (RR 3.51, 95% CI 0.59 to 20.82; 74 participants Analysis 5.3). An I2 of 62% indicated moderate heterogeneity. There is no evident clinical explanation for this heterogeneity, although Pearson 2013 used an extended‐release preparation in the morning (and an immediate‐release preparation in the afternoon).
Increased activity
Hyperactivity was one of our primary outcomes and was rated using psychometric scales in all four studies. Results for this outcome are reported above (see Analysis 1.2 for teachers and Analysis 5.2 for parents).
Two studies, Handen 2000 and RUPP 2005, also included increased activity in their adverse effects checklists rated by teachers. Neither reported a significant difference between treatment and placebo. We were unable to pool this data because the effect was rated by teachers in Handen 2000 and by parents in RUPP 2005.
Other
Two studies recorded other general physical effects related to fever and skin rash (Pearson 2013), and fatigue (RUPP 2005). The difference between treatment and placebo was not statistically significant for any of these effects.
Two studies reported blood pressure and pulse (Pearson 2013; RUPP 2005). RUPP 2005 did not report any results and Pearson 2013 reported no significant differences at any dose of methylphenidate as measured by clinicians. Pearson 2013 also included racing heart in their adverse effects checklist rated by parents, and reported no significant difference, while RUPP 2005 included bradycardia in their adverse effects checklist, and reported no significant difference between treatment and placebo (RUPP 2005).
Psychological effects
Anxiety
Two studies, Handen 2000 and Pearson 2013, included anxiety in their adverse effects checklist rated by teachers. The pooled difference between treatment and placebo was not statistically significant (RR 1.02, 95% CI 0.47 to 2.18; 34 participants; Analysis 1.4). There was no clear heterogeneity given the I2 of 0%. We applied a random‐effects model and this did not change the results.
Two studies, Pearson 2013 and RUPP 2005, included anxiety in their adverse effects checklist rated by parents. The pooled difference between treatment and placebo was not statistically significant (RR 1.13, 95% CI 0.22 to 5.79; 74 participants; Analysis 5.3). An I2 of 50% indicated moderate heterogeneity. There is no evident clinical explanation for this heterogeneity, although Pearson 2013 used an extended‐release preparation and is likely to have studied less unwell children who may have been more able to communicate adverse psychological effects.
Depressed mood
Two studies, Handen 2000 and Pearson 2013, included depressed mood in their adverse effects checklists rated by teachers. The pooled difference between treatment and placebo was not statistically significant (RR 1.19, 95% CI 0.37 to 3.79; 34 participants; Analysis 1.4). An I2 of 55% indicated moderate heterogeneity. Pearson 2013 used an extended‐release preparation and is likely to have studied less unwell children who may have been more able to communicate adverse psychological effects.
Two studies, Pearson 2013 and RUPP 2005, included symptoms of depressed mood in their adverse effects checklist rated by parents. The pooled difference between treatment and placebo was not statistically significant (RR 1.75, 95% CI 0.05 to 62.33; 74 participants; Analysis 5.3). An I2 of 74% indicated considerable heterogeneity. Pearson 2013 used an extended‐release preparation and is likely to have studied less unwell children who may have been more able to communicate adverse psychological effects.
Irritability
Two studies, Handen 2000 and Pearson 2013, recorded symptoms of irritability rated by teachers. The pooled difference between treatment and placebo was not statistically significant (RR 0.81, 95% CI 0.29 to 2.27; 34 participants; Analysis 1.4). An I2 of 46% indicated moderate heterogeneity. Pearson 2013 used an extended‐release preparation and is likely to have studied less unwell children who may have been more able to communicate adverse psychological, cognitive and/or affective states.
Two studies, Pearson 2013 and RUPP 2005, both included symptoms of irritability in their adverse effects checklists rated by parents. The pooled difference between treatment and placebo was not statistically significant (RR 1.25, 95% CI 0.25 to 6.36; 74 participants; Analysis 5.3). An I2 of 71% indicated considerable heterogeneity. Pearson 2013 used an extended‐release preparation and is likely to have studied less unwell children who may have been more able to communicate adverse psychological, cognitive and/or affective states.
Social withdrawal
Social withdrawal is one aspect of impaired social interaction and it was one of our primary outcomes. Two studies, Handen 2000 and RUPP 2005, included social withdrawal in their adverse effects checklists. Neither reported a significant difference between methylphenidate and placebo. We were unable to pool this data because the effect was rated by teachers in Handen 2000 and by parents in RUPP 2005.
Impaired social interaction was rated using psychometric scales in three studies (Handen 2000; Pearson 2013; RUPP 2005). Combined results for this outcome are reported above (see Analysis 1.3 for teachers and Analysis 5.2 for parents).
Other psychological effects
Two studies recorded other psychological effects including emotional outbursts and self‐injury in RUPP 2005 and euphoria in Pearson 2013. The difference between treatment and placebo was not statistically significant for self‐injury or euphoria, but RUPP 2005 reported a significant increase in emotional outbursts at medium‐dose methylphenidate.
Repetitive behaviours
We included repetitive, restrictive and stereotypical behaviours as a primary outcome in our review. Four studies assessed this outcome; three by teachers (Handen 2000; Quintana 1995; RUPP 2005), and one by parents (Pearson 2013), using psychometric scales.
Repetitive behaviours, movements and/or tics were also listed on the adverse events checklist used by parents in three studies (Handen 2000; Pearson 2013; RUPP 2005), as reported below.
General repetitive behaviours
Repetitive behaviours were not recorded for teachers.
Two studies, Pearson 2013 and RUPP 2005, included repetitive behaviours in the adverse events checklist rated by parents. The pooled difference between treatment and placebo was not statistically significant (RR 0.87, 95% CI 0.43 to 1.75; 74 participants; Analysis 5.3). An I2 of 8% indicated no clear heterogeneity.
Repetitive movements or tics
Two studies, Handen 2000 and Pearson 2013, included repetitive movements and tics in their adverse events checklists rated by teachers. The pooled difference between treatment and placebo was not statistically significant (RR 0.57, 95% CI 0.21 to 1.57; 34 participants; Analysis 1.4). One study, Quintana 1995, also measured abnormal involuntary movements rated by the paediatrician on a psychometric scale and reported no significant difference between treatment and placebo. An I2 of 0% indicated no heterogeneity.
Repetitive movements were not recorded for parents.
Other repetitive behaviours
One study, Pearson 2013, reported other repetitive behaviours included in their adverse events checklist, namely hair or skin pulling, unusual blinking, and repetitive language. The difference between treatment and placebo was not statistically significant for any of these effects.
Other adverse events
One study, Pearson 2013, also included staring in the adverse events checklist. The difference between treatment and placebo was not statistically significant.

Study flow diagram.

Risk of bias graph: review authors' judgements about each risk of bias item presented as percentages across all included studies.
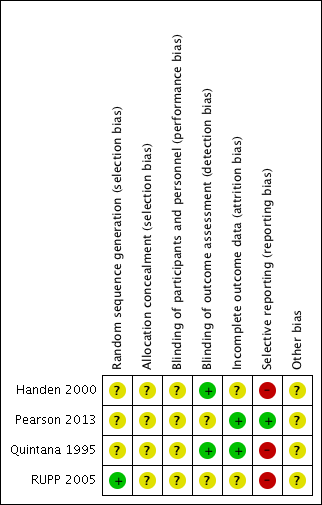
Risk of bias summary: review authors' judgements about each risk of bias item for each included study.

Comparison 1 TEACHER rated: high dose versus placebo, Outcome 1 Primary outcome: ADHD symptoms ‐ inattention (same measurement instrument).

Comparison 1 TEACHER rated: high dose versus placebo, Outcome 2 Primary outcome: ADHD symptoms ‐ hyperactivity (different measurement instrument).
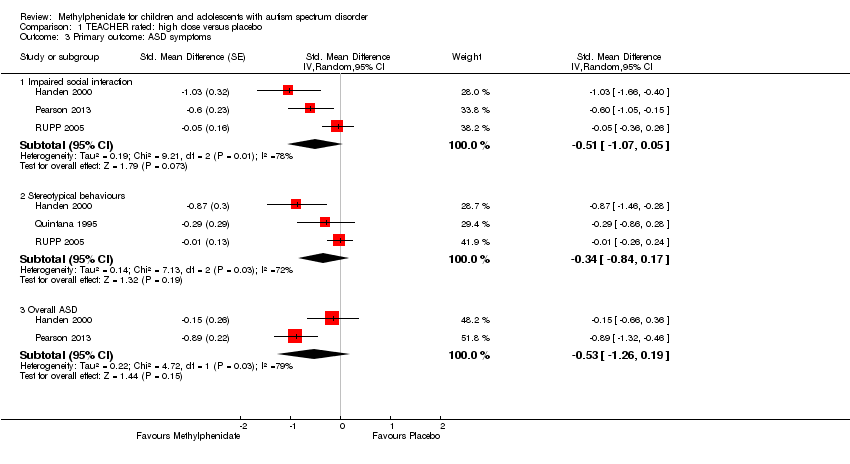
Comparison 1 TEACHER rated: high dose versus placebo, Outcome 3 Primary outcome: ASD symptoms.

Comparison 1 TEACHER rated: high dose versus placebo, Outcome 4 Secondary outcome: adverse events.

Comparison 2 TEACHER rated ‐ sensitivity: correlation 0, Outcome 1 Primary outcome: ADHD symptoms ‐ inattention (same measurement instrument).
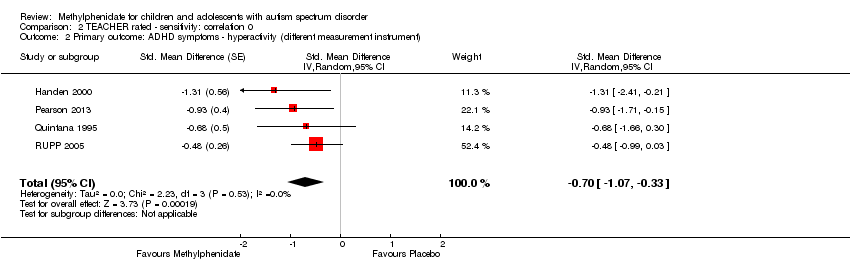
Comparison 2 TEACHER rated ‐ sensitivity: correlation 0, Outcome 2 Primary outcome: ADHD symptoms ‐ hyperactivity (different measurement instrument).

Comparison 2 TEACHER rated ‐ sensitivity: correlation 0, Outcome 3 Primary outcome: ASD symptoms.

Comparison 3 TEACHER rated ‐ sensitivity: correlation 0.8, Outcome 1 Primary outcome: ADHD symptoms ‐ inattention (same measurement instrument).

Comparison 3 TEACHER rated ‐ sensitivity: correlation 0.8, Outcome 2 Primary outcome: ADHD symptoms ‐ hyperactivity (different measurement instrument).

Comparison 3 TEACHER rated ‐ sensitivity: correlation 0.8, Outcome 3 Primary outcome: ASD symptoms.
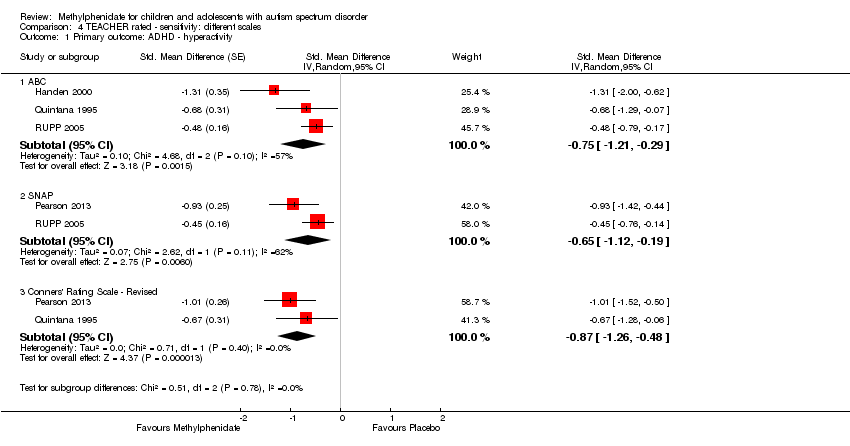
Comparison 4 TEACHER rated ‐ sensitivity: different scales, Outcome 1 Primary outcome: ADHD ‐ hyperactivity.

Comparison 5 PARENT rated: high dose versus placebo, Outcome 1 Primary outcome: ADHD symptoms (same measurement instrument).

Comparison 5 PARENT rated: high dose versus placebo, Outcome 2 Primary outcome: ASD symptoms ‐ impaired social interaction.
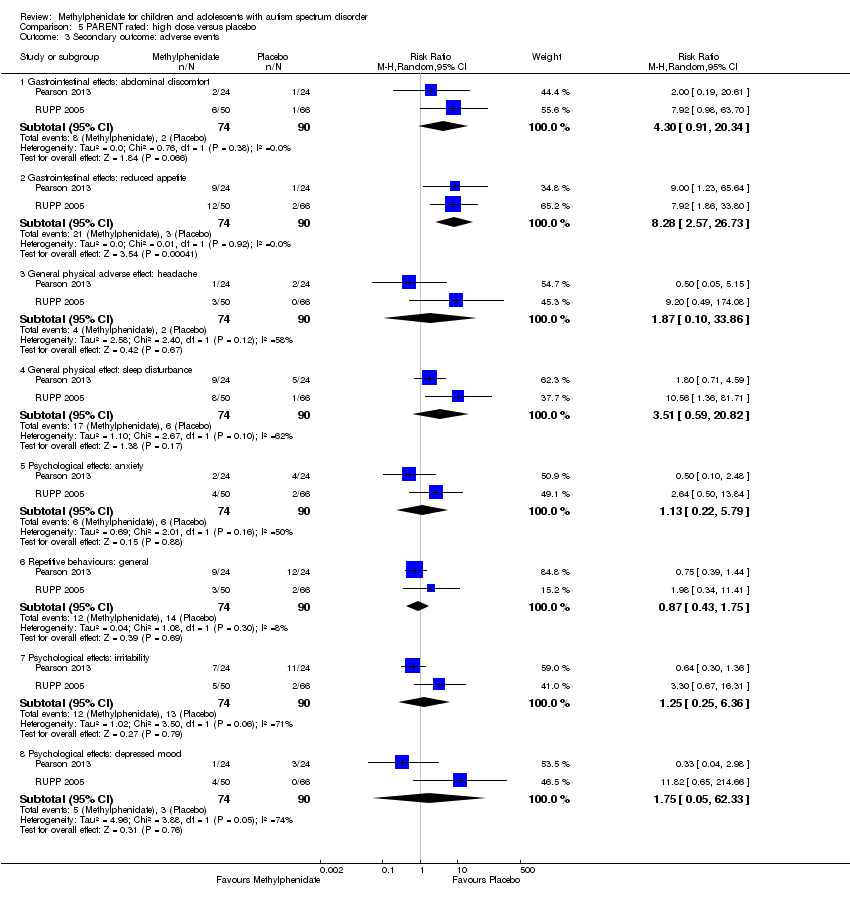
Comparison 5 PARENT rated: high dose versus placebo, Outcome 3 Secondary outcome: adverse events.
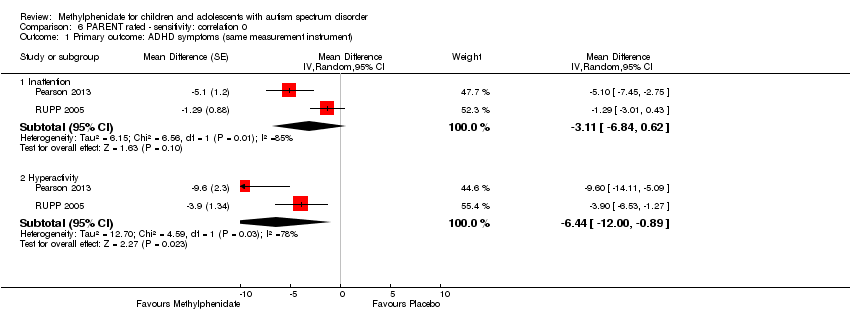
Comparison 6 PARENT rated ‐ sensitivity: correlation 0, Outcome 1 Primary outcome: ADHD symptoms (same measurement instrument).
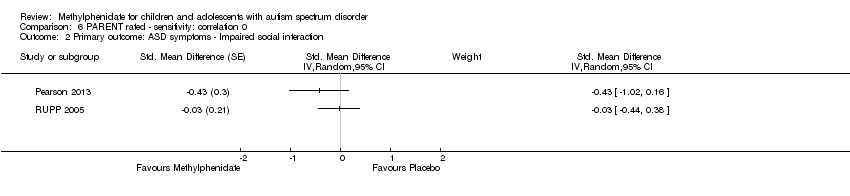
Comparison 6 PARENT rated ‐ sensitivity: correlation 0, Outcome 2 Primary outcome: ASD symptoms ‐ Impaired social interaction.
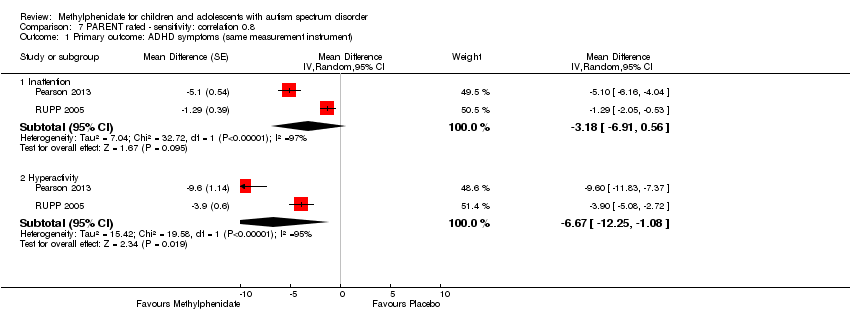
Comparison 7 PARENT rated ‐ sensitivity: correlation 0.8, Outcome 1 Primary outcome: ADHD symptoms (same measurement instrument).

Comparison 7 PARENT rated ‐ sensitivity: correlation 0.8, Outcome 2 Primary outcome: ASD symptoms ‐ Impaired social interaction.
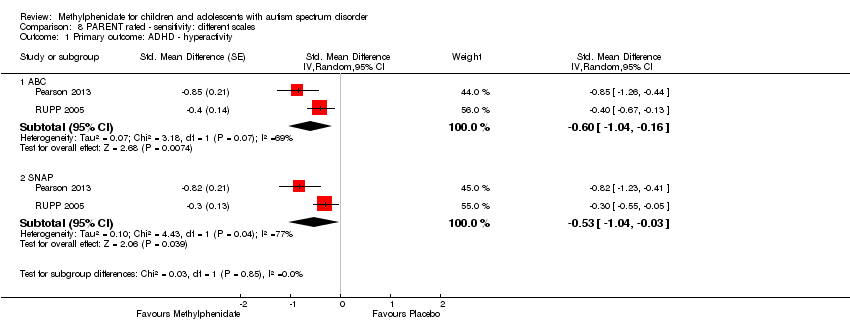
Comparison 8 PARENT rated ‐ sensitivity: different scales, Outcome 1 Primary outcome: ADHD ‐ hyperactivity.

Comparison 9 TEACHER rated ‐ subgroup: doses, Outcome 1 Primary outcome: ADHD ‐ inattention.

Comparison 9 TEACHER rated ‐ subgroup: doses, Outcome 2 Primary outcome: ADHD ‐ hyperactivity.

Comparison 9 TEACHER rated ‐ subgroup: doses, Outcome 3 Primary outcome: ASD ‐ impaired social interaction.

Comparison 9 TEACHER rated ‐ subgroup: doses, Outcome 4 Primary outcome: ASD ‐ stereotypical behaviours.
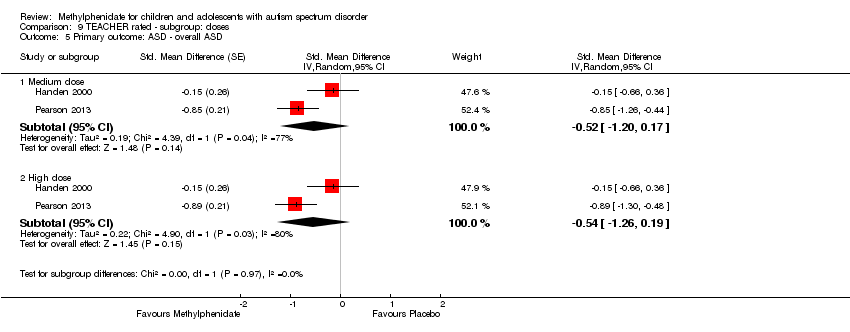
Comparison 9 TEACHER rated ‐ subgroup: doses, Outcome 5 Primary outcome: ASD ‐ overall ASD.
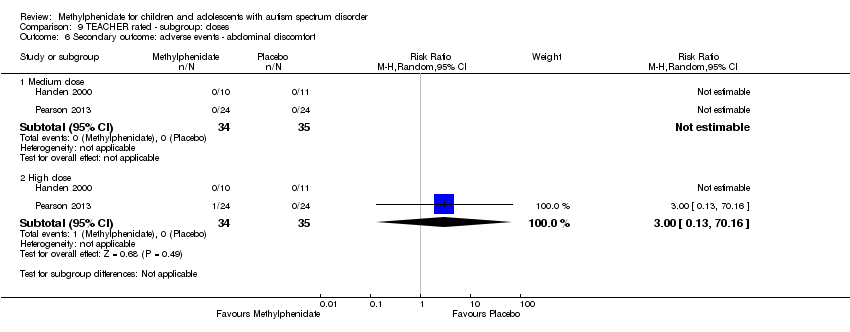
Comparison 9 TEACHER rated ‐ subgroup: doses, Outcome 6 Secondary outcome: adverse events ‐ abdominal discomfort.

Comparison 9 TEACHER rated ‐ subgroup: doses, Outcome 7 Secondary outcome: adverse events ‐ reduced appetite.
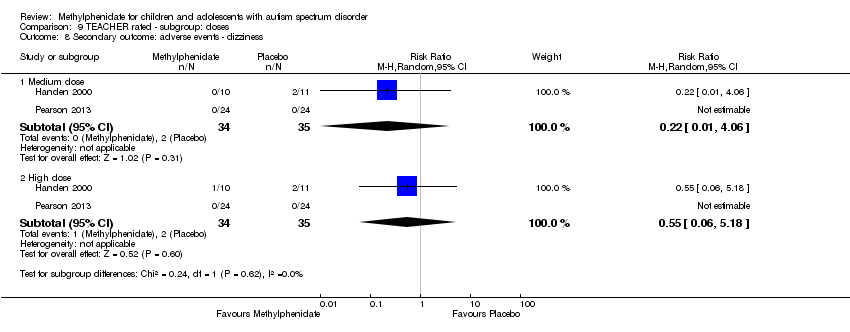
Comparison 9 TEACHER rated ‐ subgroup: doses, Outcome 8 Secondary outcome: adverse events ‐ dizziness.
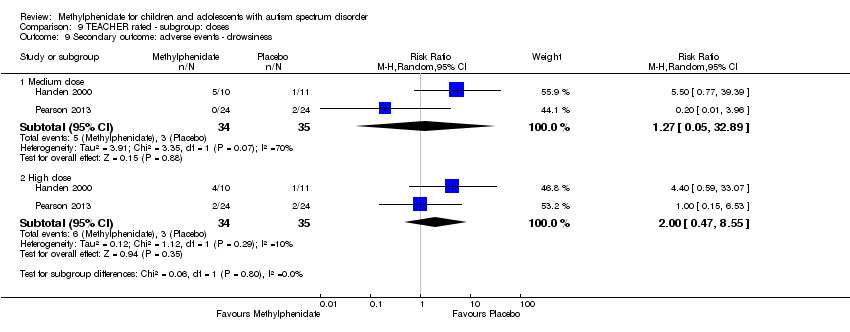
Comparison 9 TEACHER rated ‐ subgroup: doses, Outcome 9 Secondary outcome: adverse events ‐ drowsiness.

Comparison 9 TEACHER rated ‐ subgroup: doses, Outcome 10 Secondary outcome: adverse events ‐ headache.
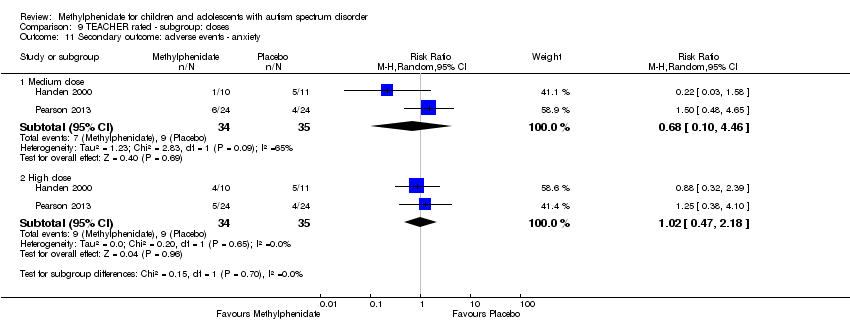
Comparison 9 TEACHER rated ‐ subgroup: doses, Outcome 11 Secondary outcome: adverse events ‐ anxiety.

Comparison 9 TEACHER rated ‐ subgroup: doses, Outcome 12 Secondary outcome: adverse events ‐ depressed mood.
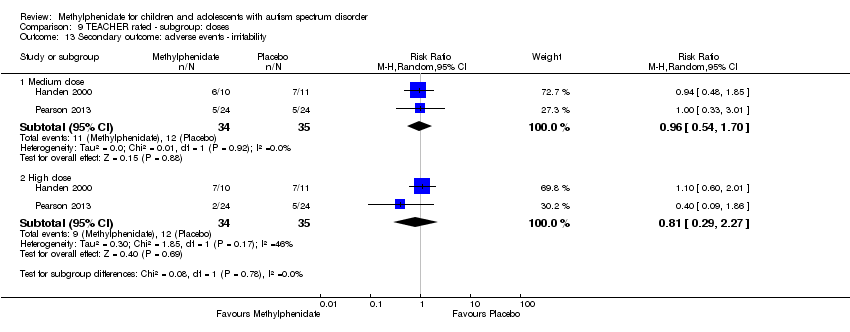
Comparison 9 TEACHER rated ‐ subgroup: doses, Outcome 13 Secondary outcome: adverse events ‐ irritability.
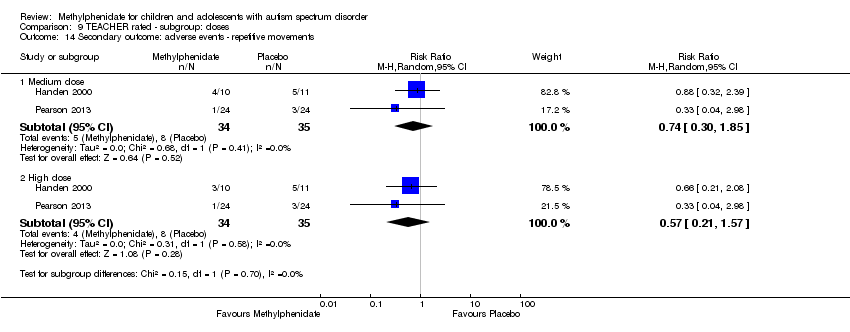
Comparison 9 TEACHER rated ‐ subgroup: doses, Outcome 14 Secondary outcome: adverse events ‐ repetitive movements.
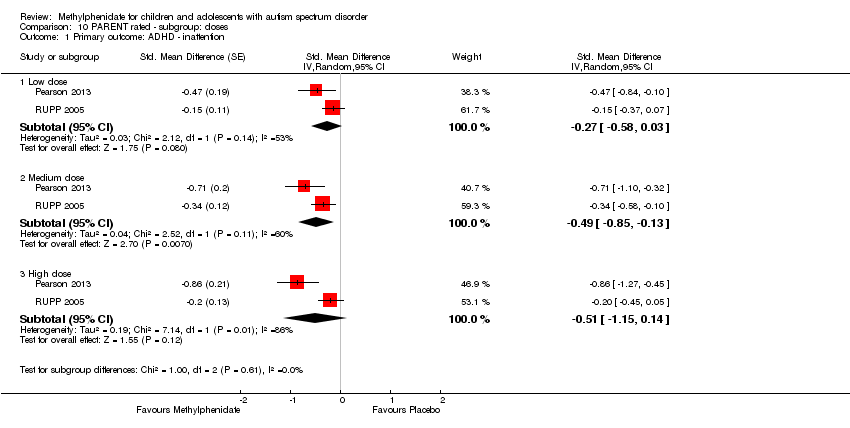
Comparison 10 PARENT rated ‐ subgroup: doses, Outcome 1 Primary outcome: ADHD ‐ inattention.
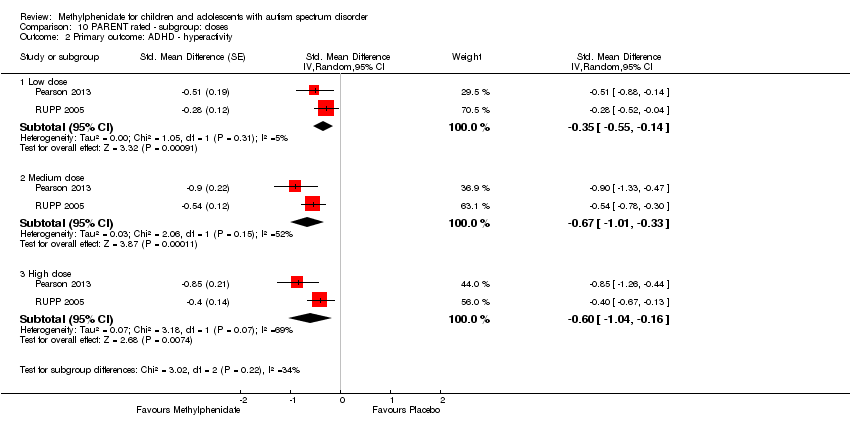
Comparison 10 PARENT rated ‐ subgroup: doses, Outcome 2 Primary outcome: ADHD ‐ hyperactivity.

Comparison 10 PARENT rated ‐ subgroup: doses, Outcome 3 Primary outcome: ASD ‐ impaired social interaction.
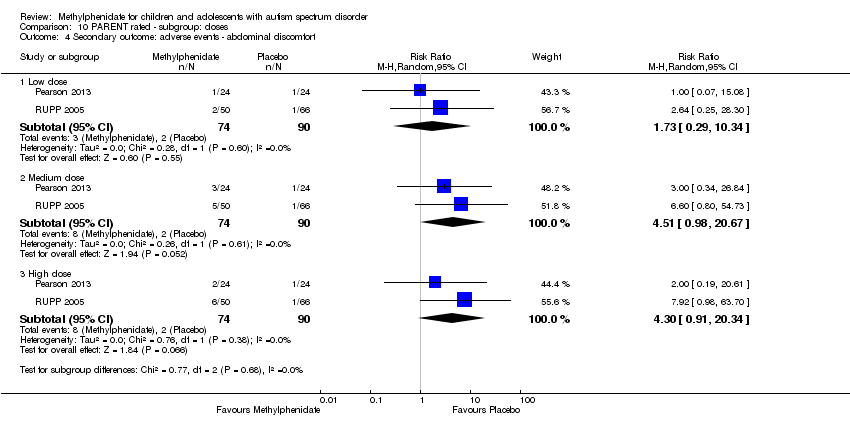
Comparison 10 PARENT rated ‐ subgroup: doses, Outcome 4 Secondary outcome: adverse events ‐ abdominal discomfort.

Comparison 10 PARENT rated ‐ subgroup: doses, Outcome 5 Secondary outcome: adverse events ‐ reduced appetite.
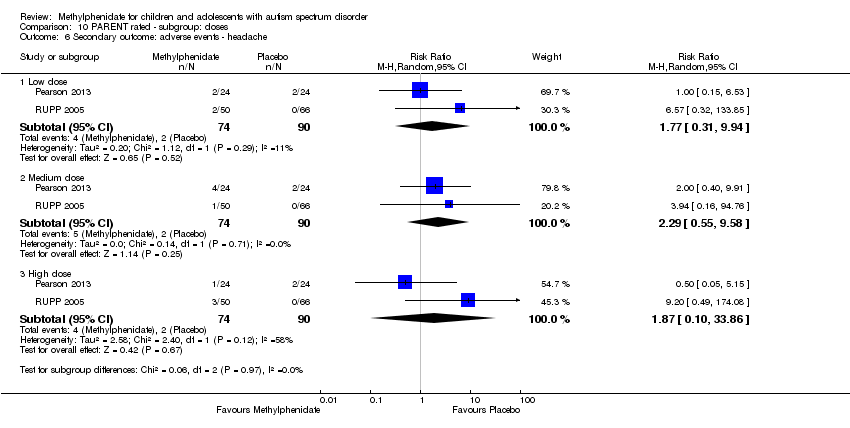
Comparison 10 PARENT rated ‐ subgroup: doses, Outcome 6 Secondary outcome: adverse events ‐ headache.

Comparison 10 PARENT rated ‐ subgroup: doses, Outcome 7 Secondary outcome: adverse events ‐ anxiety.

Comparison 10 PARENT rated ‐ subgroup: doses, Outcome 8 Secondary outcome: adverse events ‐ depressed mood.

Comparison 10 PARENT rated ‐ subgroup: doses, Outcome 9 Secondary outcome: adverse events ‐ irritability.
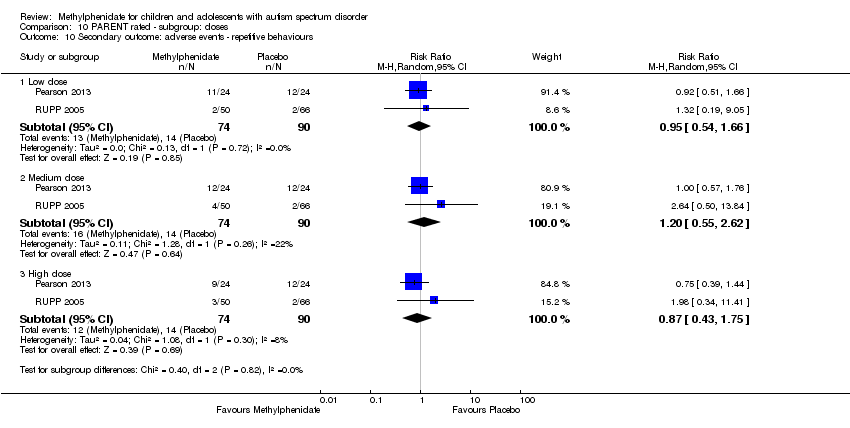
Comparison 10 PARENT rated ‐ subgroup: doses, Outcome 10 Secondary outcome: adverse events ‐ repetitive behaviours.

Comparison 10 PARENT rated ‐ subgroup: doses, Outcome 11 Secondary outcome: adverse events ‐ sleep disturbance.
| High‐dose methylphenidate versus placebo for symptoms of ADHD and ASD as rated by teachers | ||||||
| Patient or population: children aged 6 to 18 years with ASD | ||||||
| Outcomes | Anticipated absolute effects* (95% CI) | Relative effect | № of participants | Quality of the evidence | Comments | |
| Risk with placebo | Risk with high‐dose methylphenidate | |||||
| Primary outcome: ADHD‐like symptoms | ||||||
| Inattention Measured using SNAP‐IV inattention subscale (range 0 to 27) | — | The mean inattention score in the intervention group was 2.72 units lower (5.37 lower to 0.06 lower) | — | 51 teachers | ⊕⊕⊝⊝ | — |
| Hyperactivity | — | The mean hyperactivity score in the intervention group was 0.78 standard units lower (1.13 lower to 0.43 lower) | — | 73 teachers | ⊕⊕⊝⊝ | — |
| Impulsivity | See comment | — | 36 teachers (1 RCT) | — | Insufficient data to pool results | |
| Primary outcome: core symptoms of ASD | ||||||
| Impaired social interaction | — | The mean impaired social interaction score in the intervention group was 0.51 standard units lower (1.07 lower to 0.05 higher) | — | 63 teachers | ⊕⊝⊝⊝ | — |
| Impaired communication | See comment | — | 24 teachers (1 RCT) | — | Insufficient data to pool results | |
| Stereotypical behaviours | — | The mean stereotypical behaviours score in the intervention group was 0.34 standard units lower (0.84 lower to 0.17 higher) | — | 69 teachers | ⊕⊕⊝⊝ | — |
| Overall ASD | — | The mean overall ASD score in the intervention group was 0.53 standard units lower (1.26 lower to 0.19 higher) | — | 36 teachers (2 RCTs) | ⊕⊕⊝⊝ | — |
| Secondary outcome: rate of adverse effects | ||||||
| Total number of adverse events | See comment | — | 79 teachers (1 RCT) | — | Insufficient data to pool resultsd | |
| *The risk in the intervention group (and its 95% CI) is based on the assumed risk in the comparison group and the relative effect of the intervention (and its 95% CI). | ||||||
| GRADE Working Group grades of evidence | ||||||
| aDowngraded one point for limitations in design and implementation. | ||||||
| High‐dose methylphenidate versus placebo for symptoms of ADHD and ASD as rated by parents | ||||||
| Patient or population: Children aged 6 to 18 years with ASD | ||||||
| Outcomes | Anticipated absolute effects* (95% CI) | Relative effect | № of participants | Quality of the evidence | Comments | |
| Risk with placebo | Risk with high‐dose methylphenidate | |||||
| Primary outcome: ADHD‐like symptoms | ||||||
| Inattention Measured using SNAP‐IV inattention subscale (range 0 to 27) | — | The mean inattention score in the intervention group was 3.16 units lower (6.89 lower to 0.57 higher) | — | 71 parents | ⊕⊕⊝⊝ | — |
| Impulsivity | See comment | — | 48 parents (1 RCT) | — | Insufficient data to pool results | |
| Hyperactivity Measured using ABC hyperactivity subscale (range 0 to 48) | — | The hyperactivity score in the intervention group was 6.61 units lower (12.19 lower to 1.03 lower) | — | 71 parents | ⊕⊕⊝⊝ | — |
| Primary outcome: core symptoms of ASD | ||||||
| Impaired social interaction | — | The impaired social interaction score in the intervention group was 0.21 standard units lower (0.60 lower to 0.18 higher) | — | 71 parents | ⊕⊝⊝⊝ | — |
| Impaired communication | See comment | — | 48 parents (1 RCT) | — | Insufficient data to pool results | |
| Stereotypical behaviours | See comment | — | 48 parents (1 RCT) | — | Insufficient data to pool results | |
| Overall ASD | See comment | — | 48 parents (1 RCT) | — | Insufficient data to pool results | |
| Secondary outcome: rate of adverse events | ||||||
| Total number of adverse events | See comment | — | 108 parents (1 RCT) | — | Insufficient data to pool resultsd | |
| *The risk in the intervention group (and its 95% CI) is based on the assumed risk in the comparison group and the relative effect of the intervention (and its 95% CI). | ||||||
| GRADE Working Group grades of evidence | ||||||
| a Downgraded one point for limitations in design and implementation. | ||||||
| Instrument | Inattention | Impulsivity | Hyperactivity | |||
| Teachera | Parent | Teachera | Parent | Teachera | Parent | |
| ABC | — | — | — | — | H , Q, R | P , R |
| ACTeRS | P | P | — | — | P | P |
| Conners' Global Index | — | — | P | P | P | P |
| CPRS‐R and CTRS‐R | P | P | — | — | P, Q | P |
| Conners' Abbreviated Parent/Teacher Questionnaire | — | — | — | — | — | — |
| SNAP‐IV | P , R | P , R | — | — | P , R | P, R |
| a'Teacher' includes clinician and trained observer raters. Letters (H, P, Q, R) indicate those studies that used a particular instrument to rate the particular outcome. Letters in bold and underlined font indicate the instrument we used in our meta‐analysis: H: Handen 2000; P: Pearson 2013; Q: Quintana 1995; R: RUPP 2005. ABC: Aberrant Behavior Checklist; ACTeRS: ADD‐H (Attention deficit disorder ‐ hyperactivity) Comprehensive Teacher Rating Scale; ADHD: attention deficit hyperactivity disorder; CPRS‐R: Conners' Parent Rating Scale ‐ Revised; CTRS‐R: Conners' Teacher Rating Scale ‐ Revised;SNAP‐IV: Swanson, Nolan, and Pelham Questionnaire, Fourth Edition. | ||||||
| Instrument | Impaired social interaction | Impaired communication | Stereotypical behaviours | Overall ASD | ||||
| Teacher a | Parent | Teacher a | Parent | Teacher a | Parent | Teacher a | Parent | |
| ABC | H | P | H | P | H , Q | P | — | — |
| ACTeRS | P | P | — | — | — | — | — | — |
| CARS | — | — | — | — | — | — | H | — |
| CYBOCS | — | — | — | — | R | — | — | — |
| CPRS‐R and CTRS‐R | P | P | — | — | — | — | — | — |
| Iowa CTRS | H | — | — | — | — | — | — | — |
| Social communication questionnaire | — | — | — | — | — | — | — | P |
| SNAP‐IV | R | R | — | — | — | — | — | — |
| Clinician Global Impression ‐ Severity | — | — | — | — | — | — | P | — |
| a'Teacher' includes clinician and trained observer raters; Letters (H, P, Q, R) indicate the studies which used a particular instrument to rate the particular outcome. Letters in bolded and underlined font indicate the instrument we used in our meta‐analysis: H: Handen 2000; P: Pearson 2013; Q: Quintana 1995; R: RUPP 2005; ABC: Aberrant Behavior Checklist; ACTeRS: ADD‐H (Attention deficit disorder ‐ hyperactivity) Comprehensive Teacher Rating Scale; ASD: autism spectrum disorders; CARS: Child Autism Rating Scale; CPRS‐R: Conners' Parent Rating Scale ‐ Revised; CTRS‐R: Conners' Teacher Rating Scale ‐ Revised; CYBOCS: Children's Yale‐Brown Obsessive Compulsive Scales;Iowa CTRS: Iowa Conners' Teacher Rating Scale; SNAP‐IV: Swanson, Nolan, and Pelham Questionnaire, 4th Edition. | ||||||||
| Outcome or subgroup title | No. of studies | No. of participants | Statistical method | Effect size |
| 1 Primary outcome: ADHD symptoms ‐ inattention (same measurement instrument) Show forest plot | 2 | Mean Difference (Random, 95% CI) | ‐2.72 [‐5.37, ‐0.06] | |
| 2 Primary outcome: ADHD symptoms ‐ hyperactivity (different measurement instrument) Show forest plot | 4 | Std. Mean Difference (Random, 95% CI) | ‐0.78 [‐1.13, ‐0.43] | |
| 3 Primary outcome: ASD symptoms Show forest plot | 4 | Std. Mean Difference (Random, 95% CI) | Subtotals only | |
| 3.1 Impaired social interaction | 3 | Std. Mean Difference (Random, 95% CI) | ‐0.51 [‐1.07, 0.05] | |
| 3.2 Stereotypical behaviours | 3 | Std. Mean Difference (Random, 95% CI) | ‐0.34 [‐0.84, 0.17] | |
| 3.3 Overall ASD | 2 | Std. Mean Difference (Random, 95% CI) | ‐0.53 [‐1.26, 0.19] | |
| 4 Secondary outcome: adverse events Show forest plot | 2 | Risk Ratio (M‐H, Random, 95% CI) | Subtotals only | |
| 4.1 Gastrointestinal effects: abdominal discomfort | 2 | 69 | Risk Ratio (M‐H, Random, 95% CI) | 3.00 [0.13, 70.16] |
| 4.2 Gastrointestinal effects: reduced appetite | 2 | 69 | Risk Ratio (M‐H, Random, 95% CI) | 1.33 [0.43, 4.12] |
| 4.3 General physical adverse effect: dizziness | 2 | 69 | Risk Ratio (M‐H, Random, 95% CI) | 0.55 [0.06, 5.18] |
| 4.4 General physical adverse effect: drowsiness | 2 | 69 | Risk Ratio (M‐H, Random, 95% CI) | 2.00 [0.47, 8.55] |
| 4.5 General physical adverse effect: headache | 2 | 69 | Risk Ratio (M‐H, Random, 95% CI) | 3.00 [0.13, 70.16] |
| 4.6 Psychological effects: anxiety | 2 | 69 | Risk Ratio (M‐H, Random, 95% CI) | 1.02 [0.47, 2.18] |
| 4.7 Psychological effects: depressed mood | 2 | 69 | Risk Ratio (M‐H, Random, 95% CI) | 1.19 [0.37, 3.79] |
| 4.8 Psychological effects: irritability | 2 | 69 | Risk Ratio (M‐H, Random, 95% CI) | 0.81 [0.29, 2.27] |
| 4.9 Repetitive behaviours: repetitive movements or tics | 2 | 69 | Risk Ratio (M‐H, Random, 95% CI) | 0.57 [0.21, 1.57] |
| Outcome or subgroup title | No. of studies | No. of participants | Statistical method | Effect size |
| 1 Primary outcome: ADHD symptoms ‐ inattention (same measurement instrument) Show forest plot | 2 | Mean Difference (Random, 95% CI) | ‐2.55 [‐5.15, 0.06] | |
| 2 Primary outcome: ADHD symptoms ‐ hyperactivity (different measurement instrument) Show forest plot | 4 | Std. Mean Difference (Random, 95% CI) | ‐0.70 [‐1.07, ‐0.33] | |
| 3 Primary outcome: ASD symptoms Show forest plot | 4 | Std. Mean Difference (Random, 95% CI) | Subtotals only | |
| 3.1 Impaired social interaction | 3 | Std. Mean Difference (Random, 95% CI) | ‐0.44 [‐0.99, 0.11] | |
| 3.2 Stereotypical behaviours | 3 | Std. Mean Difference (Random, 95% CI) | ‐0.24 [‐0.71, 0.23] | |
| 3.3 Overall ASD | 2 | Std. Mean Difference (Random, 95% CI) | ‐0.56 [‐1.28, 0.17] | |
| Outcome or subgroup title | No. of studies | No. of participants | Statistical method | Effect size |
| 1 Primary outcome: ADHD symptoms ‐ inattention (same measurement instrument) Show forest plot | 2 | Mean Difference (Random, 95% CI) | Subtotals only | |
| 2 Primary outcome: ADHD symptoms ‐ hyperactivity (different measurement instrument) Show forest plot | 4 | Std. Mean Difference (Random, 95% CI) | Subtotals only | |
| 3 Primary outcome: ASD symptoms Show forest plot | 4 | Std. Mean Difference (Random, 95% CI) | Subtotals only | |
| 3.1 Impaired social interaction | 3 | Std. Mean Difference (Random, 95% CI) | ‐0.53 [‐1.09, 0.02] | |
| 3.2 Stereotypical behaviours | 3 | Std. Mean Difference (Random, 95% CI) | ‐0.37 [‐0.87, 0.14] | |
| 3.3 Overall ASD | 2 | Std. Mean Difference (Random, 95% CI) | ‐0.53 [‐1.25, 0.20] | |
| Outcome or subgroup title | No. of studies | No. of participants | Statistical method | Effect size |
| 1 Primary outcome: ADHD ‐ hyperactivity Show forest plot | 4 | Std. Mean Difference (Random, 95% CI) | Subtotals only | |
| 1.1 ABC | 3 | Std. Mean Difference (Random, 95% CI) | ‐0.75 [‐1.21, ‐0.29] | |
| 1.2 SNAP | 2 | Std. Mean Difference (Random, 95% CI) | ‐0.65 [‐1.12, ‐0.19] | |
| 1.3 Conners' Rating Scale ‐ Revised | 2 | Std. Mean Difference (Random, 95% CI) | ‐0.87 [‐1.26, ‐0.48] | |
| Outcome or subgroup title | No. of studies | No. of participants | Statistical method | Effect size |
| 1 Primary outcome: ADHD symptoms (same measurement instrument) Show forest plot | 2 | Mean Difference (Random, 95% CI) | Subtotals only | |
| 1.1 Inattention | 2 | Mean Difference (Random, 95% CI) | ‐3.16 [‐6.89, 0.57] | |
| 1.2 Hyperactivity | 2 | Mean Difference (Random, 95% CI) | ‐6.61 [‐12.19, ‐1.03] | |
| 2 Primary outcome: ASD symptoms ‐ impaired social interaction Show forest plot | 2 | Std. Mean Difference (Random, 95% CI) | ‐0.21 [‐0.60, 0.18] | |
| 3 Secondary outcome: adverse events Show forest plot | 2 | Risk Ratio (M‐H, Random, 95% CI) | Subtotals only | |
| 3.1 Gastrointestinal effects: abdominal discomfort | 2 | 164 | Risk Ratio (M‐H, Random, 95% CI) | 4.30 [0.91, 20.34] |
| 3.2 Gastrointestinal effects: reduced appetite | 2 | 164 | Risk Ratio (M‐H, Random, 95% CI) | 8.28 [2.57, 26.73] |
| 3.3 General physical adverse effect: headache | 2 | 164 | Risk Ratio (M‐H, Random, 95% CI) | 1.87 [0.10, 33.86] |
| 3.4 General physical effect: sleep disturbance | 2 | 164 | Risk Ratio (M‐H, Random, 95% CI) | 3.51 [0.59, 20.82] |
| 3.5 Psychological effects: anxiety | 2 | 164 | Risk Ratio (M‐H, Random, 95% CI) | 1.13 [0.22, 5.79] |
| 3.6 Repetitive behaviours: general | 2 | 164 | Risk Ratio (M‐H, Random, 95% CI) | 0.87 [0.43, 1.75] |
| 3.7 Psychological effects: irritability | 2 | 164 | Risk Ratio (M‐H, Random, 95% CI) | 1.25 [0.25, 6.36] |
| 3.8 Psychological effects: depressed mood | 2 | 164 | Risk Ratio (M‐H, Random, 95% CI) | 1.75 [0.05, 62.33] |
| Outcome or subgroup title | No. of studies | No. of participants | Statistical method | Effect size |
| 1 Primary outcome: ADHD symptoms (same measurement instrument) Show forest plot | 2 | Mean Difference (Random, 95% CI) | Subtotals only | |
| 1.1 Inattention | 2 | Mean Difference (Random, 95% CI) | ‐3.11 [‐6.84, 0.62] | |
| 1.2 Hyperactivity | 2 | Mean Difference (Random, 95% CI) | ‐6.44 [‐10.00, ‐0.89] | |
| 2 Primary outcome: ASD symptoms ‐ Impaired social interaction Show forest plot | 2 | Std. Mean Difference (Random, 95% CI) | Subtotals only | |
| Outcome or subgroup title | No. of studies | No. of participants | Statistical method | Effect size |
| 1 Primary outcome: ADHD symptoms (same measurement instrument) Show forest plot | 2 | Mean Difference (Random, 95% CI) | Subtotals only | |
| 1.1 Inattention | 2 | Mean Difference (Random, 95% CI) | ‐3.18 [‐6.91, 0.56] | |
| 1.2 Hyperactivity | 2 | Mean Difference (Random, 95% CI) | ‐6.67 [‐12.25, ‐1.08] | |
| 2 Primary outcome: ASD symptoms ‐ Impaired social interaction Show forest plot | 2 | Std. Mean Difference (Random, 95% CI) | Subtotals only | |
| Outcome or subgroup title | No. of studies | No. of participants | Statistical method | Effect size |
| 1 Primary outcome: ADHD ‐ hyperactivity Show forest plot | 2 | Std. Mean Difference (Random, 95% CI) | Subtotals only | |
| 1.1 ABC | 2 | Std. Mean Difference (Random, 95% CI) | ‐0.60 [‐1.04, ‐0.16] | |
| 1.2 SNAP | 2 | Std. Mean Difference (Random, 95% CI) | ‐0.53 [‐1.04, ‐0.03] | |
| Outcome or subgroup title | No. of studies | No. of participants | Statistical method | Effect size |
| 1 Primary outcome: ADHD ‐ inattention Show forest plot | 2 | Std. Mean Difference (Random, 95% CI) | Subtotals only | |
| 1.1 Low dose | 2 | Std. Mean Difference (Random, 95% CI) | ‐0.28 [‐0.61, 0.05] | |
| 1.2 Medium dose | 2 | Std. Mean Difference (Random, 95% CI) | ‐0.46 [‐0.89, ‐0.04] | |
| 1.3 High dose | 2 | Std. Mean Difference (Random, 95% CI) | ‐0.38 [‐0.75, ‐0.02] | |
| 2 Primary outcome: ADHD ‐ hyperactivity Show forest plot | 4 | Std. Mean Difference (Random, 95% CI) | Subtotals only | |
| 2.1 Low dose | 2 | Std. Mean Difference (Random, 95% CI) | ‐0.40 [‐0.77, ‐0.03] | |
| 2.2 Medium dose | 3 | Std. Mean Difference (Random, 95% CI) | ‐0.55 [‐1.00, ‐0.10] | |
| 2.3 High dose | 4 | Std. Mean Difference (Random, 95% CI) | ‐0.78 [‐1.13, ‐0.43] | |
| 3 Primary outcome: ASD ‐ impaired social interaction Show forest plot | 3 | Std. Mean Difference (Random, 95% CI) | Subtotals only | |
| 3.1 Low dose | 2 | Std. Mean Difference (Random, 95% CI) | ‐0.30 [‐0.59, ‐0.02] | |
| 3.2 Medium dose | 3 | Std. Mean Difference (Random, 95% CI) | ‐0.44 [‐0.94, 0.06] | |
| 3.3 High dose | 3 | Std. Mean Difference (Random, 95% CI) | ‐0.51 [‐1.07, 0.05] | |
| 4 Primary outcome: ASD ‐ stereotypical behaviours Show forest plot | 3 | Std. Mean Difference (Random, 95% CI) | Subtotals only | |
| 4.1 Medium dose | 2 | Std. Mean Difference (Random, 95% CI) | ‐0.23 [‐0.43, ‐0.03] | |
| 4.2 High dose | 3 | Std. Mean Difference (Random, 95% CI) | ‐0.34 [‐0.84, 0.17] | |
| 5 Primary outcome: ASD ‐ overall ASD Show forest plot | 2 | Std. Mean Difference (Random, 95% CI) | Subtotals only | |
| 5.1 Medium dose | 2 | Std. Mean Difference (Random, 95% CI) | ‐0.52 [‐1.20, 0.17] | |
| 5.2 High dose | 2 | Std. Mean Difference (Random, 95% CI) | ‐0.54 [‐1.26, 0.19] | |
| 6 Secondary outcome: adverse events ‐ abdominal discomfort Show forest plot | 2 | Risk Ratio (M‐H, Random, 95% CI) | Subtotals only | |
| 6.1 Medium dose | 2 | 69 | Risk Ratio (M‐H, Random, 95% CI) | 0.0 [0.0, 0.0] |
| 6.2 High dose | 2 | 69 | Risk Ratio (M‐H, Random, 95% CI) | 3.00 [0.13, 70.16] |
| 7 Secondary outcome: adverse events ‐ reduced appetite Show forest plot | 2 | Risk Ratio (M‐H, Random, 95% CI) | Subtotals only | |
| 7.1 Medium dose | 2 | 69 | Risk Ratio (M‐H, Random, 95% CI) | 1.29 [0.75, 2.20] |
| 7.2 High dose | 2 | 69 | Risk Ratio (M‐H, Random, 95% CI) | 1.33 [0.43, 4.12] |
| 8 Secondary outcome: adverse events ‐ dizziness Show forest plot | 2 | Risk Ratio (M‐H, Random, 95% CI) | Subtotals only | |
| 8.1 Medium dose | 2 | 69 | Risk Ratio (M‐H, Random, 95% CI) | 0.22 [0.01, 4.06] |
| 8.2 High dose | 2 | 69 | Risk Ratio (M‐H, Random, 95% CI) | 0.55 [0.06, 5.18] |
| 9 Secondary outcome: adverse events ‐ drowsiness Show forest plot | 2 | Risk Ratio (M‐H, Random, 95% CI) | Subtotals only | |
| 9.1 Medium dose | 2 | 69 | Risk Ratio (M‐H, Random, 95% CI) | 1.27 [0.05, 32.89] |
| 9.2 High dose | 2 | 69 | Risk Ratio (M‐H, Random, 95% CI) | 2.00 [0.47, 8.55] |
| 10 Secondary outcome: adverse events ‐ headache Show forest plot | 2 | Risk Ratio (M‐H, Random, 95% CI) | Subtotals only | |
| 10.1 Medium dose | 2 | 69 | Risk Ratio (M‐H, Random, 95% CI) | 0.0 [0.0, 0.0] |
| 10.2 High dose | 2 | 69 | Risk Ratio (M‐H, Random, 95% CI) | 3.00 [0.13, 70.16] |
| 11 Secondary outcome: adverse events ‐ anxiety Show forest plot | 2 | Risk Ratio (M‐H, Random, 95% CI) | Subtotals only | |
| 11.1 Medium dose | 2 | 69 | Risk Ratio (M‐H, Random, 95% CI) | 0.68 [0.10, 4.46] |
| 11.2 High dose | 2 | 69 | Risk Ratio (M‐H, Random, 95% CI) | 1.02 [0.47, 2.18] |
| 12 Secondary outcome: adverse events ‐ depressed mood Show forest plot | 2 | Risk Ratio (M‐H, Random, 95% CI) | Subtotals only | |
| 12.1 Medium dose | 2 | 69 | Risk Ratio (M‐H, Random, 95% CI) | 1.01 [0.46, 2.26] |
| 12.2 High dose | 2 | 69 | Risk Ratio (M‐H, Random, 95% CI) | 1.19 [0.37, 3.79] |
| 13 Secondary outcome: adverse events ‐ irritability Show forest plot | 2 | Risk Ratio (M‐H, Random, 95% CI) | Subtotals only | |
| 13.1 Medium dose | 2 | 69 | Risk Ratio (M‐H, Random, 95% CI) | 0.96 [0.54, 1.70] |
| 13.2 High dose | 2 | 69 | Risk Ratio (M‐H, Random, 95% CI) | 0.81 [0.29, 2.27] |
| 14 Secondary outcome: adverse events ‐ repetitive movements Show forest plot | 2 | Risk Ratio (M‐H, Random, 95% CI) | Subtotals only | |
| 14.1 Medium dose | 2 | 69 | Risk Ratio (M‐H, Random, 95% CI) | 0.74 [0.30, 1.85] |
| 14.2 High dose | 2 | 69 | Risk Ratio (M‐H, Random, 95% CI) | 0.57 [0.21, 1.57] |
| Outcome or subgroup title | No. of studies | No. of participants | Statistical method | Effect size |
| 1 Primary outcome: ADHD ‐ inattention Show forest plot | 2 | Std. Mean Difference (Random, 95% CI) | Subtotals only | |
| 1.1 Low dose | 2 | Std. Mean Difference (Random, 95% CI) | ‐0.27 [‐0.58, 0.03] | |
| 1.2 Medium dose | 2 | Std. Mean Difference (Random, 95% CI) | ‐0.49 [‐0.85, ‐0.13] | |
| 1.3 High dose | 2 | Std. Mean Difference (Random, 95% CI) | ‐0.51 [‐1.15, 0.14] | |
| 2 Primary outcome: ADHD ‐ hyperactivity Show forest plot | 2 | Std. Mean Difference (Random, 95% CI) | Subtotals only | |
| 2.1 Low dose | 2 | Std. Mean Difference (Random, 95% CI) | ‐0.35 [‐0.55, ‐0.14] | |
| 2.2 Medium dose | 2 | Std. Mean Difference (Random, 95% CI) | ‐0.67 [‐1.01, ‐0.33] | |
| 2.3 High dose | 2 | Std. Mean Difference (Random, 95% CI) | ‐0.60 [‐1.04, ‐0.16] | |
| 3 Primary outcome: ASD ‐ impaired social interaction Show forest plot | 2 | Std. Mean Difference (Random, 95% CI) | Subtotals only | |
| 3.1 Low dose | 2 | Std. Mean Difference (Random, 95% CI) | ‐0.15 [‐0.33, 0.04] | |
| 3.2 Medium dose | 2 | Std. Mean Difference (Random, 95% CI) | ‐0.17 [‐0.37, 0.03] | |
| 3.3 High dose | 2 | Std. Mean Difference (Random, 95% CI) | ‐0.21 [‐0.60, 0.18] | |
| 4 Secondary outcome: adverse events ‐ abdominal discomfort Show forest plot | 2 | Risk Ratio (M‐H, Random, 95% CI) | Subtotals only | |
| 4.1 Low dose | 2 | 164 | Risk Ratio (M‐H, Random, 95% CI) | 1.73 [0.29, 10.34] |
| 4.2 Medium dose | 2 | 164 | Risk Ratio (M‐H, Random, 95% CI) | 4.51 [0.98, 20.67] |
| 4.3 High dose | 2 | 164 | Risk Ratio (M‐H, Random, 95% CI) | 4.30 [0.91, 20.34] |
| 5 Secondary outcome: adverse events ‐ reduced appetite Show forest plot | 2 | Risk Ratio (M‐H, Random, 95% CI) | Subtotals only | |
| 5.1 Low dose | 2 | 164 | Risk Ratio (M‐H, Random, 95% CI) | 3.41 [0.91, 12.78] |
| 5.2 Medium dose | 2 | 164 | Risk Ratio (M‐H, Random, 95% CI) | 10.00 [3.14, 31.82] |
| 5.3 High dose | 2 | 164 | Risk Ratio (M‐H, Random, 95% CI) | 8.28 [2.57, 26.73] |
| 6 Secondary outcome: adverse events ‐ headache Show forest plot | 2 | Risk Ratio (M‐H, Random, 95% CI) | Subtotals only | |
| 6.1 Low dose | 2 | 164 | Risk Ratio (M‐H, Random, 95% CI) | 1.77 [0.31, 9.94] |
| 6.2 Medium dose | 2 | 164 | Risk Ratio (M‐H, Random, 95% CI) | 2.29 [0.55, 9.58] |
| 6.3 High dose | 2 | 164 | Risk Ratio (M‐H, Random, 95% CI) | 1.87 [0.10, 33.86] |
| 7 Secondary outcome: adverse events ‐ anxiety Show forest plot | 2 | Risk Ratio (M‐H, Random, 95% CI) | Subtotals only | |
| 7.1 Low dose | 2 | 164 | Risk Ratio (M‐H, Random, 95% CI) | 1.26 [0.45, 3.52] |
| 7.2 Medium dose | 2 | 164 | Risk Ratio (M‐H, Random, 95% CI) | 1.29 [0.46, 3.58] |
| 7.3 High dose | 2 | 164 | Risk Ratio (M‐H, Random, 95% CI) | 1.13 [0.22, 5.79] |
| 8 Secondary outcome: adverse events ‐ depressed mood Show forest plot | 2 | Risk Ratio (M‐H, Random, 95% CI) | Subtotals only | |
| 8.1 Low dose | 2 | 164 | Risk Ratio (M‐H, Random, 95% CI) | 0.99 [0.22, 4.42] |
| 8.2 Medium dose | 2 | 164 | Risk Ratio (M‐H, Random, 95% CI) | 2.30 [0.39, 13.42] |
| 8.3 High dose | 2 | 164 | Risk Ratio (M‐H, Random, 95% CI) | 1.75 [0.05, 62.33] |
| 9 Secondary outcome: adverse events ‐ irritability Show forest plot | 2 | Risk Ratio (M‐H, Random, 95% CI) | Subtotals only | |
| 9.1 Low dose | 2 | 164 | Risk Ratio (M‐H, Random, 95% CI) | 1.31 [0.30, 5.83] |
| 9.2 Medium dose | 2 | 164 | Risk Ratio (M‐H, Random, 95% CI) | 1.77 [0.23, 13.47] |
| 9.3 High dose | 2 | 164 | Risk Ratio (M‐H, Random, 95% CI) | 1.25 [0.25, 6.36] |
| 10 Secondary outcome: adverse events ‐ repetitive behaviours Show forest plot | 2 | Risk Ratio (M‐H, Random, 95% CI) | Subtotals only | |
| 10.1 Low dose | 2 | 164 | Risk Ratio (M‐H, Random, 95% CI) | 0.95 [0.54, 1.66] |
| 10.2 Medium dose | 2 | 164 | Risk Ratio (M‐H, Random, 95% CI) | 1.20 [0.55, 2.62] |
| 10.3 High dose | 2 | 164 | Risk Ratio (M‐H, Random, 95% CI) | 0.87 [0.43, 1.75] |
| 11 Secondary outcome: adverse events ‐ sleep disturbance Show forest plot | 2 | Risk Ratio (M‐H, Random, 95% CI) | Subtotals only | |
| 11.1 Low dose | 2 | 164 | Risk Ratio (M‐H, Random, 95% CI) | 2.94 [0.44, 19.64] |
| 11.2 Medium dose | 2 | 164 | Risk Ratio (M‐H, Random, 95% CI) | 5.10 [0.71, 36.68] |
| 11.3 High dose | 2 | 164 | Risk Ratio (M‐H, Random, 95% CI) | 3.51 [0.59, 20.82] |