哌醋甲酯治疗儿童和青少年自闭症谱系障碍
摘要
研究背景
自闭症谱系障碍(autistic spectrum disorder, ASD)儿童经常出现注意力不集中、易冲动和多动,这是注意力缺陷多动障碍(attention deficit hyperactivity disorder, ADHD)的主要症状。因此,哌醋甲酯(一种常用的ADHD治疗方法)对于这些儿童的有效性是值得关注的。
研究目的
本系统综述旨在评估哌醋甲酯对6至18岁ASD儿童和青少年患者的ADHD(注意力不集中、易冲动和多动)和ASD(社交互动和交流障碍,以及重复、受限或刻板行为)症状的影响。
检索策略
2016年11月,本研究检索了Cochrane对照试验中心注册库(Cochrane Central Register of Controlled Trials, CENTRAL)、MEDLINE、Embase、PsycINFO、CINAHL、11个其他数据库和2个临床试验注册库。我们还检查了参考文献列表并联系了研究作者和制药公司。
纳入排除标准
随机对照试验(randomised controlled trials, RCT)研究了哌醋甲酯对比安慰剂对于被诊断患有ASD或普遍性发育障碍的6至18岁儿童的ASD或ADHD样症状或两者核心症状的影响。主要结局是临床疗效,这可被定义为ADHD样症状(注意力不集中、易冲动和多动)和ASD的核心症状(社交互动和交流障碍以及刻板行为)以及整体ASD的改善。检查的次要结局是:不良事件发生率、照护者的健康以及制度化、特殊学校教育或治疗以取得学习成果的需求和整体生活质量。
资料收集与分析
我们采用标准的Cochrane方法学程序。在临床条件适宜的情况下,我们合并使用不同的心理测量量表进行结局估量。我们使用0.6的系数来计算标准偏差并调整研究的交叉设计。我们将0.52的标准化平均差(standardised mean difference, SMD)视为最小的临床相关治疗间差异。我们采用GRADE对每个结局的证据质量进行评级。
主要结果
研究 :我们纳入了四项交叉研究,共有113名5至13岁的儿童,其中大多数(83%)是男孩。我们纳入了两项针对5岁儿童的研究,因为我们无法获得6岁及以上儿童的分类资料,且所有其他受试者都在我们的目标年龄范围内。所有受试者都居住在美国。每剂哌醋甲酯的交叉期治疗持续时间为一周。研究使用了一系列结局量表,由父母、老师或两者、临床医生或项目人员评定。我们分别报告了家长评分结局。
偏倚风险 :我们认为三项试验均由于选择性报告而存在高偏倚风险;由于识别哌醋甲酯的副作用存在可能性,所有试验在受试者和评价者盲法上都有不明确的偏倚风险。我们判断所有试验对其他项目的偏倚风险均为低或不明确。
主要结局 :meta分析表明,根据教师(SMD=‐0.78,95% 置信区间 (confidence interval, CI) [‐1.13, ‐0.43];4项研究,73名受试者;P<0.001;低质量证据)和家长(平均差(mean difference, MD)=‐6.61分,95% CI [‐12.19, ‐1.03],异常行为检查表的多动分量表,范围0到48;2项研究,71名受试者;P=0.02;低质量证据)的评价,高剂量哌醋甲酯(0.43 mg/kg/dose至0.60 mg/kg/dose)对多动症具有显着的临床相关获益。 meta分析还显示,教师评价的注意力不集中具有显著但无临床相关的获益(MD=‐2.72分,95% CI [‐5.37, ‐0.06],根据Swanson、Nolan和Pelham的注意力不集中分量表评价,第四版问卷,范围0到27;2项研究,51名受试者;P=0.04;低质量证据)。没有足够的资料对易冲动的症状进行meta分析。根据教师的评价,没有证据表明哌醋甲酯会加重ASD的核心症状或有利于社会互动(SMD=‐0.51,95% CI [‐1.07, 0.05];3项研究,63名受试者;P=0.07;极低质量证据)、刻板行为(SMD=‐0.34,95% CI [‐0.84, 0.17];3项研究,69名受试者;P=0.19;低质量证据)或总体ASD(SMD=‐0.53,95% CI [‐1.26, 0.19];2项研究,36名受试者;P=0.15;低质量证据)。没有足够的资料对交流障碍症状进行meta分析。
次要结局 :无现有关于照护者健康以及制度化、特殊学校教育或治疗以取得学习成果的需求和整体生活质量等次要结局的资料。没有试验报告严重的不良事件。根据家长评价,治疗后唯一更可能出现的不良反应是食欲下降(风险比=8.28,95% CI [2.57, 26.73];2项研究,74名受试者;P<0.001;极低质量证据)。按剂量进行的亚组分析未发现低、中或高剂量对我们主要结局的影响有任何显著差异。
作者结论
我们发现短期使用哌醋甲酯可能会改善对药物耐受的ASD儿童多动和注意力不集中等症状,尽管低质量证据意味着我们无法确定任何影响的真实程度。没有证据表明哌醋甲酯对ASD的核心症状有负面影响,或者说也没有证据表明它可以改善社交互动、刻板行为或整体ASD。因为试验时间短且排除了在试验剂量阶段不耐受哌醋甲酯的儿童,所以不良事件的证据质量极低。未来的随机对照试验应考虑延长治疗和随访的持续时间。还需要使用针对该人群验证的结果量表在患有ASD的儿童中确认最小的临床重要差异。
PICO
简语概要
哌醋甲酯对6至18岁自闭症谱系障碍儿童注意力不集中、易冲动和/或多动的影响
患有自闭症谱系障碍 (autistic spectrum disorder, ASD) 的儿童通常难以集中注意力、易冲动行事、坐不住。哌醋甲酯是一种兴奋剂,通常用于治疗同样存在这些问题的注意力缺陷多动障碍(attention deficit hyperactivity disorder, ADHD)儿童,因此了解它对患有ASD儿童的效果非常重要。
本系统综述的目的是什么?
本Cochrane系统综述的目的是了解哌醋甲酯是否对患有ASD的儿童有帮助。我们收集并分析了所有回答该问题的相关研究,共找到了四项研究。
关键信息
尽管没有证据表明哌醋甲酯可以改善或加重ASD症状,但哌醋甲酯可能会在短期内改善ASD儿童的多动症。部分儿童对该药物的副作用不耐受。
本系统综述研究了什么?
我们检索了将接受任何剂量哌醋甲酯与安慰剂(一种看起来像哌醋甲酯但没有已知效果的假药丸)进行比较的儿童研究。我们最关注的是研究药物对ADHD(注意力不集中、易冲动和多动)和ASD(社交互动和交流障碍,以及重复、受限或刻板行为)症状的影响,但同时我们也寻找有关副作用、照护者健康、对特殊学校教育或机构的需求以及儿童的整体生活质量等信息。
本系统综述的主要结果是什么?
我们发现了四项研究,涉及113名5至13岁的儿童,并对哌醋甲酯与安慰剂进行了比较。我们纳入了2项针对5岁儿童的研究,因为我们无法分离出6岁及以上儿童的分类资料,并且所有其他受试者都在我们的目标年龄范围内。在所有这些研究中,儿童先服用一周不同剂量(低、中或高)的哌醋甲酯,再服用一周安慰剂,他们的照护者(包括家长、老师和临床医生)在每周结束时对他们的症状进行评价。在测试剂量周内(给予一剂药物以测试药物的安全性和耐受性)不能耐受哌醋甲酯的儿童未参与该研究。所有研究都在美国进行。
我们发现,根据家长和老师的评价,哌醋甲酯可以在短期内改善多动症。教师还倾向报告了服用哌醋甲酯的儿童在注意力不集中、社交互动、重复行为和整体ASD症状方面有所改善。然而,这些研究只持续了大约四个星期,所以我们不知道从长远来看是否有任何获益或风险。没有足够的证据表明哌醋甲酯对易冲动或交流障碍是否有任何影响。教师和临床医生往往比父母报告更多的改善。
我们对这些结果没信心,主要是因为父母和老师可能已经知道孩子们接受了哪种治疗。除了多动的情况可能能够注意到差异,其他方面改善的幅度不是很大。除了多动和注意力不集中的改善,其他大多数改善可能是由于机遇,即使哌醋甲酯并不真的有效。我们不能说哌醋甲酯产生任何伤害影响的可能性,部分原因是在研究之前或在测试剂量阶段产生有害影响的儿童参与研究的可能性较小。
本系统综述的时效性如何?
证据检索截至2016年11月。
Authors' conclusions
Summary of findings
| High‐dose methylphenidate versus placebo for symptoms of ADHD and ASD as rated by teachers | ||||||
| Patient or population: children aged 6 to 18 years with ASD | ||||||
| Outcomes | Anticipated absolute effects* (95% CI) | Relative effect | № of participants | Quality of the evidence | Comments | |
| Risk with placebo | Risk with high‐dose methylphenidate | |||||
| Primary outcome: ADHD‐like symptoms | ||||||
| Inattention Measured using SNAP‐IV inattention subscale (range 0 to 27) | — | The mean inattention score in the intervention group was 2.72 units lower (5.37 lower to 0.06 lower) | — | 51 teachers | ⊕⊕⊝⊝ | — |
| Hyperactivity | — | The mean hyperactivity score in the intervention group was 0.78 standard units lower (1.13 lower to 0.43 lower) | — | 73 teachers | ⊕⊕⊝⊝ | — |
| Impulsivity | See comment | — | 36 teachers (1 RCT) | — | Insufficient data to pool results | |
| Primary outcome: core symptoms of ASD | ||||||
| Impaired social interaction | — | The mean impaired social interaction score in the intervention group was 0.51 standard units lower (1.07 lower to 0.05 higher) | — | 63 teachers | ⊕⊝⊝⊝ | — |
| Impaired communication | See comment | — | 24 teachers (1 RCT) | — | Insufficient data to pool results | |
| Stereotypical behaviours | — | The mean stereotypical behaviours score in the intervention group was 0.34 standard units lower (0.84 lower to 0.17 higher) | — | 69 teachers | ⊕⊕⊝⊝ | — |
| Overall ASD | — | The mean overall ASD score in the intervention group was 0.53 standard units lower (1.26 lower to 0.19 higher) | — | 36 teachers (2 RCTs) | ⊕⊕⊝⊝ | — |
| Secondary outcome: rate of adverse effects | ||||||
| Total number of adverse events | See comment | — | 79 teachers (1 RCT) | — | Insufficient data to pool resultsd | |
| *The risk in the intervention group (and its 95% CI) is based on the assumed risk in the comparison group and the relative effect of the intervention (and its 95% CI). | ||||||
| GRADE Working Group grades of evidence | ||||||
| aDowngraded one point for limitations in design and implementation. | ||||||
| High‐dose methylphenidate versus placebo for symptoms of ADHD and ASD as rated by parents | ||||||
| Patient or population: Children aged 6 to 18 years with ASD | ||||||
| Outcomes | Anticipated absolute effects* (95% CI) | Relative effect | № of participants | Quality of the evidence | Comments | |
| Risk with placebo | Risk with high‐dose methylphenidate | |||||
| Primary outcome: ADHD‐like symptoms | ||||||
| Inattention Measured using SNAP‐IV inattention subscale (range 0 to 27) | — | The mean inattention score in the intervention group was 3.16 units lower (6.89 lower to 0.57 higher) | — | 71 parents | ⊕⊕⊝⊝ | — |
| Impulsivity | See comment | — | 48 parents (1 RCT) | — | Insufficient data to pool results | |
| Hyperactivity Measured using ABC hyperactivity subscale (range 0 to 48) | — | The hyperactivity score in the intervention group was 6.61 units lower (12.19 lower to 1.03 lower) | — | 71 parents | ⊕⊕⊝⊝ | — |
| Primary outcome: core symptoms of ASD | ||||||
| Impaired social interaction | — | The impaired social interaction score in the intervention group was 0.21 standard units lower (0.60 lower to 0.18 higher) | — | 71 parents | ⊕⊝⊝⊝ | — |
| Impaired communication | See comment | — | 48 parents (1 RCT) | — | Insufficient data to pool results | |
| Stereotypical behaviours | See comment | — | 48 parents (1 RCT) | — | Insufficient data to pool results | |
| Overall ASD | See comment | — | 48 parents (1 RCT) | — | Insufficient data to pool results | |
| Secondary outcome: rate of adverse events | ||||||
| Total number of adverse events | See comment | — | 108 parents (1 RCT) | — | Insufficient data to pool resultsd | |
| *The risk in the intervention group (and its 95% CI) is based on the assumed risk in the comparison group and the relative effect of the intervention (and its 95% CI). | ||||||
| GRADE Working Group grades of evidence | ||||||
| a Downgraded one point for limitations in design and implementation. | ||||||
Background
Description of the condition
Autistic spectrum disorder (ASD) is a group of developmental disorders described in theDiagnostic and Statistical Manual of Mental Disorders (DSM), fifth edition (DSM‐5), which includes autistic disorder, Asperger's disorder, childhood disintegrative disorder and pervasive developmental disorder not otherwise specified. ASD encompasses disorders previously referred to as early infantile autism, childhood autism, Kanner's autism, high‐functioning autism and atypical autism. The International Classification of Diseases, 10th revision (ICD‐10) classifies childhood autism as a disorder of psychological development, defined by the presence of abnormal or impaired development that is manifest before three years of age, and the characteristic type of abnormal functioning in all three areas of psychopathology: reciprocal social interaction; communication; and restricted, stereotyped, repetitive behaviour (WHO 2007).
The fourth edition, text revision of the DSM described three characteristic manifestations of ASD (DSM‐IV‐TR): impaired social interaction; impairment of communication; and restricted, repetitive and stereotyped patterns of behaviour (Filipek 1999; Wing 1997). The DSM‐5 uses five diagnostic criteria for the diagnosis of ASD: persistent deficits in social communication and social interaction across multiple contexts; restricted, repetitive patterns of behaviour, interests, or activities; symptoms present in the early developmental period; symptoms causing clinically significant impairment; and disturbances that are not better explained by intellectual disability or global developmental delay. Studies published prior to 2014 used diagnostic criteria from the fourth edition of the DSM (DSM‐IV or DSM‐IV‐TR), as the DSM‐5 was only published in May 2013.
A systematic review of prevalence studies by Williams 2006 estimated an overall prevalence of 7.1 per 10,000 children (95% confidence interval (CI) 1.6 to 30.6) for typical autism and a prevalence of 20.0 per 10,000 children (95% CI 4.9 to 82.1) for ASD (based on the DSM‐IV classification). AABASD 2007 estimated the prevalence of ASD in Australia to be 62.5 per 10,000 for children aged 6 to 12 years. Reported frequencies for ASD across the USA and other countries have approached 1% of the population, with similar estimates in child and adult samples (Brugha 2011). Since DSM‐5 criteria superseded earlier versions of the DSM, reports have shown reduced numbers of children diagnosed with ASD and an increase in the percentage with intellectual impairment (Sturmey 2014).
Early observations of autism by Kanner 1943 led to recognition of the autism spectrum as a heterogenous group of disorders with varying clinical presentations and severities (AAP 2001; NICHD 2014). The onset is typically before three years of age (see DSM‐IV), although diagnosis is often delayed for an additional two or three years (Filipek 2000). Children commonly present with speech delay, poor eye contact, social impairment, unusual or repetitive play, need for routine, difficulty coping with change and obsessions. Approximately 50% or more have intellectual impairment (Sturmey 2014), but others have an intelligence quotient (IQ) in the normal range. Children may also present with abnormal movements, heightened levels of anxiety, phobias, sleeping and eating disturbances, temper tantrums and self‐injurious or aggressive behaviour. Diagnosis of ASD includes history from parents and teachers, clinical observation, psychological and often speech language assessment. Numerous behaviour rating scales have been developed both to aid the assessment of ASD and to monitor response to therapy (AAP 2001; Bertoglio 2009; Filipek 1999; Lord 2000; Santosh 2006; Scahill 2005; Scahill 2006; Wagner 2007; WHO 2007).
Abnormalities of attention (including being overly focused or easily distracted), hyperactivity and impulsivity are common in individuals with ASD (Burack 1997; Lecavalier 2006; Nicolson 2000; Siegel 2012). Studies of children with ASD indicate that 24% to 83% of these children would also meet the criteria for a diagnosis of attention deficit hyperactivity disorder (ADHD) based on their symptoms of inattention, impulsivity and hyperactivity – the cardinal symptoms for ADHD (Frazier 2001; Hyman 2013; Simonoff 2013), although comorbid diagnoses of both ADHD and ASD have only been permitted since the DSM‐5 revision (Hyman 2013). ADHD is a prevalent childhood behavioural disorder, more common in boys, which may persist into adulthood. The prevalence of ADHD in the general population of school‐age children is approximately 3% to 5%, although some reports show even higher incidence (Polanczyk 2007). Children with ADHD appear to have impaired functioning of the prefrontal cortex, a high‐order cortical region that is believed to use representational knowledge of rules and goals, and working memory, to accomplish tasks (Busardò 2016). This region has an important role in inhibiting inappropriate behaviour and sustaining attention. In children with ASD, inattention, impulsivity and hyperactivity increase the risk of poor school performance and academic underachievement, causing further social impairment due to inappropriate and impulsive behaviours, which may also place the child at risk of harm.
The mainstays of treatment for children with ASD are behavioural interventions and pharmacological treatments. The SIGN 2007 guidelines suggest considering behavioural interventions to address a wide range of specific behaviours. There is also some evidence for tailored social communication interventions (such as the use of visual augmentation). Recent Cochrane Reviews of interventions for children with ASD do not support the use of acupuncture (Cheuk 2011), theory of mind skills training (Fletcher‐Watson 2014), omega‐3 fatty acids (James 2011), chelation (James 2015), auditory integration therapy (Sinha 2011), or intravenous secretin (Williams 2012), although there is some evidence that various social competencies may improve with music therapy (Geretsegger 2014), social skills groups (Reichow 2012a), and early intensive behavioural interventions (Reichow 2012b).
Pharmacological treatments have also been widely used in children with ASD to treat both core and co‐morbid symptoms. There is no evidence supporting the use of antidepressants or anticonvulsants to reduce core features of ASD in children (Hurwitz 2012; Williams 2013). There may be a limited role for risperidone, perhaps only in the short term and targeted at specific behaviours (Jesner 2007). Aripiprazole may improve irritability, hyperactivity and repetitive movements in children with ASD in the short term (Ching 2012). Psychostimulants, in particular methylphenidate, have also been prescribed to treat symptoms of hyperactivity, inattention and impulsivity in children with ASD, despite concerns that these medications may worsen ASD symptoms or cause more adverse events than in typically developing children (see Why it is important to do this review).
Description of the intervention
Methylphenidate has been used clinically for over 50 years to treat the symptoms of ADHD in children and is, by far, the most common psychostimulant medication used for this purpose. Over 20 years ago, Aman 1995 identified it as a candidate for treating inattention, impulsivity and hyperactivity in children with ASD. A recent meta‐analysis of the effectiveness of methylphenidate in children with ADHD concluded that methylphenidate may result in improved ADHD symptoms with an estimated effect size of −0.77 standardised mean difference (SMD) (Storebø 2015).
Treatment with immediate‐release formulations of methylphenidate is usually initiated at 5 mg once or twice daily, up to a maximum of 60 mg per day. Treatment with modified‐release formulations of methylphenidate is usually initiated at a dose of 18 mg once daily (in the morning), and increased, if necessary, up to a maximum of 54 mg once daily (NICE 2013). Methylphenidate is also available in some countries in an extended‐release form as a transdermal patch (Mayo Clinic 2014). Short‐release formulations of methylphenidate are absorbed rapidly within 30 minutes, and their effects last up to six hours. Long‐acting or modified‐release forms usually contain both immediate‐ and delayed‐release formulations and are taken once daily (in the morning). They are available in 8‐ and 12‐hour preparations. The advantages of these controlled‐release products include the possible decrease in likelihood and severity of rebound symptoms (Szymansk 2001) and an increase in compliance in children due to reduced dosing frequency and fewer tablets. With short‐acting formulations, the maximum recommended dose is 1.5 mg/kg/day or 60 mg in two or three divided doses (TGL 2012). This can be given as a once‐daily dose in the combination formulations.
The optimal dose of methylphenidate is based on observations of clinical response by the individual, as individual responses are variable, and the optimum dose is not predictable. The dose is initially titrated by increasing the daily dose every week until the effects are observable or until adverse events warrant dose reduction or cessation. In children with ADHD, the ability to attend and focus, particularly in busy environments such as the classroom, indicates clinical effect. Most side effects of methylphenidate are dose dependent (Rossi 2010). Common side effects include headache, loss of appetite, abdominal discomfort, nausea, anxiety and insomnia (Rossi 2010). These effects could lead to intolerance of the drug. Methylphenidate may also increase blood pressure and heart rate, and consultation with a cardiologist is recommended before starting the drug in children with cardiac abnormalities. It also infrequently causes other serious conditions, such as growth restriction, psychosis, liver dysfunction and neuroleptic malignant syndrome, for which monitoring is needed (Medsafe 2010).
How the intervention might work
Although its mechanism of action is uncertain, a number of animal and human studies have investigated the effects of methylphenidate on the way various tasks are performed, and brain imaging and brain chemistry studies have attempted to elucidate how it might work. Methylphenidate is believed to improve symptoms of ADHD by increasing the action of catecholamines, which are a class of neurotransmitters (chemicals that transmit messages in the brain) that include dopamine and noradrenaline (Wilens 2008). Methylphenidate acts in certain areas of the brain, particularly in the prefrontal cortex and striatum. The potential mechanisms by which methylphenidate enhances the action of dopamine include blocking processes in the nerve endings in the brain that remove dopamine from areas where it plays an active role, and extending its duration of action. Methylphenidate is also believed to have a number of complex actions on various dopamine receptors (particularly D2 dopamine autoreceptors and D1 dopamine receptors) in the nervous tissue of the brain. Methylphenidate increases the action of noradrenaline and may have an effect on other neurotransmitters, such as histamine, acetylcholine and serotonin, which, in turn, modify the action of catecholamines (Wilens 2008). The mechanisms by which methylphenidate might work in children with ASD who have inattention, hyperactivity and impulsivity have not yet been established.
Why it is important to do this review
Methylphenidate is commonly believed to be effective for children with ADHD, and a 2015 Cochrane Review of 185 studies of methylphenidate in children with ADHD found that methylphenidate may improve teacher‐rated ADHD symptoms and general behaviour as well as parent‐rated quality of life (Storebø 2015). Up to one third of adolescents with ASD who also meet criteria for a diagnosis of ADHD are currently treated with psychostimulants, most commonly methylphenidate (Frazier 2011). However, a number of studies in the 1970s and 1980s reported that stimulant medication, particularly dextroamphetamine, resulted in increased stereotypical movements in children with ASD (Birmaher 1988; Campbell 1975; Di Martino 2004). Concerns about stereotypy were reinforced by animal research demonstrating stimulant‐induced stereotypy in several animal species (Aman 1982). These concerns about methylphenidate worsening these core symptoms of ASD resulted in methylphenidate being considered contraindicated in children with ASD (Aman 1982; Birmaher 1988). Additional adverse events that may impact negatively on social interaction, including irritability, aggression, self‐mutilating behaviour, emotional lability and dysphoria have also been frequently reported in children with ASD who are treated with psychostimulants (Cortese 2012; Di Martino 2004; Ghuman 2009). However, methylphenidate has also been found to increase positive social interactions and social behaviour and to reduce social anxiety (Patin 2015). Moreover, studies have suggested that methylphenidate improves emotion processing (Conzelmann 2011; Schlochtermeier 2011), also helping children and adolescents with ADHD to recognise faces, facial emotions or both (Demirci 2016;Williams 2008), which may lead to improved social interaction. In addition, methylphenidate has been reported to reduce social interaction deficits in a mouse model of autistic spectrum disorders (Hara 2015), and methylphenidate appeared to improve some social behaviours and self‐regulation in one study of children with ASD (Jahromi 2009 in RUPP 2005). The effect of methylphenidate on impaired social interaction and communication in children with ASD is, however, unknown.
Psychostimulants may be effective in the treatment of ADHD‐like symptoms in children and adolescents with ASD (Cortese 2012). However, the effect of psychostimulants on the core symptoms of ASD (impaired communication, impaired social interaction, and repetitive, restricted or stereotypical behaviours) is uncertain, and their potential to worsen these symptoms remains a concern. It is important to identify whether similar effect sizes and similar risks of adverse events are present in children with ASD and children with ADHD but without ASD.
Objectives
To assess the effects of methylphenidate for symptoms of ADHD (inattention, impulsivity and hyperactivity) and ASD (impairments in social interaction and communication, and repetitive, restricted or stereotypical behaviours) in children and adolescents aged 6 to 18 years with ASD.
Methods
Criteria for considering studies for this review
Types of studies
Randomised (double‐blinded) controlled trials (RCTs).
Types of participants
Children and adolescents aged 6 to 18 years of age, diagnosed with ASD using criteria from DSM III, DSM‐IV or DSM‐IV‐TR, or diagnosed with pervasive developmental disorder according to the ICD‐10 (WHO 2007). We included children with concurrent diagnoses, such as anxiety disorder, intellectual impairment, learning delays and speech impairment, and congenital syndromes such as fragile X syndrome. We included children receiving co‐interventions, including psychotropic medications, dietary modifications and therapist‐based interventions such as speech, occupational and psychological therapy. We excluded children with other established causes of cognitive or behavioural problems such as acquired brain injury.
Types of interventions
We included trials if they used methylphenidate, irrespective of formulation or dose, and compared it to a placebo. We included trials giving methylphenidate to participants in addition to other psychotropic medications if these were provided to both arms. We included trials in which the treatment was administered in any setting, including the home, hospital or residential care.
Types of outcome measures
Primary outcomes
-
Clinical efficacy
-
An improvement in ADHD‐like symptoms (inattention, impulsivity and hyperactivity), as measured by psychometric instruments or observations of behaviour such as the fourth revision of the Swanson, Nolan and Pelham (SNAP‐IV) questionnaire, Conners' Global Index, and Conners' Parent Rating Scale ‐ Revised (CPRS‐R) (Kollins 2010)
-
An improvement in the core symptoms of ASD (impaired social interaction, impaired communication, and stereotypical behaviours), and overall ASD, as measured by psychometric instruments or observations of behaviour such as the Aberrant Behaviour Checklist (ABC) and the Child Autism Rating Scale (CARS) (Lord 2014)
-
Secondary outcomes
-
Rate of adverse events, for example, common adverse events of nausea and insomnia, and also more serious adverse events such as growth retardation and hypertension
-
Caregiver well‐being, including levels of parental stress, as assessed using scales such as the Parenting Stress Index (Abidin 1983)
-
Need for institutionalisation of children or adolescents, special schooling options or therapy to achieve learning outcomes, as measured either dichotomously (by need or no need) for institutionalisation of children or adolescents, special schooling options or therapy, or by duration of institutionalisation, special schooling options or therapy
-
Overall quality of life of the child or adolescent, as measured by a validated overall quality of life scale such as the Pediatric Quality of Life Inventory (Kollins 2010)
We listed our primary outcomes and rate of adverse events in a 'Summary of findings' table indicating levels of evidence for the findings. For more information see GRADE and 'Summary of findings', beneath Data synthesis.
Search methods for identification of studies
Electronic searches
We searched the following databases in May 2014 and again in November 2016. Appendix 1 reports search strategies for each source, and Appendix 2 provides further details (including exact search dates).
-
Cochrane Central Register of Controlled Trials (CENTRAL; 2016, Issue 4), in the Cochrane Library, which contains the Developmental, Psychosocial and Learning Problems Specialised Register (searched 21 November 2016).
-
MEDLINE Ovid (1946 to November Week 2 2016).
-
MEDLINE In‐Process & Other Non‐indexed Citations Ovid (18 November 2016).
-
MEDLINE Epub Ahead of Print Ovid (18 November 2016).
-
Embase Ovid (1974 to 18 November 2016).
-
CINAHLPlus EBSCOhost (Cumulative Index to Nursing and Allied Health Literature; 1936 to 21 November 2016).
-
PsycINFO Ovid (1806 to November Week 2 2016).
-
ERIC EBSCOhost (Education Resources Information Center; 1966 to 21 November 2016).
-
ERIC Proquest (Education Resources Information Center; 1966 to 16 May 2014).
-
Science Citation Index Web of Science (SCI; 1970 to 22 November 2016).
-
Social Sciences Citation Index Web of Science (SSCI; 1970 to 22 November 2016).
-
Conference Proceedings Citation Index ‐ Science Web of Science (CPCI‐S; 1990 to 22 November 2016).
-
Conference Proceedings Citation Index ‐ Social Sciences & Humanities Web of Science (CPCI‐SS&H; 1990 to 22 November 2016).
-
Cochrane Database of Systematic Reviews (CDSR; 2016, Issue 11) part of the Cochrane Library (searched 21 November 2016).
-
Database of Abstracts of Reviews of Effects (DARE; 2015, Issue 2) part of the Cochrane Library (searched 21 November 2016).
-
AutismData (autism.org.uk/autismdata; searched 22 November 2016).
-
Proquest Dissertations & Theses (searched 2 December 2016).
-
ClinicalTrials.gov (clinicaltrials.gov; searched 22 November 2016).
-
World Health Organization International Clinical Trials Registry Platform (WHO IRCTP; apps.who.int/trialsearch; searched 22 November 2016).
Searching other resources
We contacted drug manufacturers by email, including Mallinckrodt, Novartis, Janssen Pharmaceuticals, Shire and Medice, to obtain unpublished data. We also searched the references of relevant studies and (systematic) reviews to identify additional studies. Finally, we contacted the first author of included RCTs as well as specialists in developmental paediatrics to enquire about other relevant studies.
Data collection and analysis
Selection of studies
Two review authors (NS, MVD) independently read the title and abstracts of all records yielded by the search to determine suitability according to the criteria mentioned above (Criteria for considering studies for this review). They then obtained the full‐text reports of potentially relevant studies, or studies for which more information was needed, and assessed them for eligibility. The two review authors resolved any disagreements by discussion or asked a third review author (LD) to act as arbiter. We listed any excluded studies that initially appeared eligible for inclusion, along with the reasons for exclusion after full‐text review. We created a PRISMA flow diagram illustrating the selection process (Liberati 2009).
Data extraction and management
Two review authors (NS, LD) extracted the following data using the piloted data extraction sheet shown in Appendix 3: type of study, participants, type of intervention (including dose and administration form), measurement scales used, and reported outcomes. A third review author (MVD) checked the extracted data in case of discrepancies that could not be resolved by discussion.
Assessment of risk of bias in included studies
We used a checklist to assess the risk of bias in each included study. Using the Cochrane 'Risk of bias' assessment tool (Higgins 2017), two review authors (NS, MVD) independently assessed each study as being at low, high or unclear risk of bias on each of the following domains: random sequence generation, allocation concealment, blinding of participants and personnel, blinding of outcome assessment, incomplete outcome data, selective reporting and other sources of bias (see Appendix 4 for a detailed description of the criteria used). In the event of any disagreements, a third review author (LD) evaluated the study and a consensus was reached.
Measures of treatment effect
Continuous outcome data
We use the standardised mean difference (SMD) for all continuous outcomes because this enabled us to combine and compare the results of the different scales used to measure outcomes that are conceptually the same. Where outcomes were assessed using the same scale in separate studies, we used the mean difference (MD). If necessary, we transformed results to ensure that a negative MD or SMD indicated an improvement in functioning for all comparisons.
The SMD expresses the size of the intervention effect in each included study relative to the variability observed in that study (Deeks 2017). This method is based on the assumption that the differences in standard deviations (SD) between trials reflect differences in scales and not real differences in variability between the populations included in the trials. The SMD is 'scale free', that is, since the dependent variable is standardised, the original units are replaced by standardised units. We used Hedges' g formulation to calculate the SMD. It is calculated by dividing the mean differences between groups by the SD. Hedges' g uses a weighting to account for the population sizes in the different studies (Egger 2001).
We included clinician or other trained observer ratings with teacher ratings in a single meta‐analysis where outcomes were measured using psychometric scales rated by a number of different observers (for example, teachers, trained observers and/or clinicians), providing participants were rated in classroom or similarly structured contexts. However, we considered that parent ratings should be considered as a separate outcome because children's behaviour at home may differ from that in more structured clinical or educational settings, and because teachers (or clinicians) have different relationships and contact hours with children compared to parents and may place greater emphasis on academic aspects (Zhang 2005).
We reported effect sizes separately for low, medium and high doses of methylphenidate. We did not combine the data from different doses within included studies because these are repeated measures on the same participants. We reported doses per kg of body weight, whether studies used individualised doses calculated per kg of participant body weight, or used proprietary doses of 2.5 mg, 5 mg, 10 mg and 20 mg of methylphenidate with adjustment for participant weight. We reported data from high‐dose methylphenidate as our primary outcome and performed a subgroup analysis of our results for medium‐ and low‐dose methylphenidate.
Low, medium and high doses are calculated based on the mg/kg/dose ranges. We did not use mg/kg/day because parents or clinicians (or both) may withhold afternoon doses because of adverse events. Low‐dose methylphenidate included doses between 0.11 mg/kg/dose and 0.21 mg/kg/dose, medium‐dose methylphenidate included doses between 0.22 mg/kg/dose and 0.36 mg/kg/dose, and high‐dose methylphenidate included doses between 0.43 mg/kg/dose and 0.6 mg/kg/dose.
Dichotomous outcome data
We reported dichotomous outcomes (such as presence or absence of adverse events and institutionalisation) as risk ratios (RRs), which we calculated as the proportion of patients in the treatment group who experienced the outcome (or event) divided by the proportion of participants in the control group who experience the outcome (or event). Where there were no events in either the treatment group or the control group, we reported these outcomes separately without pooling them. We calculated 95% CIs for all dichotomous outcomes.
Unit of analysis issues
Cross‐over trials
We analysed cross‐over trials, in which each individual participant was allocated to a sequence of interventions (for example, placebo, low dose, medium dose, high dose) in a semi‐randomised order, as follows. If there were no carry‐over or period effects, the appropriate analysis of continuous data for a cross‐over trials is a paired t‐test. However, not all studies clearly reported paired analyses. Therefore, for each study and each comparison (e.g. placebo versus low dose, placebo versus medium dose, placebo versus high dose) we calculated the MD, the SD of the difference and its standard error (SE), the SMD, the pooled SD, and the SE of the SMD in accordance with the Cochrane Handbook for Systematic Reviews of Interventions (Higgins 2011a). We used a correlation coefficient of 0.6 in our calculation of the SE (of the MD and the SMD), as this was the within‐subject correlation calculated by RUPP 2005, based on three methylphenidate cross‐over studies involving participants with developmental disabilities.
In the case that studies reported the mean outcome measure for two raters rating the same children using the same scale separately, we combined the data from the two raters by averaging the scores and calculating the combined SD, as recommended in the Cochrane Handbook for Systematic Reviews of Interventions (Higgins 2011b).
See also Appendix 5 and Redman 2014.
Dealing with missing data
When necessary, we contacted the authors of included studies for information regarding missing data, dropouts and/or data not included in the study report but relevant to the review; for example, we sought outcomes of interest and summary data (such as number of participants and events) if authors had not included them in the published study report. We reported our attempt to obtain additional data and the results of these attempts in the Results section.
See also Appendix 5 and Redman 2014.
Assessment of heterogeneity
We assessed heterogeneity in two steps. First, we assessed clinical heterogeneity by comparing the populations included in the studies, the settings, the treatment modalities, and the outcomes. Clinical heterogeneity was considered sufficient to preclude the pooling of studies if: the participant ages were obviously different (for example, we did not combine data from studies of teenagers aged 16 to 18 years with data from studies of children aged 6 to 8 years); the severity of the ASD was obviously different (for example, we did not combine data from studies of children who require institutional care with data from studies of those with mild symptoms causing little impairment); or the outcome measures were not clinically comparable (for example, we did not combine data from a study that only measures impulsivity with data from a study that only measures hyperactivity).
Second, we assessed statistical heterogeneity by performing a Chi2 test and calculating the I2 value according to the guidelines in the Cochrane Handbook for Systematic Reviews of Interventions (Deeks 2017). We interpreted the I2 value as follows (Deeks 2017).
-
0% to 40%: may not be important.
-
30% to 60%: may represent moderate heterogeneity.
-
50% to 90%: may represent substantial heterogeneity.
-
75% to 100%: considerable heterogeneity.
Assessment of reporting biases
We were unable to identify small study effects and publication bias using a funnel plot because of the small number of included studies. See Appendix 5 and Redman 2014.
Data synthesis
We pooled the available data using the generic inverse variance method, and we applied a random‐effects model (Deeks 2017). In the absence of clinical or statistical heterogeneity (see Assessment of heterogeneity), we also applied a fixed‐effect model for pooling, and we compared the effect estimates obtained from each of the two methods in order to assess the robustness of the estimates.
Measures of effect size using SMDs are difficult to interpret in terms of whether they represent a clinically important between‐treatment difference, or a clinically meaningful effect. In this review we used an SMD of 0.52 as a between‐treatment minimum clinically important difference (MCID), based on the Zhang 2005 finding of a MCID of 6.6 on the Attention Deficit Hyperactivity Disorder Rating Scale ‐ Parent Interview (ADHDRS‐PI), which was equivalent to an SMD of 0.52. Storebø 2015 also used this SMD of 0.52 as a clinically meaningful effect size. This aligns with the rule of thumb that an effect size of 0.20 to 0.49 represents a small effect; 0.50 to 0.79, a moderate effect; and 0.80 or above, a large effect, as described in the Cochrane Handbook for Systematic Reviews of Interventions (Schünemann 2017).
Summary of findings table
We created a 'Summary of findings' table using GRADEpro software, GRADEpro GDT 2015, for our prespecified primary outcome of clinical efficacy, as assessed by an improvement in ADHD‐like symptoms (inattention, impulsivity and hyperactivity) and an improvement in symptoms of ASD (including impaired social interaction, impaired communication, and repetitive, restricted or stereotypical behaviour). We also reported one secondary outcome (rates of adverse events) in this table. We reported our findings separately for teacher‐rated and parent‐rated outcomes, and we reported the results for high doses of methylphenidate.
We used the five GRADE considerations (study limitations, consistency of effect, imprecision, indirectness and publication bias) to assess the quality of the evidence of studies contributing data to the meta‐analyses for the prespecified outcomes (GRADE 2004). We included the following comparisons: low dose methylphenidate versus placebo, medium dose methylphenidate versus placebo, and high dose methylphenidate versus placebo. We used methods and recommendations described in Section 8.5 and Chapter 12 of the Cochrane Handbook for Systematic Reviews of Interventions (see Higgins 2011a and Schünemann 2017 respectively) and GRADEpro GDT 2015. We justified all decisions to downgrade the quality of studies (from high to moderate, low or very low) using footnotes, and we provided comments to aid the reader's understanding of the review where necessary.
Subgroup analysis and investigation of heterogeneity
We performed a subgroup analysis on the different doses of methylphenidate (low, medium and high dose).
Sensitivity analysis
We conducted sensitivity analyses to assess:
-
the effect of the correlation coefficient; one assuming no correlation (correlation coefficient of zero) and one assuming a higher correlation (correlation coefficient of 0.80); and
-
the influence of the different scales on the same outcome. For example, if trial authors used more than one scale to measure the same outcome in a study, we repeated the meta‐analyses for the different scales in order to assess if this changed the interpretation of our results. We used the SMD to compare the results across the different scales.
See Appendix 5 and Redman 2014.
Results
Description of studies
Results of the search
Our searches retrieved a total of 1102 records, of which 364 were duplicates. We screened the titles and abstracts of the remaining 738 records and excluded 709 irrelevant records. We next obtained and assessed the full texts of the remaining 29 reports for eligibility and excluded 21; most of the excluded studies were either not controlled trials or studied participants who did not meet the criteria for ASD (see Excluded studies; Characteristics of excluded studies). We included four studies in the review (see Included studies; Characteristics of included studies). We contacted the corresponding authors of all included studies for further information, but no authors identified additional studies that met our inclusion criteria (Handen 2000; Pearson 2013; RUPP 2005). See Figure 1.

Study flow diagram.
Included studies
We included four studies in this review (Handen 2000; Pearson 2013; Quintana 1995; RUPP 2005). The RUPP 2005 (Research Units on Pediatric Psychopharmacology) study resulted in three journal articles and two conference abstracts, which we treated in the analysis as a single study.
The four included studies all had a randomised, double‐blind, cross‐over design, comparing the effect of placebo and more than one dose of methylphenidate for each study participant. The cross‐over trial design was appropriate for the clinical context, given that ASD is a relatively stable, chronic condition. Furthermore, no period or carry‐over effects would be anticipated for methylphenidate, even in the absence of a washout period, as the elimination half‐life for both the immediate‐ and extended‐release forms is two to three hours (Novartis 2014). The average duration of action of (immediate‐release) methylphenidate is approximately four hours, and the extended‐release form used in Pearson has a duration of action of approximately eight hours (Novartis 2014). Data collection was also focused at the end of each week of intervention, further reducing the risk of any carry‐over effect.
Details for each individual study can be found in the Characteristics of included studies tables.
Study design
All studies were cross‐over studies, completed in four to six weeks, comparing placebo with methylphenidate at either two doses, in Handen 2000 and Quintana 1995, or three, in Pearson 2013 and RUPP 2005.
Location of studies
All studies took place in the USA (Handen 2000; Pearson 2013; Quintana 1995; RUPP 2005).
Participants
Participant diagnoses
In all four included studies participants had ASD and ADHD‐like symptoms.
In Handen 2000, participants had autistic disorder or pervasive developmental disorder ‐ not otherwise specified (PDD‐NOS) (score on the CARS of 30 or more) and symptoms of ADHD (score of 15 or more on the Hyperactivity Index of the Conners' Teacher Rating Scale (CTRS)).
In Pearson 2013, 19 participants had autistic disorder, three had Asperger's disorder and two had PDD‐NOS and symptoms of ADHD (mean ADHD index score from CTRS‐Revised of 67.2 standard deviation (SD) 8.7), with several participants meeting DSM‐IV‐TR criteria for additional disorders, including oppositional defiant disorder, obsessive compulsive disorder and separation anxiety.
In Quintana 1995, participants had autistic disorder (as assessed with the CARS, ranging from 30.0 to 59.5) and a range of baseline behaviours, including temper tantrums and agitation.
In RUPP 2005, participants had autistic disorder, Asperger's disorder or PDD‐NOS and chronic interfering symptoms of hyperactivity or impulsiveness (or both), as assessed with the Clinician Global Impression ‐ Severity (CGI‐S) scale, ranging from moderately to severely ill.
Participant age and sex
Participant ages ranged from 5 to 11 years in Handen 2000; from 7 to 12 years in Pearson 2013; from 7 to 11 years in Quintana 1995; and from 5 to 13 years in RUPP 2005. All studies recruited more boys than girls: Handen 2000 randomised 13 children (10 boys and 3 girls), Pearson 2013 randomised 24 children (19 boys and 5 girls), Quintana 1995 randomised 10 children (6 boys and 4 girls), and RUPP 2005 randomised 66 children (59 boys and 7 girls).
Participant cognitive status
Participant cognitive functioning ranged from severe/profound intellectual impairment to average IQ (Handen 2000), moderate intellectual impairment (IQ 46) to above average IQ (IQ 112) (Pearson 2013), mild intellectual impairment to average IQ (Quintana 1995), and severe intellectual impairment to above average IQ (Slosson IQ 16 to 135) (RUPP 2005).
Participant recruitment
Investigators recruited participants from special education programmes, a psychiatric inpatient unit or an intensive day‐treatment programme (Handen 2000); special education classrooms of a large metropolitan public school district (Pearson 2013); a state psychiatric institute outpatient clinic (Quintana 1995); and five university outpatient centres (RUPP 2005).
Dose of methylphenidate
Handen 2000 used methylphenidate 0.3 mg/kg/dose two or three times daily, and methylphenidate 0.6 mg/kg/dose two or three times daily.
Pearson 2013 adjusted all doses for participant weight, using 10 mg to 20 mg extended‐release methylphenidate in the morning and 2.5 mg to 5 mg immediate‐release in the afternoon in the low‐dose phase, 15 mg to 30 mg extended‐release methylphenidate in the morning and 5 mg to 10 mg immediate‐release in the afternoon in the medium‐dose phase, and 20 mg to 40 mg extended‐release methylphenidate in the morning and 5 mg to 10 mg immediate‐release in the afternoon in the high‐dose phase.
Quintana 1995 used methylphenidate 10 mg and methylphenidate 20 mg, twice a day.
RUPP 2005 adjusted all doses for participant weight, using 2.5 mg to 5 mg methylphenidate two to three times daily, 5 mg to 10 mg methylphenidate two to three times daily, and 10 mg to 20 mg methylphenidate two to three times daily.
Outcomes
The outcomes reported were: overall severity of ADHD symptoms (Handen 2000; Pearson 2013; Quintana 1995; RUPP 2005); hyperactivity (Handen 2000; Pearson 2013; Quintana 1995; RUPP 2005); hyperactivity/impulsivity (RUPP 2005); restlessness‐impulsivity (Pearson 2013); inattention (Pearson 2013; RUPP 2005); overall severity of core features of autism (Handen 2000); lethargy/social withdrawal (Handen 2000; Pearson 2013); social skills (Pearson 2013); social communication with respect to joint attention (RUPP 2005); inappropriate speech (Handen 2000; Pearson 2013); stereotypic behaviour (Handen 2000; Pearson 2013; Quintana 1995); compulsive/repetitive behaviour (RUPP 2005); irritability (Handen 2000; Pearson 2013; Quintana 1995); aggression (Handen 2000); emotional lability (Pearson 2013); oppositional behaviour (Pearson 2013); oppositional defiant disorder (RUPP 2005); self‐regulation (RUPP 2005); compliance (RUPP 2005); regulated affective state (RUPP 2005); abnormal involuntary movements (Quintana 1995); any other atypical behaviours (Pearson 2013) and presence or severity (or both) of common adverse events of methylphenidate (Handen 2000; Pearson 2013; Quintana 1995; RUPP 2005).
Outcome measurement
Included studies used a number of different psychometric instruments or scales to measure our primary outcomes (see Table 1 for symptoms of ADHD and Table 2 for symptoms of ASD). Neither Handen 2000 nor Quintana 1995 nominated a primary outcome measure. Pearson 2013 justified the use of the CTRS‐Revised as their primary outcome measure because it had been shown previously in the literature to be "sensitive to medication treatment response in children with ADHD in the general school‐age population and in children with ASD and symptoms of ADHD". RUPP 2005 did not justify the use of the teacher‐rated hyperactivity subscale of Aberrant Behaviour Checklist as their primary outcome measure.
| Instrument | Inattention | Impulsivity | Hyperactivity | |||
| Teachera | Parent | Teachera | Parent | Teachera | Parent | |
| ABC | — | — | — | — | H , Q, R | P , R |
| ACTeRS | P | P | — | — | P | P |
| Conners' Global Index | — | — | P | P | P | P |
| CPRS‐R and CTRS‐R | P | P | — | — | P, Q | P |
| Conners' Abbreviated Parent/Teacher Questionnaire | — | — | — | — | — | — |
| SNAP‐IV | P , R | P , R | — | — | P , R | P, R |
a'Teacher' includes clinician and trained observer raters.
Letters (H, P, Q, R) indicate those studies that used a particular instrument to rate the particular outcome. Letters in bold and underlined font indicate the instrument we used in our meta‐analysis: H: Handen 2000; P: Pearson 2013; Q: Quintana 1995; R: RUPP 2005.
ABC: Aberrant Behavior Checklist; ACTeRS: ADD‐H (Attention deficit disorder ‐ hyperactivity) Comprehensive Teacher Rating Scale; ADHD: attention deficit hyperactivity disorder; CPRS‐R: Conners' Parent Rating Scale ‐ Revised; CTRS‐R: Conners' Teacher Rating Scale ‐ Revised;SNAP‐IV: Swanson, Nolan, and Pelham Questionnaire, Fourth Edition.
| Instrument | Impaired social interaction | Impaired communication | Stereotypical behaviours | Overall ASD | ||||
| Teacher a | Parent | Teacher a | Parent | Teacher a | Parent | Teacher a | Parent | |
| ABC | H | P | H | P | H , Q | P | — | — |
| ACTeRS | P | P | — | — | — | — | — | — |
| CARS | — | — | — | — | — | — | H | — |
| CYBOCS | — | — | — | — | R | — | — | — |
| CPRS‐R and CTRS‐R | P | P | — | — | — | — | — | — |
| Iowa CTRS | H | — | — | — | — | — | — | — |
| Social communication questionnaire | — | — | — | — | — | — | — | P |
| SNAP‐IV | R | R | — | — | — | — | — | — |
| Clinician Global Impression ‐ Severity | — | — | — | — | — | — | P | — |
a'Teacher' includes clinician and trained observer raters;
Letters (H, P, Q, R) indicate the studies which used a particular instrument to rate the particular outcome. Letters in bolded and underlined font indicate the instrument we used in our meta‐analysis: H: Handen 2000; P: Pearson 2013; Q: Quintana 1995; R: RUPP 2005;
ABC: Aberrant Behavior Checklist; ACTeRS: ADD‐H (Attention deficit disorder ‐ hyperactivity) Comprehensive Teacher Rating Scale; ASD: autism spectrum disorders; CARS: Child Autism Rating Scale; CPRS‐R: Conners' Parent Rating Scale ‐ Revised; CTRS‐R: Conners' Teacher Rating Scale ‐ Revised; CYBOCS: Children's Yale‐Brown Obsessive Compulsive Scales;Iowa CTRS: Iowa Conners' Teacher Rating Scale; SNAP‐IV: Swanson, Nolan, and Pelham Questionnaire, 4th Edition.
Study and author funding
The Fanny Pushkin Rosenberg Research Foundation provided study funding for Handen 2000, and the National Institute of Mental Health Bethesda, the National Institutes of Health Bethesda, and the Korczak Foundation for RUPP 2005. One or more study authors in Pearson 2013 had received funding from or served as a consultant or advisor for: the Forest Research Institute, Curemark LLC, United Biosource Corporation, BioMarin Pharmaceuticals, Bristol‐Myers Squibb, Confluence Pharmaceutica, Hoffman LaRoche, Johnson & Johnson, Supernus Pharmaceutica, Shire, Lilly, Organon, Sigma Tau, Targacept, AstraZeneca, Novartis, Noven, Seaside Therapeutics, Abbotts Laboratories, Pearson Assessments/Psychological Corporation or Ezra Innovations. Quintana 1995 did not report funding sources.
Excluded studies
We excluded 21 studies from this review: 12 because they were not a RCT (Akyol 2015; Aman 1991; Armstrong 2008; Barnard‐Brak 2016; Birmaher 1988; Croteau 2013; Di Martino 2004; Flapper 2008; Gurbuz 2016; Mayes 1994; Scahill 2007; Sinzig 2014); 7 because the participants did not meet the criteria for ASD (Aman 1997; Epstein 2011; Faraone 2001; Simonoff 2013; Steele 2006; Von Morgenstern 2014; Çetín 2015); 1 because it did not report on an original study (Shea 2006), and 1 because the participants in the study did not meet the age criterion (Ghuman 2009).
The excluded RCTs included Aman 1997, which was a double‐blind, placebo‐controlled, cross‐over study of methylphenidate and different doses of fenfluramine in children with mental retardation or borderline IQ and ADHD; participants did not meet criteria for ASD. Birmaher 1988 studied methylphenidate in children with autism and features of ADHD, but this was not a randomised controlled trial. Ghuman 2009 was a randomised, controlled, double‐blind, cross‐over study of methylphenidate for ADHD symptoms in preschoolers with ASD or developmental delay (IQ of less than 70), but participants were aged from three to five years, which is younger than the cutoff for inclusion in our review. Di Martino 2004 studied methylphenidate in children with autism or pervasive developmental disorder and features of ADHD, but it was not a RCT. Simonoff 2013 was a randomised, controlled, double‐blind trial of optimal dose methylphenidate in children and adolescents with severe ADHD and intellectual disability (IQ 30 to 69), but although it measured symptoms of autism using the parent‐reported Social Communication Questionnaire, participants did not meet criteria for ASD. Steele 2006 was an open‐label, randomised trial comparing immediate‐release methylphenidate with extended‐release methylphenidate in children with a diagnosis of ADHD, but although parent stress and social play were measured, participants did not meet criteria for ASD. See Characteristics of excluded studies.
Risk of bias in included studies
We assessed all of the included trials for risk of bias across the seven domains of the Cochrane 'Risk of bias' tool (Higgins 2017). The results of this assessment are shown for each study in the 'Risk of bias' tables, beneath the Characteristics of included studies tables and summarised in 'Risk of bias' graphs (Figure 2; Figure 3).
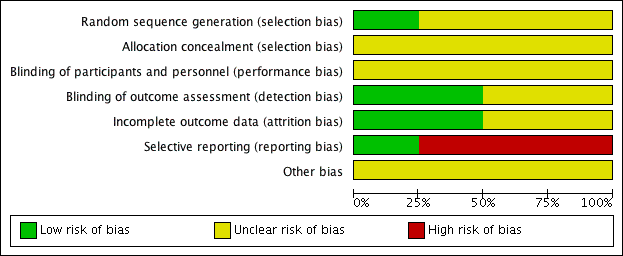
Risk of bias graph: review authors' judgements about each risk of bias item presented as percentages across all included studies.

Risk of bias summary: review authors' judgements about each risk of bias item for each included study.
Allocation
Random sequence generation
We assessed three studies as being at unclear risk of selection bias based on inadequate information about the generation of random numbers (Handen 2000; Pearson 2013; Quintana 1995). One study, RUPP 2005, reported an appropriate method for generating a random numbers list, so we considered it to be at low risk of bias.
Allocation concealment
We rated all four studies at unclear risk of selection bias based on inadequate information about the method of allocation concealment (Handen 2000; Pearson 2013; Quintana 1995; RUPP 2005).
Blinding
None of the studies provided enough information to assess to what extent blinding had been successful.
Performance bias
We considered the risk of performance bias to be unclear in all four studies (Handen 2000; Pearson 2013; Quintana 1995; RUPP 2005).
The main issue was inadequate information about whether participants had taken methylphenidate prior to the study, and hence whether some of these children and their parents could have recognised the active medication (by recognising adverse events, for example) (Handen 2000; Pearson 2013). The corresponding author for Handen 2000 was unable to retrieve this information but indicated that from his recall some participants were likely to have had previous exposure to methylphenidate.
Detection bias
We considered the risk of detection bias to be low in Handen 2000 and Quintana 1995 and unclear in Pearson 2013 and RUPP 2005.
The study staff were unblinded during the test‐dose week in Pearson 2013 and RUPP 2005.
Incomplete outcome data
We assessed two studies, Pearson 2013 and Quintana 1995, to be at low risk of attrition bias, because all missing data were accounted for. We assessed Handen 2000 to be at unclear risk of attrition bias because there was insufficient information about the method of imputing missing data, and the corresponding author was not able to retrieve this information. We assessed RUPP 2005 to be at unclear risk of attrition bias because outcome data for the impaired communication outcome was incomplete.
Selective reporting
We considered the risk of reporting bias to be high in Handen 2000, Quintana 1995 and RUPP 2005, and low in Pearson 2013. We assessed Handen 2000 to be at high risk of reporting bias because authors did not provide parent ratings (although they reported that this outcome was incomplete because many participants resided in inpatient clinics or residential halls). Quintana 1995 did not report CARS outcomes, despite listing the CARS score as an outcome. We were unable to contact the corresponding author to clarify this. RUPP 2005 did not report the Clinician Global Impression ‐ Improvement subscale score outcome, although it was used in a composite score to define response. In addition, two subsequent publications (in 2007 and 2009, see RUPP 2005) reported additional outcomes that the original publication did not mention. We rated Pearson 2013 at low risk of reporting bias because the reporting of outcomes was comprehensive.
Other potential sources of bias
We considered all four studies to be at unclear risk of bias due to a lack of information about either study funding (in Handen 2000 and Quintana 1995) or potential conflicts of interest of the investigators/authors (in Pearson 2013 and RUPP 2005). The corresponding author of Handen 2000 could not retrieve this information, and we were unable to contact the corresponding author of Quintana 1995. It is unclear if the affiliations with pharmaceutical companies reported in RUPP 2005 represent a risk of bias, so we judged this study to be at unclear risk of bias. We assessed Pearson 2013 at unclear risk of bias, because the authors reported having received previous financial support from a number of pharmaceutical companies (including manufacturers of pharmaceuticals for behavioural syndromes in children), although the included study was not funded by any pharmaceutical companies.
Effects of interventions
See: Summary of findings for the main comparison High‐dose methylphenidate versus placebo for symptoms of ADHD and ASD as rated by teachers; Summary of findings 2 High‐dose methylphenidate versus placebo for symptoms of ADHD and ASD as rated by parents
We presented the results for the primary outcome, clinical efficacy (defined as an improvement in ADHD‐like symptoms and an improvement in symptoms of ASD), as rated by teachers for high‐dose methylphenidate in summary of findings Table for the main comparison, and as rated by parents for high‐dose methylphenidate in summary of findings Table 2.
Below, we report the results separately for the features of ADHD, the core symptoms of ASD and overall ASD. For symptoms of ADHD, we report results on inattention, impulsivity and hyperactivity, as rated by teachers and parents separately. For ASD outcomes, we report results on impaired social interaction, impaired communication, and stereotypical behaviours as well as overall ASD, as rated by teachers and parents separately. No meta‐analysis was possible for the primary outcomes of impulsivity or impaired communication, as only Pearson 2013 measured impulsivity and impaired communication as rated by parents, and only Handen 2000 measured impaired communication as rated by teachers.
Doses differed between studies, with some using doses calculated per kg of participant body weight, and others using proprietary doses of 2.5 mg, 5 mg, 10 mg and 20 mg of methylphenidate with adjustment for participant weight. Doses were three times daily in two studies: Handen 2000, although parents elected to omit the third daily dose for 2/13 children, and RUPP 2005, where the third dose was half of the earlier doses, and no information was available about whether any parents elected to omit the third dose. Quintana 1995 and Pearson 2013 administered doses twice daily, although parents elected to omit the second dose in 5/24 children in the Pearson 2013 study because of "behaviour concerns in the late afternoon/evening".
A number of different psychometric instruments/scales were used both across and within included studies to measure our primary outcomes (see Table 1 for ADHD‐like symptoms and Table 2 for symptoms of ASD). Where an included study used more than one outcome measure, we used the measure in our analysis, which was also used by one or more of our other included studies. This was a pragmatic approach given the absence of a generally accepted gold standard outcome instrument/scale. We therefore report effect sizes as measured on the most commonly used scales across our included studies. The scales used in our meta‐analysis are highlighted in bold and underlined font in Table 1 and Table 2. We used a coefficient of 0.6, which was the within‐subject correlation calculated by RUPP 2005 (based on three methylphenidate cross‐over studies involving participants with developmental disabilities), and we performed sensitivity analyses using a coefficient of 0 and 0.8.
No data were available to assess short‐term (1 to 3 months), medium‐term (3 to 6 months) and long‐term (6 to 12 months) outcomes, as the duration of observation was limited to one week under each experimental condition in all included studies.
We were unable to perform subgroup analyses based on ages 6 to 12 years and 13 to 18 years, because only one study, RUPP 2005, included children aged 13 years and did not report any individual data, and no studies included children aged 14 years or older.
We were unable to perform subgroup analyses based on the formulation of methylphenidate. Only one study, Pearson 2013, used an extended‐release form, so we were unable to compare extended‐release with immediate‐release formulations. Furthermore, Pearson 2013 used both extended‐release methylphenidate (for the morning dose) and immediate‐release methylphenidate (for the afternoon dose, if it was administered). However, parents were asked to focus only on their child's morning behaviour for their ratings, and teachers only saw the children on the extended‐release dose; therefore, we considered this study to have a single treatment arm (extended‐release methylphenidate). No studies used transdermal preparations, so we were unable to compare oral with transdermal methylphenidate.
No data were available on the secondary outcomes of caregiver well‐being; need for institutionalisation, special schooling options or therapy to achieve learning outcomes; or overall quality of life.
Primary outcomes: clinical efficacy
1. Improvement in ADHD‐like symptoms: inattention
Two studies measured inattention as rated by teachers and parents (Pearson 2013; RUPP 2005). Both studies used the inattention subscale of the Swanson, Nolan, and Pelham, Fourth Version (SNAP‐IV) questionnaire, which was used in our primary analysis. This subscale consists of nine items, which are measured on a rating scale ranging from zero to three. Pearson 2013 also used the cognitive‐inattention subscale of the Conners' Parent Rating Scale ‐ Revised (CPRS‐R) short form, and the inattention subscale of the ADD‐H (attention deficit disorder ‐ hyperactivity) Comprehensive Teacher Rating Scale (ACTeRS). See Table 1.
Participants in the Pearson 2013 study differed from those in the RUPP 2005 study in three ways. First, 13/24 children had previous methylphenidate exposure, whereas RUPP 2005 excluded children who had had an adequate trial of methylphenidate in the previous two years. Second, participants in the RUPP 2005 study may have been more unwell than those in the Pearson 2013 study; children in the Pearson 2013 study were rated moderately to severely ill by clinicians and recruited from psychiatric outpatient clinics, while children in the RUPP 2005 study were recruited from special education classrooms. Finally, unlike those in RUPP 2005, participants in the Pearson 2013 study were permitted to remain on other prescribed psychotropic medication, including antidepressant and antipsychotic medication. However, we did not consider that these minor differences were sufficient to preclude their data being combined.
We downgraded the quality of evidence of the pooled effect for both teacher‐rated and parent‐rated inattention to low, due to imprecision (data came from only two small studies), and limitations in study design and implementation in both studies.
1.1 Teacher rated
The pooled difference between treatment and placebo was statistically significant and favoured the treatment group (MD −2.72 points, 95% CI −5.37 to −0.06, rated on SNAP‐IV inattention subscale, range 0 to 27; 2 studies, 51 participants; Analysis 1.1; summary of findings Table for the main comparison).
An I2 of 79% indicated considerable heterogeneity.
As a sensitivity analysis, we applied a correlation coefficient of 0 and of 0.8. When we applied a correlation coefficient of 0, the pooled difference between treatment and placebo was no longer statistically significant (MD −2.55 points, 95% CI −5.15 to 0.06, rated on SNAP‐IV inattention subscale, range 0 to 27; 2 studies, 51 participants; Analysis 2.1). When we applied a correlation coefficient of 0.8, the pooled difference between treatment and placebo remained statistically significant and in favour of the treatment group (MD −2.77 points, 95% CI −5.43 to −0.11 rated on SNAP‐IV inattention subscale, range 0 to 27; 2 studies, 51 participants; Analysis 3.1).
Both studies used the SNAP‐IV measurement scale. Pearson 2013 also used the CPRS‐R and the ACTeRS. Our conclusions did not change when the ACTeRS and the CTRS‐R results were substituted as a sensitivity analysis.
1.2 Parent rated
The pooled difference between treatment and placebo was not statistically significant (MD −3.16 points, 95% CI −6.89 to 0.57, rated on SNAP‐IV inattention subscale, range 0 to 27; 2 studies, 71 participants; Analysis 5.1; summary of findings Table 2).
An I2 of 86% indicated considerable heterogeneity.
As a sensitivity analysis, we applied a correlation coefficient of 0 and of 0.8. Using a correlation coefficient of 0 (MD −3.11 points, 95% CI −6.84 to 0.62, rated on SNAP‐IV inattention subscale, range 0 to 27; 2 studies, 71 participants; Analysis 6.1), as well as 0.8 (MD −3.18 points, 95% CI −6.91 to 0.56, rated on SNAP‐IV inattention subscale, range 0 to 27; 2 studies, 71 participants; Analysis 7.1), we could not rule out that the pooled difference between treatment and placebo may have been due to chance.
Both studies used the SNAP‐IV measurement scale. Pearson 2013 also used the CPRS‐R and the ACTeRS. Our conclusions did not change when the ACTeRS and the CTRS‐R results were substituted as a sensitivity analysis.
2. Improvement in ADHD‐like symptoms: impulsivity
Only Pearson 2013 measured impulsivity (as rated by 24 parents and 18 teachers), so we were unable to pool results. Pearson 2013 used the restless‐impulsivity subscale of the Conners' Global Index to measure impulsivity (see Table 1). This scale was rated by parents as well as teachers.
2.1 Teacher rated
Methylphenidate had a significant, beneficial effect compared to placebo on impulsivity as rated by teachers (MD −14.8 points, 95% CI −18.52 to −11.08, rated on Conner's Global Index restless‐impulsivity subscale, range unknown). We note that Pearson 2013 reported that these results were significant, although they did not provide a P value.
2.2 Parent rated
Methylphenidate had a significant, beneficial effect compared to placebo on impulsivity as rated by parents (MD −11.3 points, 95% CI −14.05 to −8.21, rated on Conner's Global Index restless‐impulsivity subscale, range unknown). We note that Pearson 2013 reported that these results were significant, although without providing a P value.
3. Improvement in ADHD‐like symptoms: hyperactivity
All four studies reported on hyperactivity as rated by parents and teachers (Handen 2000; Pearson 2013; Quintana 1995; RUPP 2005). In three studies both clinicians and teachers rated participants (Handen 2000; Pearson 2013; RUPP 2005), while in Quintana 1995, only the psychiatrist clinicians rated hyperactivity based on a three‐hour observation period. We combined clinician ratings with those of teachers. Studies used five different rating scales: the hyperactivity index of the Conners' Teacher Rating Scale ‐ Revised (CTRS‐R; 10 items rated on a four‐point rating scale) used in Quintana 1995; the hyperactivity subscale of the Aberrant Behavior Checklist (ABC; 16 items, rated on a four‐point rating scale) used in Handen 2000, Pearson 2013, Quintana 1995 and RUPP 2005; the hyperactivity/impulsivity subscale of the SNAP‐IV questionnaire (nine items, rated on a four‐point rating scale) used in Pearson 2013 and RUPP 2005; the hyperactivity subscale of the CPRS‐R, used in Pearson 2013; and the hyperactivity rating scale of the ACTeRS, used in Pearson 2013. See Table 1.
Pearson 2013 reported including children with recent previous methylphenidate exposure (13/24 children), whereas Quintana 1995 excluded children with previous methylphenidate exposure, and RUPP 2005 excluded children who had had an adequate trial of methylphenidate in the previous two years. Handen 2000 did not report on whether or not prior methylphenidate use was an exclusion criterion, and the corresponding author was unable to retrieve this information. The participants in the Pearson 2013 and Quintana 1995 studies may have been less unwell overall than the participants in Handen 2000 (some of whom had severe/profound cognitive impairment) and RUPP 2005 (who were judged moderately to severely unwell). Pearson 2013 recruited from special education classrooms rather than psychiatric outpatient clinics. Unlike in the other studies, participants in Pearson 2013 were permitted to remain on other prescribed psychotropic medication, including antidepressant and antipsychotic medication. The more limited period of observation (three hours) by clinicians in Quintana 1995, compared to other studies, may have led to less developed relationships with the children and less emphasis on academic performance than the teacher ratings in the other studies. However, we did not consider that these differences were sufficient to preclude their data being combined.
We downgraded the quality of evidence of the pooled effect for both teacher‐ and parent‐rated hyperactivity to low, due to imprecision (data came from only two or four small studies) and limitations in design and implementation in all studies.
3.1 Teacher rated
Pooling was possible for all four studies (Handen 2000; Pearson 2013; Quintana 1995; RUPP 2005). The pooled difference between treatment and placebo was statistically significant and favoured the treatment group (SMD −0.78, 95% CI −1.13 to −0.43; 73 participants; Analysis 1.2; summary of findings Table for the main comparison). The SMD of −0.78 corresponded to a moderate clinical effect, which was a clinically important difference.
An I2 of 48% indicated moderate heterogeneity.
As a sensitivity analysis, we applied a correlation coefficient of 0 and 0.80. For a correlation coefficient of 0 (SMD −0.70, 95% CI −1.07 to −0.33; 4 studies, 73 participants; Analysis 2.2), as well as 0.8 (SMD −0.81, 95% CI −1.16 to −0.47; 4 studies, 73 participants; Analysis 3.2), the pooled difference between treatment and placebo remained statistically significant.
In the pooled estimate, three studies used the ABC to measure hyperactivity (Handen 2000; Quintana 1995; RUPP 2005), and one study used the SNAP‐IV (Pearson 2013). As a sensitivity analysis, we also compared hyperactivity as measured by the ABC (Handen 2000; RUPP 2005), the CTRS‐R (Pearson 2013; Quintana 1995), and the SNAP‐IV (Pearson 2013; RUPP 2005). Regardless of which scale was used, the difference between treatment and placebo was statistically significant and favoured the treatment group (see Analysis 4.1).
3.2 Parent rated
Pooling was only possible for two studies (Pearson 2013; RUPP 2005). The pooled difference between treatment and placebo was statistically significant and favoured the treatment group (MD −6.61 points, 95% CI −12.19 to −1.03, rated on ABC hyperactivity subscale, range 0 to 48; 71 participants; Analysis 5.1; summary of findings Table 2).
An I2 of 69% indicated considerable heterogeneity.
As a sensitivity analysis, we applied a correlation coefficient of 0 and of 0.8. For a correlation coefficient of 0 (SMD −6.44, 95% CI −12.00 to −0.89; 2 studies, 71 participants; Analysis 6.1), as well as 0.8 (SMD −6.67, 95% CI −12.25 to −1.08; 2 studies, 71 participants; Analysis 7.1), the pooled difference between treatment and placebo remained statistically significant.
Both studies used the ABC measurement scale (Pearson 2013; RUPP 2005). As a sensitivity analysis, we also compared hyperactivity as measured by the ABC and the SNAP‐IV (Pearson 2013; RUPP 2005). Irrespective of which scale was used, the difference between treatment and placebo was statistically significant and favoured the treatment group (see Analysis 8.1).
4. Improvement in core symptoms of ASD: impaired social interaction
Three studies reported impaired social interaction (Handen 2000; Pearson 2013; RUPP 2005). RUPP 2005 used the oppositional defiant disorder subscale of the SNAP‐IV (eight items, rated on a four‐point rating scale). Handen 2000 and Pearson 2013 used the ABC lethargy/social withdrawal subscale (16 items, rated on a four‐point rating scale). Handen 2000 also used the aggression subscale of the IOWA Conners' Teacher Rating Scale (five items, rated on a four‐point rating scale). Pearson 2013 also used the oppositional behaviour subscale of the CPRS‐R and the social skills subscale of the ACTeRS. See Table 2.
Pearson 2013 reported including children with previous methylphenidate exposure (13/24 children), and Handen 2000 probably included some participants with previous methylphenidate exposure (based on the corresponding author's recollection), whereas RUPP 2005 excluded children who had had an adequate trial of methylphenidate in the previous two years. Also, the participants in the Pearson 2013 study may have been less unwell overall than the other study participants, who were all recruited from psychiatric outpatient clinics rather than special education classrooms. The participants in Pearson 2013, unlike the other participants, were also permitted to remain on other prescribed psychotropic medication, including antidepressant and antipsychotic medication. However, we did not consider that these differences were sufficient to preclude their data being combined.
We downgraded the quality of evidence of the pooled effect for both teacher‐ and parent‐rated impaired social interaction to very low, due to imprecision (data came from only two or three small studies), limitations in design and implementation in all three studies, and indirectness of evidence in all three studies.
4.1 Teacher rated
Pooling was possible for three studies (Handen 2000; Pearson 2013; RUPP 2005). The pooled difference between treatment and placebo was not statistically significant (SMD −0.51, 95% CI −1.07 to 0.05; 63 participants; Analysis 1.3; summary of findings Table for the main comparison).
An I2 of 78% indicated considerable heterogeneity.
As a sensitivity analysis, we applied a correlation coefficient of 0 and of 0.8. For a correlation coefficient of 0 (SMD −0.44, 95% CI −0.99 to 0.11; 3 studies, 63 participants; Analysis 2.3), as well as 0.8 (SMD −0.53, 95% CI −1.09 to 0.02; 3 studies, 63 participants; Analysis 3.3), we could not rule out that the pooled difference between treatment and placebo may have been due to chance.
We used the Iowa Conners' Teachers (Handen 2000), the SNAP‐IV (RUPP 2005), and the CTRS‐R (Pearson 2013) measurement scales for this analysis. Pearson 2013 also used the ACTeRS and Handen 2000 also used the ABC scales. Our conclusions did not change when the ACTeRS and the ABC results were substituted in a sensitivity analysis.
4.2 Parent rated
Pooling was possible for two studies (Pearson 2013; RUPP 2005). The pooled difference between treatment and placebo was not statistically significant (SMD −0.21, 95% CI −0.60 to 0.18; 71 participants; Analysis 5.2; summary of findings Table 2).
An I2 of 67% indicated considerable heterogeneity.
As a sensitivity analysis, we applied a correlation coefficient of 0 and of 0.8. For a correlation coefficient of 0 (SMD −0.17, 95% CI −0.55 to 0.20; 2 studies, 71 participants; Analysis 6.2) as well as 0.8 (SMD −0.22, 95% CI −0.61 to 0.17; 2 studies, 71 participants; Analysis 7.2), we could not rule out that the pooled difference between treatment and placebo may have been due to chance.
We used the CPRS‐R measurement scale, reported in Pearson 2013, and the SNAP‐IV, reported in RUPP 2005, for this analysis. Pearson 2013 also used the ABC and ACTeRS scales. Our conclusions did not change when the ABC and ACTeRS results were substituted in a sensitivity analysis.
5. Improvement in core symptoms of ASD: impaired communication
Two studies reported impaired communication (Handen 2000; Pearson 2013), and they both used the inappropriate speech subscale of the ABC (four items, rated on a four‐point rating scale). See Table 2. However, we were not able to pool results because teachers rated impaired communication in Handen 2000 and parents in Pearson 2013.
5.1 Teacher rated
Methylphenidate showed a significant beneficial effect compared to placebo on teacher‐rated impaired communication in Handen 2000 (MD −2.25 points, 95% CI −3.41 to −1.09, rated on ABC inappropriate speech subscale, range 0 to 16; 12 participants). We note that Handen 2000 reported that these results were significant, with a P value of less than 0.001.
5.2 Parent rated
Methylphenidate showed a significant beneficial effect compared to placebo on parent‐rated impaired communication in Pearson 2013 (MD −1.30 points, 95% CI −2.08 to −0.52, rated on ABC inappropriate speech subscale, range 0 to 16; 24 participants). We note that Pearson 2013 reported that these results were significant but did not report a P value.
6. Improvement in core symptoms of ASD: stereotypical behaviours
All four studies reported on stereotypical behaviours, as rated by teachers in Handen 2000, Quintana 1995 and RUPP 2005, and as rated by parents in Pearson 2013. Handen 2000, Pearson 2013 and Quintana 1995, used the stereotypic behavior subscale of the ABC (seven items, rated on a four‐point rating scale). RUPP 2005 used the Children's Yale‐Brown Obsessive Compulsive Scales for pervasive developmental disorder (five items, scored from zero to four). See Table 2.
The more limited period of observation by clinicians in Quintana 1995, compared to the other studies, may have led to less developed relationships with the children and less emphasis on academic performance than comparable teacher ratings. However, it is unclear how these differences might have influenced the statistical heterogeneity.
We downgraded the quality of evidence of the pooled effect for teacher‐rated stereotypical behaviours to low, due to imprecision (data came from only four small studies), and limitations in design and implementation in all four studies.
6.1 Teacher rated
Pooling was possible for three studies (Handen 2000; Quintana 1995; RUPP 2005). The pooled difference between treatment and placebo was not significant (SMD −0.34, 95% CI −0.84 to 0.17; 69 participants; Analysis 1.3; summary of findings Table for the main comparison).
An I2 of 72% indicated considerable heterogeneity.
As a sensitivity analysis, we applied a correlation coefficient of 0 and of 0.8. For a correlation coefficient of 0 (SMD −0.24, 95% CI −0.71 to 0.23; 3 studies, 69 participants; Analysis 2.3), as well as 0.8 (SMD −0.37, 95% CI −0.87 to 0.14; 3 studies, 69 participants; Analysis 3.3), the pooled difference between treatment and placebo could have been due to chance.
6.2 Parent rated
Methylphenidate had a statistically significant effect compared to placebo on stereotypical behaviours as rated by parents in Pearson 2013 (MD −1.40 points, 95% CI −2.63 to −0.17, rated on ABC stereotypic behavior subscale, range 0 to 28; 24 participants). We note that Pearson 2013 reported that these results were not significant but did not report a P value.
7. Improvement in overall ASD
Two studies reported on overall ASD (Handen 2000; Pearson 2013). Handen 2000 used the Child Autism Rating Scale (15 items), as rated by teachers. Pearson 2013 used the Social Communication Questionnaire (40 items) in parents and a Clinician Global Impression ‐ Severity score in teachers. See Table 2.
The participants in the Pearson 2013 study may have been less unwell overall than the participants in the Handen 2000 study, as they were recruited from special education classrooms rather than psychiatric outpatient clinics. The participants in the Pearson 2013 study, unlike those in Handen 2000, were also permitted to remain on other prescribed psychotropic medication, including antidepressant and antipsychotic medication. However, we did not consider that these minor differences were sufficient to preclude meta‐analysis.
We downgraded the quality of evidence of the pooled effect for teacher‐rated overall ASD to low, due to imprecision (data came from only two studies) and limitations in design and implementation in both studies.
7.1 Teacher rated
Pooling was possible for two studies (Handen 2000; Pearson 2013). The pooled difference between treatment and placebo was not statistically significant (SMD −0.53, 95% CI −1.26 to 0.19; 36 participants; Analysis 1.3; summary of findings Table for the main comparison).
An I2 of 79% indicated considerable heterogeneity.
As a sensitivity analysis, we applied a correlation coefficient of 0 and of 0.8. For a correlation coefficient of 0 (SMD −0.56, 95% CI −1.28 to 0.17; 2 studies, 36 participants; Analysis 2.3), as well as 0.8 (SMD −0.53, 95% CI −1.25 to 0.20; 2 studies, 36 participants; Analysis 3.3), the pooled difference between treatment and placebo could have been due to chance.
7.2 Parent rated
Methylphenidate had a statistically significant effect compared to placebo on overall ASD as rated by parents in Pearson 2013 (MD −2.10 points, 95% CI −3.65 to −0.55, rated on Social Communication Questionnaire, range 0 to 40; 24 participants). We note that Pearson 2013 reported that these results were not significant but reported no P value.
Secondary outcomes
1. Rate of adverse events: total number
All four studies reported adverse events, as rated by teachers or programme staff in Handen 2000, by teachers in Pearson 2013, and by the paediatrician in Quintana 1995. Parents rated this outcome in Pearson 2013 and RUPP 2005. Only Pearson 2013 reported adverse events data from both parents and teachers, and noted that parents tended to report more adverse events than teachers at higher doses of methylphenidate. Quintana 1995 did not list individual adverse events, instead reporting an overall adverse events checklist score. Handen 2000 reported only moderate or severe adverse events despite also collecting data on mild adverse events. Each study appears to have used a different adverse events checklist. Therefore, the reporting of adverse events varied considerably across all studies, and only one study reported an overall total number of adverse events (RUPP 2005). As a result, we were not able to pool results for the total rate of adverse events.
Only Pearson 2013 used extended‐release methylphenidate, so we were unable to compare rates of adverse events between immediate‐release and extended‐release methylphenidate.
Investigators designed exclusion criteria to minimise serous adverse events. Three studies reported excluding participants with major neurological disorders (Pearson 2013; Quintana 1995; RUPP 2005), two studies excluded participants with major cardiovascular disorders (Quintana 1995; RUPP 2005), and one study excluded previous mood disorders (Pearson 2013). We were unable to adjust for the cross‐over design of our included studies as individual patient data were not available. This conservative approach is likely to result in an underestimation of the risk of adverse events, if there is a within‐person correlation for adverse events.
A number of other factors are likely to have led to an underestimation of adverse events of methylphenidate. First, except for Quintana 1995, the studies included children with prior exposure to methylphenidate. About 50% of the participants in Pearson 2013 and 30% of the participants in RUPP 2005 had taken methylphenidate previously. Children with previous adverse experiences of methylphenidate are not likely to have accepted invitations to participate, and therefore study participants may be more likely to be tolerant of methylphenidate adverse events than the general population of children with ASD and ADHD symptoms. Second, all studies included an unblinded, one‐week period in which the methylphenidate dose was progressively escalated, to test whether participants could tolerate study doses. Investigators did not report the adverse events of participants who withdrew or were excluded during the test‐dose phase prior to randomisation into the cross‐over phase. Third, adverse events from high‐dose methylphenidate are likely to be underestimated because a number of participants were unable to tolerate the high dose due to adverse events in the test‐dose phase and were not randomised to the high dose in the cross‐over phase (16 out of the 66 participants randomised in the RUPP 2005 trial, for example), and therefore are not included in reporting of adverse events for the high‐dose condition. Fourth, several studies reported that some parents did not administer the scheduled afternoon dose of methylphenidate, which is likely to reduce the reporting of evening and overnight adverse events. Therefore, we consider that the evidence for the pooled risk of adverse events is of very low quality.
Please see Analysis 1.4 and Analysis 5.3 and Appendix 6 for results for gastrointestinal effects (abdominal discomfort, reduced appetite and other gastrointestinal effects), general physical effects (dizziness, drowsiness, headache, sleep disturbance, increased activity and other general physical effects), psychological effects (anxiety, depressed mood, irritability, social withdrawal and other psychological effects), repetitive behaviours (general repetitive behaviours, repetitive movements or tics, and other repetitive behaviours) and other adverse events (staring). When we applied a random‐effects model, the only adverse effect that was significantly more likely with treatment was reduced appetite as rated by parents (RR 8.28, 95% CI 2.57 to 26.73; 2 studies, 74 participants; P < 0.01). The number needed to treat for an additional harmful outcome with regard to reduced appetite was 4.7.
When we applied a fixed‐effect model (less conservative) to those adverse events for which statistical heterogeneity was less than 60%, abdominal discomfort (RR 4.74, 95% CI 1.07 to 21.02; 2 studies, 74 participants; P = 0.04) and reduced appetite (RR 8.32, 95% CI 2.57 to 26.91; 2 studies, 74 participants; P < 0.001), as rated by parents, were significantly more likely with treatment (analyses not reported). Results did not differ for adverse events as rated by teachers (analyses not reported).
2. Caregiver well‐being
The included trials did not report on this outcome.
3. Need for institutionalisation, special schooling options or therapy to achieve learning outcomes
The included trials did not report on this outcome.
4. Overall quality of life
The included trials did not report on this outcome.
Subgroup analyses: different doses of methylphenidate
Primary outcomes: clinical efficacy
1. Improvement in ADHD‐like symptoms
1.1 Teacher rated
We found no significant differences between different doses of methylphenidate for the different symptoms of ADHD. However, we were only able to judge this for inattention (P = 0.79; 2 studies; 51 participants; Analysis 9.1) and hyperactivity (P = 0.33; 4 studies; 73 participants; Analysis 9.2). We were not able to assess the effect of different dosages for impulsivity as only one study reported this (Pearson 2013).
1.2 Parent rated
We found no significant differences between different doses of methylphenidate for the different symptoms of ADHD. However, we were only able to judge this for inattention (P = 0.61; 2 studies; 71 participants; Analysis 10.1) and hyperactivity (P = 0.22; 2 studies; 71 participants; Analysis 10.2). We were not able to assess the effect of different dosages for impulsivity as only one study reported this (Pearson 2013).
2. Improvement in core symptoms of ASD
2.1 Teacher rated
We found no significant differences between different doses of methylphenidate for the different symptoms of ASD. However, we were only able to judge this for impaired social interaction (P = 0.77; 3 studies; 63 participants; Analysis 9.3), stereotypical behaviours (P = 0.69; 3 studies; 69 participants; Analysis 9.4), and overall ASD (P = 0.97; 2 studies; 36 participants; Analysis 9.5). We were not able to assess the effect of different dosages for impaired communication as only one study reported this (Handen 2000).
2.2 Parent rated
We found no significant differences between different doses of methylphenidate for the different symptoms of ASD. However, we were only able to judge this for impaired social interaction (P = 0.96; 2 studies; 71 participants; Analysis 10.3). Only one study reported impaired communication, stereotypical behaviours and overall ASD (Pearson 2013).
Secondary outcomes: rate of adverse events
1. Teacher rated
Because the reporting of adverse events varied considerably across all studies, we were not able to pool results for the total rate of adverse events. However, for the specific symptoms (abdominal discomfort, reduced appetite, dizziness, drowsiness, headache, anxiety, depressed mood, irritability, and repetitive movements), we found no significant differences between different doses of methylphenidate (Analysis 9.6; Analysis 9.7; Analysis 9.8; Analysis 9.9; Analysis 9.10; Analysis 9.11; Analysis 9.12; Analysis 9.13; Analysis 9.14).
2. Parent rated
Because the reporting of adverse events varied considerably across all studies, we were not able to pool results for the total rate of adverse events. However, for the specific symptoms (abdominal discomfort, reduced appetite, headache, anxiety, depressed mood, irritability, repetitive behaviours, and sleep disturbance), we found no significant differences between different doses of methylphenidate (Analysis 10.4; Analysis 10.5; Analysis 10.6; Analysis 10.7; Analysis 10.8; Analysis 10.9; Analysis 10.10; Analysis 10.11).
Discussion
Summary of main results
We included four studies in our analysis, with a total of 113 randomised participants (94 (83%) boys; age range 5 to 13 years, all from the USA). All of these were cross‐over studies that compared either two or three different doses of methylphenidate with placebo. The duration of treatment in the cross‐over phase was one week for each dose of methylphenidate. Studies used a range of outcome scales, and several studies used multiple scales to assess one or more outcomes. Parents, teachers (or both), clinicians, and programme staff assessed outcomes. The studies took place between 1995 and 2013.
Primary outcomes: clinical efficacy
Improvement in ADHD‐like symptoms
The meta‐analysis suggested that high‐dose methylphenidate (0.43 mg/kg/dose to 0.60 mg/kg/dose) might have a significant and clinically important benefit on teacher‐rated hyperactivity and parent‐rated hyperactivity. High‐dose methylphenidate may have a significant but not clinically important benefit on teacher‐rated inattention but no benefit on inattention as rated by parents. There were inadequate data to conduct a meta‐analysis on the symptom of impulsivity as rated by either parents or teachers.
Improvement in the core symptoms of ASD and overall ASD
There was no evidence that methylphenidate worsens the core symptoms of ASD or improves social interaction as rated by teachers and parents; stereotypical behaviours as rated by teachers; and overall ASD as rated by teachers. There were inadequate data to conduct a meta‐analysis on: stereotypical behaviours as rated by parents; overall ASD as rated by parents; and impaired communication as rated either by parents or teachers.
Subgroup analysis
A subgroup analysis by dose did not identify any differences in effect on our primary outcomes at low‐, medium‐ or high‐dose ranges.
It was not possible to conduct a subgroup analysis by methylphenidate formulation. Data on duration of effect were not available as duration of follow‐up was only one week.
Secondary outcomes
Rate of adverse events
No studies reported serious adverse events. The only adverse event that was more likely with treatment was reduced appetite, as rated by parents. Other adverse events that were rated by parents or teachers (or both) in more than one included study, but for which the RR did not reach significance, included abdominal discomfort, dizziness, drowsiness, headache, sleep disturbance, anxiety, depressed mood, irritability and involuntary or repetitive movements. It was not possible to calculate the overall RR of one or more non‐serious adverse event(s), as individual participant data were not available. For our analyses of adverse events, we were unable to adjust for the cross‐over design of our included studies as individual patient data were not available. This conservative approach is likely to underestimate the risk of adverse events, if there is a within‐person correlation for adverse events.
No data were available for the secondary outcomes of caregiver well‐being; need for institutionalisation, special schooling options, or therapy to achieve learning outcomes; or overall quality of life.
Overall completeness and applicability of evidence
The evidence was directly applicable and relevant to our review question. Studies, however, were confined to children living in the USA, and our findings may not be generalisable to other countries with different cultural contexts, educational systems and resources. Concomitant psychotropic medication was not an exclusion criterion for this review. Although the concomitant use of such medication by some participants in one, or possibly two, of our included studies may have influenced our findings, it is not possible to estimate in which direction or to what extent such use may have done so. Our data are incomplete in a number of ways. We identified only four small studies, although their cross‐over design increases their power. Importantly, there is no evidence about the use of methylphenidate for longer than one week, and there is no evidence in children older than 13 years. There are also important problems with the completeness of adverse events data, as summarised below (see Quality of the evidence). Furthermore, given that individual participant data were not available, we cannot comment on whether individual participant characteristics (such as severity of ASD or cognitive impairment) predict response to treatment; this information would be useful to clinicians and parents. Data on the total daily dose administered were not available and, in many cases, parents determined whether or not afternoon doses were administered; this information may be relevant if adverse events or benefits of treatment are related to total daily dose. Our review, therefore, has limited external validity.
The included studies are not sufficient to address all of the objectives of the review, in particular the primary outcomes of impulsivity, impaired communication and parent‐rated stereotypical behaviours and overall ASD, and the secondary outcomes of caregiver well‐being; need for institutionalisation, specialised schooling or therapy; and overall quality of life. The trials did not investigate children who were not attending hospital‐based services or special schools, nor did they report medium‐ and long‐term outcomes. Current practice, in terms of prescribing methylphenidate for children with ASD, may vary internationally, but the published literature suggests that methylphenidate is frequently prescribed for these children (Frazier 2011). Our review suggests that there is insufficient evidence to be confident in the effectiveness and safety of this prescribing.
We reported on individual outcomes within the core features of ASD and ADHD‐like symptoms, as well as on overall ASD, allowing these treatment decisions to be personalised to some extent based on the predominant or most troubling symptom(s) a child manifests in particular contexts. This is likely to be helpful for parents and clinicians to determine if and when to administer methylphenidate, given that individual children with ASD and ADHD‐like symptoms manifest a heterogeneous range of different symptoms, which may be more or less troubling depending on the context.
Quality of the evidence
We judged the quality of the evidence to be low overall, as shown in more detail in summary of findings Table for the main comparison and summary of findings Table 2. We believe that this is a conservative judgement. We downgraded the quality of the evidence due to imprecision for all outcomes as a result of the small number of included studies and participants. We also downgraded one point for limitations in design and implementation for studies with selective reporting of outcomes and/or unclear risk of bias for allocation and blinding (Handen 2000; Quintana 1995; RUPP 2005). We downgraded one point for indirectness of evidence for the outcome of impaired social interaction, which included measures of aggressive and oppositional defiant behaviour.
We considered three trials to be at high risk of bias due to selective reporting. We assessed all trials as being at unclear risk of bias for blinding of participants and assessors, which was incomplete in all studies, due to the potential for recognising adverse events of methylphenidate. We assessed all trials at low or unclear risk of bias for all other items.
We have low confidence in the adverse events data, because parents of children with previous adverse events from methylphenidate were unlikely to accept invitations to participate in the studies, and participants at high risk of serious adverse events (such as those with cardiological or neurological conditions) were excluded from the studies. Intolerance of methylphenidate in the test‐dose phase also resulted in exclusion of participants from the randomised phase of the study or exclusion from the high‐dose condition. The absence of data about total daily dose administered and the short duration of treatment and follow‐up (one week only) also reduce the quality of this evidence. This short duration may result in an overestimation of the longer‐term risk of some adverse events, such as sleep disturbance, gastrointestinal effects, headaches and emotional lability, which might settle with a longer duration of treatment. On the other hand, the short duration may result in an underestimation of other adverse events that may appear over time such as tolerance, dependence, discontinuation reactions and diversion of doses. Overall, we believe that the very low quality of evidence for adverse events is likely to result in an underestimation of risk. However, it may be safe in the short term to use doses within the dose ranges studied if the child tolerates these, provided that the child has no cardiovascular or neurological conditions and clinicians closely monitor adverse events.
Potential biases in the review process
In order to minimise bias in the review process, two authors independently selected studies for inclusion, assessed risk of bias and extracted data. All authors conducted the analyses and interpreted the data. However, this review has some limitations.
We used a minimum intertreatment clinically important difference (MCID) of 0.52, based on Zhang 2005, who calculated the MCID based on ADHDRS‐PI scores and the Clinical Global Impressions ‐ ADHD ‐ Severity (CGI‐ADHD‐S), a single‐item, clinician rating of the severity of ADHD symptoms. Storebø 2015 also used the MCID of 0.52. Although ADHDRS‐PI scores in Zhang 2005 correlated well with a number of other ADHD scales, it correlated poorly with the Conners' rating scales and was not validated on children with ASD. Consequently, this may be either an underestimate or an overestimate of the true MCID in children with ASD.
It was challenging to locate the exact outcome scales and subscales used in our studies partly because access is restricted by intellectual property and commercial implications, and partly because, in some cases, there are multiple versions that have been edited and modified over time, including multiple versions of the Conners' scales (Sparrow 2010; Westerlund 2009). It was also challenging to identify clinically equivalent outcome scales and subscales, especially as factor analyses from different validation studies have not always produced consistent results. We made decisions about allocating various scales and subscales to our outcomes based on the best information we could access. We did not include James' 'social communication' measure, featured in the 2009 publication of RUPP 2005. This tool measures joint attention and spontaneous attention requests, as a measure of 'impaired social interaction', 'impaired communication' or 'overall ASD' outcomes, but it was unclear which outcomes, if any, this instrument measured. We decided which outcome scales to use in our meta‐analysis based on the most commonly used scales across our studies, and we performed and reported sensitivity analyses using the other scales.
Agreements and disagreements with other studies or reviews
We found a benefit from methylphenidate in children with ASD and ADHD‐like symptoms, which is in general agreement with the literature. We found no evidence of a worsening of ASD symptoms, which had been a theoretical concern in previous literature (Aman 1982). Adverse events also do not appear to be higher than those reported by Storebø 2015, which is reassuring in view of previous concerns in the literature between the 1970s and 1990s that children with ASD were likely to have more adverse events (including an increase in irritability, stereotyped behaviour, dysphoria, agitation and even psychotic symptoms) than children with ADHD. However, our findings on adverse events are tempered by study recruitment factors, test‐dose phase exclusion of participants who were intolerant of methylphenidate, and the short duration of treatment and follow‐up, as previously discussed. Our estimate of decreased appetite (RR 8.28) is actually higher than the RR of 3.66 reported by Storebø 2015. Our finding of no increased risk of sleep disturbance disagrees with the general recognition of sleep disturbance as a common adverse event of methylphenidate; this may be due to parent decisions in our studies to withhold the afternoon dose of methylphenidate for children who experienced this adverse event.
Our finding that teachers tended to report a greater benefit than parents is in agreement with previous studies in children with ADHD (Faries 2001; Hartman 2007), which have suggested that teachers are more sensitive to the beneficial effects of psychostimulants. This may be related to a 'wearing off' of morning methylphenidate by the time children return home from school; children's behaviour at home may also differ from their behaviour in more structured clinical or educational settings, and teachers have different relationships and contact hours with children compared to parents and may place greater emphasis on academic aspects. Some of the symptoms measured by commonly used scales (such as inattention and hyperactivity) may be more important to classroom functioning than functioning at home (whereas improvements in emotional lability and ability to cope with change may be more likely to be noticed by parents).
We do not have adequate data to comment on previous reports that more functionally impaired children have less benefit from methylphenidate (Aman 2003), or that initial benefit from methylphenidate may not be not sustained (Riddle 2013). We cannot comment on optimum doses or dose‐response relationships. As only one of our studies used one of the newer, extended‐release formulations of methylphenidate (Pearson 2013), we are unable to comment on how these compare to the previous immediate‐release formulations.

Study flow diagram.

Risk of bias graph: review authors' judgements about each risk of bias item presented as percentages across all included studies.
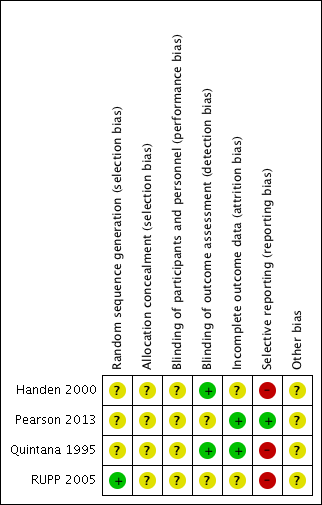
Risk of bias summary: review authors' judgements about each risk of bias item for each included study.

Comparison 1 TEACHER rated: high dose versus placebo, Outcome 1 Primary outcome: ADHD symptoms ‐ inattention (same measurement instrument).

Comparison 1 TEACHER rated: high dose versus placebo, Outcome 2 Primary outcome: ADHD symptoms ‐ hyperactivity (different measurement instrument).
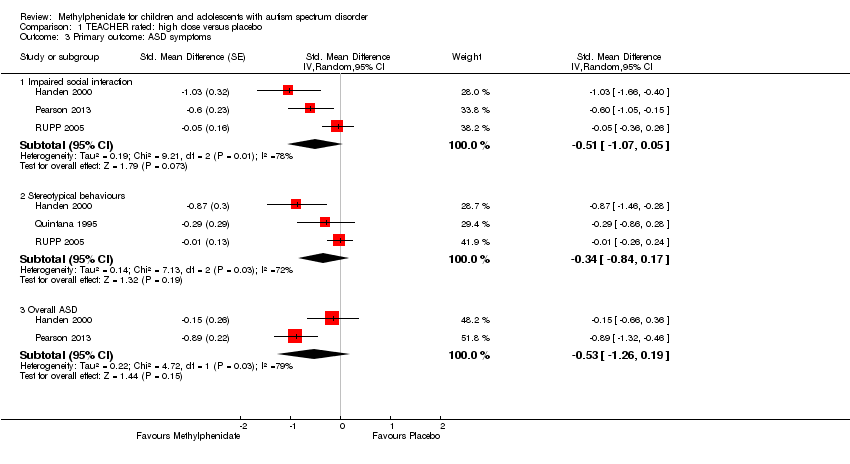
Comparison 1 TEACHER rated: high dose versus placebo, Outcome 3 Primary outcome: ASD symptoms.

Comparison 1 TEACHER rated: high dose versus placebo, Outcome 4 Secondary outcome: adverse events.

Comparison 2 TEACHER rated ‐ sensitivity: correlation 0, Outcome 1 Primary outcome: ADHD symptoms ‐ inattention (same measurement instrument).
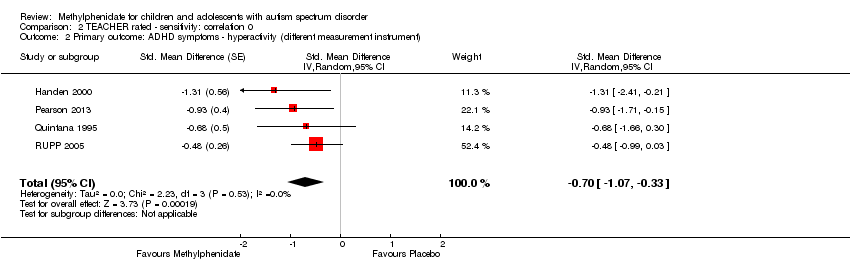
Comparison 2 TEACHER rated ‐ sensitivity: correlation 0, Outcome 2 Primary outcome: ADHD symptoms ‐ hyperactivity (different measurement instrument).

Comparison 2 TEACHER rated ‐ sensitivity: correlation 0, Outcome 3 Primary outcome: ASD symptoms.

Comparison 3 TEACHER rated ‐ sensitivity: correlation 0.8, Outcome 1 Primary outcome: ADHD symptoms ‐ inattention (same measurement instrument).

Comparison 3 TEACHER rated ‐ sensitivity: correlation 0.8, Outcome 2 Primary outcome: ADHD symptoms ‐ hyperactivity (different measurement instrument).

Comparison 3 TEACHER rated ‐ sensitivity: correlation 0.8, Outcome 3 Primary outcome: ASD symptoms.
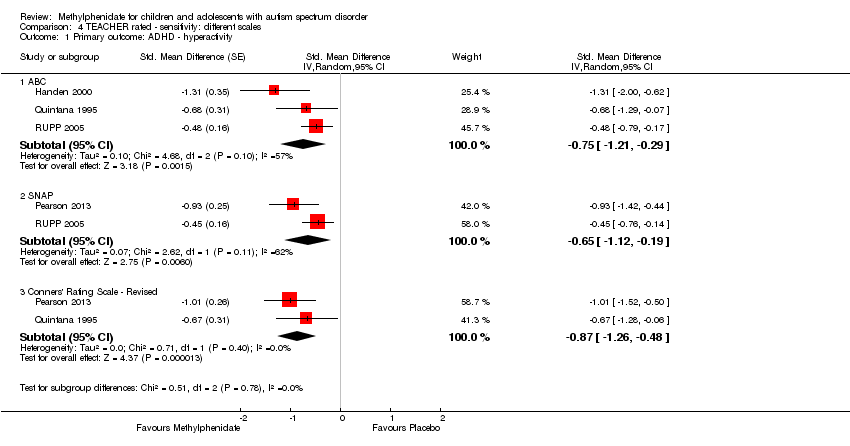
Comparison 4 TEACHER rated ‐ sensitivity: different scales, Outcome 1 Primary outcome: ADHD ‐ hyperactivity.

Comparison 5 PARENT rated: high dose versus placebo, Outcome 1 Primary outcome: ADHD symptoms (same measurement instrument).

Comparison 5 PARENT rated: high dose versus placebo, Outcome 2 Primary outcome: ASD symptoms ‐ impaired social interaction.
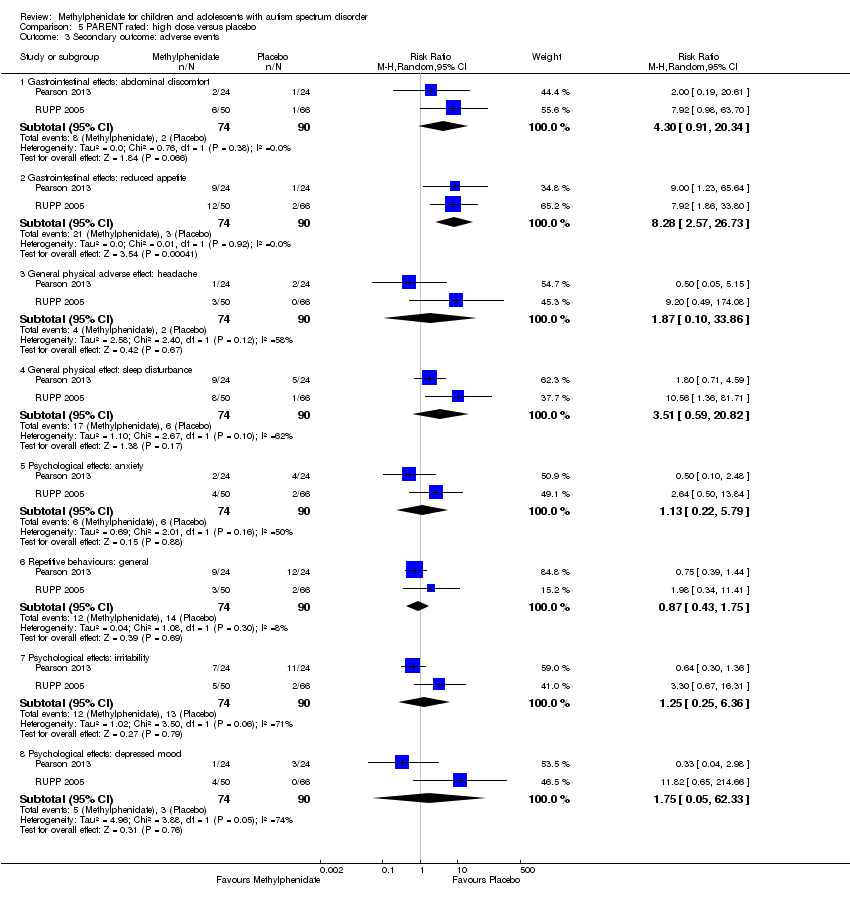
Comparison 5 PARENT rated: high dose versus placebo, Outcome 3 Secondary outcome: adverse events.
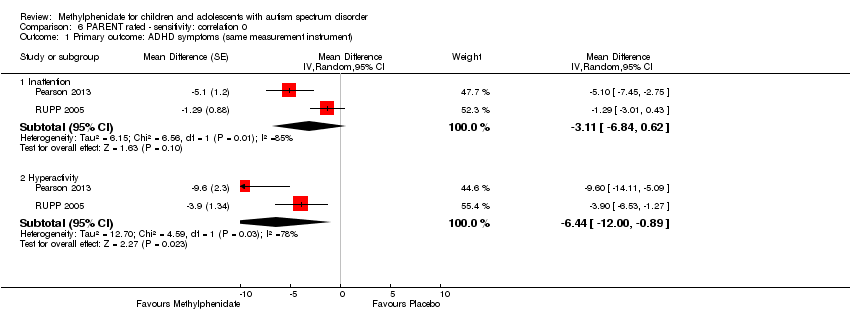
Comparison 6 PARENT rated ‐ sensitivity: correlation 0, Outcome 1 Primary outcome: ADHD symptoms (same measurement instrument).
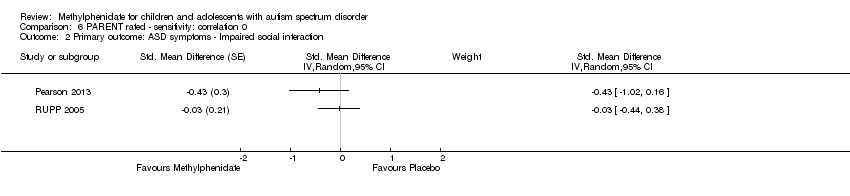
Comparison 6 PARENT rated ‐ sensitivity: correlation 0, Outcome 2 Primary outcome: ASD symptoms ‐ Impaired social interaction.
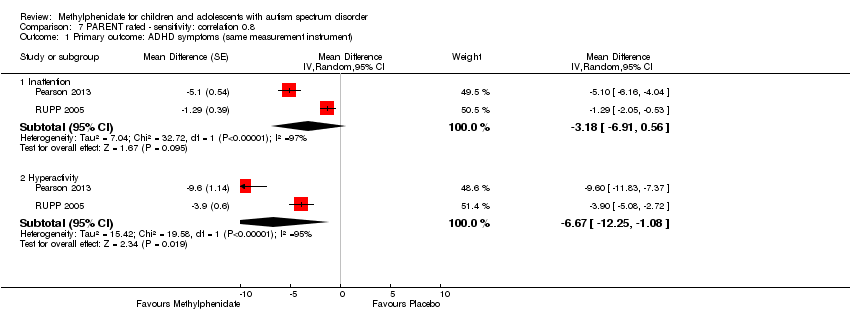
Comparison 7 PARENT rated ‐ sensitivity: correlation 0.8, Outcome 1 Primary outcome: ADHD symptoms (same measurement instrument).

Comparison 7 PARENT rated ‐ sensitivity: correlation 0.8, Outcome 2 Primary outcome: ASD symptoms ‐ Impaired social interaction.
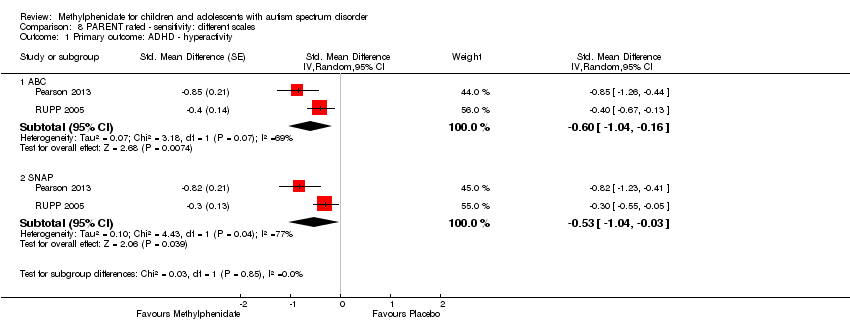
Comparison 8 PARENT rated ‐ sensitivity: different scales, Outcome 1 Primary outcome: ADHD ‐ hyperactivity.

Comparison 9 TEACHER rated ‐ subgroup: doses, Outcome 1 Primary outcome: ADHD ‐ inattention.

Comparison 9 TEACHER rated ‐ subgroup: doses, Outcome 2 Primary outcome: ADHD ‐ hyperactivity.

Comparison 9 TEACHER rated ‐ subgroup: doses, Outcome 3 Primary outcome: ASD ‐ impaired social interaction.

Comparison 9 TEACHER rated ‐ subgroup: doses, Outcome 4 Primary outcome: ASD ‐ stereotypical behaviours.
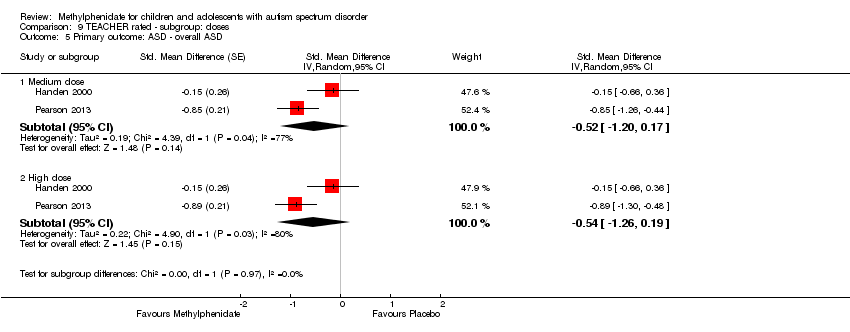
Comparison 9 TEACHER rated ‐ subgroup: doses, Outcome 5 Primary outcome: ASD ‐ overall ASD.
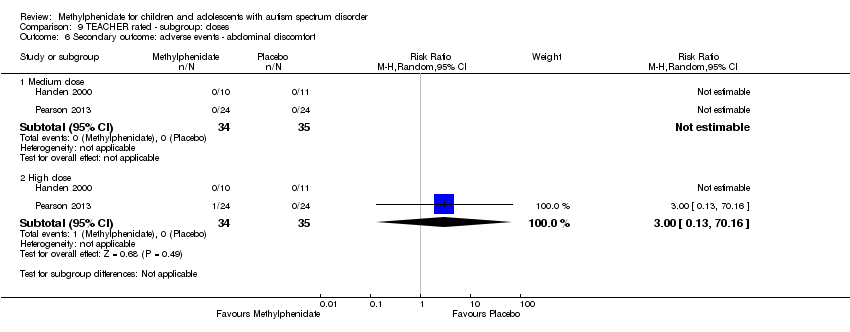
Comparison 9 TEACHER rated ‐ subgroup: doses, Outcome 6 Secondary outcome: adverse events ‐ abdominal discomfort.

Comparison 9 TEACHER rated ‐ subgroup: doses, Outcome 7 Secondary outcome: adverse events ‐ reduced appetite.
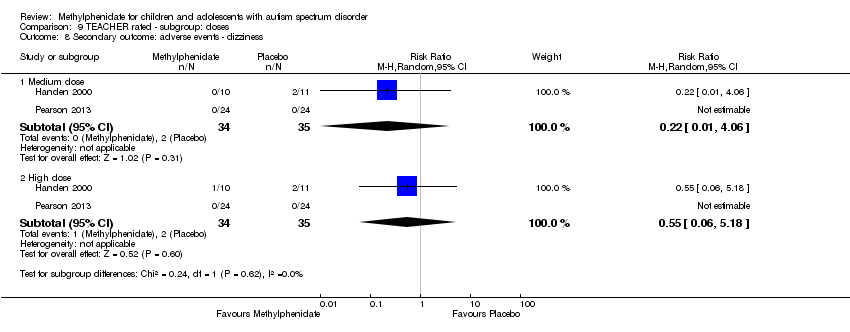
Comparison 9 TEACHER rated ‐ subgroup: doses, Outcome 8 Secondary outcome: adverse events ‐ dizziness.
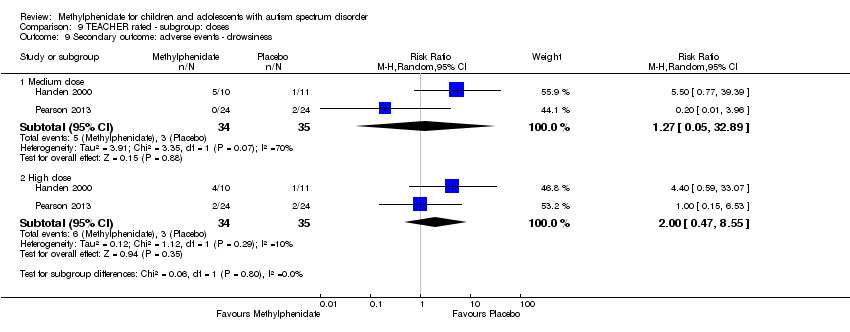
Comparison 9 TEACHER rated ‐ subgroup: doses, Outcome 9 Secondary outcome: adverse events ‐ drowsiness.

Comparison 9 TEACHER rated ‐ subgroup: doses, Outcome 10 Secondary outcome: adverse events ‐ headache.
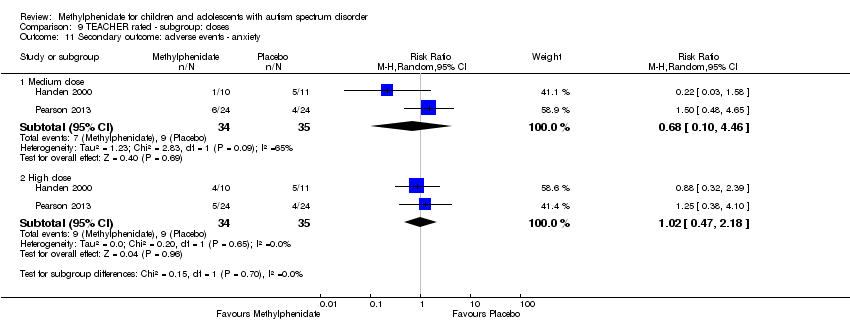
Comparison 9 TEACHER rated ‐ subgroup: doses, Outcome 11 Secondary outcome: adverse events ‐ anxiety.

Comparison 9 TEACHER rated ‐ subgroup: doses, Outcome 12 Secondary outcome: adverse events ‐ depressed mood.
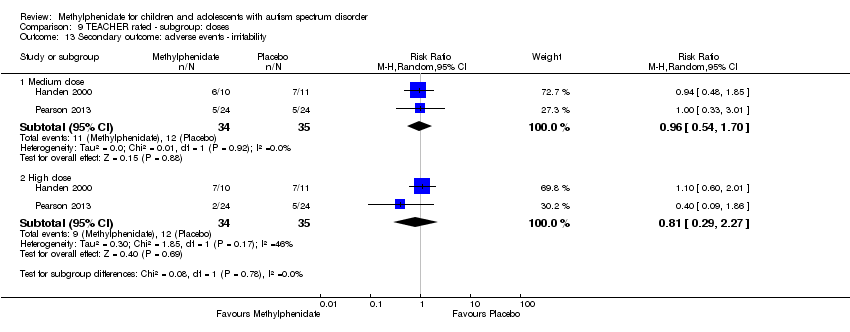
Comparison 9 TEACHER rated ‐ subgroup: doses, Outcome 13 Secondary outcome: adverse events ‐ irritability.
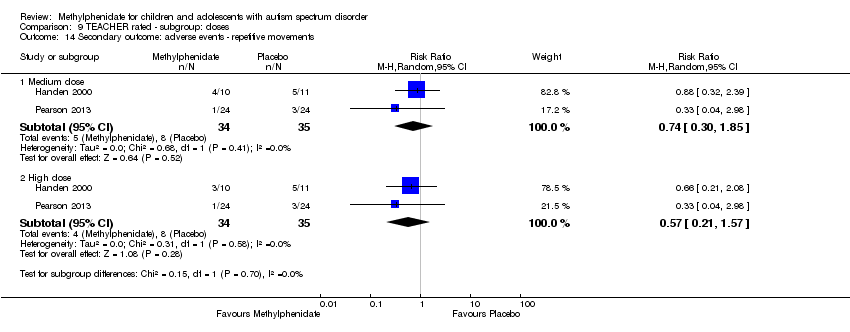
Comparison 9 TEACHER rated ‐ subgroup: doses, Outcome 14 Secondary outcome: adverse events ‐ repetitive movements.
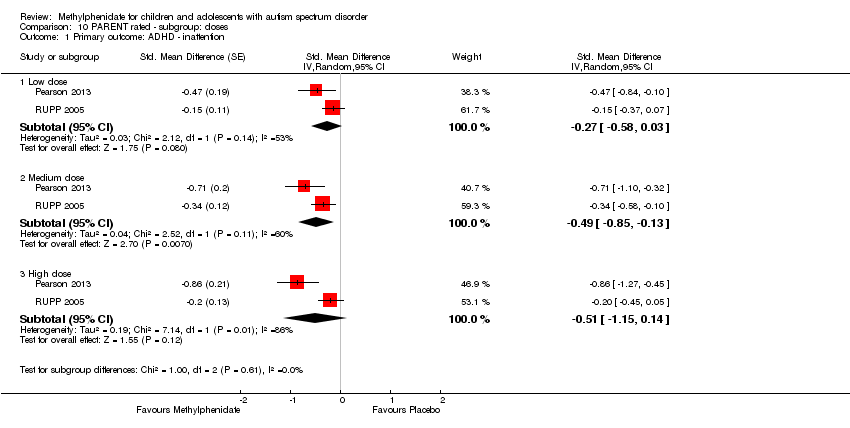
Comparison 10 PARENT rated ‐ subgroup: doses, Outcome 1 Primary outcome: ADHD ‐ inattention.
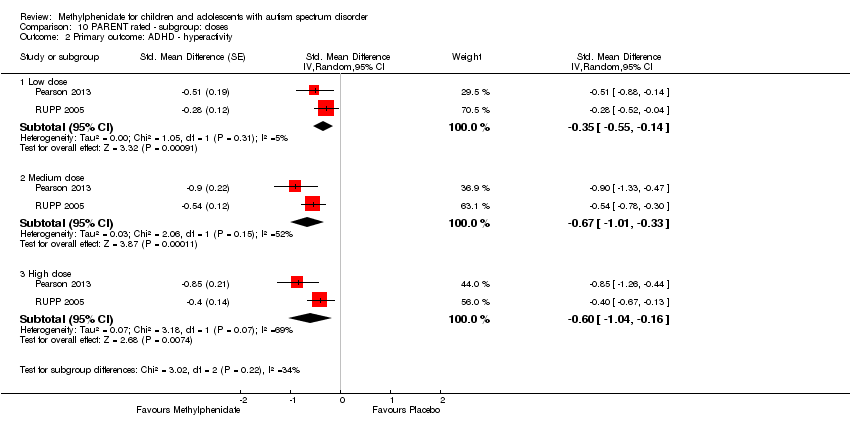
Comparison 10 PARENT rated ‐ subgroup: doses, Outcome 2 Primary outcome: ADHD ‐ hyperactivity.

Comparison 10 PARENT rated ‐ subgroup: doses, Outcome 3 Primary outcome: ASD ‐ impaired social interaction.
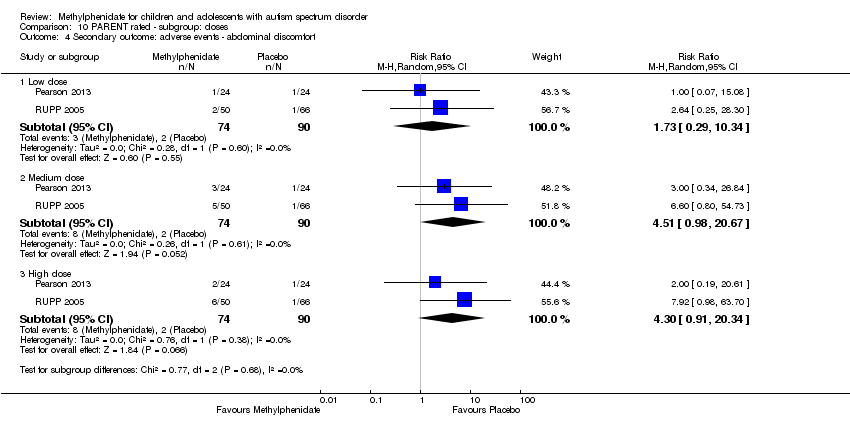
Comparison 10 PARENT rated ‐ subgroup: doses, Outcome 4 Secondary outcome: adverse events ‐ abdominal discomfort.

Comparison 10 PARENT rated ‐ subgroup: doses, Outcome 5 Secondary outcome: adverse events ‐ reduced appetite.
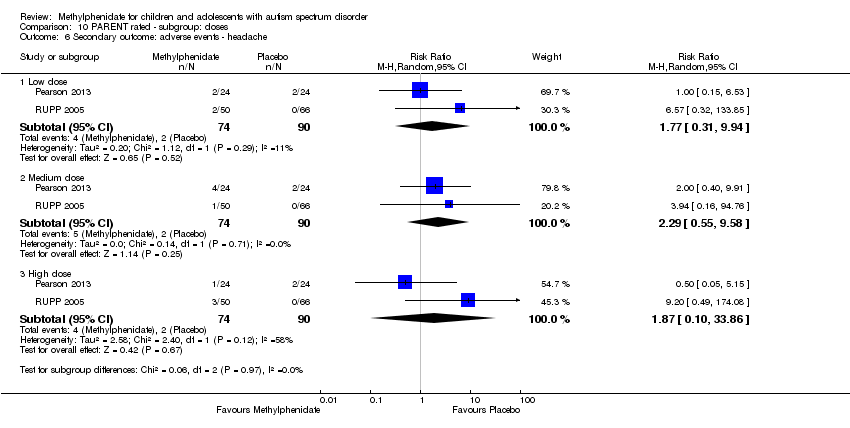
Comparison 10 PARENT rated ‐ subgroup: doses, Outcome 6 Secondary outcome: adverse events ‐ headache.

Comparison 10 PARENT rated ‐ subgroup: doses, Outcome 7 Secondary outcome: adverse events ‐ anxiety.

Comparison 10 PARENT rated ‐ subgroup: doses, Outcome 8 Secondary outcome: adverse events ‐ depressed mood.

Comparison 10 PARENT rated ‐ subgroup: doses, Outcome 9 Secondary outcome: adverse events ‐ irritability.
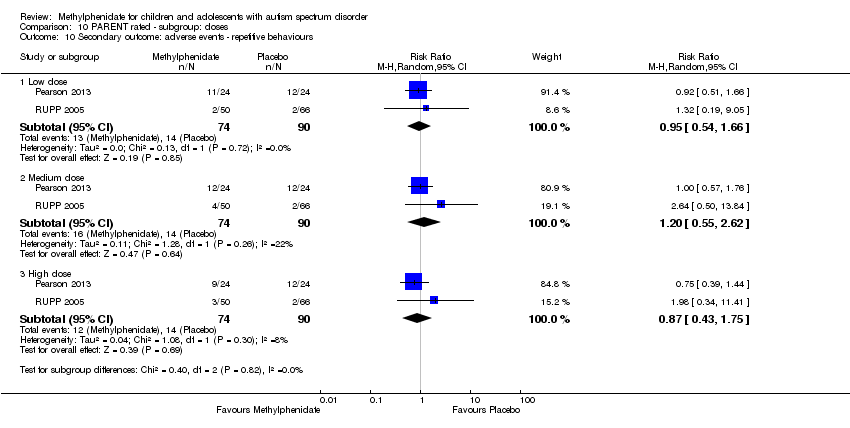
Comparison 10 PARENT rated ‐ subgroup: doses, Outcome 10 Secondary outcome: adverse events ‐ repetitive behaviours.

Comparison 10 PARENT rated ‐ subgroup: doses, Outcome 11 Secondary outcome: adverse events ‐ sleep disturbance.
| High‐dose methylphenidate versus placebo for symptoms of ADHD and ASD as rated by teachers | ||||||
| Patient or population: children aged 6 to 18 years with ASD | ||||||
| Outcomes | Anticipated absolute effects* (95% CI) | Relative effect | № of participants | Quality of the evidence | Comments | |
| Risk with placebo | Risk with high‐dose methylphenidate | |||||
| Primary outcome: ADHD‐like symptoms | ||||||
| Inattention Measured using SNAP‐IV inattention subscale (range 0 to 27) | — | The mean inattention score in the intervention group was 2.72 units lower (5.37 lower to 0.06 lower) | — | 51 teachers | ⊕⊕⊝⊝ | — |
| Hyperactivity | — | The mean hyperactivity score in the intervention group was 0.78 standard units lower (1.13 lower to 0.43 lower) | — | 73 teachers | ⊕⊕⊝⊝ | — |
| Impulsivity | See comment | — | 36 teachers (1 RCT) | — | Insufficient data to pool results | |
| Primary outcome: core symptoms of ASD | ||||||
| Impaired social interaction | — | The mean impaired social interaction score in the intervention group was 0.51 standard units lower (1.07 lower to 0.05 higher) | — | 63 teachers | ⊕⊝⊝⊝ | — |
| Impaired communication | See comment | — | 24 teachers (1 RCT) | — | Insufficient data to pool results | |
| Stereotypical behaviours | — | The mean stereotypical behaviours score in the intervention group was 0.34 standard units lower (0.84 lower to 0.17 higher) | — | 69 teachers | ⊕⊕⊝⊝ | — |
| Overall ASD | — | The mean overall ASD score in the intervention group was 0.53 standard units lower (1.26 lower to 0.19 higher) | — | 36 teachers (2 RCTs) | ⊕⊕⊝⊝ | — |
| Secondary outcome: rate of adverse effects | ||||||
| Total number of adverse events | See comment | — | 79 teachers (1 RCT) | — | Insufficient data to pool resultsd | |
| *The risk in the intervention group (and its 95% CI) is based on the assumed risk in the comparison group and the relative effect of the intervention (and its 95% CI). | ||||||
| GRADE Working Group grades of evidence | ||||||
| aDowngraded one point for limitations in design and implementation. | ||||||
| High‐dose methylphenidate versus placebo for symptoms of ADHD and ASD as rated by parents | ||||||
| Patient or population: Children aged 6 to 18 years with ASD | ||||||
| Outcomes | Anticipated absolute effects* (95% CI) | Relative effect | № of participants | Quality of the evidence | Comments | |
| Risk with placebo | Risk with high‐dose methylphenidate | |||||
| Primary outcome: ADHD‐like symptoms | ||||||
| Inattention Measured using SNAP‐IV inattention subscale (range 0 to 27) | — | The mean inattention score in the intervention group was 3.16 units lower (6.89 lower to 0.57 higher) | — | 71 parents | ⊕⊕⊝⊝ | — |
| Impulsivity | See comment | — | 48 parents (1 RCT) | — | Insufficient data to pool results | |
| Hyperactivity Measured using ABC hyperactivity subscale (range 0 to 48) | — | The hyperactivity score in the intervention group was 6.61 units lower (12.19 lower to 1.03 lower) | — | 71 parents | ⊕⊕⊝⊝ | — |
| Primary outcome: core symptoms of ASD | ||||||
| Impaired social interaction | — | The impaired social interaction score in the intervention group was 0.21 standard units lower (0.60 lower to 0.18 higher) | — | 71 parents | ⊕⊝⊝⊝ | — |
| Impaired communication | See comment | — | 48 parents (1 RCT) | — | Insufficient data to pool results | |
| Stereotypical behaviours | See comment | — | 48 parents (1 RCT) | — | Insufficient data to pool results | |
| Overall ASD | See comment | — | 48 parents (1 RCT) | — | Insufficient data to pool results | |
| Secondary outcome: rate of adverse events | ||||||
| Total number of adverse events | See comment | — | 108 parents (1 RCT) | — | Insufficient data to pool resultsd | |
| *The risk in the intervention group (and its 95% CI) is based on the assumed risk in the comparison group and the relative effect of the intervention (and its 95% CI). | ||||||
| GRADE Working Group grades of evidence | ||||||
| a Downgraded one point for limitations in design and implementation. | ||||||
| Instrument | Inattention | Impulsivity | Hyperactivity | |||
| Teachera | Parent | Teachera | Parent | Teachera | Parent | |
| ABC | — | — | — | — | H , Q, R | P , R |
| ACTeRS | P | P | — | — | P | P |
| Conners' Global Index | — | — | P | P | P | P |
| CPRS‐R and CTRS‐R | P | P | — | — | P, Q | P |
| Conners' Abbreviated Parent/Teacher Questionnaire | — | — | — | — | — | — |
| SNAP‐IV | P , R | P , R | — | — | P , R | P, R |
| a'Teacher' includes clinician and trained observer raters. Letters (H, P, Q, R) indicate those studies that used a particular instrument to rate the particular outcome. Letters in bold and underlined font indicate the instrument we used in our meta‐analysis: H: Handen 2000; P: Pearson 2013; Q: Quintana 1995; R: RUPP 2005. ABC: Aberrant Behavior Checklist; ACTeRS: ADD‐H (Attention deficit disorder ‐ hyperactivity) Comprehensive Teacher Rating Scale; ADHD: attention deficit hyperactivity disorder; CPRS‐R: Conners' Parent Rating Scale ‐ Revised; CTRS‐R: Conners' Teacher Rating Scale ‐ Revised;SNAP‐IV: Swanson, Nolan, and Pelham Questionnaire, Fourth Edition. | ||||||
| Instrument | Impaired social interaction | Impaired communication | Stereotypical behaviours | Overall ASD | ||||
| Teacher a | Parent | Teacher a | Parent | Teacher a | Parent | Teacher a | Parent | |
| ABC | H | P | H | P | H , Q | P | — | — |
| ACTeRS | P | P | — | — | — | — | — | — |
| CARS | — | — | — | — | — | — | H | — |
| CYBOCS | — | — | — | — | R | — | — | — |
| CPRS‐R and CTRS‐R | P | P | — | — | — | — | — | — |
| Iowa CTRS | H | — | — | — | — | — | — | — |
| Social communication questionnaire | — | — | — | — | — | — | — | P |
| SNAP‐IV | R | R | — | — | — | — | — | — |
| Clinician Global Impression ‐ Severity | — | — | — | — | — | — | P | — |
| a'Teacher' includes clinician and trained observer raters; Letters (H, P, Q, R) indicate the studies which used a particular instrument to rate the particular outcome. Letters in bolded and underlined font indicate the instrument we used in our meta‐analysis: H: Handen 2000; P: Pearson 2013; Q: Quintana 1995; R: RUPP 2005; ABC: Aberrant Behavior Checklist; ACTeRS: ADD‐H (Attention deficit disorder ‐ hyperactivity) Comprehensive Teacher Rating Scale; ASD: autism spectrum disorders; CARS: Child Autism Rating Scale; CPRS‐R: Conners' Parent Rating Scale ‐ Revised; CTRS‐R: Conners' Teacher Rating Scale ‐ Revised; CYBOCS: Children's Yale‐Brown Obsessive Compulsive Scales;Iowa CTRS: Iowa Conners' Teacher Rating Scale; SNAP‐IV: Swanson, Nolan, and Pelham Questionnaire, 4th Edition. | ||||||||
| Outcome or subgroup title | No. of studies | No. of participants | Statistical method | Effect size |
| 1 Primary outcome: ADHD symptoms ‐ inattention (same measurement instrument) Show forest plot | 2 | Mean Difference (Random, 95% CI) | ‐2.72 [‐5.37, ‐0.06] | |
| 2 Primary outcome: ADHD symptoms ‐ hyperactivity (different measurement instrument) Show forest plot | 4 | Std. Mean Difference (Random, 95% CI) | ‐0.78 [‐1.13, ‐0.43] | |
| 3 Primary outcome: ASD symptoms Show forest plot | 4 | Std. Mean Difference (Random, 95% CI) | Subtotals only | |
| 3.1 Impaired social interaction | 3 | Std. Mean Difference (Random, 95% CI) | ‐0.51 [‐1.07, 0.05] | |
| 3.2 Stereotypical behaviours | 3 | Std. Mean Difference (Random, 95% CI) | ‐0.34 [‐0.84, 0.17] | |
| 3.3 Overall ASD | 2 | Std. Mean Difference (Random, 95% CI) | ‐0.53 [‐1.26, 0.19] | |
| 4 Secondary outcome: adverse events Show forest plot | 2 | Risk Ratio (M‐H, Random, 95% CI) | Subtotals only | |
| 4.1 Gastrointestinal effects: abdominal discomfort | 2 | 69 | Risk Ratio (M‐H, Random, 95% CI) | 3.00 [0.13, 70.16] |
| 4.2 Gastrointestinal effects: reduced appetite | 2 | 69 | Risk Ratio (M‐H, Random, 95% CI) | 1.33 [0.43, 4.12] |
| 4.3 General physical adverse effect: dizziness | 2 | 69 | Risk Ratio (M‐H, Random, 95% CI) | 0.55 [0.06, 5.18] |
| 4.4 General physical adverse effect: drowsiness | 2 | 69 | Risk Ratio (M‐H, Random, 95% CI) | 2.00 [0.47, 8.55] |
| 4.5 General physical adverse effect: headache | 2 | 69 | Risk Ratio (M‐H, Random, 95% CI) | 3.00 [0.13, 70.16] |
| 4.6 Psychological effects: anxiety | 2 | 69 | Risk Ratio (M‐H, Random, 95% CI) | 1.02 [0.47, 2.18] |
| 4.7 Psychological effects: depressed mood | 2 | 69 | Risk Ratio (M‐H, Random, 95% CI) | 1.19 [0.37, 3.79] |
| 4.8 Psychological effects: irritability | 2 | 69 | Risk Ratio (M‐H, Random, 95% CI) | 0.81 [0.29, 2.27] |
| 4.9 Repetitive behaviours: repetitive movements or tics | 2 | 69 | Risk Ratio (M‐H, Random, 95% CI) | 0.57 [0.21, 1.57] |
| Outcome or subgroup title | No. of studies | No. of participants | Statistical method | Effect size |
| 1 Primary outcome: ADHD symptoms ‐ inattention (same measurement instrument) Show forest plot | 2 | Mean Difference (Random, 95% CI) | ‐2.55 [‐5.15, 0.06] | |
| 2 Primary outcome: ADHD symptoms ‐ hyperactivity (different measurement instrument) Show forest plot | 4 | Std. Mean Difference (Random, 95% CI) | ‐0.70 [‐1.07, ‐0.33] | |
| 3 Primary outcome: ASD symptoms Show forest plot | 4 | Std. Mean Difference (Random, 95% CI) | Subtotals only | |
| 3.1 Impaired social interaction | 3 | Std. Mean Difference (Random, 95% CI) | ‐0.44 [‐0.99, 0.11] | |
| 3.2 Stereotypical behaviours | 3 | Std. Mean Difference (Random, 95% CI) | ‐0.24 [‐0.71, 0.23] | |
| 3.3 Overall ASD | 2 | Std. Mean Difference (Random, 95% CI) | ‐0.56 [‐1.28, 0.17] | |
| Outcome or subgroup title | No. of studies | No. of participants | Statistical method | Effect size |
| 1 Primary outcome: ADHD symptoms ‐ inattention (same measurement instrument) Show forest plot | 2 | Mean Difference (Random, 95% CI) | Subtotals only | |
| 2 Primary outcome: ADHD symptoms ‐ hyperactivity (different measurement instrument) Show forest plot | 4 | Std. Mean Difference (Random, 95% CI) | Subtotals only | |
| 3 Primary outcome: ASD symptoms Show forest plot | 4 | Std. Mean Difference (Random, 95% CI) | Subtotals only | |
| 3.1 Impaired social interaction | 3 | Std. Mean Difference (Random, 95% CI) | ‐0.53 [‐1.09, 0.02] | |
| 3.2 Stereotypical behaviours | 3 | Std. Mean Difference (Random, 95% CI) | ‐0.37 [‐0.87, 0.14] | |
| 3.3 Overall ASD | 2 | Std. Mean Difference (Random, 95% CI) | ‐0.53 [‐1.25, 0.20] | |
| Outcome or subgroup title | No. of studies | No. of participants | Statistical method | Effect size |
| 1 Primary outcome: ADHD ‐ hyperactivity Show forest plot | 4 | Std. Mean Difference (Random, 95% CI) | Subtotals only | |
| 1.1 ABC | 3 | Std. Mean Difference (Random, 95% CI) | ‐0.75 [‐1.21, ‐0.29] | |
| 1.2 SNAP | 2 | Std. Mean Difference (Random, 95% CI) | ‐0.65 [‐1.12, ‐0.19] | |
| 1.3 Conners' Rating Scale ‐ Revised | 2 | Std. Mean Difference (Random, 95% CI) | ‐0.87 [‐1.26, ‐0.48] | |
| Outcome or subgroup title | No. of studies | No. of participants | Statistical method | Effect size |
| 1 Primary outcome: ADHD symptoms (same measurement instrument) Show forest plot | 2 | Mean Difference (Random, 95% CI) | Subtotals only | |
| 1.1 Inattention | 2 | Mean Difference (Random, 95% CI) | ‐3.16 [‐6.89, 0.57] | |
| 1.2 Hyperactivity | 2 | Mean Difference (Random, 95% CI) | ‐6.61 [‐12.19, ‐1.03] | |
| 2 Primary outcome: ASD symptoms ‐ impaired social interaction Show forest plot | 2 | Std. Mean Difference (Random, 95% CI) | ‐0.21 [‐0.60, 0.18] | |
| 3 Secondary outcome: adverse events Show forest plot | 2 | Risk Ratio (M‐H, Random, 95% CI) | Subtotals only | |
| 3.1 Gastrointestinal effects: abdominal discomfort | 2 | 164 | Risk Ratio (M‐H, Random, 95% CI) | 4.30 [0.91, 20.34] |
| 3.2 Gastrointestinal effects: reduced appetite | 2 | 164 | Risk Ratio (M‐H, Random, 95% CI) | 8.28 [2.57, 26.73] |
| 3.3 General physical adverse effect: headache | 2 | 164 | Risk Ratio (M‐H, Random, 95% CI) | 1.87 [0.10, 33.86] |
| 3.4 General physical effect: sleep disturbance | 2 | 164 | Risk Ratio (M‐H, Random, 95% CI) | 3.51 [0.59, 20.82] |
| 3.5 Psychological effects: anxiety | 2 | 164 | Risk Ratio (M‐H, Random, 95% CI) | 1.13 [0.22, 5.79] |
| 3.6 Repetitive behaviours: general | 2 | 164 | Risk Ratio (M‐H, Random, 95% CI) | 0.87 [0.43, 1.75] |
| 3.7 Psychological effects: irritability | 2 | 164 | Risk Ratio (M‐H, Random, 95% CI) | 1.25 [0.25, 6.36] |
| 3.8 Psychological effects: depressed mood | 2 | 164 | Risk Ratio (M‐H, Random, 95% CI) | 1.75 [0.05, 62.33] |
| Outcome or subgroup title | No. of studies | No. of participants | Statistical method | Effect size |
| 1 Primary outcome: ADHD symptoms (same measurement instrument) Show forest plot | 2 | Mean Difference (Random, 95% CI) | Subtotals only | |
| 1.1 Inattention | 2 | Mean Difference (Random, 95% CI) | ‐3.11 [‐6.84, 0.62] | |
| 1.2 Hyperactivity | 2 | Mean Difference (Random, 95% CI) | ‐6.44 [‐10.00, ‐0.89] | |
| 2 Primary outcome: ASD symptoms ‐ Impaired social interaction Show forest plot | 2 | Std. Mean Difference (Random, 95% CI) | Subtotals only | |
| Outcome or subgroup title | No. of studies | No. of participants | Statistical method | Effect size |
| 1 Primary outcome: ADHD symptoms (same measurement instrument) Show forest plot | 2 | Mean Difference (Random, 95% CI) | Subtotals only | |
| 1.1 Inattention | 2 | Mean Difference (Random, 95% CI) | ‐3.18 [‐6.91, 0.56] | |
| 1.2 Hyperactivity | 2 | Mean Difference (Random, 95% CI) | ‐6.67 [‐12.25, ‐1.08] | |
| 2 Primary outcome: ASD symptoms ‐ Impaired social interaction Show forest plot | 2 | Std. Mean Difference (Random, 95% CI) | Subtotals only | |
| Outcome or subgroup title | No. of studies | No. of participants | Statistical method | Effect size |
| 1 Primary outcome: ADHD ‐ hyperactivity Show forest plot | 2 | Std. Mean Difference (Random, 95% CI) | Subtotals only | |
| 1.1 ABC | 2 | Std. Mean Difference (Random, 95% CI) | ‐0.60 [‐1.04, ‐0.16] | |
| 1.2 SNAP | 2 | Std. Mean Difference (Random, 95% CI) | ‐0.53 [‐1.04, ‐0.03] | |
| Outcome or subgroup title | No. of studies | No. of participants | Statistical method | Effect size |
| 1 Primary outcome: ADHD ‐ inattention Show forest plot | 2 | Std. Mean Difference (Random, 95% CI) | Subtotals only | |
| 1.1 Low dose | 2 | Std. Mean Difference (Random, 95% CI) | ‐0.28 [‐0.61, 0.05] | |
| 1.2 Medium dose | 2 | Std. Mean Difference (Random, 95% CI) | ‐0.46 [‐0.89, ‐0.04] | |
| 1.3 High dose | 2 | Std. Mean Difference (Random, 95% CI) | ‐0.38 [‐0.75, ‐0.02] | |
| 2 Primary outcome: ADHD ‐ hyperactivity Show forest plot | 4 | Std. Mean Difference (Random, 95% CI) | Subtotals only | |
| 2.1 Low dose | 2 | Std. Mean Difference (Random, 95% CI) | ‐0.40 [‐0.77, ‐0.03] | |
| 2.2 Medium dose | 3 | Std. Mean Difference (Random, 95% CI) | ‐0.55 [‐1.00, ‐0.10] | |
| 2.3 High dose | 4 | Std. Mean Difference (Random, 95% CI) | ‐0.78 [‐1.13, ‐0.43] | |
| 3 Primary outcome: ASD ‐ impaired social interaction Show forest plot | 3 | Std. Mean Difference (Random, 95% CI) | Subtotals only | |
| 3.1 Low dose | 2 | Std. Mean Difference (Random, 95% CI) | ‐0.30 [‐0.59, ‐0.02] | |
| 3.2 Medium dose | 3 | Std. Mean Difference (Random, 95% CI) | ‐0.44 [‐0.94, 0.06] | |
| 3.3 High dose | 3 | Std. Mean Difference (Random, 95% CI) | ‐0.51 [‐1.07, 0.05] | |
| 4 Primary outcome: ASD ‐ stereotypical behaviours Show forest plot | 3 | Std. Mean Difference (Random, 95% CI) | Subtotals only | |
| 4.1 Medium dose | 2 | Std. Mean Difference (Random, 95% CI) | ‐0.23 [‐0.43, ‐0.03] | |
| 4.2 High dose | 3 | Std. Mean Difference (Random, 95% CI) | ‐0.34 [‐0.84, 0.17] | |
| 5 Primary outcome: ASD ‐ overall ASD Show forest plot | 2 | Std. Mean Difference (Random, 95% CI) | Subtotals only | |
| 5.1 Medium dose | 2 | Std. Mean Difference (Random, 95% CI) | ‐0.52 [‐1.20, 0.17] | |
| 5.2 High dose | 2 | Std. Mean Difference (Random, 95% CI) | ‐0.54 [‐1.26, 0.19] | |
| 6 Secondary outcome: adverse events ‐ abdominal discomfort Show forest plot | 2 | Risk Ratio (M‐H, Random, 95% CI) | Subtotals only | |
| 6.1 Medium dose | 2 | 69 | Risk Ratio (M‐H, Random, 95% CI) | 0.0 [0.0, 0.0] |
| 6.2 High dose | 2 | 69 | Risk Ratio (M‐H, Random, 95% CI) | 3.00 [0.13, 70.16] |
| 7 Secondary outcome: adverse events ‐ reduced appetite Show forest plot | 2 | Risk Ratio (M‐H, Random, 95% CI) | Subtotals only | |
| 7.1 Medium dose | 2 | 69 | Risk Ratio (M‐H, Random, 95% CI) | 1.29 [0.75, 2.20] |
| 7.2 High dose | 2 | 69 | Risk Ratio (M‐H, Random, 95% CI) | 1.33 [0.43, 4.12] |
| 8 Secondary outcome: adverse events ‐ dizziness Show forest plot | 2 | Risk Ratio (M‐H, Random, 95% CI) | Subtotals only | |
| 8.1 Medium dose | 2 | 69 | Risk Ratio (M‐H, Random, 95% CI) | 0.22 [0.01, 4.06] |
| 8.2 High dose | 2 | 69 | Risk Ratio (M‐H, Random, 95% CI) | 0.55 [0.06, 5.18] |
| 9 Secondary outcome: adverse events ‐ drowsiness Show forest plot | 2 | Risk Ratio (M‐H, Random, 95% CI) | Subtotals only | |
| 9.1 Medium dose | 2 | 69 | Risk Ratio (M‐H, Random, 95% CI) | 1.27 [0.05, 32.89] |
| 9.2 High dose | 2 | 69 | Risk Ratio (M‐H, Random, 95% CI) | 2.00 [0.47, 8.55] |
| 10 Secondary outcome: adverse events ‐ headache Show forest plot | 2 | Risk Ratio (M‐H, Random, 95% CI) | Subtotals only | |
| 10.1 Medium dose | 2 | 69 | Risk Ratio (M‐H, Random, 95% CI) | 0.0 [0.0, 0.0] |
| 10.2 High dose | 2 | 69 | Risk Ratio (M‐H, Random, 95% CI) | 3.00 [0.13, 70.16] |
| 11 Secondary outcome: adverse events ‐ anxiety Show forest plot | 2 | Risk Ratio (M‐H, Random, 95% CI) | Subtotals only | |
| 11.1 Medium dose | 2 | 69 | Risk Ratio (M‐H, Random, 95% CI) | 0.68 [0.10, 4.46] |
| 11.2 High dose | 2 | 69 | Risk Ratio (M‐H, Random, 95% CI) | 1.02 [0.47, 2.18] |
| 12 Secondary outcome: adverse events ‐ depressed mood Show forest plot | 2 | Risk Ratio (M‐H, Random, 95% CI) | Subtotals only | |
| 12.1 Medium dose | 2 | 69 | Risk Ratio (M‐H, Random, 95% CI) | 1.01 [0.46, 2.26] |
| 12.2 High dose | 2 | 69 | Risk Ratio (M‐H, Random, 95% CI) | 1.19 [0.37, 3.79] |
| 13 Secondary outcome: adverse events ‐ irritability Show forest plot | 2 | Risk Ratio (M‐H, Random, 95% CI) | Subtotals only | |
| 13.1 Medium dose | 2 | 69 | Risk Ratio (M‐H, Random, 95% CI) | 0.96 [0.54, 1.70] |
| 13.2 High dose | 2 | 69 | Risk Ratio (M‐H, Random, 95% CI) | 0.81 [0.29, 2.27] |
| 14 Secondary outcome: adverse events ‐ repetitive movements Show forest plot | 2 | Risk Ratio (M‐H, Random, 95% CI) | Subtotals only | |
| 14.1 Medium dose | 2 | 69 | Risk Ratio (M‐H, Random, 95% CI) | 0.74 [0.30, 1.85] |
| 14.2 High dose | 2 | 69 | Risk Ratio (M‐H, Random, 95% CI) | 0.57 [0.21, 1.57] |
| Outcome or subgroup title | No. of studies | No. of participants | Statistical method | Effect size |
| 1 Primary outcome: ADHD ‐ inattention Show forest plot | 2 | Std. Mean Difference (Random, 95% CI) | Subtotals only | |
| 1.1 Low dose | 2 | Std. Mean Difference (Random, 95% CI) | ‐0.27 [‐0.58, 0.03] | |
| 1.2 Medium dose | 2 | Std. Mean Difference (Random, 95% CI) | ‐0.49 [‐0.85, ‐0.13] | |
| 1.3 High dose | 2 | Std. Mean Difference (Random, 95% CI) | ‐0.51 [‐1.15, 0.14] | |
| 2 Primary outcome: ADHD ‐ hyperactivity Show forest plot | 2 | Std. Mean Difference (Random, 95% CI) | Subtotals only | |
| 2.1 Low dose | 2 | Std. Mean Difference (Random, 95% CI) | ‐0.35 [‐0.55, ‐0.14] | |
| 2.2 Medium dose | 2 | Std. Mean Difference (Random, 95% CI) | ‐0.67 [‐1.01, ‐0.33] | |
| 2.3 High dose | 2 | Std. Mean Difference (Random, 95% CI) | ‐0.60 [‐1.04, ‐0.16] | |
| 3 Primary outcome: ASD ‐ impaired social interaction Show forest plot | 2 | Std. Mean Difference (Random, 95% CI) | Subtotals only | |
| 3.1 Low dose | 2 | Std. Mean Difference (Random, 95% CI) | ‐0.15 [‐0.33, 0.04] | |
| 3.2 Medium dose | 2 | Std. Mean Difference (Random, 95% CI) | ‐0.17 [‐0.37, 0.03] | |
| 3.3 High dose | 2 | Std. Mean Difference (Random, 95% CI) | ‐0.21 [‐0.60, 0.18] | |
| 4 Secondary outcome: adverse events ‐ abdominal discomfort Show forest plot | 2 | Risk Ratio (M‐H, Random, 95% CI) | Subtotals only | |
| 4.1 Low dose | 2 | 164 | Risk Ratio (M‐H, Random, 95% CI) | 1.73 [0.29, 10.34] |
| 4.2 Medium dose | 2 | 164 | Risk Ratio (M‐H, Random, 95% CI) | 4.51 [0.98, 20.67] |
| 4.3 High dose | 2 | 164 | Risk Ratio (M‐H, Random, 95% CI) | 4.30 [0.91, 20.34] |
| 5 Secondary outcome: adverse events ‐ reduced appetite Show forest plot | 2 | Risk Ratio (M‐H, Random, 95% CI) | Subtotals only | |
| 5.1 Low dose | 2 | 164 | Risk Ratio (M‐H, Random, 95% CI) | 3.41 [0.91, 12.78] |
| 5.2 Medium dose | 2 | 164 | Risk Ratio (M‐H, Random, 95% CI) | 10.00 [3.14, 31.82] |
| 5.3 High dose | 2 | 164 | Risk Ratio (M‐H, Random, 95% CI) | 8.28 [2.57, 26.73] |
| 6 Secondary outcome: adverse events ‐ headache Show forest plot | 2 | Risk Ratio (M‐H, Random, 95% CI) | Subtotals only | |
| 6.1 Low dose | 2 | 164 | Risk Ratio (M‐H, Random, 95% CI) | 1.77 [0.31, 9.94] |
| 6.2 Medium dose | 2 | 164 | Risk Ratio (M‐H, Random, 95% CI) | 2.29 [0.55, 9.58] |
| 6.3 High dose | 2 | 164 | Risk Ratio (M‐H, Random, 95% CI) | 1.87 [0.10, 33.86] |
| 7 Secondary outcome: adverse events ‐ anxiety Show forest plot | 2 | Risk Ratio (M‐H, Random, 95% CI) | Subtotals only | |
| 7.1 Low dose | 2 | 164 | Risk Ratio (M‐H, Random, 95% CI) | 1.26 [0.45, 3.52] |
| 7.2 Medium dose | 2 | 164 | Risk Ratio (M‐H, Random, 95% CI) | 1.29 [0.46, 3.58] |
| 7.3 High dose | 2 | 164 | Risk Ratio (M‐H, Random, 95% CI) | 1.13 [0.22, 5.79] |
| 8 Secondary outcome: adverse events ‐ depressed mood Show forest plot | 2 | Risk Ratio (M‐H, Random, 95% CI) | Subtotals only | |
| 8.1 Low dose | 2 | 164 | Risk Ratio (M‐H, Random, 95% CI) | 0.99 [0.22, 4.42] |
| 8.2 Medium dose | 2 | 164 | Risk Ratio (M‐H, Random, 95% CI) | 2.30 [0.39, 13.42] |
| 8.3 High dose | 2 | 164 | Risk Ratio (M‐H, Random, 95% CI) | 1.75 [0.05, 62.33] |
| 9 Secondary outcome: adverse events ‐ irritability Show forest plot | 2 | Risk Ratio (M‐H, Random, 95% CI) | Subtotals only | |
| 9.1 Low dose | 2 | 164 | Risk Ratio (M‐H, Random, 95% CI) | 1.31 [0.30, 5.83] |
| 9.2 Medium dose | 2 | 164 | Risk Ratio (M‐H, Random, 95% CI) | 1.77 [0.23, 13.47] |
| 9.3 High dose | 2 | 164 | Risk Ratio (M‐H, Random, 95% CI) | 1.25 [0.25, 6.36] |
| 10 Secondary outcome: adverse events ‐ repetitive behaviours Show forest plot | 2 | Risk Ratio (M‐H, Random, 95% CI) | Subtotals only | |
| 10.1 Low dose | 2 | 164 | Risk Ratio (M‐H, Random, 95% CI) | 0.95 [0.54, 1.66] |
| 10.2 Medium dose | 2 | 164 | Risk Ratio (M‐H, Random, 95% CI) | 1.20 [0.55, 2.62] |
| 10.3 High dose | 2 | 164 | Risk Ratio (M‐H, Random, 95% CI) | 0.87 [0.43, 1.75] |
| 11 Secondary outcome: adverse events ‐ sleep disturbance Show forest plot | 2 | Risk Ratio (M‐H, Random, 95% CI) | Subtotals only | |
| 11.1 Low dose | 2 | 164 | Risk Ratio (M‐H, Random, 95% CI) | 2.94 [0.44, 19.64] |
| 11.2 Medium dose | 2 | 164 | Risk Ratio (M‐H, Random, 95% CI) | 5.10 [0.71, 36.68] |
| 11.3 High dose | 2 | 164 | Risk Ratio (M‐H, Random, 95% CI) | 3.51 [0.59, 20.82] |