بررسی سطوح CEA خون برای تشخیص سرطان کولورکتال عود کننده
Appendices
Appendix 1. Cochrane Central Register of Controlled Trials search strategy
| #1 | MeSH descriptor: [Colorectal Neoplasms] explode all trees |
| #2 | (colorectal near/3 (neoplas* or cancer* or tumour* or tumor* or carcinoma*)):ti,ab,kw (Word variations have been searched) |
| #3 | (colon* near/3 (neoplas* or cancer* or tumour* or tumor* or carcinoma*)):ti,ab,kw (Word variations have been searched) |
| #4 | (bowel near/3 (neoplas* or cancer* or tumour* or tumor* or carcinoma*)):ti,ab,kw (Word variations have been searched) |
| #5 | (rectal near/3 (neoplas* or cancer* or tumour* or tumor* or carcinoma*)):ti,ab,kw (Word variations have been searched) |
| #6 | (rectum near/3 (neoplas* or cancer* or tumour* or tumor* or carcinoma*)):ti,ab,kw (Word variations have been searched) |
| #7 | #1 or #2 or #3 or #4 or #5 or #6 |
| #8 | MeSH descriptor: [Carcinoembryonic Antigen] explode all trees |
| #9 | cea:ti,ab,kw (Word variations have been searched) |
| #10 | (carcinoembryonic near/3 antigen*):ti,ab,kw (Word variations have been searched) |
| #11 | (carcinoembryonic near/3 antibod*):ti,ab,kw (Word variations have been searched) |
| #12 | (carcino‐embryonic near/3 antigen*):ti,ab,kw (Word variations have been searched) |
| #13 | (carcino‐embryonic near/3 antibod*):ti,ab,kw (Word variations have been searched) |
| #14 | #8 or #9 or #10 or #11 or #12 or #13 |
| #15 | #7 and #14 |
Appendix 2. MEDLINE search strategy
| 1 | colorectal neoplasms/ or exp adenomatous polyposis coli/ or exp colonic neoplasms/ or colorectal neoplasms, hereditary nonpolyposis/ or exp rectal neoplasms/ | 142383 |
| 2 | (colorectal adj3 (neoplas* or cancer? or tumour? or tumor? or carcinoma?)).ti,ab. | 69267 |
| 3 | (colon* adj3 (neoplas* or cancer? or tumour? or tumor? or carcinoma?)).ti,ab. | 56720 |
| 4 | (bowel adj3 (neoplas* or cancer? or tumour? or tumor? or carcinoma?)).ti,ab. | 3988 |
| 5 | (rectal adj3 (neoplas* or cancer? or tumour? or tumor? or carcinoma?)).ti,ab. | 18409 |
| 6 | (rectum adj3 (neoplas* or cancer? or tumour? or tumor? or carcinoma?)).ti,ab. | 4598 |
| 7 | 1 or 2 or 3 or 4 or 5 or 6 | 179150 |
| 8 | Carcinoembryonic Antigen/ | 13372 |
| 9 | cea.ti,ab. | 16371 |
| 10 | (carcinoembryonic adj3 antigen?).ti,ab. | 11442 |
| 11 | (carcinoembryonic adj3 antibod*).ti,ab. | 622 |
| 12 | (carcino‐embryonic adj3 antigen?).ti,ab. | 431 |
| 13 | (carcino‐embryonic adj3 antibod*).ti,ab. | 13 |
| 14 | 8 or 9 or 10 or 11 or 12 or 13 | 23958 |
| 15 | Neoplasm Recurrence, Local/ | 79823 |
| 16 | Recurrence/ | 155149 |
| 17 | recur*.ti,ab. | 381384 |
| 18 | relaps*.ti,ab. | 116217 |
| 19 | treatment failure/ | 25585 |
| 20 | Reoperation/ | 63998 |
| 21 | Follow‐Up Studies/ and Postoperative Care/ | 5767 |
| 22 | reoperat*.ti,ab. | 23840 |
| 23 | ((local or distant) adj2 failure).ti,ab. | 3371 |
| 24 | ((therap* or treatment or surg*) adj3 fail*).ti,ab. | 58705 |
| 25 | ((therap* or treatment or surg*) adj3 (respond* or response*)).ti,ab. | 116904 |
| 26 | ((postoperat* or post‐operat* or postsurg* or post‐surg* or posttreat* or post‐treat* or posttherap* or post‐therap*) adj5 follow up).ti,ab. | 16723 |
| 27 | ((postoperat* or post‐operat* or postsurg* or post‐surg* or posttreat* or post‐treat* or posttherap* or post‐therap*) adj5 surveillance).ti,ab. | 1277 |
| 28 | ((postoperat* or post‐operat* or postsurg* or post‐surg* or posttreat* or post‐treat* or posttherap* or post‐therap*) adj5 monitor*).ti,ab. | 3604 |
| 29 | 15 or 16 or 17 or 18 or 19 or 20 or 21 or 22 or 23 or 24 or 25 or 26 or 27 or 28 | 802827 |
| 30 | 7 and 14 and 29 | 1993 |
| 31 | 7 and 14 | 6353 |
| 32 | limit 31 to "reviews (maximizes specificity)" | 41 |
| 33 | 30 not 32 | 1966 |
Appendix 3. Embase search strategy
| 1 | exp colon cancer/ or exp rectum cancer/ | 172220 |
| 2 | (colorectal adj3 (neoplas* or cancer? or tumour? or tumor? or carcinoma?)).ti,ab. | 97898 |
| 3 | (colon* adj3 (neoplas* or cancer? or tumour? or tumor? or carcinoma?)).ti,ab. | 75721 |
| 4 | (bowel adj3 (neoplas* or cancer? or tumour? or tumor? or carcinoma?)).ti,ab. | 5761 |
| 5 | (rectal adj3 (neoplas* or cancer? or tumour? or tumor? or carcinoma?)).ti,ab. | 26610 |
| 6 | (rectum adj3 (neoplas* or cancer? or tumour? or tumor? or carcinoma?)).ti,ab. | 5978 |
| 7 | 1 or 2 or 3 or 4 or 5 or 6 | 234787 |
| 8 | carcinoembryonic antigen/ | 25911 |
| 9 | cea.ti,ab. | 22520 |
| 10 | (carcinoembryonic adj3 antigen?).ti,ab. | 13394 |
| 11 | (carcinoembryonic adj3 antibod*).ti,ab. | 657 |
| 12 | (carcino‐embryonic adj3 antigen?).ti,ab. | 617 |
| 13 | (carcino‐embryonic adj3 antibod*).ti,ab. | 21 |
| 14 | 8 or 9 or 10 or 11 or 12 or 13 | 36255 |
| 15 | cancer recurrence/ or tumor recurrence/ | 119064 |
| 16 | recurrent disease/ or relapse/ | 192303 |
| 17 | recur*.ti,ab. | 523223 |
| 18 | relaps*.ti,ab. | 174290 |
| 19 | exp treatment failure/ | 82867 |
| 20 | Reoperation/ | 53394 |
| 21 | follow up/ and (postoperative care/ or postoperative period/) | 38038 |
| 22 | reoperat*.ti,ab. | 31321 |
| 23 | ((local or distant) adj2 failure).ti,ab. | 4986 |
| 24 | ((therap* or treatment or surg*) adj3 fail*).ti,ab. | 83522 |
| 25 | ((therap* or treatment or surg*) adj3 (respond* or response*)).ti,ab. | 167374 |
| 26 | ((postoperat* or post‐operat* or postsurg* or post‐surg* or posttreat* or post‐treat* or posttherap* or post‐therap*) adj5 follow up).ti,ab. | 23063 |
| 27 | ((postoperat* or post‐operat* or postsurg* or post‐surg* or posttreat* or post‐treat* or posttherap* or post‐therap*) adj5 surveillance).ti,ab. | 1797 |
| 28 | ((postoperat* or post‐operat* or postsurg* or post‐surg* or posttreat* or post‐treat* or posttherap* or post‐therap*) adj5 monitor*).ti,ab. | 4961 |
| 29 | 15 or 16 or 17 or 18 or 19 or 20 or 21 or 22 or 23 or 24 or 25 or 26 or 27 or 28 | 1107887 |
| 30 | 7 and 14 and 29 | 2994 |
| 31 | (meta‐analysis or systematic review or MEDLINE).tw. | 144743 |
| 32 | 7 and 14 and 31 | 78 |
| 33 | 30 not 32 | 2952 |
Appendix 4. Science Citation Index & Conference Proceedings Citation Index ‐ Science search strategy:
| #1 | TOPIC: ((colorectal NEAR/3 (neoplas* or cancer* or tumour* or tumor* or carcinoma*))) ORTOPIC: ((colon* NEAR/3 (neoplas* or cancer* or tumour* or tumor* or carcinoma*))) ORTOPIC: ((bowel NEAR/3 (neoplas* or cancer* or tumour* or tumor* or carcinoma*))) ORTOPIC: ((rectal NEAR/3 (neoplas* or cancer* or tumour* or tumor* or carcinoma*))) ORTOPIC: ((rectum NEAR/3 (neoplas* or cancer* or tumour* or tumor* or carcinoma*))) Indexes=SCI‐EXPANDED, CPCI‐S Timespan=All years | 189,742 |
| #2 | TOPIC: (cea) ORTOPIC: ((carcinoembryonic NEAR/3 antigen*)) ORTOPIC: ((carcinoembryonic NEAR/3 antibod*)) ORTOPIC: ((carcino‐embryonic NEAR/3 antigen*)) ORTOPIC: ((carcino‐embryonic NEAR/3 antibod*)) Indexes=SCI‐EXPANDED, CPCI‐S Timespan=All years | 23,879 |
| #3 | TOPIC: (recur*) ORTOPIC: (relaps*) ORTOPIC: (reoperat*) Indexes=SCI‐EXPANDED, CPCI‐S Timespan=All years | 511,568 |
| #4 | TOPIC: (((local or distant) NEAR/2 failure)) ORTOPIC: (((therap* or treatment or surg*) NEAR/3 fail*)) ORTOPIC: (((therap* or treatment or surg*) NEAR/3 (respond* or response*))) Indexes=SCI‐EXPANDED, CPCI‐S Timespan=All years | 200,865 |
| #5 | TOPIC: (((postoperat* or post‐operat* or postsurg* or post‐surg* or posttreat* or post‐treat* or posttherap* or post‐therap*) NEAR/5 "follow up")) ORTOPIC: (((postoperat* or post‐operat* or postsurg* or post‐surg* or posttreat* or post‐treat* or posttherap* or post‐therap*) NEAR/5 surveillance)) ORTOPIC: (((postoperat* or post‐operat* or postsurg* or post‐surg* or posttreat* or post‐treat* or posttherap* or post‐therap*) NEAR/5 monitor*)) Indexes=SCI‐EXPANDED, CPCI‐S Timespan=All years | 17,719 |
| #6 | #5 OR #4 OR #3 Indexes=SCI‐EXPANDED, CPCI‐S Timespan=All years | 699,223 |
| #7 | #6 AND #2 AND #1 Indexes=SCI‐EXPANDED, CPCI‐S Timespan=All years | 1,518 |
Appendix 5. Operational guidance for modified QUADAS‐2 tool
Unless otherwise specified, each item must be explicitly reported to achieve a “yes” answer.
| DOMAIN 1: Patient Selection | ||
| A: Risk of Bias | ||
| 1. Was a consecutive or random sample of patients enrolled? Yes/No/Unclear | ||
| 2. Did the study avoid inappropriate exclusions? | ||
| Yes | Patients are included in follow‐up post radical CRC resection, OR Exclusions was justified in the text and reviewers reached consensus on the appropriateness of any exclusions. Exclusions based on patient characteristics allowing subgroup analysis (e.g. tumour grade) should be deemed appropriate | |
| No | Criteria for “yes” not achieved. | |
| Unclear | Exclusions not reported clearly. | |
| OVERALL RISK OF BIAS: LOW/HIGH/UNCLEAR | ||
| B: Applicability | ||
| 1. Is there concern that the included patients do not match the review question? | ||
| Yes | Patients are not undergoing follow‐up post radical CRC resection including CEA measurement. | |
| No | Patients are undergoing follow‐up post radical CRC resection including CEA measurement. | |
| Unclear | The included population is not defined. | |
| OVERALL CONCERN REGARDING APPLICABILITY: LOW/HIGH/UNCLEAR | ||
| DOMAIN 2: Index Tests | ||
| A: Risk of Bias | ||
| 1. If a threshold was used, was it pre‐specified? Yes/No/Unclear | ||
| 2. Is the same method and instrument used for all CEA measurements? Yes/No/Unclear | ||
| 3. Is there an estimation of reproducibility of the method, for example the % coefficient of variation at specific concentrations? Yes/No/Unclear | ||
| 4. Is there an indication of method accuracy, for example, is there evidence of participation in an external quality assessment and proficiency testing scheme? Yes/No/Unclear | ||
| OVERALL RISK OF BIAS: LOW/HIGH/UNCLEAR | ||
| B: Applicability | ||
| 1. Is there concern that the index test, its conduct, or interpretation differ from the review question? | ||
| Yes | Blood CEA is not interpreted as a stand‐alone test to trigger investigation for CRC recurrence | |
| No | Blood CEA is interpreted as a stand‐alone test to trigger investigation for CRC recurrence | |
| Unclear | It is unclear whether the index test differs from the review question | |
| OVERALL CONCERN REGARDING APPLICABILITY: LOW/HIGH/UNCLEAR | ||
| DOMAIN 3: Reference Standard | ||
| A: Risk of Bias | ||
| 1. Is the reference standard likely to correctly classify the target condition? | ||
| Yes | An appropriate reference standard (as defined in the protocol) is used. | |
| No | An inappropriate reference standard is used | |
| Unclear | The reference standard used is not clearly specified. | |
| 2. Were the reference standard results interpreted without knowledge of the results of the index test? | ||
| Yes | The reference standard results were interpreted without knowledge of the index test(s). | |
| No | The reference standard results were interpreted with knowledge of the index test(s). | |
| Unclear | It is not clear whether interpretation was blinded or not. | |
| OVERALL RISK OF BIAS: LOW/HIGH/UNCLEAR | ||
| B: Applicability | ||
| 1. Is there concern that the target condition as defined by the reference standard does not match the review question? Yes/No/Unclear | ||
| OVERALL CONCERN REGARDING APPLICABILITY: LOW/HIGH/UNCLEAR | ||
| DOMAIN 4: Flow and Timing | ||
| A: Risk of Bias | ||
| 1. Was the index test repeated prior to the reference standard? Yes/No/Unclear | ||
| 2. Was the the timing between index test(s) and reference standard ascertainable? | ||
| Yes | The timing was ascertainable. | |
| Unclear | Not reported, variable or could not be clearly determined | |
| 3. Did all included patients who had at least one CEA measurement receive a reference standard? Yes/No/Unclear | ||
| 4. Did patients receive the same reference standard? | ||
| Yes | >95% of patients received the same reference standard regardless of index test results or place within a follow‐up schedule. | |
| No | >95% of patients did not receive the same reference standard regardless of index test results, or place within the follow‐up schedule. | |
| Unclear | It is unclear whether all the included patients received same reference standard regardless of index test results | |
| 5. Were all patients included in the analysis? Yes/No/Unclear | ||
| OVERALL RISK OF BIAS: LOW/HIGH/UNCLEAR | ||

PRISMA flow diagram: results of the search for studies evaluating the diagnostic accuracy of blood CEA to detect recurrent colorectal cancer in patients following curative resection.
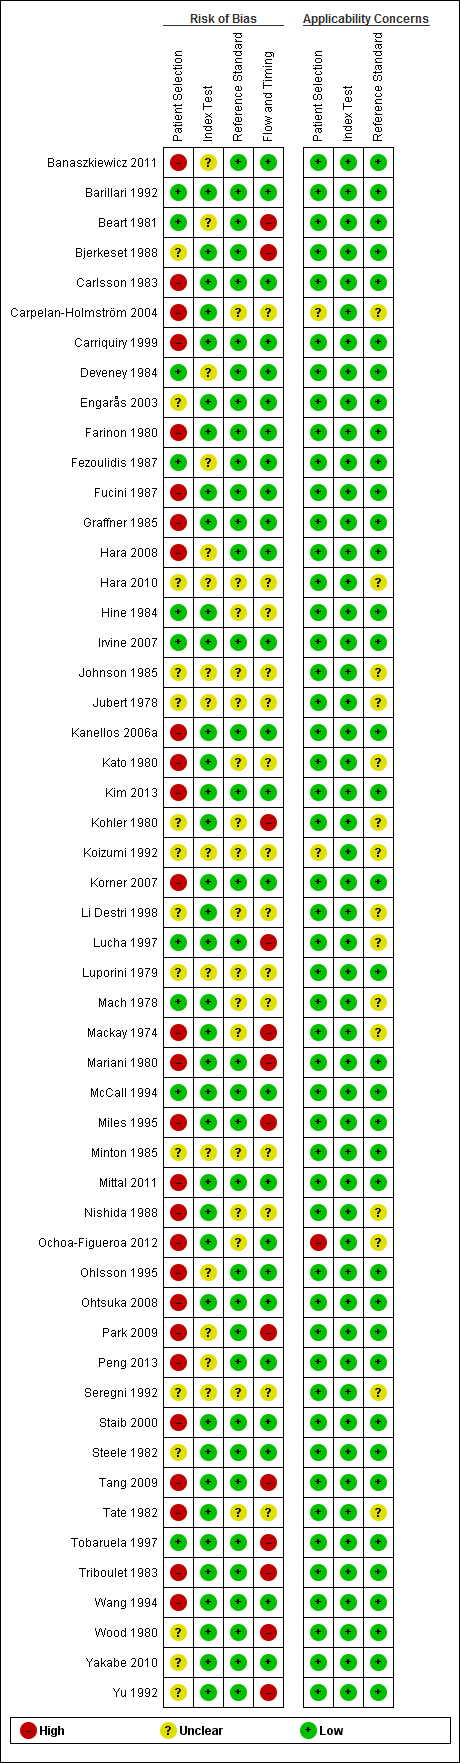
QUADAS‐2 risk of bias and applicability concerns summary including review authors' judgements about each domain for each included study

QUADAS‐2 risk of bias and applicability concerns graph including review authors' judgements about each domain presented as percentages across included studies
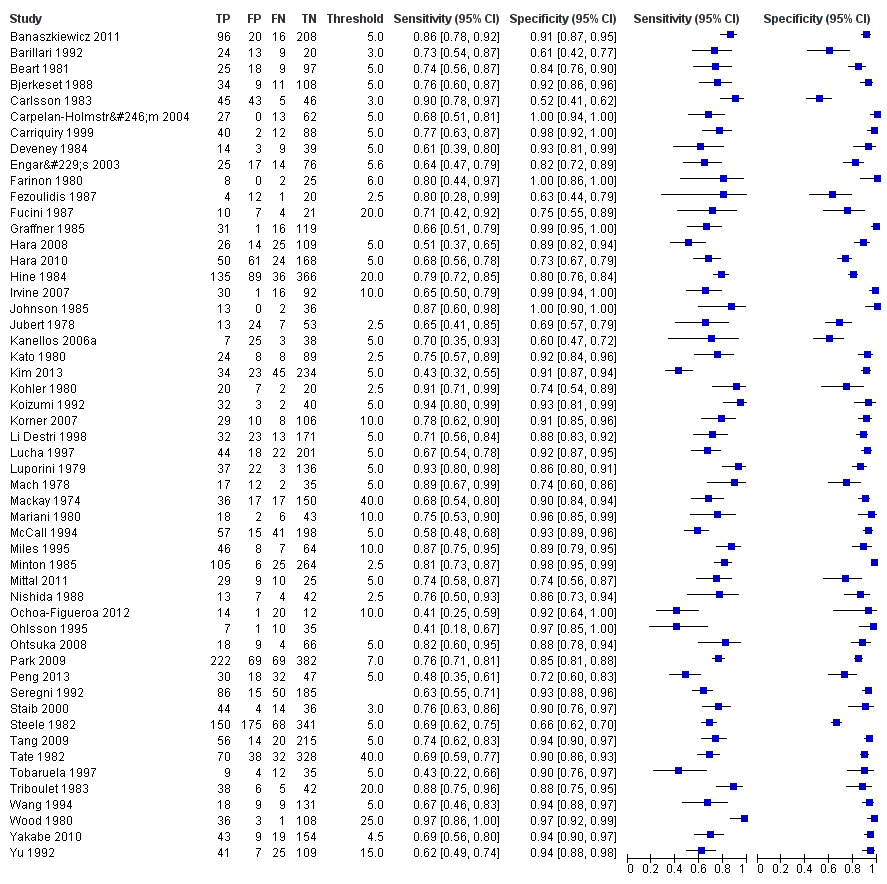
Forest plot for all 52 included studies for the threshold reported closest to 5 µg/L
TP = true positive; FP = false positive; FN = false negative; TN = true negative
The blue square depicts the sensitivity and specificity for each study and the horizontal line represents the corresponding 95% confidence interval for these estimates.

Scatter plot of sensitivity versus specificity for all 52 studies, regardless of threshold.
Each box represents the 2 x 2 data extracted from each study, with the width of the boxes being proportional to the inverse standard error of the specificity and the height of the boxes proportional to the inverse standard error of the sensitivity.

Forest plot broken down by threshold: CEA at 2.5µg/L, CEA at 5µg/L, CEA at 10µg/L.
TP = true positive; FP = false positive; FN = false negative; TN = true negative
The blue square depicts the sensitivity and specificity for each study and the horizontal line represents the corresponding 95% confidence intervals for these estimates.

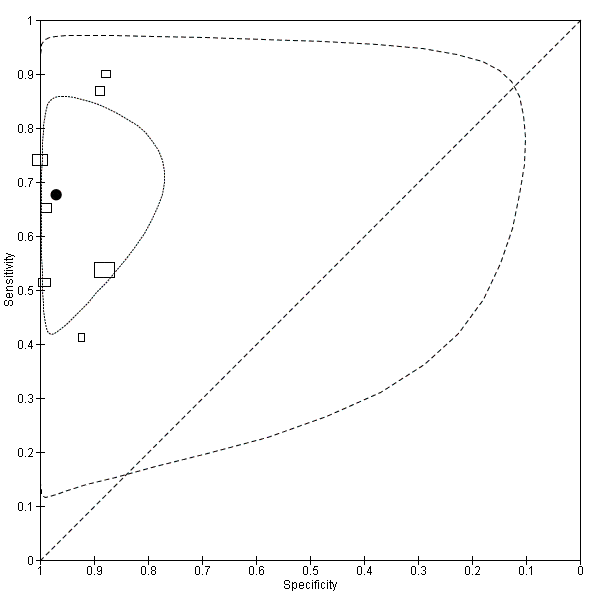
Summary ROC plot of accuracy at a threshold of 2.5 µg/L.
Each box represents the 2 x 2 data extracted from each study. The width of the box is proportional to the number of patients who did not experience recurrence in each study, and the height is proportional to the number of patients that did develop recurrent CRC.
The filled circle is the pooled estimate for sensitivity and specificity and the line running through it is the summary ROC curve.
The smaller dotted ellipse represents the 95% credible region around the summary estimate; the larger dashed ellipse represents the 95% prediction region.

Summary ROC plot of accuracy at a threshold of 5 µg/L.
Each box represents the 2 x 2 data extracted from each study.
The width of the box is proportional to the number of patients who did not experience recurrence in each study, and the height is proportional to the number of patients that did develop recurrent CRC.
The filled circle is the pooled estimate for sensitivity and specificity and the line running through it is the summary ROC curve.
The smaller dotted ellipse represents the 95% credible region around the summary estimate; the larger dashed ellipse represents the 95% prediction region.
Summary ROC plot of accuracy at a threshold of 10 µg/L.
Each box represents the 2 x 2 data extracted from each study.
The width of the box is proportional to the number of patients who did not experience recurrence in each study, and the height is proportional to the number of patients that did develop recurrent CRC.
The filled circle is the pooled estimate for sensitivity and specificity and the line running through it is the summary ROC curve.
The smaller dotted ellipse represents the 95% credible region around the summary estimate; the larger dashed ellipse represents the 95% prediction region.

CEA ‐ all thresholds.


| Review question: What is the accuracy of single‐measurement blood CEA as a triage test to prompt further investigation for colorectal cancer recurrence after curative resection? | ||||
| Population: adults with no detectable residual disease after curative surgery (with or without adjuvant therapy) | ||||
| Studies: cross‐sectional diagnostic test accuracy studies, cohort studies, and RCTs, reporting 2 x 2 data | ||||
| Index test: Blood carcino‐embryonic antigen (CEA) | ||||
| Reference standard: appropriate¹ imaging, histology, or routine clinical follow‐up | ||||
| Setting: primary or hospital care. | ||||
| Subgroup | Number | Sensitivity (95% CI) | Specificity (95% CI) | Interpretation Assuming a constant incidence of 2%² recurrence at each measurement point, testing 1000 people will have the following outcome depending on the CEA threshold applied |
| 2.5 µg/L | 1515 (7) | 82% (78 to 86) | 80% (59 to 92) | 16 cases of recurrence will be detected and 4 cases will be missed. |
| 5 µg/L | 4585 (23) | 71% (64 to 76) | 88% (84 to 92) | 14 cases of recurrence will be detected and 6 cases will be missed. |
| 10 µg/L | 2341 (7) | 68% (53 to 79) | 97% (90 to 99) | 14 cases of recurrence will be detected and 6 cases will be missed. |
| 1as defined in the Reference standards section of the Methods. | ||||
| Month when CEA measured | per 1000 patients tested at a threshold of 2.5 µg/L | False alarm rate | ||||
| Estimated recurrences¹ | Referrals for raised CEA | Cases of recurrence detected | Cases of recurrence missed | False alarms (cases investigated when cancer not present) | ||
| Follow‐up years 1 and 2: 3‐monthly CEA testing | ||||||
| 3 | 19 | 212 | 16 | 3 | 196 | 92% |
| 6 | 19 | 212 | 16 | 3 | 196 | 92% |
| 9 | 39 | 224 | 32 | 7 | 192 | 86% |
| 12 | 39 | 224 | 32 | 7 | 192 | 86% |
| 15 | 37 | 223 | 30 | 7 | 193 | 87% |
| 18 | 37 | 223 | 30 | 7 | 193 | 87% |
| 21 | 31 | 219 | 25 | 6 | 194 | 89% |
| 24 | 31 | 219 | 25 | 6 | 194 | 89% |
| Follow‐up years 3, 4 and 5: 6‐monthly CEA testing | ||||||
| 30 | 46 | 229 | 38 | 8 | 191 | 83% |
| 36 | 36 | 223 | 30 | 6 | 193 | 87% |
| 42 | 27 | 217 | 22 | 5 | 195 | 90% |
| 48 | 25 | 216 | 21 | 4 | 195 | 90% |
| 54 | 17 | 211 | 14 | 3 | 197 | 93% |
| 60 | 14 | 208 | 11 | 3 | 197 | 95% |
| 1Estimates are based on data reported by Sargent 2007. Three‐monthly data were unavailable, and so constant rates were assumed during each six‐month period for the first two years. Estimates are rounded. | ||||||
| Month when CEA measured | per 1000 patients tested at a threshold of 5 µg/L | False alarm rate | ||||
| Estimated recurrences¹ | Referrals for raised CEA | Cases of recurrence detected | Cases of recurrence missed | False alarms (cases investigated when cancer not present) | ||
| Follow‐up years 1 and 2: 3‐monthly CEA testing | ||||||
| 3 | 19 | 131 | 13 | 6 | 118 | 90% |
| 6 | 19 | 131 | 13 | 6 | 118 | 90% |
| 9 | 39 | 143 | 28 | 11 | 115 | 80% |
| 12 | 39 | 143 | 28 | 11 | 115 | 80% |
| 15 | 37 | 142 | 26 | 11 | 116 | 82% |
| 18 | 37 | 142 | 26 | 11 | 116 | 82% |
| 21 | 31 | 138 | 22 | 9 | 116 | 84% |
| 24 | 31 | 138 | 22 | 9 | 116 | 84% |
| Follow‐up years 3, 4 and 5: 6‐ monthly CEA testing | ||||||
| 30 | 46 | 147 | 33 | 13 | 114 | 78% |
| 36 | 36 | 142 | 26 | 10 | 116 | 82% |
| 42 | 27 | 136 | 19 | 8 | 117 | 86% |
| 48 | 25 | 135 | 18 | 7 | 117 | 87% |
| 54 | 17 | 130 | 12 | 5 | 118 | 91% |
| 60 | 14 | 128 | 10 | 4 | 118 | 92% |
| 1Estimates are based on data reported by Sargent 2007. Three‐monthly data were unavailable, and so constant rates were assumed during each six‐month period for the first two years. Estimates are rounded. | ||||||
| Month when CEA measured | per 1000 patients tested at a threshold of 10 µg/L | False alarm rate | ||||
| Estimated recurrences¹ | Referrals for raised CEA | Cases of recurrence detected | Cases of recurrence missed | False alarms (cases investigated when cancer not present) | ||
| Follow‐up years 1 and 2: 3‐ monthly CEA testing | ||||||
| 3 | 19 | 42 | 13 | 6 | 30 | 70% |
| 6 | 19 | 42 | 13 | 6 | 29 | 70% |
| 9 | 39 | 55 | 27 | 13 | 29 | 52% |
| 12 | 39 | 55 | 27 | 13 | 29 | 52% |
| 15 | 37 | 54 | 25 | 12 | 29 | 53% |
| 18 | 37 | 54 | 25 | 12 | 29 | 53% |
| 21 | 31 | 50 | 21 | 10 | 29 | 58% |
| 24 | 31 | 50 | 21 | 10 | 29 | 58% |
| Follow‐up years 3, 4 and 5: 6‐ monthly CEA testing | ||||||
| 30 | 46 | 60 | 31 | 15 | 29 | 48% |
| 36 | 36 | 53 | 24 | 12 | 29 | 54% |
| 42 | 27 | 48 | 19 | 9 | 29 | 61% |
| 48 | 25 | 46 | 17 | 8 | 29 | 63% |
| 54 | 17 | 41 | 11 | 6 | 30 | 72% |
| 60 | 14 | 39 | 10 | 5 | 30 | 75% |
| 1Estimates are based on data reported by Sargent 2007. Three‐monthly data were unavailable, and so constant rates were assumed during each six‐month period for the first two years. Estimates are rounded. | ||||||
| Test | No. of studies | No. of participants |
| 1 CEA ‐ all thresholds Show forest plot | 52 | 9717 |
| 2 CEA at 2.5µg/L Show forest plot | 7 | 1515 |
| 3 CEA at 5µg/L Show forest plot | 23 | 4585 |
| 4 CEA at 10µg/L Show forest plot | 7 | 1607 |