Scolaris Content Display Scolaris Content Display

Screening process diagram (as recommended by the PRISMA statement).
Figuras y tablas -
Figure 1

Screening process diagram (as recommended by the PRISMA statement).

Risk of bias summary: review authors' judgements about each risk of bias item for each included study.
Figuras y tablas -
Figure 2

Risk of bias summary: review authors' judgements about each risk of bias item for each included study.

Risk of bias graph: review authors' judgements about each risk of bias item presented as percentages across all included studies.
Figuras y tablas -
Figure 3

Risk of bias graph: review authors' judgements about each risk of bias item presented as percentages across all included studies.

Forest plot of comparison: 1 Health‐related quality of life, outcome: 1.1 Health‐related quality of life.
Figuras y tablas -
Figure 4

Forest plot of comparison: 1 Health‐related quality of life, outcome: 1.1 Health‐related quality of life.

Forest plot of comparison: 1 Early palliative care vs TAU, outcome: 1.2 Survival.
Figuras y tablas -
Figure 5

Forest plot of comparison: 1 Early palliative care vs TAU, outcome: 1.2 Survival.

Forest plot of comparison: 1 Early palliative care vs standard oncological care, outcome: 1.2 Depression.
Figuras y tablas -
Figure 6

Forest plot of comparison: 1 Early palliative care vs standard oncological care, outcome: 1.2 Depression.

Forest plot of comparison: 1 Early palliative care vs standard oncological care, outcome: 1.4 Symptom intensity.
Figuras y tablas -
Figure 7

Forest plot of comparison: 1 Early palliative care vs standard oncological care, outcome: 1.4 Symptom intensity.

Forest plot of comparison: 1 Early palliative care vs standard oncological care, outcome: 1.5 Health‐related quality of life (sensitivity analysis for study design including RCTs only).
Figuras y tablas -
Figure 8

Forest plot of comparison: 1 Early palliative care vs standard oncological care, outcome: 1.5 Health‐related quality of life (sensitivity analysis for study design including RCTs only).

Forest plot of comparison: 1 Early palliative care vs standard oncological care, outcome: 1.6 Symptom intensity (sensitivity analysis for study design including RCTs only).
Figuras y tablas -
Figure 9

Forest plot of comparison: 1 Early palliative care vs standard oncological care, outcome: 1.6 Symptom intensity (sensitivity analysis for study design including RCTs only).

Comparison 1 Early palliative care vs standard oncological care, Outcome 1 Health‐related quality of life.
Figuras y tablas -
Analysis 1.1

Comparison 1 Early palliative care vs standard oncological care, Outcome 1 Health‐related quality of life.

Comparison 1 Early palliative care vs standard oncological care, Outcome 2 Depression.
Figuras y tablas -
Analysis 1.2

Comparison 1 Early palliative care vs standard oncological care, Outcome 2 Depression.

Comparison 1 Early palliative care vs standard oncological care, Outcome 3 Survival.
Figuras y tablas -
Analysis 1.3

Comparison 1 Early palliative care vs standard oncological care, Outcome 3 Survival.

Comparison 1 Early palliative care vs standard oncological care, Outcome 4 Symptom intensity.
Figuras y tablas -
Analysis 1.4

Comparison 1 Early palliative care vs standard oncological care, Outcome 4 Symptom intensity.

Comparison 1 Early palliative care vs standard oncological care, Outcome 5 Health‐related quality of life (sensitivity analysis for study design including RCTs only).
Figuras y tablas -
Analysis 1.5

Comparison 1 Early palliative care vs standard oncological care, Outcome 5 Health‐related quality of life (sensitivity analysis for study design including RCTs only).

Comparison 1 Early palliative care vs standard oncological care, Outcome 6 Symptom intensity (sensitivity analysis for study design including RCTs only).
Figuras y tablas -
Analysis 1.6

Comparison 1 Early palliative care vs standard oncological care, Outcome 6 Symptom intensity (sensitivity analysis for study design including RCTs only).

Summary of findings for the main comparison. Early palliative care for adults with advanced cancer

Clinical question: Should early palliative care be preferred over treatment as usual for improving health‐related quality of life, depression, and symptom intensity in patients with advanced cancer?

Patient or population: patients with advanced cancer

Settings: mainly outpatient care in Australia, Canada, Italy, and the USA
Intervention: early palliative care

Comparison: treatment as usual

Follow‐up: at 12 weeks or mean difference in repeated measurement results for longitudinal designs

Outcomes

Anticipated absolute effects* (95% CI)

Relative effect
(95% CI)

Number of participants
(studies)

Certainty of the evidence
(GRADE)

Comments

Risk with treatment as usual

Risk with early palliative care

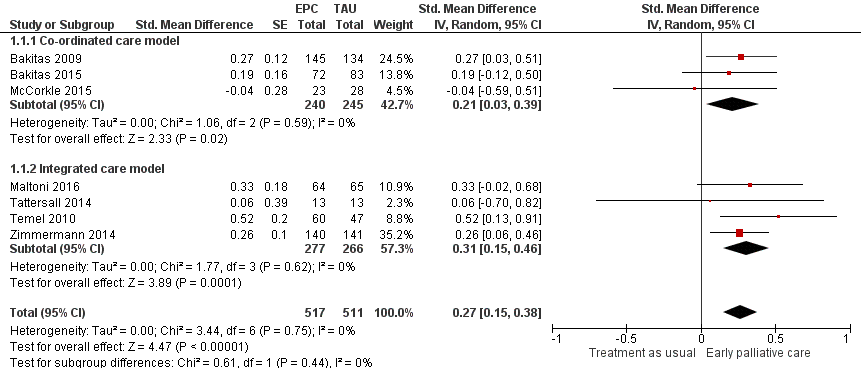
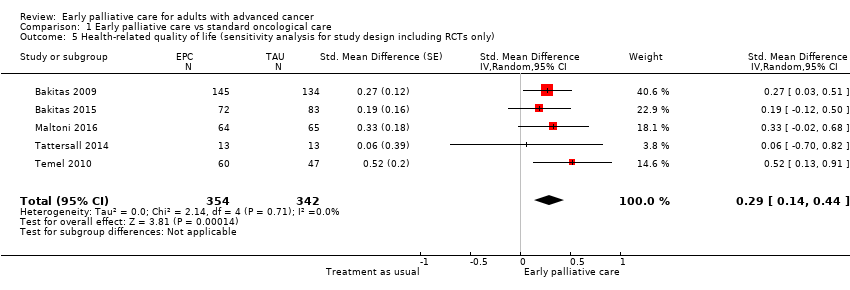
Health‐related quality of life (HRQOL), SD units: measured on FACIT‐Pal, TOI of FACT‐Hep, TOI of FACT‐L, FACT‐G, McGill Quality of Life, FACIT‐Sp. Higher scores indicate better HRQOL. Follow‐up: range 12 weeks to 52 weeks

HRQOL score improved on average 0.27 (95% CI 0.15 to 0.38) SDs more in early palliative care participants than in control participants

1028
(7 RCTs)

⊕⊕⊝⊝
LOW1,2,3

By conventional criteria, an SMD of 0.2 represents a small effect, 0.5 a moderate effect, and 0.8 a large effect (Cohen 1988)

Health‐related quality of life (HRQOL), natural units: measured on FACT‐G (from 0 to 108)

Baseline control group mean score at 70.5 pointsa

HRQOL score improved on average 4.59 (95% CI 2.55 to 6.46) points more in early palliative care participants than in control participants

1028
(7 RCTs)

⊕⊕⊝⊝
LOW1,2,3

Calculated by transforming all scales to the FACT‐G in which the minimal clinically important difference is approximately 5 and the SD in the cancer validation sample was 17.0 (Brucker 2005)

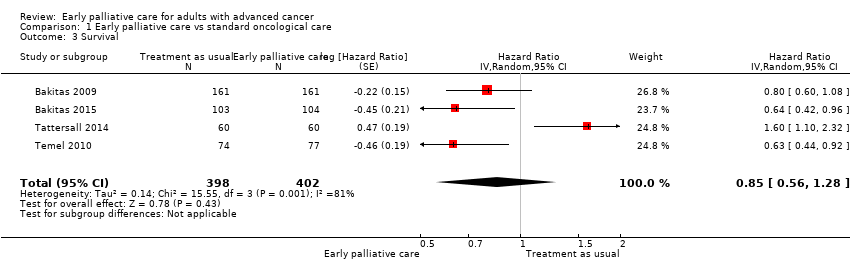
Survival: estimated with the unadjusted death hazard ratio

Study populationb

HR 0.85, 95% CI 0.56 to 1.28

800
(4 RCTs)

⊕⊝⊝⊝
VERY LOW1,4,5,6

61 per 100

56 per 100 (41‐71)

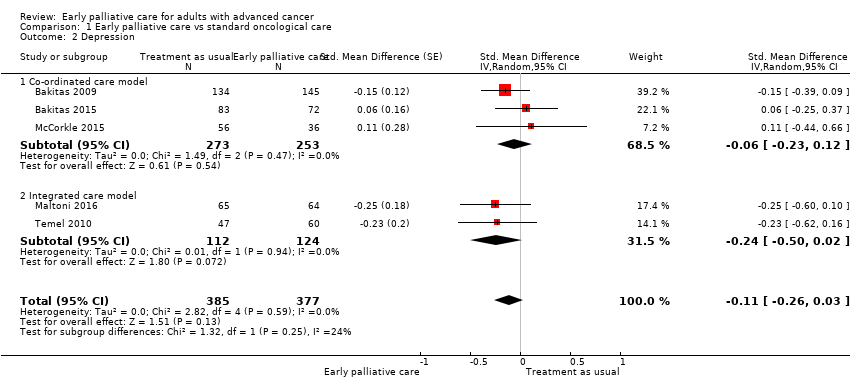
Depression, SD units: measured on CES‐D, HADS‐D, PHQ‐9. Higher scores indicate higher depressive symptom load. Follow‐up: range 12 weeks to 52 weeks

Depression score improved on average ‐0.11 (95% CI ‐0.26 to 0.03) SDs more in early palliative care participants than in control participants

762
(5 RCTs)

⊕⊝⊝⊝

VERY LOW1,2,4

By conventional criteria, an SMD of 0.2 represents a small effect, 0.5 a moderate effect, and 0.8 a large effect (Cohen 1988)

Depression, natural units: measured on CES‐D (from 0 to 60). Higher scores indicate higher depressive symptom load

Baseline control group mean score at 13.8 pointsc

Depressive symptoms score improved on average ‐0.98 (95% CI ‐2.31 to 0.27) points more in early palliative care participants than in control participants

762
(5 RCTs)

⊕⊝⊝⊝

VERY LOW1,2,4

Calculated by transforming all scales to CES‐D

and applying an SD of 8.9 from baseline control group score in Bakitas 2009

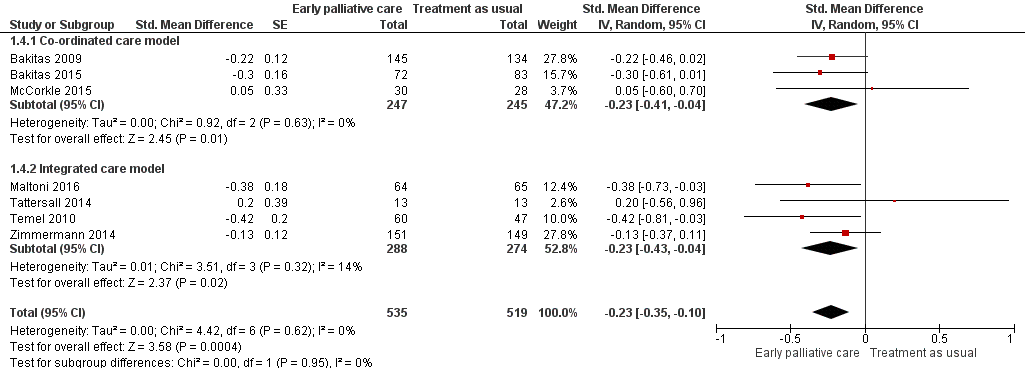
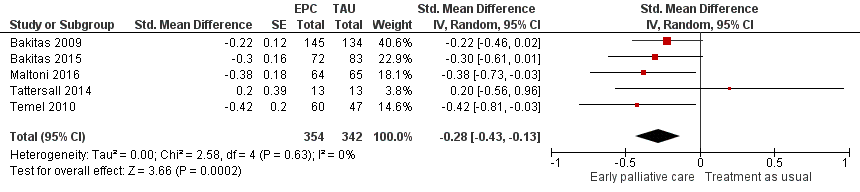
Symptom intensity, SD units: measured on ESAS, QUAL‐E Symptom Impact Subscale, SDS, RSC, LCS of FACT‐L, HCS of FACT‐Hep. Higher scores indicate higher symptom intensity. Follow‐up: range 12 weeks to 52 weeks

Symptom intensity score improved on average ‐0.23 (95% CI ‐0.35 to ‐0.1) SDs more in early palliative care participants than in control participants

1054
(7 RCTs)

⊕⊕⊝⊝
LOW1,2,3

By conventional criteria, an SMD of 0.2 represents a small effect, 0.5 a moderate effect, and 0.8 a large effect (Cohen 1988)

Symptom intensity, natural units: measured on ESAS (from 0 to 900). Follow‐up: range 12 weeks to 52 weeks

Baseline control group mean score at 286.3 pointsc

Symptom intensity symptoms score improved on average ‐35.4 (95% CI ‐53.9 to ‐15.4) points more in early palliative care participants than in control participants

1054
(7 RCTs)

⊕⊕⊝⊝
LOW1,2,3

Calculated by transforming all scales to the ESAS and applying an SD of 154.0 from baseline control group score in Bakitas 2009

Adverse events

See comment

See comment

Not estimable

1614
(7 RCTs)

See comment

Most often, study authors did not address assessment or findings on adverse events in their study publications. However, on request, authors of 6 studies described the tolerability of early palliative care as very good. A single study mentioned adverse events only in the early palliative care group, i.e. higher percentage of participants with severe scores for pain and poor appetite along with higher level of unmet needs (Tattersall 2014)

*Risk in the intervention group (and its 95% confidence interval) is based on assumed risk in the comparison group and relative effect of the intervention (and its 95% CI)

aApproximate average of baseline control group FACT‐G scores across 4 included studies (Bakitas 2009; Bakitas 2015; Maltoni 2016; Temel 2010)

b12‐Month follow‐up control group risk in the largest study reporting on survival (Bakitas 2009)

cBaseline control group CES‐D score in the largest study reporting on depression (Bakitas 2009)

CI: confidence interval; GRADE: Grading of Recommendations Assessment; HR: unadjusted death hazard ratio; SD: standard deviation; SMD: standardised mean difference

GRADE Working Group grades of evidence
High certainty: We are very confident that the true effect lies close to that of the estimate of the effect.
Moderate certainty: We are moderately confident in the effect estimate: The true effect is likely to be close to the estimate of the effect, but there is a possibility that it is substantially different.
Low certainty: Our confidence in the effect estimate is limited: The true effect may be substantially different from the estimate of the effect.
Very low certainty: We have very little confidence in the effect estimate: The true effect is likely to be substantially different from the estimate of effect.

1We downgraded 2 points owing to very serious limitations in study quality (high risk of bias across studies)

2We decided against downgrading for indirectness, although 2 studies were conducted exclusively in patients with metastatic pancreatic and advanced lung cancer, respectively (Maltoni 2016; Temel 2010). We decided against downgrading for inconsistency, as we did not detect significant heterogeneity

3We decided against downgrading for imprecision, as the optimal information size (OIS) criterion was met, and the 95% confidence interval around the difference in effect between intervention and control excludes zero

4We downgraded 1 point for imprecision, as the optimal information size (OIS) criterion was met, but the 95% confidence interval around the difference in effect between intervention and control includes zero. The 95% confidence interval fails to exclude harm

5We decided against downgrading for important inconsistency (large I2) because we had downgraded by 3 points already

6We decided against downgrading for indirectness, as only a single study was conducted exclusively in patients with advanced lung cancer (Temel 2010)

Figuras y tablas -
Summary of findings for the main comparison. Early palliative care for adults with advanced cancer
Comparison 1. Early palliative care vs standard oncological care

Outcome or subgroup title

No. of studies

No. of participants

Statistical method

Effect size

1 Health‐related quality of life Show forest plot

7

1028

Std. Mean Difference (Random, 95% CI)

0.27 [0.15, 0.38]

1.1 Co‐ordinated care model

3

485

Std. Mean Difference (Random, 95% CI)

0.21 [0.03, 0.39]

1.2 Integrated care model

4

543

Std. Mean Difference (Random, 95% CI)

0.31 [0.15, 0.46]

2 Depression Show forest plot

5

762

Std. Mean Difference (Random, 95% CI)

‐0.11 [‐0.26, 0.03]

2.1 Co‐ordinated care model

3

526

Std. Mean Difference (Random, 95% CI)

‐0.06 [‐0.23, 0.12]

2.2 Integrated care model

2

236

Std. Mean Difference (Random, 95% CI)

‐0.24 [‐0.50, 0.02]

3 Survival Show forest plot

4

800

Hazard Ratio (Random, 95% CI)

0.85 [0.56, 1.28]

4 Symptom intensity Show forest plot

7

1054

Std. Mean Difference (Random, 95% CI)

‐0.23 [‐0.35, ‐0.10]

4.1 Co‐ordinated care model

3

492

Std. Mean Difference (Random, 95% CI)

‐0.23 [‐0.41, ‐0.04]

4.2 Integrated care model

4

562

Std. Mean Difference (Random, 95% CI)

‐0.23 [‐0.43, ‐0.04]

5 Health‐related quality of life (sensitivity analysis for study design including RCTs only) Show forest plot

5

696

Std. Mean Difference (Random, 95% CI)

0.29 [0.14, 0.44]

6 Symptom intensity (sensitivity analysis for study design including RCTs only) Show forest plot

5

696

Std. Mean Difference (Random, 95% CI)

‐0.28 [‐0.43, ‐0.13]

Figuras y tablas -
Comparison 1. Early palliative care vs standard oncological care