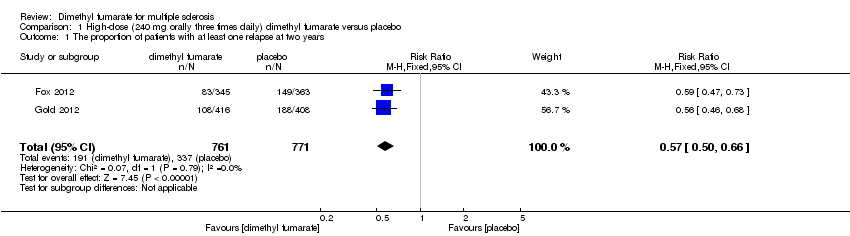
| 1 The proportion of patients with at least one relapse at two years Show forest plot | 2 | 1540 | Risk Ratio (M‐H, Random, 95% CI) | 0.64 [0.54, 0.77] |
|
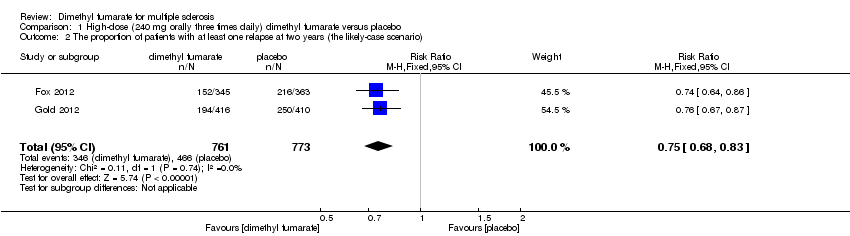
| 2 The proportion of patients with at least one relapse at two years (the likely‐case scenario) Show forest plot | 2 | 1546 | Risk Ratio (M‐H, Fixed, 95% CI) | 0.81 [0.74, 0.89] |
|
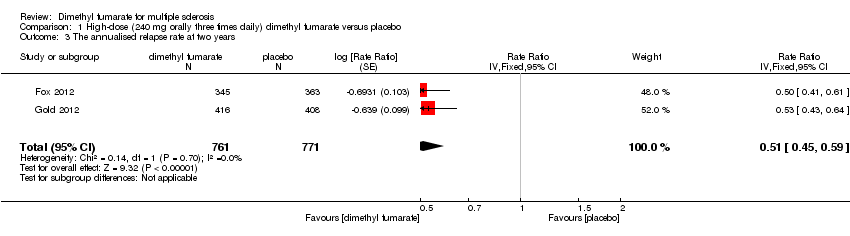
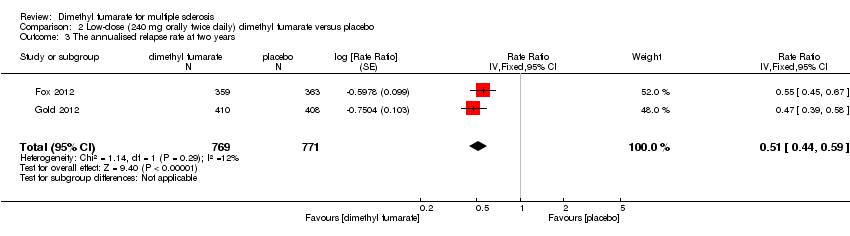
| 3 The annualised relapse rate at two years Show forest plot | 2 | 1540 | Rate Ratio (Fixed, 95% CI) | 0.51 [0.44, 0.59] |
|
| 4 The proportion of patients with disability worsening at two years Show forest plot | 2 | 1539 | Risk Ratio (M‐H, Fixed, 95% CI) | 0.65 [0.53, 0.81] |
|
| 5 The proportion of patients with disability worsening at two years (the likely‐case scenario) Show forest plot | 2 | 1546 | Risk Ratio (M‐H, Fixed, 95% CI) | 0.83 [0.73, 0.94] |
|
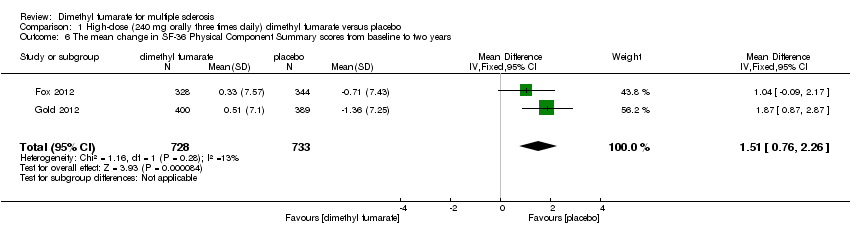
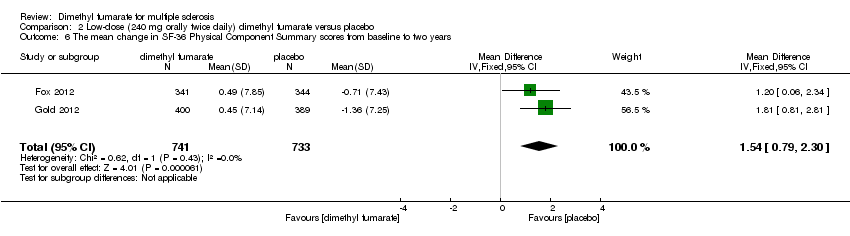
| 6 The mean change in SF‐36 Physical Component Summary scores from baseline to two years Show forest plot | 2 | 1474 | Mean Difference (IV, Fixed, 95% CI) | 1.54 [0.79, 2.30] |
|
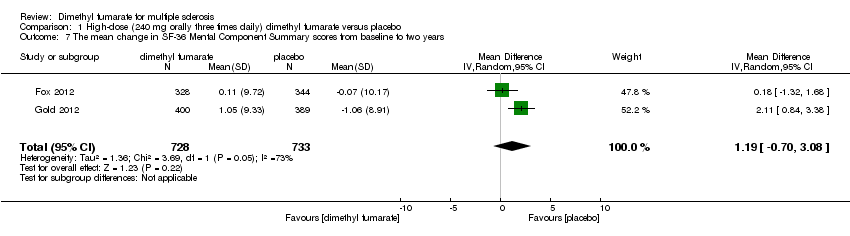
| 7 The mean change in SF‐36 Mental Component Summary scores from baseline to two years Show forest plot | 2 | 1474 | Mean Difference (IV, Fixed, 95% CI) | 0.93 [‐0.06, 1.93] |
|
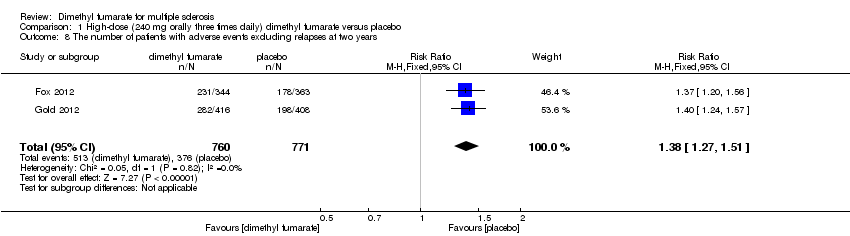
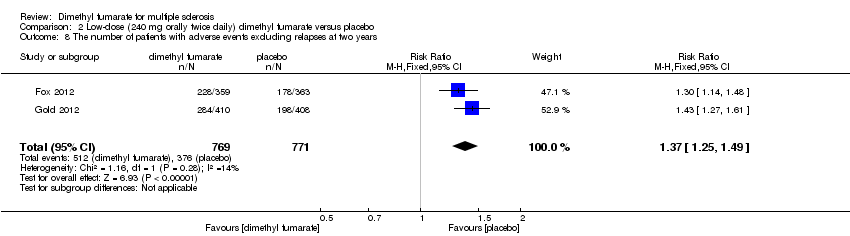
| 8 The number of patients with adverse events excluding relapses at two years Show forest plot | 2 | 1540 | Risk Ratio (M‐H, Fixed, 95% CI) | 1.37 [1.25, 1.49] |
|
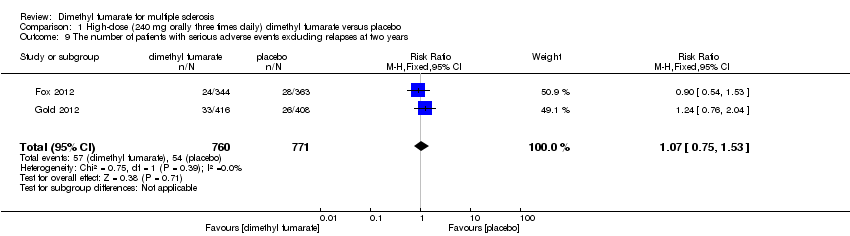
| 9 The number of patients with serious adverse events excluding relapses at two years Show forest plot | 2 | 1540 | Risk Ratio (M‐H, Random, 95% CI) | 1.05 [0.63, 1.74] |
|
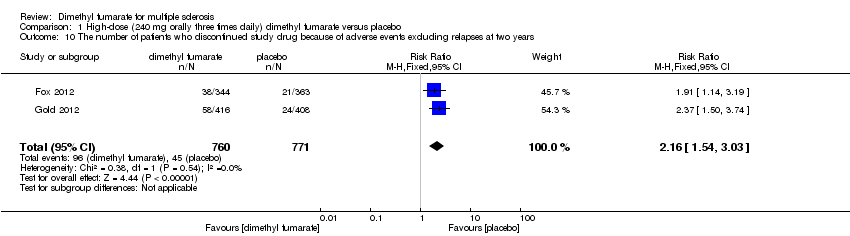
| 10 The number of patients who discontinued study drug because of adverse events excluding relapses at two years Show forest plot | 2 | 1540 | Risk Ratio (M‐H, Fixed, 95% CI) | 2.18 [1.56, 3.06] |
|
| 11 The number of patients with flushing at two years Show forest plot | 2 | 1540 | Risk Ratio (M‐H, Fixed, 95% CI) | 8.01 [5.66, 11.34] |
|
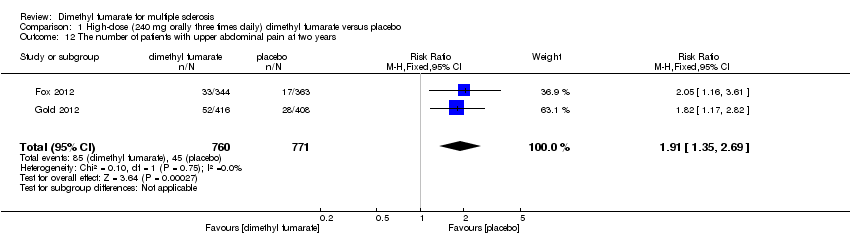
| 12 The number of patients with upper abdominal pain at two years Show forest plot | 2 | 1540 | Risk Ratio (M‐H, Fixed, 95% CI) | 1.69 [1.19, 2.41] |
|
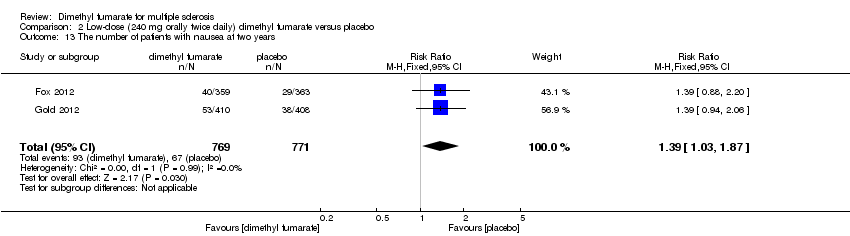
| 13 The number of patients with nausea at two years Show forest plot | 2 | 1540 | Risk Ratio (M‐H, Fixed, 95% CI) | 1.39 [1.03, 1.87] |
|
| 14 The number of patients with diarrhoea at two years Show forest plot | 2 | 1540 | Risk Ratio (M‐H, Random, 95% CI) | 1.31 [0.91, 1.87] |
|
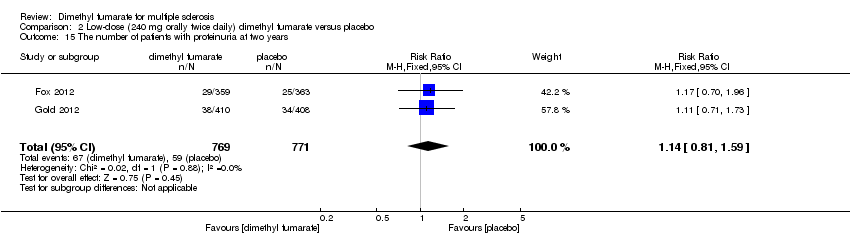
| 15 The number of patients with proteinuria at two years Show forest plot | 2 | 1540 | Risk Ratio (M‐H, Fixed, 95% CI) | 1.14 [0.81, 1.59] |
|
| 16 The number of patients with a decreased lymphocyte count of less than 0.5×10⁹ per litre at two years Show forest plot | 2 | 1540 | Risk Ratio (M‐H, Fixed, 95% CI) | 5.69 [2.40, 13.46] |
|
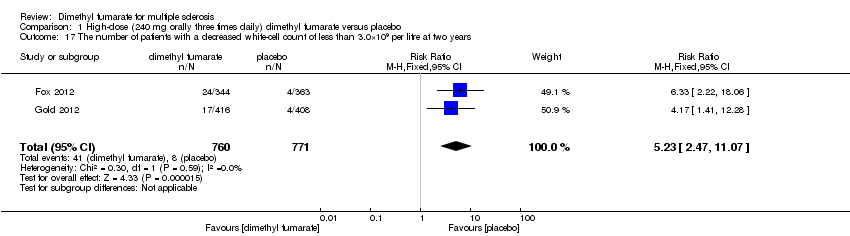
| 17 The number of patients with a decreased white‐cell count of less than 3.0×10⁹ per litre at two years Show forest plot | 2 | 1540 | Risk Ratio (M‐H, Fixed, 95% CI) | 6.53 [3.13, 13.64] |
|
| 18 The number of patients with an increased alanine aminotransferase level at least three times the upper limit of the normal range at two years Show forest plot | 2 | 1540 | Risk Ratio (M‐H, Random, 95% CI) | 1.33 [0.57, 3.07] |
|
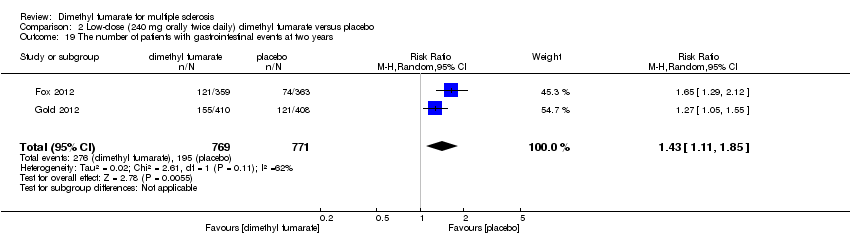
| 19 The number of patients with gastrointestinal events at two years Show forest plot | 2 | 1540 | Risk Ratio (M‐H, Random, 95% CI) | 1.43 [1.11, 1.85] |
|
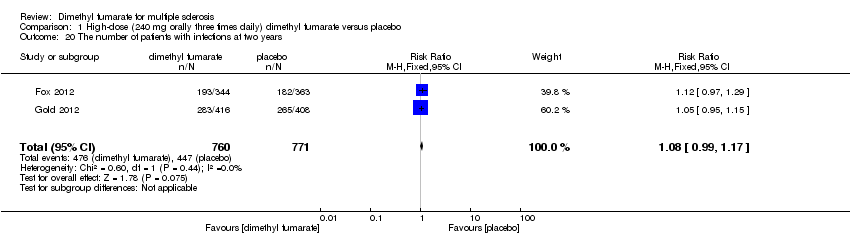
| 20 The number of patients with infections at two years Show forest plot | 2 | 1540 | Risk Ratio (M‐H, Random, 95% CI) | 1.04 [0.92, 1.18] |
|
| 21 The number of patients with serious infections at two years Show forest plot | 2 | 1540 | Risk Ratio (M‐H, Fixed, 95% CI) | 1.55 [0.73, 3.28] |
|