Terapias psicológicas para el trastorno de pánico con o sin agorafobia en adultos: un meta‐análisis en red
Información
- DOI:
- https://doi.org/10.1002/14651858.CD011004.pub2Copiar DOI

- Base de datos:
-
- Cochrane Database of Systematic Reviews
- Versión publicada:
-
- 13 abril 2016see what's new
- Tipo:
-
- Intervention
- Etapa:
-
- Review
- Grupo Editorial Cochrane:
-
Grupo Cochrane de Trastornos mentales comunes
- Copyright:
-
- Copyright © 2016 The Cochrane Collaboration. Published by John Wiley & Sons, Ltd.
Cifras del artículo
Altmetric:
Citado por:
Autores
Contributions of authors
TAF and AP conceived the study.
AP led the project under TAF supervision.
AP, TAF and GS worked on the protocol; HI, AT and OE provided suggestions and input.
GS and OE performed the statistical analyses.
AP and TAF worked on the review; HI, AT, OE and GS provided suggestions and input.
All authors reviewed and approved the final version of the review.
Declarations of interest
AP has no competing interests.
TAF has received honoraria for speaking at CME meetings sponsored by Asahi Kasei, Eli Lilly, GlaxoSmithKline, Mochida, MSD, Otsuka, Pfizer, Shionogi and Tanabe‐Mitsubishi. He is a diplomate of the Academy of Cognitive Therapy. He has received royalties from Igaku‐Shoin, Seiwa‐Shoten and Nihon Bunka Kagaku‐sha. He is on the advisory board for Sekisui Chemicals and Takeda Science Foundation. The Japanese Ministry of Education, Science, and Technology, the Japanese Ministry of Health, Labor and Welfare, and the Japan Foundation for Neuroscience and Mental Health have funded his research projects.
HI has no competing interests.
AT has received honoraria for speaking at a meeting sponsored by Eli Lilly.
OE has no competing interests.
GS has no competing interests.
Version history
| Published | Title | Stage | Authors | Version |
| 2016 Apr 13 | Psychological therapies for panic disorder with or without agoraphobia in adults: a network meta‐analysis | Review | Alessandro Pompoli, Toshi A Furukawa, Hissei Imai, Aran Tajika, Orestis Efthimiou, Georgia Salanti | |
| 2014 Feb 27 | Psychological therapies for panic disorder with or without agoraphobia in adults | Protocol | Alessandro Pompoli, Toshi A Furukawa, Hissei Imai, Aran Tajika, Orestis Efthimiou, Georgia Salanti | |
Differences between protocol and review
We first planned to use scale endpoint data, which typically cannot have negative values and are easier to interpret from a clinical point of view. However, as a post hoc decision, we decided to use change data in an attempt to reduce the amount of heterogeneity due to the baseline imbalance found across studies.
Keywords
MeSH
Medical Subject Headings (MeSH) Keywords
Medical Subject Headings Check Words
Adult; Humans;
PICO
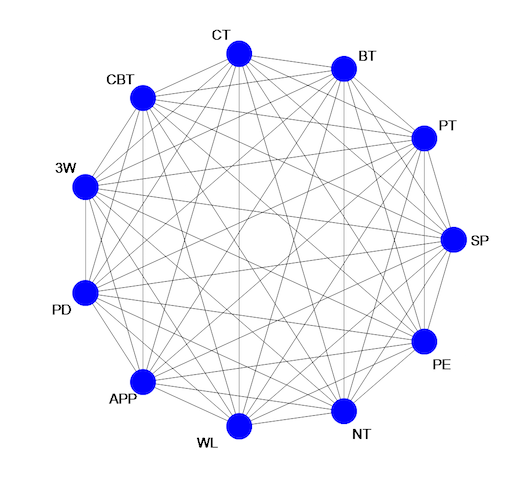
Ideal network of included treatment and control conditions.
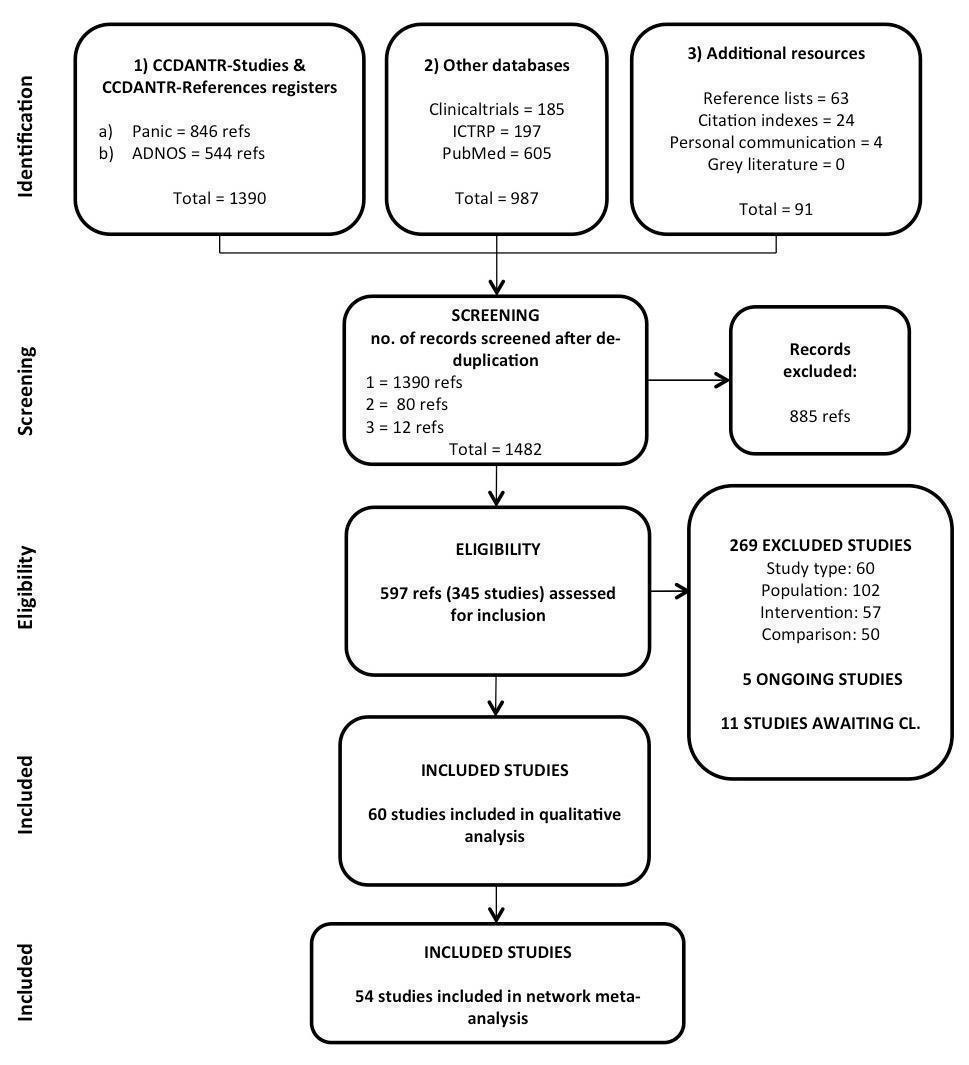
Study selection process: PRISMA flow diagram

'Risk of bias' graph: review authors' judgements about each risk of bias item presented as percentages across all included studies.

'Risk of bias' summary. Note that we left the boxes empty when the RoB assessment was not applicable (e.g. in the case of incomplete outcome data in the long term when the study did not report any long term measure that could be included in the analyses).

Short‐term remission: network plot

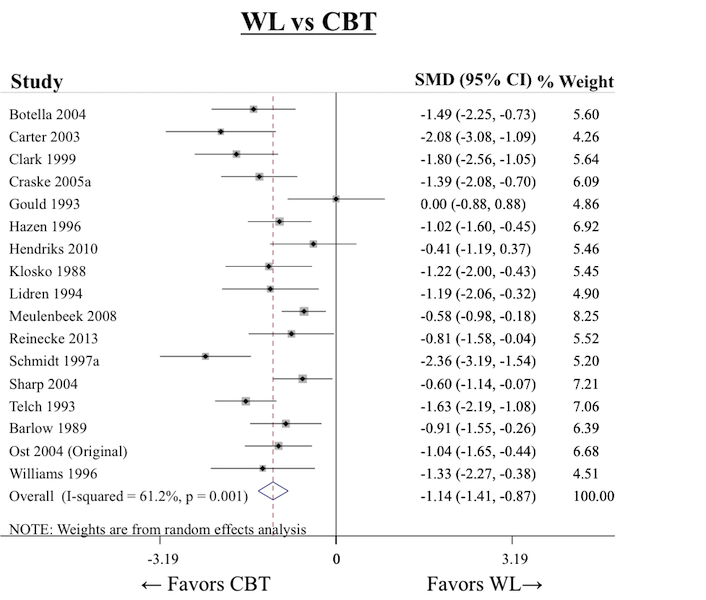
Short‐term remission: forest plot for the comparison WL vs CBT
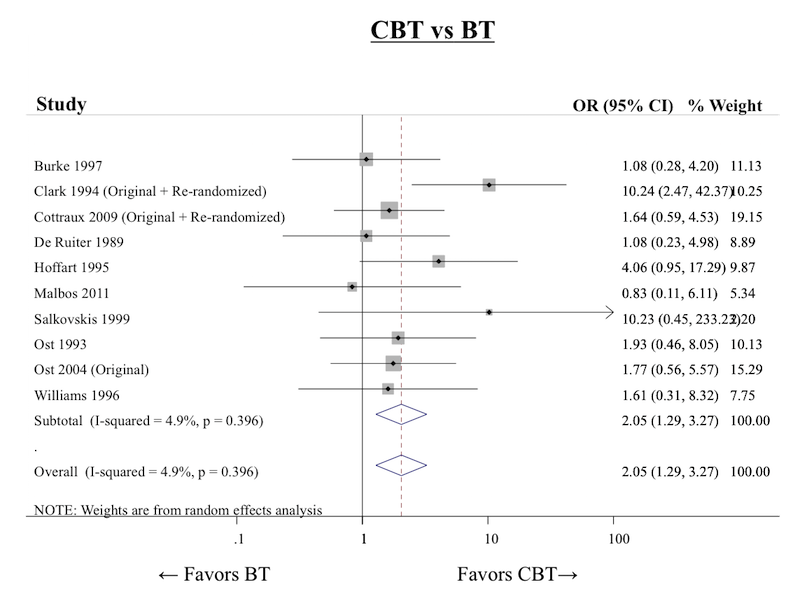
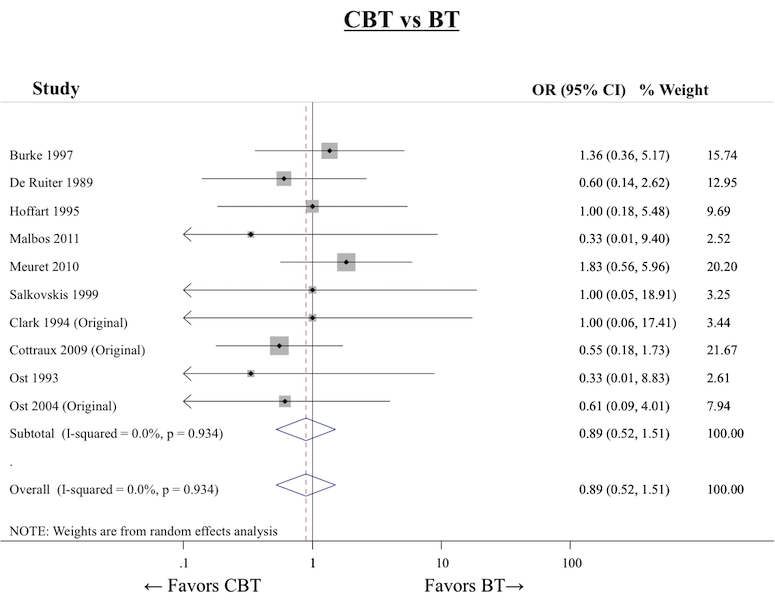
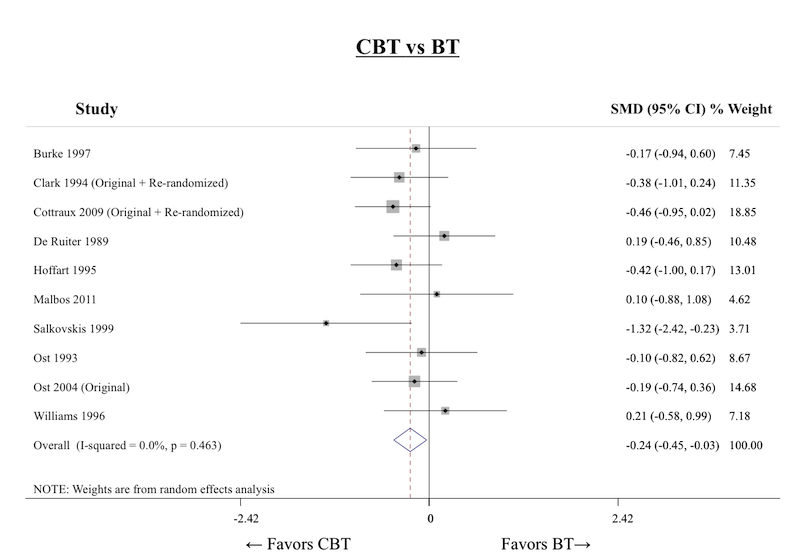
Short‐term remission: forest plot for the comparison CBT vs BT
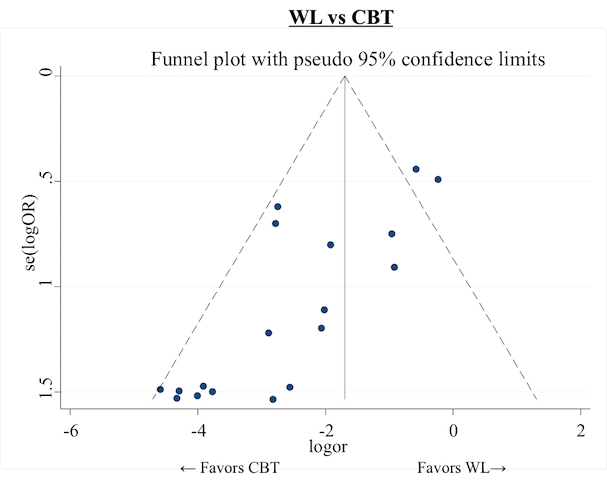
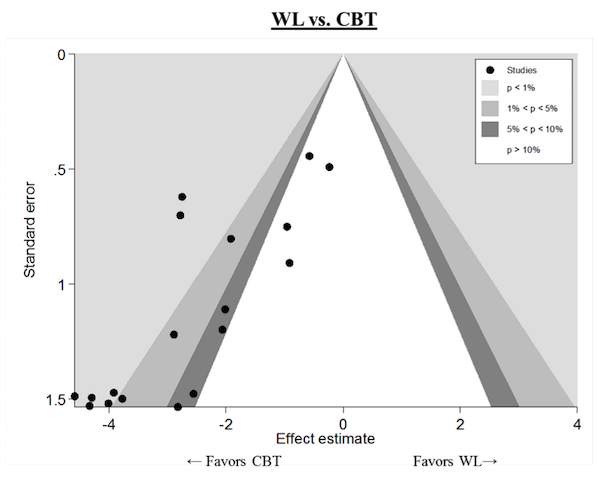
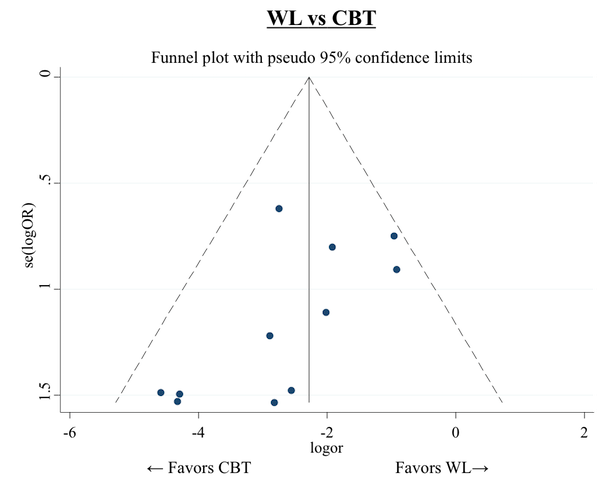
Short‐term remission: funnel plot for the comparison CBT vs WL
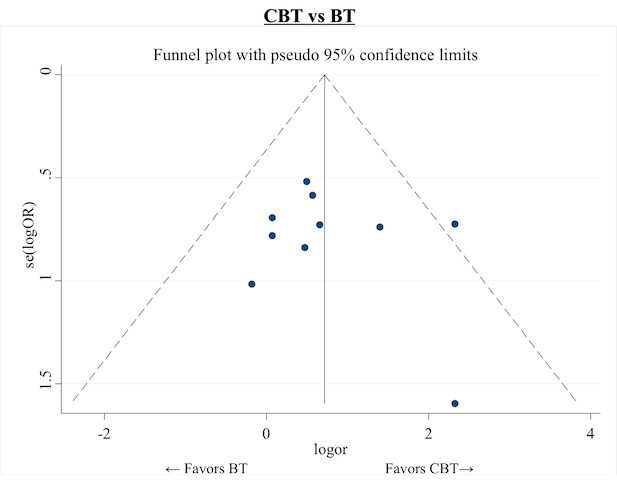
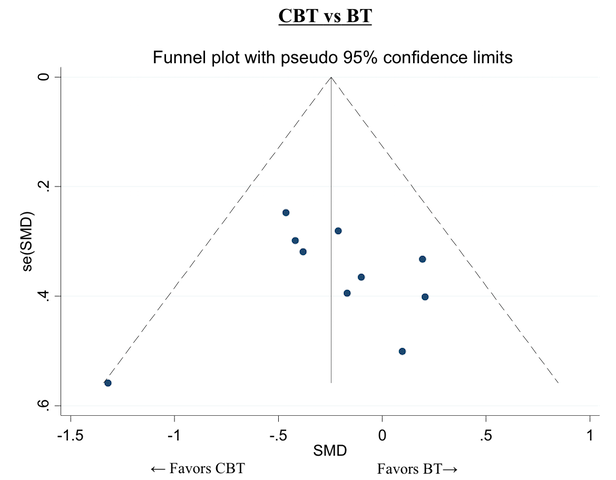
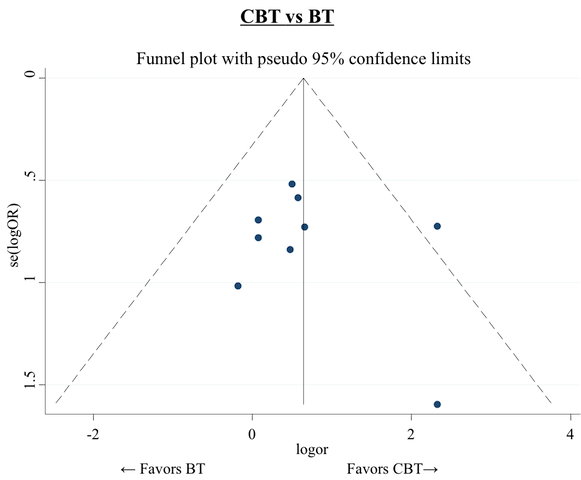
Short‐term remission: funnel plot for the comparison CBT vs BT
Short‐term remission: contour‐enhanced funnel plot for the comparison CBT vs WL

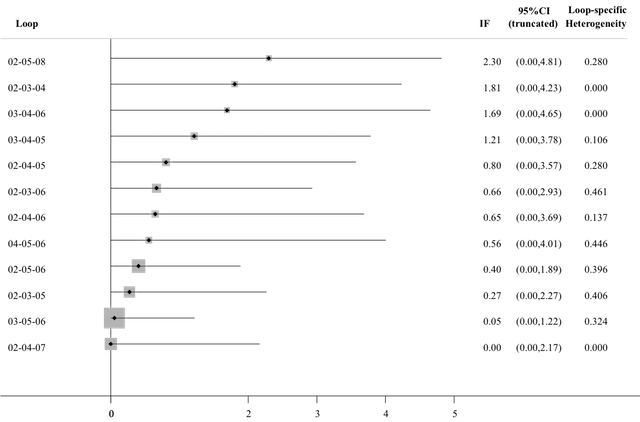
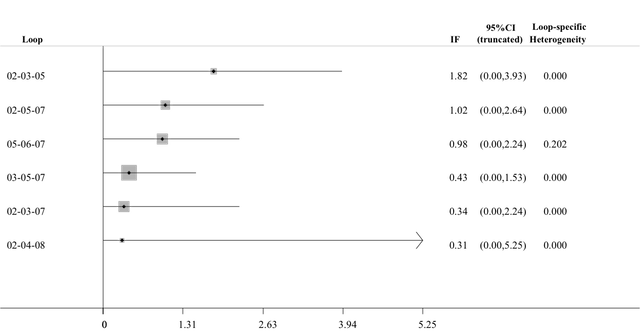
Short‐term remission: inconsistency factors for the network

Short‐term response: network plot

Short‐term response: forest plot for the comparison WL vs CBT

Short‐term response: forest plot for the comparison CBT vs BT

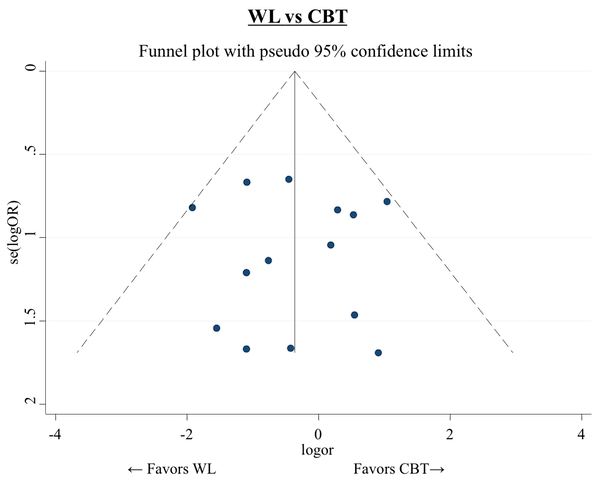
Short‐term response: funnel plot for the comparison WL vs CBT
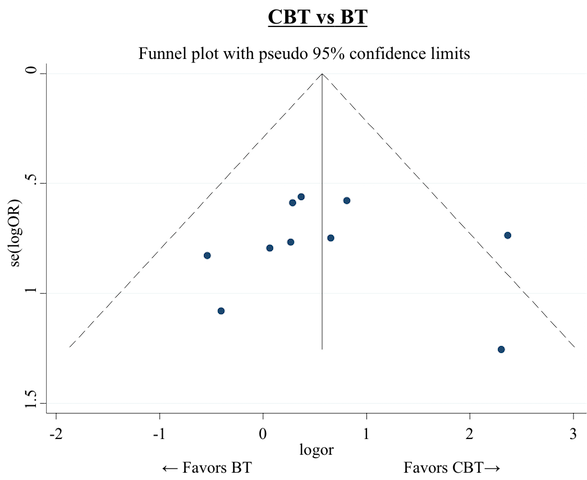
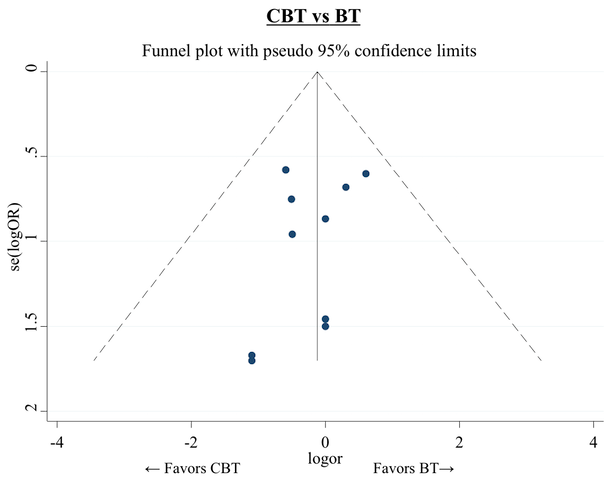
Short‐term response: funnel plot for the comparison CBT vs BT
Short‐term response: inconsistency factors for the network

Short‐term dropouts: network plot

Short‐term dropouts: forest plot for the comparison WL vs CBT
Short‐term dropouts: forest plot for the comparison CBT vs BT
Short‐term dropouts: funnel plot for the comparison WL vs CBT
Short‐term dropouts: funnel plot for the comparison CBT vs BT
Short‐term dropouts: inconsistency factors for the network

Short‐term improvement: network plot
Short‐term improvement: forest plot for the comparison WL vs CBT
Short‐term improvement: forest plot for the comparison CBT vs BT

Short‐term improvement: funnel plot for the comparison WL vs CBT
Short‐term improvement: funnel plot for the comparison CBT vs BT

Short‐term improvement: inconsistency factors for the network

Long‐term remission/response: network plot

Long‐term remission/response: inconsistency factors for the network

Subgroup analysis: number of treatment sessions, forest plot for the comparison WL vs CBT
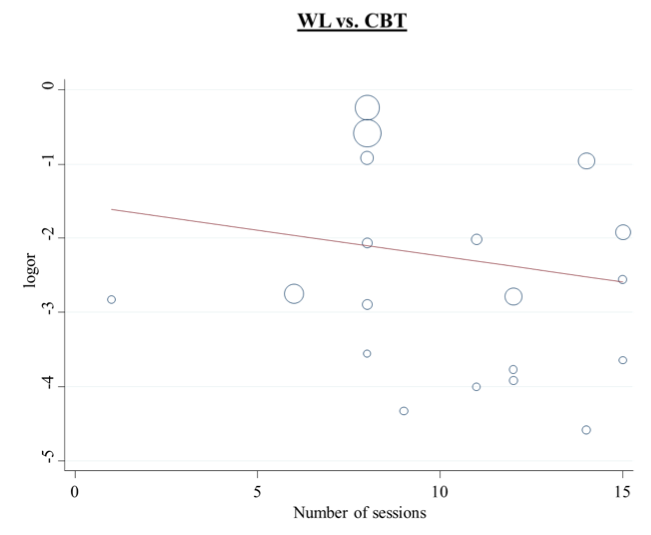
Subgroup analysis: number of treatment sessions, regression line for the comparison WL vs CBT

Subgroup analysis: number of treatment sessions, forest plot for the comparison CBT vs BT

Subgroup analysis: number of treatment sessions, regression line for the comparison CBT vs BT
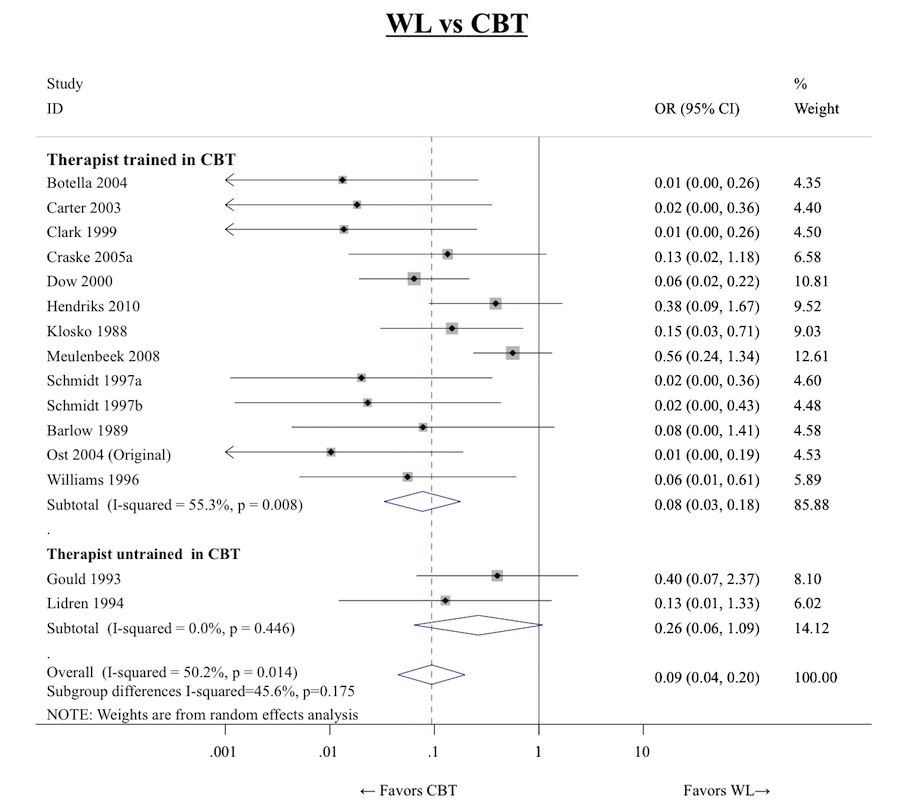
Subgroup analysis: therapist training, forest plots for the comparison WL vs CBT

Subgroup analysis: therapist training, forest plot for the comparison CBT vs BT
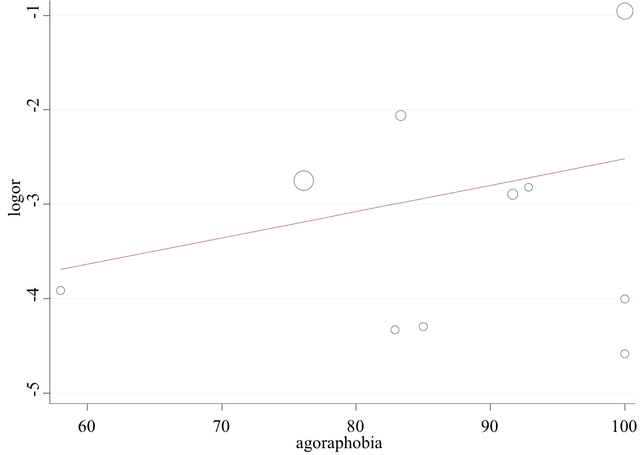
Subgroup analysis: percentage of agoraphobic patients, regression line for the comparison WL vs CBT

Subgroup analysis: percentage of depressed patients, regression line for the comparison WL vs CBT

Subgroup analysis: percentage of drug‐treated patients, regression line for the comparison WL vs CBT

Sensitivity analyses: network plot for short‐term remission excluding from the analyses group therapy trials

Sensitivity analyses: forest plot for the comparison WL vs CBT excluding group therapy trials

Sensitivity analyses: forest plot for the comparison CBT vs BT excluding group therapy trials
Sensitivity analyses: funnel plot for the comparison WL vs CBT excluding group therapy trials
Sensitivity analyses: forest plot for the comparison CBT vs BT excluding group therapy trials

Sensitivity analyses: inconsistency factors for the network of short‐term remission excluding from the analyses group therapy trials

Sensitivity analyses: network plot for short‐term remission excluding from the analyses trials in which a concomitant pharmacotherapy is allowed

Sensitivity analyses: network plot for short‐term remission excluding from the analyses trials in which pharmacotherapy stabilisation was not required
| Cognitive behaviour therapy compared to no treatment for panic disorder with or without agoraphobia in adults | |||||
| Patient or population: adult patients with panic disorder with or without agoraphobia Setting: outpatients | |||||
| Outcomes | Illustrative comparative risks* (95% CI) | Relative effect | No of participants | Quality of the evidence | |
| Assumed risk | Corresponding risk | ||||
| No treatment (NT) | Cognitive‐behavioral therapy (CBT) | ||||
| Short‐term remission (follow‐up: mean 3 months) | Study population | OR 2.78 | No direct evidence available: indirect evidence based on 357 participants (2 studies via CT; 5 studies via PT)a | ⊕⊝⊝⊝ | |
| 36 per 100 | 61 per 100 | ||||
| Short‐term response (follow‐up: mean 3 months) | Study population | OR 7.14 | No direct evidence available: indirect evidence based on 357 participants (2 studies via CT; 5 studies via PT)a | ⊕⊝⊝⊝ | |
| 36 per 100 | 80 per 100 | ||||
| Short‐term dropouts (follow‐up: mean 3 months) | Study population | OR 6.25 | No direct evidence available: indirect evidence based on 278 participants (4 studies via PT)a | ⊕⊝⊝⊝ | |
| 1 per 100 (no events were observed in the available direct evidence: this percentage was assumed in order to calculate the corresponding risk) | 6 per 100 | ||||
| Long‐term remission/response (follow‐up: mean 12 months) | No data available for this comparison | ‐ | ‐ | ‐ | ‐ |
| Short‐term improvement as measured on a continuous scale (follow‐up: mean 3 months) | The mean short‐term improvement as measured on a continuous scale in the control group was 0 | The mean short‐term improvement, measured on a continuous scale as SMD (NMA results), was ‐0.83 (95% CI ‐1.5 to ‐0.16), indicating a large effect size in favour of CBT | ‐ | 27 participants | ⊕⊕⊝⊝ |
| Reported ORs are derived (as reciprocal values) from the results of network meta‐analyses presented in Table 1, Table 4 and Table 7 (for ST‐remission and ST‐response we used the results of NMA adjusted for SSE). Reported SMD is derived from the results of network meta‐analysis presented in Table 10. aIndirect comparison is performed using all possible intermediate comparisons in the network. For brevity we report the number of studies contributing indirect evidence only via a single intermediate comparator. *The basis for the assumed risk (e.g. the median control group risk across studies) is provided in footnotes. The corresponding risk (and its 95% confidence interval) is based on the assumed risk in the comparison group and the relative effect of the intervention (and its 95% CI). | |||||
| GRADE Working Group grades of evidence | |||||
| We downgraded the quality of the evidence one step at a time when one or more of the following criticisms was present: 1Only indirect evidence is available for this outcome. 2Wide 95% CI. 3The risk of bias of indirect evidence is often unclear. 4The risk of bias in the included study was unclear in almost every domain. 5Only one study, with a small sample size, available for direct comparison. | |||||
| Cognitive behaviour therapy compared to supportive psychotherapy for panic disorder with or without agoraphobia in adults | |||||
| Patient or population: adult patients with panic disorder with or without agoraphobia Setting: outpatients | |||||
| Outcomes | Illustrative comparative risks* (95% CI) | Relative effect | No of participants | Quality of the evidence | |
| Assumed risk | Corresponding risk | ||||
| Supportive psychotherapy (SP) | Cognitive behaviour therapy (CBT) | ||||
| Short‐term remission (follow‐up: mean 3 months) | Study population | OR 0.67 | 176 | ⊕⊕⊝⊝ | |
| 38 per 100 | 29 per 100 | ||||
| Short‐term response (follow‐up: mean 3 months) | Study population | OR 1.12 | 176 | ⊕⊝⊝⊝ | |
| 32 per 100 | 34 per 100 | ||||
| Short‐term dropouts (follow‐up: mean 3 months) | Study population | OR 0.64 | 176 | ⊕⊝⊝⊝ | |
| 46 per 100 | 35 per 100 | ||||
| Long‐term remission/response (follow‐up: mean 12 months) | Study population | OR 2.09 | 80 | ⊕⊕⊝⊝ | |
| 24 per 100 | 40 per 100 | ||||
| Short‐term improvement as measured on a continuous scale (follow‐up: mean 3 months) | The mean short‐term improvement as measured on a continuous scale in the control group was 0 | The mean short‐term improvement, measured on a continuous scale as SMD (NMA results), was ‐0.05 (95% CI ‐0.56 to 0.47), indicating almost no difference between CBT and SP (the negative value of the point estimate indicates a slight trend in favour of CBT) | ‐ | 152 | ⊕⊕⊝⊝ |
| Reported ORs and SMD are derived from the network meta‐analyses. *The basis for the assumed risk (e.g. the median control group risk across studies) is provided in footnotes. The corresponding risk (and its 95% confidence interval) is based on the assumed risk in the comparison group and the relative effect of the intervention (and its 95% CI). | |||||
| GRADE Working Group grades of evidence | |||||
| We downgraded the quality of the evidence one step at a time when one or more of the following criticisms was present: 1Risk of bias for the included studies was in many cases unclear. 2Only a few studies available for direct comparison. 95% CI still wide and non‐significant even after combining direct and indirect evidence. 3Results were inconsistent across studies, although with wide confidence intervals. 4ST‐response data were imputed from the continuous outcome for all the included studies. 5Only one study available for direct comparison. 95% CI still wide and non‐significant even after combining direct and indirect evidence. | |||||
| Cognitive behaviour therapy compared to psychodynamic psychotherapy for panic disorder with or without agoraphobia in adults | |||||
| Patient or population: adult patients with panic disorder with or without agoraphobia Setting: outpatients | |||||
| Outcomes | Illustrative comparative risks* (95% CI) | Relative effect | No of participants | Quality of the evidence | |
| Assumed risk | Corresponding risk | ||||
| Psychodynamic psychotherapy (PD) | Cognitive behaviour therapy (CBT) | ||||
| Short‐term remission (follow‐up: mean 3 months) | Study population | OR 0.94 | 54 | ⊕⊝⊝⊝ | |
| 44 per 100 | 43 per 100 | ||||
| Short‐term response (follow‐up: mean 3 months) | Study population | OR 1.05 | 54 | ⊕⊝⊝⊝ | |
| 47 per 100 | 48 per 100 | ||||
| Short‐term dropouts (follow‐up: mean 3 months) | Study population | OR 1.92 | 54 | ⊕⊝⊝⊝ | |
| 19 per 100 | 32 per 100 | ||||
| Long‐term remission/response (follow‐up: mean 12 months) | Study population | OR 1.25 | 54 | ⊕⊕⊝⊝ | |
| 50 per 100 | 56 per 100 | ||||
| Short‐term improvement as measured on a continuous scale (follow‐up: mean 3 months) | The mean short‐term improvement as measured on a continuous scale in the control group was 0 | The mean short‐term improvement as measured on a continuous scale in the intervention group was 0.17 standard deviations higher (0.5 lower to 0.83 higher), indicating a small effect size in favour of PDb | ‐ | 54 | ⊕⊝⊝⊝ |
| a Reported ORs are derived (as reciprocal values) from the results of network meta‐analyses presented in Table 1, Table 4, Table 7 and Table 13 (for ST‐remission and ST‐response we used the results of NMA adjusted for SSE). b Reported SMD is derived from the results of network meta‐analysis presented in Table 10. *The basis for the assumed risk (e.g. the median control group risk across studies) is provided in footnotes. The corresponding risk (and its 95% confidence interval) is based on the assumed risk in the comparison group and the relative effect of the intervention (and its 95% CI). | |||||
| GRADE Working Group grades of evidence | |||||
| We downgraded the quality of the evidence one step at a time when one or more of the following criticisms was present: 1The available direct evidence was affected by a high risk of bias in various important domains. 2Relevant (although non‐significant) inconsistency was found in the loop PD‐CBT‐PT. 3Indirect evidence importantly influences the NMA results. 4Only one study available for direct comparison. 95% CI still wide and non‐significant even after combining direct and indirect evidence. 5Statistically significant inconsistency was found in the loop PD‐CBT‐PT. | |||||
| NMA Rankings of psychological therapies for panic disorder with or without agoraphobia in adults | |||
| Patient or population: adult patients with panic disorder with or without agoraphobia Setting: outpatients | |||
| Outcomes | Treatment hierarchy (in descending order) | № of participants | Quality of the evidence |
| Short‐term remission | (SP)‐CBT‐PD‐CT‐BT‐PT‐NT‐WL | 2491 | ⊕⊕⊝⊝ |
| Short‐term response | CBT‐PD‐(SP)‐BT‐PT‐WL‐CT‐NT | 2240 | ⊕⊕⊝⊝ |
| Short‐term dropouts | NT‐PD‐WL‐3W‐CBT‐APP‐PE‐PT‐CT‐BT‐SP | 2535 | ⊕⊕⊝⊝ |
| Long‐term remission/response | CBT‐PD‐PT‐BT‐SP‐CT | 464 | ⊕⊕⊝⊝ |
| Short‐term improvement as measured on a continuous scale | (PD)‐CBT‐SP‐CT‐3W‐BT‐PT‐NT‐WL | 2318 | ⊕⊕⊝⊝ |
| Reported rankings are based on absolute SUCRA values, which are derived from network meta‐analyses (NMA). The ranking of treatments reported in parenthesis must be interpreted with caution, because the evidence supporting those rankings is either too scarce or hampered by relevant inconsistency. The assessment of quality of evidence has been made by adapting the GRADE tool, designed for pairwise meta‐analyses, to network meta‐analyses, as suggested in Salanti 2014. | |||
| GRADE Working Group grades of evidence | |||
| 1 Downgraded for study limitations because the risk of bias was unclear or high in more than one important domain for many of the included studies. 2 Downgraded for imprecision because too few comparisons remained clinically important after adjusting the results of NMA for SSE (See additional Table 1 and Table 4) 3 Downgraded for imprecision because too few comparisons showed clinically important results in NMA (See additional Table 7, Table 10 and Table 14) | |||
| Comparison (X vs Y) | Pairwise meta‐analyses (common τ = 0.69) | Standard NMA (τ = 0.64) | ΝΜΑ adjusted for SSE (τ = 0.59) | |||||||
| # of studies | OR | CI (lower) | CI (upper) | OR | CI (lower) | CI (upper) | OR | CrI (lower) | CrI (upper) | |
| PT vs SP | ‐ | ‐ | ‐ | ‐ | 0.36 | 0.11 | 1.18 | 0.35 | 0.10 | 1.11 |
| BT vs SP | ‐ | ‐ | ‐ | ‐ | 0.37 | 0.12 | 1.15 | 0.38 | 0.12 | 1.19 |
| BT vs PT | 2 | 1.11 | 0.21 | 6.00 | 1.03 | 0.42 | 2.28 | 1.10 | 0.51 | 2.50 |
| CT vs SP | ‐ | ‐ | ‐ | ‐ | 0.47 | 0.11 | 2.07 | 0.44 | 0.10 | 1.90 |
| CT vs PT | 1 | 1.22 | 0.20 | 7.48 | 1.33 | 0.44 | 4.05 | 1.27 | 0.41 | 3.91 |
| CT vs BT | 1 | 0.95 | 0.12 | 7.47 | 1.29 | 0.41 | 4.07 | 1.15 | 0.37 | 3.61 |
| CBT vs SP | 3 | 0.68 | 0.24 | 1.91 | 0.68 | 0.25 | 1.83 | 0.67 | 0.25 | 1.82 |
| CBT vs PT | 4 | 1.56 | 0.62 | 3.94 | 1.90 | 0.98 | 3.69 | 1.95 | 1.02 | 3.97 |
| CBT vs BT | 10 | 2.09 | 1.10 | 3.97 | 1.84 | 1.06 | 3.22 | 1.77 | 1.02 | 3.11 |
| CBT vs CT | 1 | 1.69 | 0.21 | 13.47 | 1.43 | 0.48 | 4.23 | 1.53 | 0.52 | 4.68 |
| WL vs SP | ‐ | ‐ | ‐ | ‐ | 0.08 | 0.03 | 0.26 | 0.22 | 0.06 | 0.78 |
| WL vs PT | 4 | 0.21 | 0.06 | 0.70 | 0.23 | 0.12 | 0.48 | 0.64 | 0.27 | 1.65 |
| WL vs BT | 3 | 0.12 | 0.04 | 0.43 | 0.23 | 0.12 | 0.45 | 0.58 | 0.25 | 1.36 |
| WL vs CT | 2 | 0.12 | 0.02 | 0.61 | 0.18 | 0.06 | 0.52 | 0.50 | 0.15 | 1.77 |
| WL vs CBT | 18 | 0.13 | 0.07 | 0.22 | 0.12 | 0.07 | 0.21 | 0.33 | 0.16 | 0.69 |
| NT vs SP | ‐ | ‐ | ‐ | ‐ | 0.26 | 0.04 | 1.82 | 0.24 | 0.03 | 1.67 |
| NT vs PT | 1 | 0.70 | 0.11 | 4.33 | 0.73 | 0.14 | 3.68 | 0.70 | 0.14 | 3.48 |
| NT vs BT | ‐ | ‐ | ‐ | ‐ | 0.71 | 0.13 | 3.96 | 0.64 | 0.11 | 3.51 |
| NT vs CT | 1 | 0.57 | 0.09 | 3.48 | 0.55 | 0.11 | 2.73 | 0.55 | 0.11 | 2.71 |
| NT vs CBT | ‐ | ‐ | ‐ | ‐ | 0.38 | 0.07 | 2.05 | 0.36 | 0.07 | 1.85 |
| NT vs WL | ‐ | ‐ | ‐ | ‐ | 3.11 | 0.58 | 16.78 | 1.10 | 0.18 | 6.26 |
| PD vs SP | ‐ | ‐ | ‐ | ‐ | 0.71 | 0.14 | 3.52 | 0.71 | 0.14 | 3.42 |
| PD vs PT | 1 | 4.21 | 0.70 | 25.49 | 1.99 | 0.57 | 7.02 | 2.05 | 0.60 | 7.38 |
| PD vs BT | ‐ | ‐ | ‐ | ‐ | 1.94 | 0.50 | 7.48 | 1.88 | 0.48 | 7.17 |
| PD vs CT | ‐ | ‐ | ‐ | ‐ | 1.50 | 0.30 | 7.43 | 1.61 | 0.33 | 8.17 |
| PD vs CBT | 1 | 0.51 | 0.09 | 2.99 | 1.05 | 0.30 | 3.68 | 1.06 | 0.29 | 3.66 |
| PD vs WL | ‐ | ‐ | ‐ | ‐ | 8.50 | 2.27 | 31.84 | 3.21 | 0.75 | 12.87 |
| PD vs NT | ‐ | ‐ | ‐ | ‐ | 2.73 | 0.36 | 20.56 | 2.91 | 0.40 | 22.56 |
| OR (X vs Y) is defined as (Odds X)/(Odds Y). For each comparison X vs Y, an OR greater than one favours treatment X, an OR less than one favours treatment Y. Note that in the main text, where necessary, we inverted the values presented in Table 4 for an easier presentation, in which an OR greater than 1 stands for a higher number of events (short‐term remissions) in the intervention group when compared to the control group. Statistically significant results are written in bold. BT: behaviour therapy | ||||||||||
| Comparison | I2(%) | 95% CI |
| CBT vs SP | 0 | 0 to 90 |
| WL vs CBT | 58 | 29 to 75 |
| CBT vs BT | 5 | 0 to 64 |
| WL vs BT | 34 | 0 to 78 |
| WL vs PT | 56 | 0 to 85 |
| CBT vs PT | 0 | 0 to 85 |
| This values refer to standard meta‐analyses, where each comparison has its own heterogeneity variance. BT: behaviour therapy | ||
| Treatment | SUCRA |
| SP | 88 |
| CBT | 76 |
| PD | 73 |
| CT | 50 |
| BT | 41 |
| PT | 35 |
| NT | 25 |
| WL | 13 |
| BT: behaviour therapy | |
| Comparison (X vs Y) | Pairwise meta‐analyses (common τ = 0.55) | Standard NMA (τ = 0.63) | NMA adjusted for SSE (τ = 0.65) | |||||||
| # of studies | OR | CI (lower) | CI (upper) | OR | CI (lower) | CI (upper) | OR | CrI (lower) | CrI (upper) | |
| PT vs SP | ‐ | ‐ | ‐ | ‐ | 0.68 | 0.20 | 2.31 | 0.69 | 0.20 | 2.41 |
| BT vs SP | ‐ | ‐ | ‐ | ‐ | 0.589 | 0.18 | 1.93 | 0.69 | 0.21 | 2.33 |
| BT vs PT | 2 | 0.90 | 0.21 | 3.90 | 0.87 | 0.41 | 1.88 | 1.00 | 0.46 | 2.23 |
| CT vs SP | ‐ | ‐ | ‐ | ‐ | 0.39 | 0.07 | 2.07 | 0.36 | 0.07 | 1.96 |
| CT vs PT | 1 | 0.94 | 0.18 | 4.97 | 0.58 | 0.16 | 2.09 | 0.53 | 0.14 | 2.04 |
| CT vs BT | 1 | 0.20 | 0.03 | 1.46 | 0.66 | 0.18 | 2.51 | 0.53 | 0.13 | 2.07 |
| CBT vs SP | 3 | 1.02 | 0.38 | 2.73 | 1.04 | 0.36 | 2.99 | 1.12 | 0.40 | 3.26 |
| CBT vs PT | 4 | 1.23 | 0.56 | 2.71 | 1.54 | 0.81 | 2.94 | 1.62 | 0.84 | 3.17 |
| CBT vs BT | 10 | 1.78 | 1.00 | 3.18 | 1.77 | 1.02 | 3.04 | 1.61 | 0.92 | 2.86 |
| CBT vs CT | 1 | 2.92 | 0.43 | 19.98 | 2.65 | 0.73 | 9.62 | 3.08 | 0.81 | 12.26 |
| WL vs SP | ‐ | ‐ | ‐ | ‐ | 0.17 | 0.05 | 0.53 | 0.45 | 0.12 | 1.93 |
| WL vs PT | 4 | 0.15 | 0.05 | 0.44 | 0.25 | 0.12 | 0.50 | 0.65 | 0.24 | 1.91 |
| WL vs BT | 4 | 0.32 | 0.14 | 0.73 | 0.29 | 0.15 | 0.54 | 0.65 | 0.28 | 1.68 |
| WL vs CT | 1 | 0.31 | 0.02 | 4.27 | 0.43 | 0.12 | 1.61 | 1.24 | 0.26 | 6.42 |
| WL vs CBT | 17 | 0.19 | 0.05 | 0.31 | 0.16 | 0.10 | 0.26 | 0.40 | 0.18 | 1.00 |
| NT vs SP | ‐ | ‐ | ‐ | ‐ | 0.16 | 0.02 | 1.21 | 0.15 | 0.02 | 1.22 |
| NT vs PT | 1 | 0.31 | 0.06 | 1.62 | 0.24 | 0.05 | 1.25 | 0.22 | 0.04 | 1.25 |
| NT vs BT | ‐ | ‐ | ‐ | ‐ | 0.27 | 0.05 | 1.59 | 0.22 | 0.03 | 1.37 |
| NT vs CT | 1 | 0.33 | 0.06 | 1.68 | 0.41 | 0.08 | 2.13 | 0.42 | 0.07 | 2.31 |
| NT vs CBT | ‐ | ‐ | ‐ | ‐ | 0.16 | 0.03 | 0.87 | 0.14 | 0.02 | 0.80 |
| NT vs WL | ‐ | ‐ | ‐ | ‐ | 0.96 | 0.17 | 5.46 | 0.33 | 0.04 | 2.32 |
| PD vs SP | ‐ | ‐ | ‐ | ‐ | 1.02 | 0.20 | 5.28 | 1.07 | 0.20 | 5.70 |
| PD vs PT | 1 | 4.22 | 0.84 | 21.31 | 1.51 | 0.42 | 5.35 | 1.54 | 0.42 | 5.92 |
| PD vs BT | ‐ | ‐ | ‐ | ‐ | 1.73 | 0.44 | 6.70 | 1.54 | 0.37 | 6.41 |
| PD vs CT | ‐ | ‐ | ‐ | ‐ | 2.59 | 0.45 | 14.82 | 2.94 | 0.47 | 18.59 |
| PD vs CBT | 1 | 0.34 | 0.07 | 1.76 | 0.98 | 0.27 | 3.47 | 0.95 | 0.25 | 3.60 |
| PD vs WL | ‐ | ‐ | ‐ | ‐ | 6.02 | 1.60 | 22.61 | 2.37 | 0.49 | 10.75 |
| PD vs NT | ‐ | ‐ | ‐ | ‐ | 6.28 | 0.80 | 49.20 | 7.03 | 0.84 | 61.98 |
| OR (X vs Y) is defined as (Odds X)/(Odds Y). For each comparison X vs Y, an OR greater than one favours treatment X, an OR less than one favours treatment Y. Note that in the main text, where necessary, we inverted the values presented in Table 4 for an easier presentation, in which an OR greater than 1 stands for a higher number of events (short‐term remissions) in the intervention group when compared to the control group. Statistically significant results are written in bold. BT: behaviour therapy | ||||||||||
| Comparison | I2(%) | 95% CI |
| CBT vs SP | 7 | 0 to 90 |
| WL vs CBT | 39 | 0 to 66 |
| CBT vs BT | 22 | 0 to 62 |
| WL vs BT | 26 | 0 to 72 |
| WL vs PT | 14 | 0 to 87 |
| CBT vs PT | 45 | 0 to 82 |
| This values refer to standard meta‐analyses, where each comparison has its own heterogeneity variance. BT: behaviour therapy | ||
| Treatment | SUCRA |
| CBT | 84 |
| PD | 74 |
| SP | 72 |
| BT | 53 |
| PT | 52 |
| WL | 31 |
| CT | 27 |
| NT | 7 |
| BT: behaviour therapy | |
| Comparison | Pairwise meta‐analysis | Network meta‐analysis (τ = 0.33) | |||||
| # of studies | OR | CI (lower) | CI (upper) | OR | CI (lower) | CI (upper) | |
| PT vs SP | ‐ | ‐ | ‐ | ‐ | 0.76 | 0.28 | 2.08 |
| BT vs SP | ‐ | ‐ | ‐ | ‐ | 0.92 | 0.35 | 2.28 |
| BT vs PT | 2 | 2.19 | 0.46 | 10.38 | 1.20 | 0.60 | 2.40 |
| CT vs SP | ‐ | ‐ | ‐ | ‐ | 1.06 | 0.20 | 5.62 |
| CT vs PT | 1 | 5.59 | 0.59 | 52.73 | 1.38 | 0.33 | 5.86 |
| CT vs BT | ‐ | ‐ | ‐ | ‐ | 1.15 | 0.26 | 5.20 |
| CBT vs SP | 3 | 0.63 | 0.21 | 1.89 | 0.64 | 0.28 | 1.43 |
| CBT vs PT | 3 | 0.56 | 0.24 | 1.28 | 0.83 | 0.46 | 1.50 |
| CBT vs BT | 10 | 0.89 | 0.52 | 1.51 | 0.69 | 0.42 | 1.15 |
| CBT vs CT | ‐ | ‐ | ‐ | ‐ | 0.60 | 0.14 | 2.60 |
| WL vs SP | ‐ | ‐ | ‐ | ‐ | 0.48 | 0.19 | 1.22 |
| WL vs PT | 5 | 0.74 | 0.30 | 1.83 | 0.63 | 0.35 | 1.15 |
| WL vs BT | 4 | 0.34 | 0.16 | 0.69 | 0.52 | 0.30 | 0.93 |
| WL vs CT | ‐ | ‐ | ‐ | ‐ | 0.46 | 0.11 | 1.97 |
| WL vs CBT | 14 | 0.70 | 0.42 | 1.16 | 0.76 | 0.48 | 1.20 |
| NT vs SP | ‐ | ‐ | ‐ | ‐ | 0.10 | 0.00 | 2.18 |
| NT vs PT | 1 | 0.29 | 0.01 | 7.51 | 0.13 | 0.01 | 3.10 |
| NT vs BT | ‐ | ‐ | ‐ | ‐ | 0.11 | 0.00 | 2.69 |
| NT vs CT | 1 | 0.07 | 0.00 | 1.37 | 0.10 | 0.00 | 1.93 |
| NT vs CBT | ‐ | ‐ | ‐ | ‐ | 0.16 | 0.01 | 3.80 |
| NT vs WL | ‐ | ‐ | ‐ | ‐ | 0.21 | 0.09 | 5.01 |
| PD vs SP | ‐ | ‐ | ‐ | ‐ | 0.33 | 0.08 | 1.46 |
| PD vs PT | 1 | 0.16 | 0.03 | 0.84 | 0.44 | 0.12 | 1.52 |
| PD vs BT | ‐ | ‐ | ‐ | ‐ | 0.36 | 0.10 | 1.35 |
| PD vs CT | ‐ | ‐ | ‐ | ‐ | 0.32 | 0.05 | 2.04 |
| PD vs CBT | 1 | 1.21 | 0.27 | 5.35 | 0.52 | 0.15 | 1.80 |
| PD vs WL | ‐ | ‐ | ‐ | ‐ | 0.69 | 0.19 | 2.50 |
| PD vs NT | ‐ | ‐ | ‐ | ‐ | 3.31 | 0.11 | 97.03 |
| APP vs SP | ‐ | ‐ | ‐ | ‐ | 0.84 | 0.07 | 10.61 |
| APP vs PT | ‐ | ‐ | ‐ | ‐ | 1.10 | 0.10 | 12.30 |
| APP vs BT | ‐ | ‐ | ‐ | ‐ | 0.92 | 0.08 | 10.49 |
| APP vs CT | 1 | 0.97 | 0.08 | 11.51 | 0.80 | 0.09 | 7.21 |
| APP vs CBT | ‐ | ‐ | ‐ | ‐ | 1.32 | 0.12 | 14.61 |
| APP vs WL | ‐ | ‐ | ‐ | ‐ | 1.75 | 0.16 | 19.51 |
| APP vs NT | ‐ | ‐ | ‐ | ‐ | 8.37 | 0.21 | 333.81 |
| APP vs PD | ‐ | ‐ | ‐ | ‐ | 2.53 | 0.17 | 36.70 |
| PE vs SP | ‐ | ‐ | ‐ | ‐ | 0.84 | 0.01 | 97.42 |
| PE vs PT | ‐ | ‐ | ‐ | ‐ | 1.10 | 0.01 | 119.64 |
| PE vs BT | ‐ | ‐ | ‐ | ‐ | 0.92 | 0.01 | 100.89 |
| PE vs CT | ‐ | ‐ | ‐ | ‐ | 0.80 | 0.01 | 77.96 |
| PE vs CBT | ‐ | ‐ | ‐ | ‐ | 1.32 | 0.01 | 142.93 |
| PE vs WL | ‐ | ‐ | ‐ | ‐ | 1.75 | 0.02 | 189.75 |
| PE vs NT | ‐ | ‐ | ‐ | ‐ | 8.36 | 0.04 | 1954.05 |
| PE vs PD | ‐ | ‐ | ‐ | ‐ | 2.53 | 0.02 | 316.00 |
| PE vs APP | ‐ | ‐ | ‐ | ‐ | 1.00 | 0.02 | 55.66 |
| 3W vs SP | ‐ | ‐ | ‐ | ‐ | 0.36 | 0.06 | 2.12 |
| 3W vs PT | ‐ | ‐ | ‐ | ‐ | 0.47 | 0.08 | 2.65 |
| 3W vs BT | ‐ | ‐ | ‐ | ‐ | 0.39 | 0.07 | 2.15 |
| 3W vs CT | ‐ | ‐ | ‐ | ‐ | 0.34 | 0.04 | 3.03 |
| 3W vs CBT | 1 | 0.56 | 0.13 | 2.51 | 0.56 | 0.11 | 2.88 |
| 3W vs WL | ‐ | ‐ | ‐ | ‐ | 0.74 | 0.14 | 4.04 |
| 3W vs NT | ‐ | ‐ | ‐ | ‐ | 3.55 | 0.10 | 126.65 |
| 3W vs PD | ‐ | ‐ | ‐ | ‐ | 1.07 | 0.13 | 8.31 |
| 3W vs APP | ‐ | ‐ | ‐ | ‐ | 0.42 | 0.02 | 7.74 |
| 3W vs PE | ‐ | ‐ | ‐ | ‐ | 0.42 | 0.00 | 60.45 |
| OR (X vs Y) is defined as (Odds X)/(Odds Y). Of course, since this is dropout outcome, an OR smaller than one favours treatment X. Statistically significant results are written in bold. 3W: third‐wave | |||||||
| Comparison | I2(%) | 95% CI |
| CBT vs SP | 49 | 0 to 85 |
| WL vs CBT | 0 | 0 to 55 |
| CBT vs BT | 0 | 0 to 62 |
| WL vs BT | 0 | 0 to 85 |
| WL vs PT | 25 | 0 to 70 |
| CBT vs PT | 12 | 0 to 91 |
| This values refer to standard meta‐analyses, where each comparison has its own heterogeneity variance. BT: behaviour therapy | ||
| Treatment | SUCRA |
| NT | 85 |
| PD | 75 |
| WL | 67 |
| 3W | 67 |
| CBT | 51 |
| APP | 42 |
| PE | 42 |
| PT | 38 |
| CT | 29 |
| BT | 28 |
| SP | 26 |
| Note that higher ranking treatments correspond to lower dropout rate. 3W: third‐wave | |
| Comparison (X vs Y) | Pairwise meta‐analysis | Network meta‐analysis (τ = 0.34) | |||||
| # of studies | SMD | CI (lower) | CI (upper) | SMD | CI (lower) | CI (upper) | |
| PT vs SP | ‐ | ‐ | ‐ | ‐ | 0.24 | ‐0.35 | 0.84 |
| BT vs SP | ‐ | ‐ | ‐ | ‐ | 0.16 | ‐0.42 | 0.74 |
| BT vs PT | 1 | ‐0.26 | ‐0.98 | 0.46 | ‐0.08 | ‐0.47 | 0.31 |
| CT vs SP | ‐ | ‐ | ‐ | ‐ | 0.17 | ‐0.56 | 0.90 |
| CT vs PT | 1 | ‐0.02 | ‐0.67 | 0.64 | ‐0.08 | ‐0.63 | 0.48 |
| CT vs BT | 1 | 0.65 | ‐0.16 | 1.46 | 0.00 | ‐0.56 | 0.57 |
| CBT vs SP | 3 | ‐0.08 | ‐0.40 | 0.24 | ‐0.05 | ‐0.56 | 0.47 |
| CBT vs PT | 5 | ‐0.05 | ‐0.30 | 0.19 | ‐0.29 | ‐0.60 | 0.02 |
| CBT vs BT | 10 | ‐0.24 | ‐0.45 | ‐0.03 | ‐0.21 | ‐0.48 | 0.07 |
| CBT vs CT | 2 | 0.03 | ‐0.88 | 0.94 | ‐0.21 | ‐0.73 | 0.31 |
| WL vs SP | ‐ | ‐ | ‐ | ‐ | 1.05 | 0.49 | 1.60 |
| WL vs PT | 4 | 0.87 | 0.09 | 1.65 | 0.80 | 0.47 | 1.13 |
| WL vs BT | 3 | 0.92 | 0.59 | 1.26 | 0.89 | 0.57 | 1.20 |
| WL vs CT | 1 | 0.60 | ‐0.27 | 1.47 | 0.88 | 0.34 | 1.42 |
| WL vs CBT | 17 | 1.14 | 0.87 | 1.41 | 1.09 | 0.88 | 1.31 |
| NT vs SP | ‐ | ‐ | ‐ | ‐ | 0.78 | ‐0.06 | 1.63 |
| NT vs PT | 1 | 0.36 | ‐0.26 | 0.98 | ‐0.46 | ‐1.12 | 0.21 |
| NT vs BT | ‐ | ‐ | ‐ | ‐ | 0.62 | ‐0.09 | 1.33 |
| NT vs CT | 1 | 0.39 | ‐0.25 | 1.03 | 0.61 | ‐0.11 | 1.34 |
| NT vs CBT | 1 | 1.30 | 0.46 | 2.14 | 0.83 | 0.16 | 1.50 |
| NT vs WL | ‐ | ‐ | ‐ | ‐ | ‐0.27 | ‐0.96 | 0.42 |
| PD vs SP | ‐ | ‐ | ‐ | ‐ | ‐0.21 | ‐1.05 | 0.63 |
| PD vs PT | 1 | ‐1.18 | ‐1.79 | ‐0.57 | ‐0.46 | ‐1.12 | 0.21 |
| PD vs BT | ‐ | ‐ | ‐ | ‐ | ‐0.38 | ‐1.09 | 0.34 |
| PD vs CT | ‐ | ‐ | ‐ | ‐ | ‐0.38 | ‐1.21 | 0.45 |
| PD vs CBT | 1 | 0.57 | ‐0.07 | 1.2 | ‐0.17 | ‐0.83 | 0.50 |
| PD vs WL | ‐ | ‐ | ‐ | ‐ | ‐1.26 | ‐1.95 | ‐0.57 |
| PD vs NT | ‐ | ‐ | ‐ | ‐ | ‐1.00 | ‐1.91 | ‐0.07 |
| PE vs APP | 1 | ‐0.25 | ‐0.87 | 0.38 | ‐ | ‐ | ‐ |
| 3W vs SP | ‐ | ‐ | ‐ | ‐ | 0.20 | ‐0.82 | 1.22 |
| 3W vs PT | ‐ | ‐ | ‐ | ‐ | ‐0.04 | ‐0.98 | 0.90 |
| 3W vs BT | ‐ | ‐ | ‐ | ‐ | 0.04 | ‐0.89 | 0.97 |
| 3W vs CT | ‐ | ‐ | ‐ | ‐ | 0.04 | ‐0.99 | 1.07 |
| 3W vs CBT | 1 | 0.26 | ‐0.33 | 0.84 | 0.25 | ‐0.64 | 1.14 |
| 3W vs WL | ‐ | ‐ | ‐ | ‐ | ‐0.84 | ‐1.76 | 0.07 |
| 3W vs NT | ‐ | ‐ | ‐ | ‐ | ‐0.58 | ‐1.69 | 0.53 |
| 3W vs PD | ‐ | ‐ | ‐ | ‐ | 0.42 | ‐0.69 | 1.53 |
| A positive SMD for Χ vs Y means treatment Y is better than X, the opposite for a negative SMD (this is because for the scales used a lower score corresponds to a better treatment). Statistically significant results are written in bold. 3W: third‐wave | |||||||
| Comparison | I2(%) | 95% CI |
| CBT vs SP | 0 | 0 to 90 |
| CBT vs PT | 0 | 0 to 79 |
| WL vs PT | 79 | 45 to 92 |
| CBT vs BT | 0 | 0 to 62 |
| WL vs BT | 23 | 0 to 92 |
| WL vs CBT | 61 | 34 to 77 |
| This values refer to standard meta‐analyses, where each comparison has its own heterogeneity variance. BT: behaviour therapy | ||
| Treatment | SUCRA |
| PD | 83 |
| CBT | 79 |
| SP | 69 |
| CT | 54 |
| 3W | 53 |
| BT | 52 |
| PT | 43 |
| NT | 14 |
| WL | 4 |
| 3W: third‐wave | |
| Comparison (X vs Y) | Pairwise meta‐analyses | Network meta‐analysis | |||||
| # of studies | OR | CI (lower) | CI (upper) | OR | CI (lower) | CI (upper) | |
| PT vs SP | ‐ | ‐ | ‐ | ‐ | 1.31 | 0.33 | 5.25 |
| BT vs SP | ‐ | ‐ | ‐ | ‐ | 1.27 | 0.38 | 4.27 |
| BT vs PT | 1 | 1.17 | 0.28 | 4.87 | 0.97 | 0.37 | 2.57 |
| CT vs SP | ‐ | ‐ | ‐ | ‐ | 0.96 | 0.21 | 4.36 |
| CT vs PT | 1 | 0.83 | 0.25 | 2.80 | 0.74 | 0.26 | 2.06 |
| CT vs BT | 1 | 0.38 | 0.08 | 1.86 | 0.76 | 0.28 | 2.31 |
| CBT vs SP | 1 | 2.09 | 0.80 | 5.47 | 2.09 | 0.73 | 5.98 |
| CBT vs PT | 2 | 1.33 | 0.47 | 3.76 | 1.60 | 0.64 | 3.95 |
| CBT vs BT | 5 | 1.66 | 0.80 | 3.44 | 1.64 | 0.90 | 2.97 |
| CBT vs CT | 1 | 1.56 | 0.34 | 7.11 | 2.16 | 0.73 | 6.37 |
| PD vs SP | ‐ | ‐ | ‐ | ‐ | 1.67 | 0.33 | 8.33 |
| PD vs PT | ‐ | ‐ | ‐ | ‐ | 1.28 | 0.28 | 5.81 |
| PD vs BT | ‐ | ‐ | ‐ | ‐ | 1.31 | 0.34 | 5.07 |
| PD vs CT | ‐ | ‐ | ‐ | ‐ | 1.73 | 0.34 | 8.79 |
| PD vs CBT | 1 | 0.80 | 0.26 | 9.86 | 0.80 | 0.24 | 2.69 |
| OR (X vs Y) is defined as (Odds X)/(Odds Y). For each comparison X vs Y, an OR greater than one favours treatment X, an OR less than one favours treatment Y. Note that in the main text, where necessary, we inverted the values presented in Table 4 for an easier presentation, in which an OR greater than 1 stands for a higher number of events (short‐term remissions) in the intervention group when compared to the control group. BT: behaviour therapy | |||||||
| Treatment | SUCRA |
| CBT | 85 |
| PD | 64 |
| PT | 49 |
| BT | 43 |
| SP | 31 |
| CT | 27 |
| BT: behaviour therapy | |
| Comparison | Pairwise meta‐analyses (common τ 0.05) | Standard NMA (τ ≅ 0) | NMA adjusted for SSE (τ ≅ 0.60) | |||||||
| # of studies | OR | CI (lower) | CI (upper) | OR | CI (lower) | CI (upper) | OR | CrI (lower) | CrI (upper) | |
| PT vs SP | ‐ | ‐ | ‐ | ‐ | 0.27 | 0.11 | 0.64 | 0.34 | 0.10 | 1.08 |
| BT vs SP | ‐ | ‐ | ‐ | ‐ | 0.35 | 0.16 | 0.75 | 0.38 | 0.12 | 1.16 |
| BT vs PT | 2 | 0.98 | 0.26 | 3.74 | 1.29 | 0.69 | 2.42 | 1.10 | 0.51 | 2.52 |
| CT vs SP | ‐ | ‐ | ‐ | ‐ | 0.43 | 0.13 | 1.47 | 0.44 | 0.10 | 1.87 |
| CT vs PT | ‐ | ‐ | ‐ | ‐ | 1.60 | 0.51 | 4.96 | 1.27 | 0.41 | 3.90 |
| CT vs BT | 1 | 0.95 | 0.19 | 4.84 | 1.24 | 0.44 | 3.51 | 1.15 | 0.37 | 3.68 |
| CBT vs SP | 3 | 0.67 | 0.33 | 1.35 | 0.67 | 0.34 | 1.27 | 0.67 | 0.24 | 1.77 |
| CBT vs PT | 3 | 2.02 | 0.85 | 4.76 | 2.46 | 1.39 | 4.33 | 1.94 | 1.02 | 3.97 |
| CBT vs BT | 9 | 1.90 | 1.15 | 3.16 | 1.90 | 1.26 | 2.88 | 1.76 | 1.02 | 3.13 |
| CBT vs CT | 1 | 1.69 | 0.33 | 8.76 | 1.54 | 0.55 | 4.32 | 1.53 | 0.52 | 4.66 |
| WL vs SP | ‐ | ‐ | ‐ | ‐ | 0.07 | 0.03 | 0.15 | 0.22 | 0.06 | 0.76 |
| WL vs PT | 4 | 0.22 | 0.09 | 0.53 | 0.25 | 0.14 | 0.45 | 0.64 | 0.27 | 1.66 |
| WL vs BT | 3 | 0.17 | 0.08 | 0.36 | 0.19 | 0.12 | 0.31 | 0.58 | 0.26 | 1.36 |
| WL vs CT | 2 | 0.12 | 0.03 | 0.46 | 0.16 | 0.06 | 0.43 | 0.51 | 0.15 | 1.82 |
| WL vs CBT | 11 | 0.10 | 0.05 | 0.19 | 0.10 | 0.07 | 0.16 | 0.33 | 0.16 | 0.70 |
| PD vs SP | ‐ | ‐ | ‐ | ‐ | 0.61 | 0.21 | 1.80 | 0.24 | 0.03 | 1.64 |
| PD vs PT | 1 | 4.22 | 1.17 | 15.15 | 2.25 | 0.93 | 5.42 | 0.70 | 0.14 | 3.66 |
| PD vs BT | ‐ | ‐ | ‐ | ‐ | 1.74 | 0.68 | 4.47 | 0.64 | 0.11 | 3.60 |
| PD vs CT | ‐ | ‐ | ‐ | ‐ | 1.41 | 0.37 | 5.34 | 0.55 | 0.11 | 2.74 |
| PD vs CBT | 1 | 0.51 | 0.15 | 1.76 | 0.91 | 0.38 | 2.19 | 0.36 | 0.07 | 1.87 |
| PD vs WL | ‐ | ‐ | ‐ | ‐ | 8.97 | 3.50 | 22.95 | 1.09 | 0.18 | 6.45 |
| OR (X vs Y) is defined as (Odds X)/(Odds Y). For each comparison X vs Y, an OR greater than one favours treatment X, an OR less than one favours treatment Y. Note that in the main text, where necessary, we inverted the values presented in Table 4 for an easier presentation, in which an OR greater than 1 stands for a higher number of events (short‐term remissions) in the intervention group when compared to the control group. Statistically significant results are written in bold. BT: behaviour therapy | ||||||||||
| Comparison | I2(%) | 95% CI |
| WL vs PT | 56 | 0 to 85 |
| WL vs BT | 34 | 0 to 78 |
| WL vs CBT | 21 | 0 to 60 |
| CBT vs BT | 6 | 0 to 67 |
| CBT vs SP | 0 | 0 to 90 |
| CBT vs PT | 0 | 0 to 90 |
| This values refer to standard meta‐analyses, where each comparison has its own heterogeneity variance. BT: behaviour therapy | ||
| Treatment | SUCRA |
| SP | 89 |
| CBT | 76 |
| PD | 73 |
| CT | 50 |
| BT | 40 |
| PT | 35 |
| NT | 26 |
| WL | 13 |
| BT: behaviour therapy | |
| Comparison (X vs Y) | Pairwise meta‐analyses | ||||
| # of studies | OR | CI (lower) | CI (upper) | I2 | |
| WL vs CBT | 3 | 0.07 | 0.01 | 0.30 | 0.0% |
| CBT vs BT | 2 | 2.21 | 0.96 | 5.10 | 0.7% |
| CBT vs SP | 2 | 0.51 | 0.22 | 1.23 | 0.0% |
| WL vs BT | 1 | 0.22 | 0.11 | 0.44 | ‐ |
| NT vs CT | 1 | 0.57 | 0.17 | 1.91 | ‐ |
| CT vs PT | 1 | 1.22 | 0.36 | 4.12 | ‐ |
| NT vs PT | 1 | 0.70 | 0.27 | 1.10 | ‐ |
| OR (X vs Y) is defined as (Odds X)/(Odds Y). For each comparison X vs Y, an OR greater than one favours treatment X, an OR less than one favours treatment Y. Note that in the main text, where necessary, we inverted the values presented in Table 4 for an easier presentation, in which an OR greater than 1 stands for a higher number of events (short‐term remissions) in the intervention group when compared to the control group. Statistically significant results are written in bold. BT: behaviour therapy | |||||
| Comparison (X vs Y) | Pairwise meta‐analyses | Network meta‐analysis (tau = 0.63) | ||||||
| # of studies | OR | CI (lower) | CI (upper) | I2 | OR | CI (lower) | CI (upper) | |
| BT vs PT | ‐ | ‐ | ‐ | ‐ | ‐ | 0.56 | 0.12 | 2.67 |
| CBT vs PT | 3 | 1.56 | 0.69 | 3.55 | 30 | 1.80 | 0.69 | 4.67 |
| CBT vs BT | 2 | 4.04 | 0.73 | 22.52 | 72 | 3.16 | 0.93 | 10.71 |
| WL vs PT | 3 | 0.22 | 0.01 | 4.04 | 69 | 0.11 | 0.03 | 0.36 |
| WL vs BT | 1 | 0.02 | 0.00 | 0.32 | ‐ | 0.19 | 0.04 | 0.87 |
| WL vs CBT | 6 | 0.06 | 0.03 | 0.014 | 0 | 0.06 | 0.02 | 0.16 |
| OR (X vs Y) is defined as (Odds X)/(Odds Y). For each comparison X vs Y, an OR greater than one favours treatment X, an OR less than one favours treatment Y. Note that in the main text, where necessary, we inverted the values presented in Table 4 for an easier presentation, in which an OR greater than 1 stands for a higher number of events (short‐term remissions) in the intervention group when compared to the control group. Statistically significant results are written in bold. BT: behaviour therapy | ||||||||
| Comparison (X vs Y) | # of studies | Random‐effects pairwise meta‐analyses | Fixed‐effect pairwise meta‐analyses | ||||
| OR | CI (lower) | CI (upper) | OR | CI (lower) | CI (upper) | ||
| BT vs PT | 2 | 1.09 | 0.22 | 5.52 | 0.96 | 0.27 | 3.46 |
| CT vs PT | 1 | 1.22 | 0.36 | 4.12 | 1.22 | 0.36 | 4.12 |
| CT vs BT | 1 | 0.95 | 0.20 | 4.54 | 0.95 | 0.20 | 4.54 |
| CBT vs SP | 3 | 0.67 | 0.35 | 1.27 | 0.67 | 0.35 | 1.27 |
| CBT vs PT | 4 | 1.43 | 0.78 | 2.62 | 1.43 | 0.78 | 2.62 |
| CBT vs BT | 10 | 2.05 | 1.29 | 3.27 | 2.05 | 1.30 | 3.22 |
| CBT vs CT | 1 | 1.69 | 0.35 | 8.22 | 1.69 | 0.35 | 8.22 |
| PT vs WL | 4 | 4.55 | 0.89 | 25.00 | 4.55 | 1.96 | 10.00 |
| BT vs WL | 3 | 8.33 | 2.33 | 25.00 | 5.56 | 2.94 | 11.11 |
| CT vs WL | 2 | 8.33 | 2.22 | 33.33 | 8.33 | 2.22 | 33.33 |
| CBT vs WL | 18 | 9.09 | 4.76 | 20.00 | 5.56 | 3.70 | 8.33 |
| PT vs NT | 1 | 1.43 | 0.41 | 5.00 | 1.43 | 0.41 | 5.00 |
| CT vs NT | 1 | 1.75 | 0.52 | 5.88 | 1.75 | 0.52 | 5.88 |
| PD vs PT | 1 | 4.22 | 1.27 | 13.95 | 4.22 | 1.27 | 13.95 |
| PD vs CBT | 1 | 0.51 | 0.16 | 1.613 | 0.51 | 0.16 | 1.613 |
| OR (X vs Y) is defined as (Odds X)/(Odds Y). For each comparison X vs Y, an OR greater than one favours treatment X, an OR less than one favours treatment Y. Statistically significant results are written in bold. BT: behaviour therapy | |||||||