| 1 Treatment failure (endometritis) Show forest plot | 2 | 163 | Risk Ratio (M‐H, Fixed, 95% CI) | 0.86 [0.27, 2.70] |
|
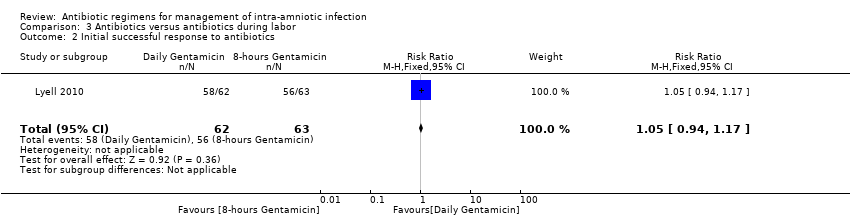
| 2 Initial successful response to antibiotics Show forest plot | 1 | 125 | Risk Ratio (M‐H, Fixed, 95% CI) | 1.05 [0.94, 1.17] |
|
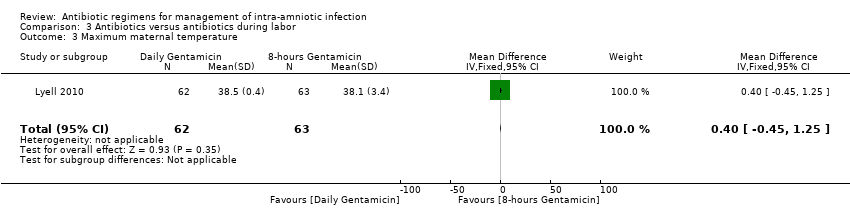
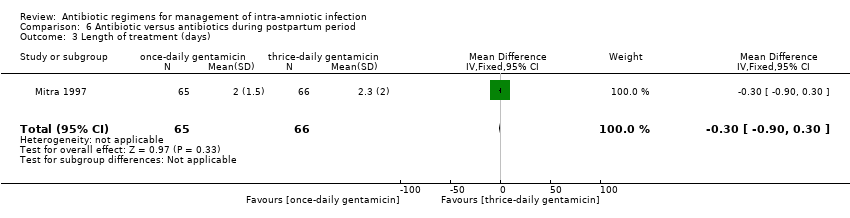
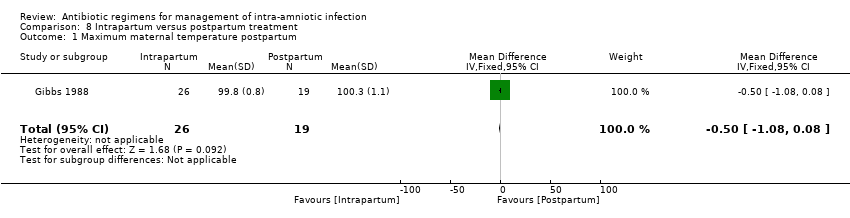
| 3 Maximum maternal temperature Show forest plot | 1 | 125 | Mean Difference (IV, Fixed, 95% CI) | 0.40 [‐0.45, 1.25] |
|
| 4 Postpartum hemorrhage Show forest plot | 2 | 163 | Risk Ratio (M‐H, Fixed, 95% CI) | 1.39 [0.76, 2.56] |
|
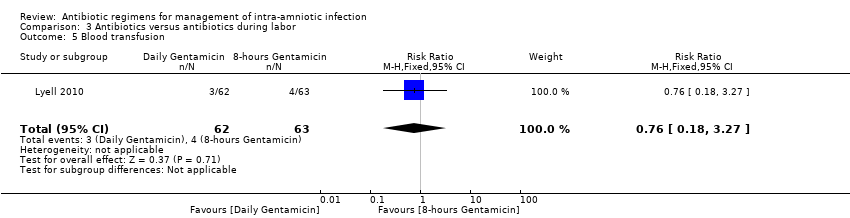
| 5 Blood transfusion Show forest plot | 1 | 125 | Risk Ratio (M‐H, Fixed, 95% CI) | 0.76 [0.18, 3.27] |
|
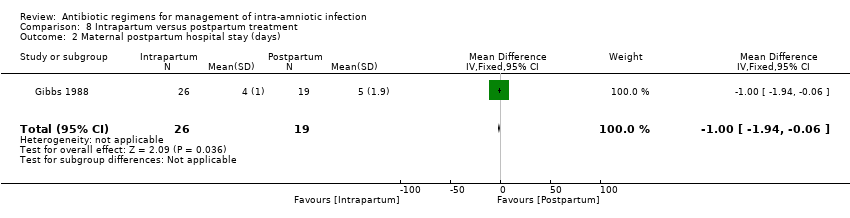
| 6 Maternal postpartum hospital stay (days) Show forest plot | 1 | 125 | Mean Difference (IV, Fixed, 95% CI) | 0.0 [‐0.43, 0.43] |
|
| 7 Histologic chorioamnionitis Show forest plot | 1 | 125 | Risk Ratio (M‐H, Fixed, 95% CI) | 0.92 [0.63, 1.33] |
|
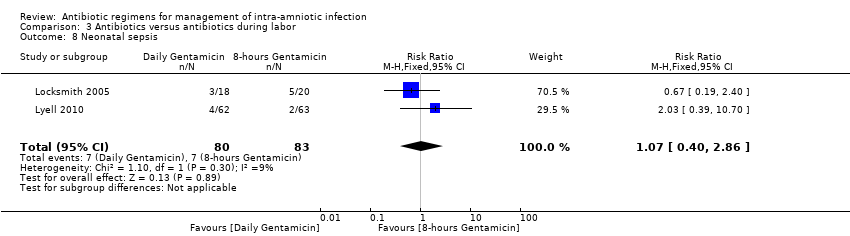
| 8 Neonatal sepsis Show forest plot | 2 | 163 | Risk Ratio (M‐H, Fixed, 95% CI) | 1.07 [0.40, 2.86] |
|
| 9 Respiratory distress syndrome Show forest plot | 1 | 125 | Risk Ratio (M‐H, Fixed, 95% CI) | 1.69 [0.42, 6.78] |
|
| 10 Neonatal antibiotic (days) Show forest plot | 1 | 125 | Mean Difference (IV, Fixed, 95% CI) | 0.20 [‐0.37, 0.77] |
|
| 11 Treatment failure Show forest plot | 1 | 19 | Risk Ratio (M‐H, Fixed, 95% CI) | 0.0 [0.0, 0.0] |
|
| 12 Maternal death Show forest plot | 1 | 38 | Risk Ratio (M‐H, Fixed, 95% CI) | 0.0 [0.0, 0.0] |
|
| 13 Postpartum endometritis (double vs triple therapy) Show forest plot | 1 | 133 | Risk Ratio (M‐H, Fixed, 95% CI) | 1.86 [0.67, 5.14] |
|
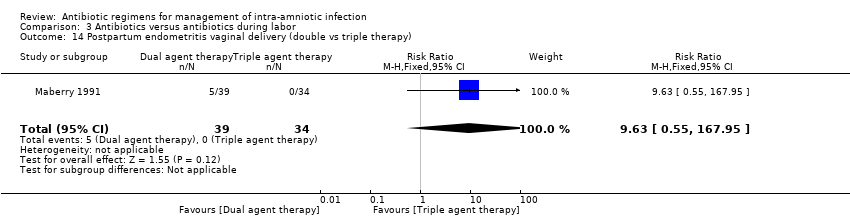
| 14 Postpartum endometritis vaginal delivery (double vs triple therapy) Show forest plot | 1 | 73 | Risk Ratio (M‐H, Fixed, 95% CI) | 9.63 [0.55, 167.95] |
|
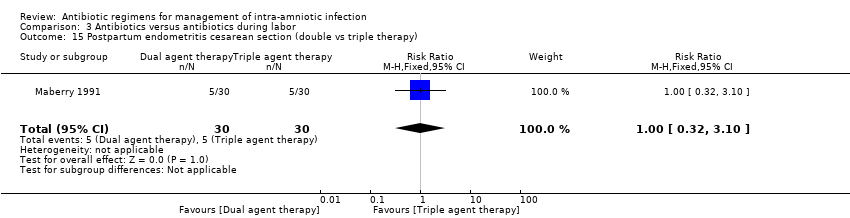
| 15 Postpartum endometritis cesarean section (double vs triple therapy) Show forest plot | 1 | 60 | Risk Ratio (M‐H, Fixed, 95% CI) | 1.0 [0.32, 3.10] |
|
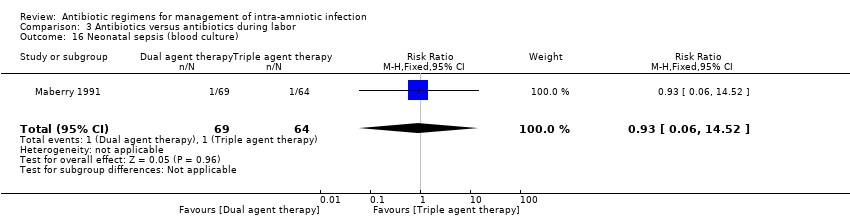
| 16 Neonatal sepsis (blood culture) Show forest plot | 1 | 133 | Risk Ratio (M‐H, Fixed, 95% CI) | 0.93 [0.06, 14.52] |
|
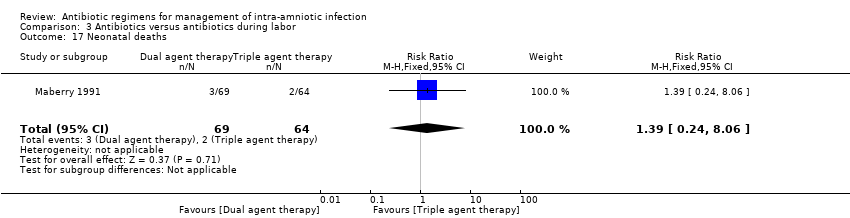
| 17 Neonatal deaths Show forest plot | 1 | 133 | Risk Ratio (M‐H, Fixed, 95% CI) | 1.39 [0.24, 8.06] |
|
| 18 Intraventricular hemorrhage Show forest plot | 1 | 133 | Risk Ratio (M‐H, Fixed, 95% CI) | 4.64 [0.23, 94.90] |
|
| 19 Respiratory distress syndrome Show forest plot | 1 | 133 | Risk Ratio (M‐H, Fixed, 95% CI) | 1.11 [0.36, 3.47] |
|
| 20 Neonatal seizures Show forest plot | 1 | 133 | Risk Ratio (M‐H, Fixed, 95% CI) | 0.93 [0.06, 14.52] |
|