| Domain | 'Risk of bias' judgement |
| Low | High | Unclear |
| Selection bias | |
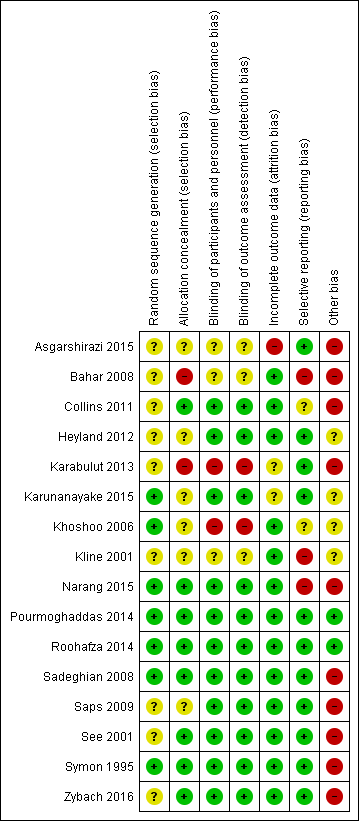
| Random sequence generation | If the study details any of the following methods: (1) simple randomisation (such as coin‐tossing, throwing dice, or dealing previously shuffled cards, a list of random numbers, or computer‐generated random numbers); or (2) restricted randomisation such as blocked, ideally with varying block sizes or stratified groups, provided that within‐group randomisation is not affected | If the study details no randomisation or an inadequate method such as alternation, assignment based on date of birth, case record number, and date of presentation. These latter methods may be referred to as ‘quasi‐random’. | If there is insufficient detail to judge the risk of bias |
| Allocation concealment | If the study details concealed allocation sequence in sufficient detail to determine that allocations could not have been foreseen in advance of, or during, enrolment | If the study details a method where the allocation is known prior to assignment | If there is insufficient detail to judge the risk of bias |
| Performance bias | |
| Blinding of participants and personnel | If the study details a method of blinding participants and personnel. Detail would need to be sufficient to show that participants and personnel were unable to identify the therapeutic intervention from the control intervention. | If the methods detail that the participants or study personnel were not blinded to the study medication or placebo | If there is insufficient detail to judge the risk of bias |
| Detection bias | |
| Blinding of outcome assessment | If the study details a blinded outcome assessment. This may only be possible for outcomes that are externally assessed. | If the outcome assessment is not blinded. We expect this may be unavoidable for self rated outcomes of unblinded interventions. | If there is insufficient detail to judge the risk of bias |
| Attrition bias | |
| Incomplete outcome data | If the study reports attrition and exclusions, including the numbers in each intervention group (compared with total randomised participants), reasons for attrition or exclusions, and any re‐inclusions; the impact of missing data is not believed to have altered the conclusions; and reasons for the missing data are acceptable | We may judge the risk of attrition bias to be high due to the amount, nature, or handling (such as per‐protocol analysis) of incomplete outcome data. | If there is insufficient detail to judge the risk of bias, e.g. if the number of children randomised to each treatment is not reported |
| Reporting bias | |
| Selective reporting | If there is complete reporting of all outcome data. This will be determined based on comparison of the protocol and published study, if available. | If the reporting is selective so that some outcome data are not reported | If there is insufficient detail to judge the risk of bias, e.g. protocols are unavailable |
| Other sources of bias | |
| Other bias | If the study is judged to be at low of risk of other potential sources of bias, such as no differential loss to follow‐up or an adequate washout period in cross‐over trials | If there are other sources of bias, such as differential loss to follow‐up or an inadequate washout period in cross‐over trials | If there is insufficient detail to judge the risk of bias |