慢性非低血容量低渗性低钠血症的干预
Información
- DOI:
- https://doi.org/10.1002/14651858.CD010965.pub2Copiar DOI

- Base de datos:
-
- Cochrane Database of Systematic Reviews
- Versión publicada:
-
- 28 junio 2018see what's new
- Tipo:
-
- Intervention
- Etapa:
-
- Review
- Grupo Editorial Cochrane:
-
Grupo Cochrane de Riñón y trasplante
- Copyright:
-
- Copyright © 2018 The Cochrane Collaboration. Published by John Wiley & Sons, Ltd.
Cifras del artículo
Altmetric:
Citado por:
Autores
Contributions of authors
-
Draft the protocol: EVN, MCH, WVB, RVH, JC, ACW
-
Study selection: EVN, MCH
-
Extract data from studies: EVN, MCH
-
Enter data into RevMan: EVN
-
Carry out the analysis: EVN
-
Interpret the analysis: EVN, ACW
-
Wrote the review: EVN
-
Revised the review: MCH, ACW, WVB, RVH, JC, ACW
-
Advised on presentation of results: ACW
-
Disagreement resolution: ACW
-
Update the review: EVN, MCH, WVB, RVH, JC, ACW
Sources of support
Internal sources
-
European Renal Best Practice (ERBP), the guidance issuing body of the European Renal Association – European Dialysis and Transplant Association (ERA‐EDTA), Other.
Provided a grant that funded this research
External sources
-
No sources of support supplied
Declarations of interest
Evi V Nagler, Maria C Haller, Wim Van Biesen and Raymond Vanholder are members of European Renal Best Practice (ERBP), the guidance issuing body of the European Renal Association/ European Dialysis and Transplant Association (ERA‐EDTA). ERBP has recently developed a clinical practice guideline on diagnosis and treatment of hyponatraemia in a joint venture with the European Society of Endocrinology and the European Society of Intensive Care Medicine. ERBP receives their annual budget from the ERA‐EDTA. The ERA‐EDTA council does not interfere with topic choice or any other part of the guideline development process of ERBP.
Evi V Nagler and Maria C Haller received an ERBP grant to fund their research programs. They have no commercial interests to declare.
Wim Van Biesen has no commercial interests related to the treatment of hyponatraemia or this review.
Raymond Vanholder has acted as consultant for Baxter Healthcare, Bellco and Mitsubishi; as expert advisor for Relitech, Dutch Kidney Foundation, Bellco, Amgen, Mitsubishi, DOPPS, Hoffman Laroche, Fresenius Medical Care; has received research grants from Fresenius Medical Care, Baxter Healthcare, Gambro, Astellas, Hoffman Laroche and Amgen. He has no specific commercial interests related to the treatment of hyponatraemia.
Jonathan C Craig and Angela C Webster have no intellectual or commercial interests to declare.
Acknowledgements
We wish to acknowledge Ruth Mitchell and Gail Higgins for their contributions in developing the search strategies, running the searches and collecting the citations. We would like to thank Narelle Willis, Ann Jones and Fiona Russell for their editorial support in developing this review. We sincerely wish to acknowledge Otsuka, Dr Peyro Saint Paul, and Dr Naoto Tominaga for contributing unpublished data to this review. And finally we would like to thank the referees for their comments and feedback during the preparation of this review.
The authors acknowledge that the information provided in the questionnaires for studies sponsored by Otsuka comprises unpublished information owned by Otsuka. With respect to each of the responses, Otsuka grants the authors of this Cochrane review the non‐exclusive, non‐sublicensable right to use the information provided therein for the purpose of the Cochrane review entitled “Interventions for chronic non‐hypovolaemic hypotonic hyponatraemia”.
Version history
| Published | Title | Stage | Authors | Version |
| 2018 Jun 28 | Interventions for chronic non‐hypovolaemic hypotonic hyponatraemia | Review | Evi V Nagler, Maria C Haller, Wim Van Biesen, Raymond Vanholder, Jonathan C Craig, Angela C Webster | |
| 2014 Feb 25 | Interventions for chronic non‐hypovolaemic hypotonic hyponatraemia | Protocol | Evi V Nagler, Maria C Haller, Wim Van Biesen, Raymond Vanholder, Jonathan C Craig, Angela C Webster | |
Differences between protocol and review
Liver function abnormalities were not anticipated as an adverse effect attributable to vasopressin receptor antagonists. A communication issued by Otsuka, indicating concerns around possibility for liver failure ‐ be it in patients with autosomal polycystic kidney disease and at doses higher than those given for hyponatraemia ‐ highlighted the outcome for inclusion in our review.
Keywords
MeSH
Medical Subject Headings (MeSH) Keywords
Medical Subject Headings Check Words
Humans;
PICO

Study flow diagram.

Risk of bias graph: review authors' judgements about each risk of bias item presented as percentages across all included studies.

Risk of bias summary: review authors' judgements about each risk of bias item for each included study.

Effect of baseline serum sodium concentration on change in natraemia: meta‐regression

Funnel plot of comparison: 1 Vasopressin receptor antagonists versus placebo or no treatment, outcome: 1.6 Response in serum sodium concentration.

Single study results

Comparison 1 Vasopressin receptor antagonists (VRA) versus placebo or no treatment, Outcome 1 Death at 6 months.

Comparison 1 Vasopressin receptor antagonists (VRA) versus placebo or no treatment, Outcome 2 Health‐related quality of life.
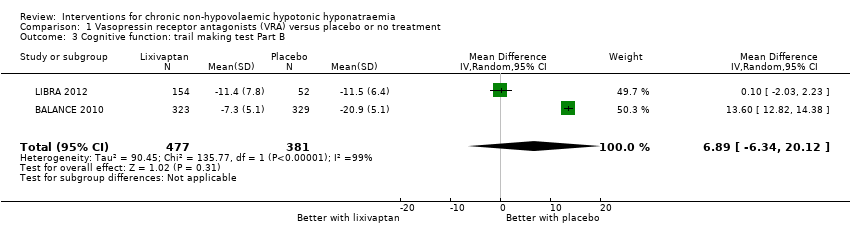
Comparison 1 Vasopressin receptor antagonists (VRA) versus placebo or no treatment, Outcome 3 Cognitive function: trail making test Part B.

Comparison 1 Vasopressin receptor antagonists (VRA) versus placebo or no treatment, Outcome 4 Length of hospital stay.

Comparison 1 Vasopressin receptor antagonists (VRA) versus placebo or no treatment, Outcome 5 Change from baseline serum sodium concentration.

Comparison 1 Vasopressin receptor antagonists (VRA) versus placebo or no treatment, Outcome 6 Response in serum sodium concentration.

Comparison 1 Vasopressin receptor antagonists (VRA) versus placebo or no treatment, Outcome 7 Rapid increase in serum sodium concentration.

Comparison 1 Vasopressin receptor antagonists (VRA) versus placebo or no treatment, Outcome 8 Hypernatraemia during treatment.

Comparison 1 Vasopressin receptor antagonists (VRA) versus placebo or no treatment, Outcome 9 Thirst.
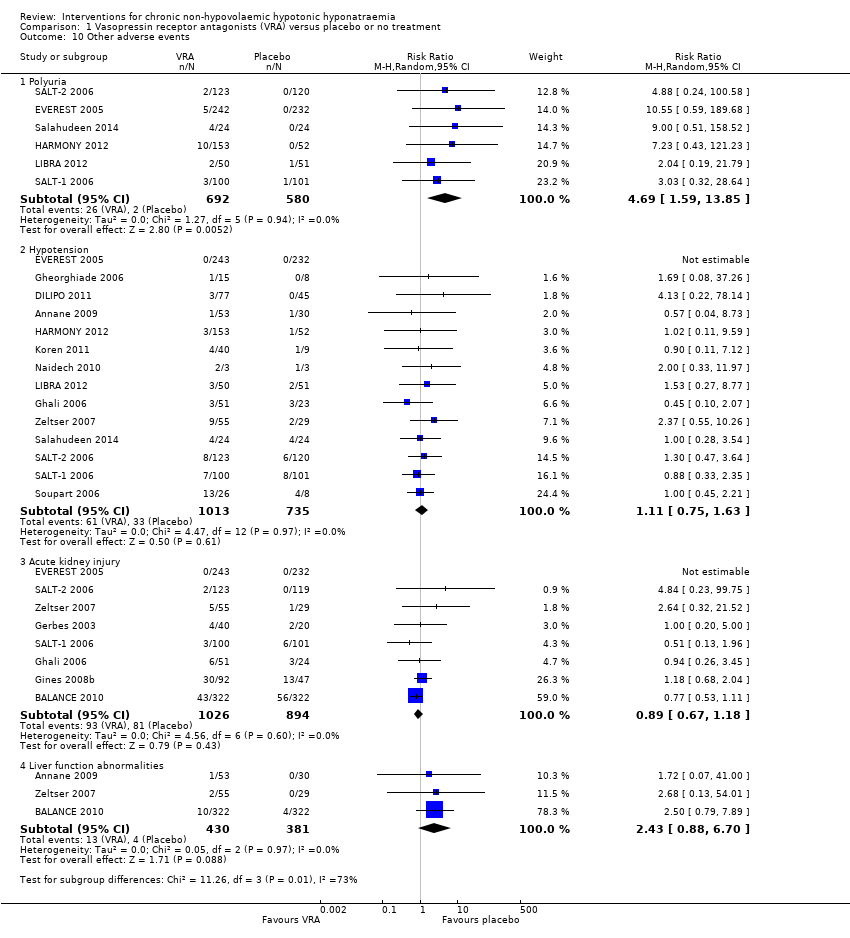
Comparison 1 Vasopressin receptor antagonists (VRA) versus placebo or no treatment, Outcome 10 Other adverse events.

Comparison 1 Vasopressin receptor antagonists (VRA) versus placebo or no treatment, Outcome 11 Injection‐site complications at 2 to 7 days.

Comparison 1 Vasopressin receptor antagonists (VRA) versus placebo or no treatment, Outcome 12 Treatment discontinuation.

Comparison 1 Vasopressin receptor antagonists (VRA) versus placebo or no treatment, Outcome 13 Death during follow‐up: sensitivity analysis.

Comparison 1 Vasopressin receptor antagonists (VRA) versus placebo or no treatment, Outcome 14 Rapid increase in serum sodium concentration: sensitivity analysis.
| Vasopressin receptor antagonists versus placebo or no treatment for chronic non‐hypovolaemic hypotonic hyponatraemia | ||||||
| Patient or population: chronic non‐hypovolaemic hypotonic hyponatraemia | ||||||
| Outcomes | Illustrative comparative risks* (95% CI) | Relative effect | No. of Participants | Quality of the evidence | Comments | |
| Assumed risk | Corresponding risk | |||||
| placebo or no treatment | Vasopressin receptor antagonists | |||||
| Death Follow‐up: range 2 to 180 days | Study population | RR 1.11 | 2330 (15) | ⊕⊝⊝⊝ | Interpretation: effect uncertain; may both result in 11/1000 fewer to 47/1000 more deaths within 6 months | |
| 143 per 1000 1 | 159 per 1000 | |||||
| Health‐related quality of life (assessed with mental component score of SF‐124) Follow‐up: 30 days | The mean change from baseline in health‐related quality of life in the control group ranged between 0.75 and 2.39 on a 0 to 100 point scale (worst to best) 5 | The mean health‐related quality of life in the intervention group was 4.76 higher (0.11 higher to 9.41 higher) | ‐ | 297 (2) | ⊕⊝⊝⊝ | Physical component score also measured in both studies; RR 1.04; CI ‐1.81 to 3.90 Interpretation: anywhere from 0.1 to 9.5/100 points higher increase with treatment, but questionable tool for QoL measurement in hyponatraemia and unclear minimally important clinical difference |
| Length of hospital stay | The mean length of hospital stay in the control group was 6 to 11 days 5 | The mean length of hospital stay in the intervention group was 1.63 days lower (2.96 lower to 0.30 lower) | ‐ | 580 (2) | ⊕⊕⊝⊝ | |
| Cognitive function (assessed with various tools) Follow‐up: 1 to 6 months | Across five studies, confidence intervals spanned the line of no effect and did not include a clinically meaningful effect | ‐ | 1169 (5) | ⊕⊕⊝⊝ LOW 10 | Tools used to assess cognitive function: making test B; reaction time, psychomotor, processing speeds; Mini mental state exam; overall meta‐analysis including all five studies not meaningfully possible | |
| Change from baseline in serum sodium concentration Follow‐up: range 1 to 180 days | The mean change from baseline in serum sodium concentration in the control group was 0.3 to 4.8 mmol/L 5 | The mean change from baseline in serum sodium concentration in the intervention group was 4.17 mmol/L higher (3.18 higher to 5.16 higher) | ‐ | 2641 (21) | ⊕⊕⊕⊝ | |
| Serum sodium concentration (response) Follow‐up: range 4 to 180 days | Study population | RR 2.49 | 2104 (18) | ⊕⊕⊕⊝ | Response most commonly defined by investigators as > 5 to > 6 mmol/L increase or normalisation of serum sodium concentration | |
| 231 per 1000 1 | 576 per 1000 | |||||
| Rapid sodium increase Follow‐up: range 1 to 5 days | Study population | RR 1.67 | 2058 (14) | ⊕⊕⊕⊝ | Rapid increase most commonly defined as > 12 mmol/d | |
| 44 per 1000 1 | 73 per 1000 | |||||
| *The basis for the assumed risk (e.g. the median control group risk across studies) is provided in footnotes. The corresponding risk (and its 95% confidence interval) is based on the assumed risk in the comparison group and the relative effect of the intervention (and its 95% CI). | ||||||
| GRADE Working Group grades of evidence | ||||||
| 1 Source of assumed baseline risk was calculated as the unweighted summed event rate in the control groups of the trials included in the meta‐analysis 2 Downgraded one level because studies considered at serious risk of suffering from * selective reporting: 6/16 studies with treatment duration > 1 week did not report death and had no protocol, accounting for 16% of the total number of participants in those studies * commercial sponsorship; possible financial conflict of interest of the authors: all studies sponsored by pharmaceutical companies wanting to commercialize the treatment; all save one had author lists who featured people who had received money for presentations or consultancy, or were employed by the sponsor; only used as supporting reason for downgrading. 3 Downgraded two levels for imprecision. The 95% CI of the pooled estimate includes both important reduction (11/1000 fewer) and increase (47/1000 more) in death with vasopressin receptor antagonists. 4 Choice of the outcome‐measure based on the fact that this was the only one reported in any of the studies. There are concerns around the validity of the SF‐12 as a measure for health‐related quality of life in the field of hyponatraemia as it gauges domains and symptoms not directly attributable to hyponatraemia. 5 Source of the assumed baseline risk was the range of outcomes in the control groups of the trials included in the meta‐analysis 6 Downgraded one level because studies considered seriously at risk of suffering from * Performance bias: self‐reported outcome, participants likely unblinded to treatment due to polyuria as side effect * Selective reporting bias: both mental and physical component score of SF‐12 measured; at week 1 or 2 and day 30 using two different analytic techniques. Only data at day 30 available for analysis. * Attrition bias: overall 37% of data missing, unknown whether missing at random or not. * Commercial sponsorship or possible financial conflict of interest of authors: both studies were sponsored by the company seeking to commercialise the treatment; both had author lists who featured people who had received money for presentations or consultancy, or were employed by the sponsor; only using as supporting argument for downgrading 7 Downgraded one level for indirectness due to concerns around validity of the SF‐12 for measuring quality of life in the context of hyponatraemia and one level for imprecision: only studied in two studies. 8 Downgraded one level because studies considered seriously at risk of suffering from performance bias: participants and personnel likely unblinded to treatment due to polyuria as side effect; this could have influenced self‐reported and professional appreciation of clinical condition and so have influenced decision to discharge from hospital. 9 Downgraded one level for imprecision. The 95% CI of the pooled estimate includes both negligible shortening (0.3 days shorter) and clinically important shortening (3 days shorter) of hospital stay with vasopressin receptor antagonists. 10 Downgraded two levels for indirectness and imprecision. Only studied in 5/28 studies, with most data for lixivaptan, and other studies not reaching the optimal information size. 11 Downgraded one level because we considered studies seriously at risk of suffering from * Attrition bias: 7/21 studies, accounting for 53% of the total number of participants in those studies at high risk of bias either due to true attrition or because a repeated measures analytic technique was used with all measurements of serum sodium concentration included until patient attrition, which we judged would likely have overestimated the treatment effect. *Commercial sponsorship; only used as supporting argument. 12 Downgraded one level for indirectness; risks controlled in tightly organised randomised trial with several measurements of serum sodium concentration daily to avoid rapid correction. In real life, risk of rapid correction likely greater. Commercial sponsorship bias; only used as supporting argument. | ||||||
| Covariate | Number of studies included in meta‐regression | Scale | Absolute change in mean difference | P value |
| Baseline serum sodium concentration | 21 | Per 1 mmol/L increase | ‐0.33 (‐0.65 to ‐0.02) | 0.04 |
| Compound | 21 | Relative to conivaptan | ‐ | 0.17 |
| Conivaptan | 5 | ‐ | ‐ | ‐ |
| Lixivaptan | 4 | ‐ | ‐2.79 (‐5.47 to ‐0.10) | ‐ |
| Satavaptan | 3 | ‐ | ‐0,23 (‐3.34 to 2.87) | ‐ |
| Tolvaptan | 9 | ‐ | ‐0.82 (‐3.13 to 1.50) | ‐ |
| Cause of hyponatraemia | 21 | Relative to SIADH | ‐ | 0.18 |
| SIADH | 5 | ‐ | ‐ | ‐ |
| Combined SIADH ‐ Heart failure, cirrhosis | 10 | ‐ | 0.67 (‐1.77 to 3.13) | ‐ |
| Heart failure | 6 | ‐ | ‐1.19 (‐3.84 to 1.47) | ‐ |
| Treatment duration | 21 | Per day increase | ‐0.02 (‐0,04 to 0.00) | 0.1 |
| Risk of selection bias | 21 | Relative to low risk | ‐ | 0.86 |
| Low risk | 8 | ‐ | ‐ | ‐ |
| High risk | 13 | ‐ | 0.18 (‐1.90 to 2.27) | ‐ |
| Outcome or subgroup title | No. of studies | No. of participants | Statistical method | Effect size |
| 1 Death at 6 months Show forest plot | 15 | 2330 | Risk Ratio (M‐H, Random, 95% CI) | 1.11 [0.92, 1.33] |
| 1.1 Conivaptan | 4 | 222 | Risk Ratio (M‐H, Random, 95% CI) | 0.39 [0.13, 1.17] |
| 1.2 Lixivaptan | 3 | 950 | Risk Ratio (M‐H, Random, 95% CI) | 1.23 [0.85, 1.80] |
| 1.3 Tolvaptan | 8 | 1158 | Risk Ratio (M‐H, Random, 95% CI) | 1.11 [0.89, 1.39] |
| 2 Health‐related quality of life Show forest plot | 2 | Mean Difference (IV, Random, 95% CI) | Subtotals only | |
| 2.1 Mental component SF‐12 | 2 | 297 | Mean Difference (IV, Random, 95% CI) | 4.76 [0.11, 9.41] |
| 2.2 Physical component SF‐12 | 2 | 300 | Mean Difference (IV, Random, 95% CI) | 1.04 [‐1.81, 3.90] |
| 3 Cognitive function: trail making test Part B Show forest plot | 2 | 858 | Mean Difference (IV, Random, 95% CI) | 6.89 [‐6.34, 20.12] |
| 4 Length of hospital stay Show forest plot | 3 | 610 | Mean Difference (IV, Random, 95% CI) | ‐1.63 [‐2.96, ‐0.30] |
| 4.1 Satavaptan | 1 | 139 | Mean Difference (IV, Random, 95% CI) | ‐1.80 [‐3.80, 0.20] |
| 4.2 Tolvaptan | 2 | 471 | Mean Difference (IV, Random, 95% CI) | ‐1.50 [‐3.28, 0.29] |
| 5 Change from baseline serum sodium concentration Show forest plot | 21 | 2641 | Mean Difference (IV, Random, 95% CI) | 4.17 [3.18, 5.16] |
| 5.1 Conivaptan | 5 | 292 | Mean Difference (IV, Random, 95% CI) | 5.17 [2.65, 7.69] |
| 5.2 Lixivaptan | 4 | 1070 | Mean Difference (IV, Random, 95% CI) | 2.24 [0.78, 3.70] |
| 5.3 Satavaptan | 3 | 257 | Mean Difference (IV, Random, 95% CI) | 4.91 [2.88, 6.94] |
| 5.4 Tolvaptan | 9 | 1022 | Mean Difference (IV, Random, 95% CI) | 4.22 [3.55, 4.89] |
| 6 Response in serum sodium concentration Show forest plot | 18 | 2104 | Risk Ratio (M‐H, Random, 95% CI) | 2.49 [1.95, 3.18] |
| 6.1 Conivaptan | 4 | 282 | Risk Ratio (M‐H, Random, 95% CI) | 2.48 [1.54, 4.01] |
| 6.2 Lixivaptan | 4 | 1024 | Risk Ratio (M‐H, Random, 95% CI) | 2.21 [1.19, 4.10] |
| 6.3 Satavaptan | 4 | 331 | Risk Ratio (M‐H, Random, 95% CI) | 3.33 [1.88, 5.89] |
| 6.4 Tolvaptan | 6 | 467 | Risk Ratio (M‐H, Random, 95% CI) | 2.36 [1.75, 3.18] |
| 7 Rapid increase in serum sodium concentration Show forest plot | 14 | 2058 | Risk Ratio (M‐H, Random, 95% CI) | 1.67 [1.16, 2.40] |
| 7.1 Conivaptan | 4 | 290 | Risk Ratio (M‐H, Random, 95% CI) | 3.77 [0.89, 15.98] |
| 7.2 Lixivaptan | 4 | 994 | Risk Ratio (M‐H, Random, 95% CI) | 1.39 [0.90, 2.17] |
| 7.3 Satavaptan | 4 | 331 | Risk Ratio (M‐H, Random, 95% CI) | 2.61 [0.73, 9.30] |
| 7.4 Tolvaptan | 2 | 443 | Risk Ratio (M‐H, Random, 95% CI) | 6.70 [0.82, 54.56] |
| 8 Hypernatraemia during treatment Show forest plot | 10 | 1592 | Risk Ratio (M‐H, Random, 95% CI) | 1.37 [0.63, 3.01] |
| 8.1 Conivaptan | 1 | 83 | Risk Ratio (M‐H, Random, 95% CI) | 2.87 [0.14, 57.89] |
| 8.2 Lixivaptan | 2 | 306 | Risk Ratio (M‐H, Random, 95% CI) | 0.51 [0.04, 5.78] |
| 8.3 Satavaptan | 3 | 262 | Risk Ratio (M‐H, Random, 95% CI) | 1.98 [0.35, 11.11] |
| 8.4 Tolvaptan | 4 | 941 | Risk Ratio (M‐H, Random, 95% CI) | 2.73 [0.81, 9.22] |
| 9 Thirst Show forest plot | 13 | Odds Ratio (Random, 95% CI) | 2.77 [1.80, 4.27] | |
| 10 Other adverse events Show forest plot | 17 | Risk Ratio (M‐H, Random, 95% CI) | Subtotals only | |
| 10.1 Polyuria | 6 | 1272 | Risk Ratio (M‐H, Random, 95% CI) | 4.69 [1.59, 13.85] |
| 10.2 Hypotension | 14 | 1748 | Risk Ratio (M‐H, Random, 95% CI) | 1.11 [0.75, 1.63] |
| 10.3 Acute kidney injury | 8 | 1920 | Risk Ratio (M‐H, Random, 95% CI) | 0.89 [0.67, 1.18] |
| 10.4 Liver function abnormalities | 3 | 811 | Risk Ratio (M‐H, Random, 95% CI) | 2.43 [0.88, 6.70] |
| 11 Injection‐site complications at 2 to 7 days Show forest plot | 2 | Risk Ratio (M‐H, Random, 95% CI) | Subtotals only | |
| 11.1 Reactions | 1 | 49 | Risk Ratio (M‐H, Random, 95% CI) | 7.56 [0.49, 115.93] |
| 11.2 Phlebitis | 2 | 133 | Risk Ratio (M‐H, Random, 95% CI) | 3.52 [1.00, 12.41] |
| 11.3 Thrombosis | 2 | 133 | Risk Ratio (M‐H, Random, 95% CI) | 1.75 [0.21, 14.80] |
| 12 Treatment discontinuation Show forest plot | 14 | 2429 | Risk Ratio (M‐H, Random, 95% CI) | 0.93 [0.85, 1.00] |
| 12.1 Conivaptan | 4 | 288 | Risk Ratio (M‐H, Random, 95% CI) | 0.71 [0.39, 1.30] |
| 12.2 Lixivaptan | 4 | 1008 | Risk Ratio (M‐H, Random, 95% CI) | 0.93 [0.84, 1.03] |
| 12.3 Satavaptan | 2 | 145 | Risk Ratio (M‐H, Random, 95% CI) | 0.49 [0.17, 1.46] |
| 12.4 Tolvaptan | 4 | 988 | Risk Ratio (M‐H, Random, 95% CI) | 0.86 [0.66, 1.13] |
| 13 Death during follow‐up: sensitivity analysis Show forest plot | 16 | 2404 | Risk Ratio (M‐H, Random, 95% CI) | 1.10 [0.91, 1.32] |
| 13.1 Conivaptan | 5 | 296 | Risk Ratio (M‐H, Random, 95% CI) | 0.46 [0.19, 1.15] |
| 13.2 Lixivaptan | 3 | 950 | Risk Ratio (M‐H, Random, 95% CI) | 1.07 [0.37, 3.15] |
| 13.3 Tolvaptan | 8 | 1158 | Risk Ratio (M‐H, Random, 95% CI) | 1.11 [0.89, 1.39] |
| 14 Rapid increase in serum sodium concentration: sensitivity analysis Show forest plot | 14 | 2058 | Risk Ratio (M‐H, Random, 95% CI) | 1.67 [1.16, 2.40] |
| 14.1 > 8 mmol/L/d | 4 | 257 | Risk Ratio (M‐H, Random, 95% CI) | 3.22 [0.65, 15.94] |
| 14.2 > 12 mmol/L/d | 10 | 1801 | Risk Ratio (M‐H, Random, 95% CI) | 1.63 [1.09, 2.43] |