| 1 Postoperative stroke or other neurological injury: MMSE (endpoint or change score) Show forest plot | 3 | | Mean Difference (IV, Random, 95% CI) | Subtotals only |
|
| 1.1 1 week | 2 | 151 | Mean Difference (IV, Random, 95% CI) | 2.72 [1.42, 4.03] |
| 1.2 12 weeks | 3 | 179 | Mean Difference (IV, Random, 95% CI) | 1.11 [0.15, 2.07] |
| 1.3 52 weeks | 1 | 60 | Mean Difference (IV, Random, 95% CI) | 1.63 [0.70, 2.56] |
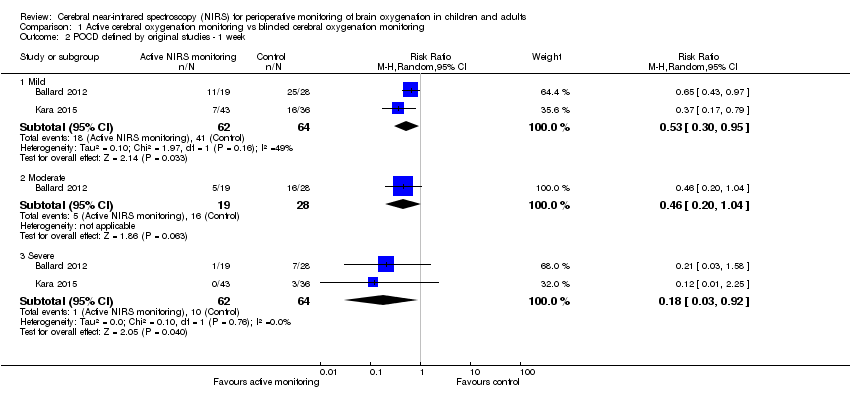
| 2 POCD defined by original studies ‐ 1 week Show forest plot | 2 | | Risk Ratio (M‐H, Random, 95% CI) | Subtotals only |
|
| 2.1 Mild | 2 | 126 | Risk Ratio (M‐H, Random, 95% CI) | 0.53 [0.30, 0.95] |
| 2.2 Moderate | 1 | 47 | Risk Ratio (M‐H, Random, 95% CI) | 0.46 [0.20, 1.04] |
| 2.3 Severe | 2 | 126 | Risk Ratio (M‐H, Random, 95% CI) | 0.18 [0.03, 0.92] |
| 3 POCD: decline in cognitive function ‐ 1 week Show forest plot | 6 | 962 | Risk Ratio (M‐H, Random, 95% CI) | 0.62 [0.37, 1.04] |
|
| 4 Intraoperative mortality or postoperative mortality: Death Show forest plot | 3 | 390 | Risk Ratio (M‐H, Random, 95% CI) | 0.63 [0.08, 5.03] |
|
| 5 The occurrence of abnormal rScO2 during or after surgery: Desaturation Show forest plot | 7 | | Risk Ratio (M‐H, Random, 95% CI) | Subtotals only |
|
| 5.1 In OR | 7 | 916 | Risk Ratio (M‐H, Random, 95% CI) | 0.81 [0.67, 0.99] |
| 5.2 In ICU | 2 | 249 | Risk Ratio (M‐H, Random, 95% CI) | 0.71 [0.37, 1.34] |
| 6 Any major non‐neurological complications as defined by individual study Show forest plot | 8 | | Risk Ratio (M‐H, Random, 95% CI) | Subtotals only |
|
| 6.1 Non‐specific any reported complications | 6 | 562 | Risk Ratio (M‐H, Random, 95% CI) | 0.76 [0.58, 1.00] |
| 6.2 Non‐specific respiratory complications | 1 | 122 | Risk Ratio (M‐H, Random, 95% CI) | 0.29 [0.03, 2.56] |
| 6.3 Non‐specific cardiac complications | 3 | 472 | Risk Ratio (M‐H, Random, 95% CI) | 0.80 [0.28, 2.31] |
| 6.4 Non‐specific renal complications | 2 | 230 | Risk Ratio (M‐H, Random, 95% CI) | 0.87 [0.27, 2.76] |
| 6.5 Pneumothorax | 1 | 150 | Risk Ratio (M‐H, Random, 95% CI) | 0.33 [0.01, 8.05] |
| 6.6 Postoperative acute pulmonary edema | 1 | 40 | Risk Ratio (M‐H, Random, 95% CI) | 0.2 [0.01, 3.92] |
| 6.7 Postoperative pulmonary embolism | 1 | 40 | Risk Ratio (M‐H, Random, 95% CI) | 0.0 [0.0, 0.0] |
| 6.8 Prolonged mechanical ventilation | 1 | 190 | Risk Ratio (M‐H, Random, 95% CI) | 0.51 [0.05, 5.54] |
| 6.9 Arrhythmia | 3 | 540 | Risk Ratio (M‐H, Random, 95% CI) | 0.83 [0.52, 1.34] |
| 6.10 Myocardial infarction | 4 | 580 | Risk Ratio (M‐H, Random, 95% CI) | 0.76 [0.35, 1.67] |
| 6.11 Cardiac ischaemia | 1 | 169 | Risk Ratio (M‐H, Random, 95% CI) | 0.26 [0.03, 2.27] |
| 6.12 Cardiac arrest | 2 | 190 | Risk Ratio (M‐H, Random, 95% CI) | 3.0 [0.12, 72.49] |
| 6.13 Reoperation for bleeding | 1 | 200 | Risk Ratio (M‐H, Random, 95% CI) | 1.0 [0.06, 15.77] |
| 6.14 MOMM | 1 | 200 | Risk Ratio (M‐H, Random, 95% CI) | 0.27 [0.08, 0.95] |
| 6.15 Rupture of the colonic anastomosis | 1 | 122 | Risk Ratio (M‐H, Random, 95% CI) | 1.01 [0.36, 2.83] |
| 6.16 Surgical reintervention | 1 | 200 | Risk Ratio (M‐H, Random, 95% CI) | 0.33 [0.01, 8.09] |
| 6.17 Patients experiencing more than 1 complication | 1 | 122 | Risk Ratio (M‐H, Random, 95% CI) | 0.29 [0.03, 2.56] |
| 6.18 Wound infection | 3 | 430 | Risk Ratio (M‐H, Random, 95% CI) | 0.97 [0.58, 1.60] |
| 6.19 Revision | 1 | 190 | Risk Ratio (M‐H, Random, 95% CI) | 0.34 [0.01, 8.25] |
| 6.20 Hospital stay > 7 days (% of patients) | 1 | 190 | Risk Ratio (M‐H, Random, 95% CI) | 1.09 [0.81, 1.48] |
| 6.21 Mediastinitis | 1 | 200 | Risk Ratio (M‐H, Random, 95% CI) | 0.33 [0.01, 8.09] |
| 6.22 Septicaemia | 1 | 200 | Risk Ratio (M‐H, Random, 95% CI) | 0.33 [0.01, 8.09] |
| 6.23 Unplanned HDU/ICU admission | 1 | 40 | Risk Ratio (M‐H, Random, 95% CI) | 0.5 [0.05, 5.08] |
| 7 Length of ICU stay (days) Show forest plot | 3 | 379 | Mean Difference (IV, Random, 95% CI) | ‐0.29 [‐0.48, ‐0.09] |
|