Risiko kanser endometrium dalam kalangan wanita yang dirawat dengan ubat perangsang ovari untuk subkesuburan.
Abstract
Background
Medical treatment for subfertility principally involves the use of ovary‐stimulating agents, including selective oestrogen receptor modulators (SERMs), such as clomiphene citrate, gonadotropins, gonadotropin‐releasing hormone (GnRH) agonists and antagonists, as well as human chorionic gonadotropin. Ovary‐stimulating drugs may act directly or indirectly upon the endometrium (lining of the womb). Nulliparity and some causes of subfertility are recognized as risk factors for endometrial cancer.
Objectives
To evaluate the association between the use of ovary‐stimulating drugs for the treatment of subfertility and the risk of endometrial cancer.
Search methods
A search was performed in CENTRAL, MEDLINE (Ovid) and Embase (Ovid) databases up to July 2016, using a predefined search algorithm. A search in OpenGrey, ProQuest, ClinicalTrials.gov, ZETOC and reports of major conferences was also performed. We did not impose language and publication status restrictions.
Selection criteria
Cohort and case‐control studies reporting on the association between endometrial cancer and exposure to ovary‐stimulating drugs for subfertility in adult women were deemed eligible.
Data collection and analysis
Study characteristics and findings were extracted by review authors independently working in pairs. Inconsistency between studies was quantified by estimating I2. Random‐effects (RE) models were used to calculate pooled effect estimates. Separate analyses were performed, comparing treated subfertile women versus general population and/or unexposed subfertile women, to address the superimposition of subfertility as an independent risk factor for endometrial cancer.
Main results
Nineteen studies were eligible for inclusion (1,937,880 participants). Overall, the quality of evidence was very low, due to serious risk of bias and indirectness (non‐randomised studies (NRS), which was reflected on the GRADE assessment.
Six eligible studies, including subfertile women, without a general population control group, found that exposure to any ovary‐stimulating drug was not associated with an increased risk of endometrial cancer (RR 0.96, 95% CI 0.67 to 1.37; 156,774 participants; very low quality evidence). Fifteen eligible studies, using a general population as the control group, found an increased risk after exposure to any ovary‐stimulating drug (RR 1.75, 95% CI 1.18 to 2.61; 1,762,829 participants; very low quality evidence).
Five eligible studies, confined to subfertile women (92,849 participants), reported on exposure to clomiphene citrate; the pooled studies indicated a positive association ( RR 1.32; 95% CI 1.01 to 1.71; 88,618 participants; very low quality evidence), although only at high dosage (RR 1.69, 95% CI 1.07 to 2.68; two studies; 12,073 participants) and at a high number of cycles (RR 1.69, 95% CI 1.16 to 2.47; three studies; 13,757 participants). Four studies found an increased risk of endometrial cancer in subfertile women who required clomiphene citrate compared to a general population control group (RR 1.87, 95% CI 1.00 to 3.48; four studies, 19,614 participants; very low quality evidence). These data do not tell us whether the association is due to the underlying conditions requiring clomiphene or the treatment itself.
Using unexposed subfertile women as controls, exposure to gonadotropins was associated with an increased risk of endometrial cancer (RR 1.55, 95% CI 1.03 to 2.34; four studies; 17,769 participants; very low quality evidence). The respective analysis of two studies (1595 participants) versus the general population found no difference in risk (RR 2.12, 95% CI 0.79 to 5.64: very low quality evidence).
Exposure to a combination of clomiphene citrate and gonadotropins, compared to unexposed subfertile women, produced no difference in risk of endometrial cancer (RR 1.18, 95% CI 0.57 to 2.44; two studies; 6345 participants; very low quality evidence). However, when compared to the general population, an increased risk was found , suggesting that the key factor might be subfertility, rather than treatment (RR 2.99, 95% CI 1.53 to 5.86; three studies; 7789 participants; very low quality evidence).
Authors' conclusions
The synthesis of the currently available evidence does not allow us to draw robust conclusions, due to the very low quality of evidence. It seems that exposure to clomiphene citrate as an ovary‐stimulating drug in subfertile women is associated with increased risk of endometrial cancer, especially at doses greater than 2000 mg and high (more than 7) number of cycles. This may largely be due to underlying risk factors in women who need treatment with clomiphene citrate, such as polycystic ovary syndrome, rather than exposure to the drug itself. The evidence regarding exposure to gonadotropins was inconclusive.
PICO
Ringkasan bahasa mudah
Risiko kanser endometrium dalam kalangan wanita subsubur yang menjalani rangsangan ovari.
Latar belakang
Untuk rawatan subkesuburan (kelewatan hamil), beberapa ubat digunakan untuk merangsang ovulasi ‐ proses kematangan dan pembebasan telur dari ovari.Ubat‐ubat ini mungkin mempengaruhi endometrium, iaitu lapisan tisu yang melapisi rahim (uterus).Walau bagaimanapun, keadaan‐keadaan yang menyebabkan subkesuburan adalah faktor risiko bagi kanser endometrium (kanser lapisan rahim) sementara kehamilan dan gabungan pil ubat pencegah hamil oral mempunyai kesan perlindungan, mengurangkan risiko kanser endometrium dengan ketara.Oleh itu, memisahkan kesan ubatan yang diguna untuk merawat subkesuburan daripada punca lain, yang boleh meningkatkan risiko kanser endometrium individu adalah sangat mencabar.
Matlamat ulasan
Untuk mengetahui sama ada ubat yang digunakan untuk merangsang ovulasi meningkatkan risiko kanser endometrium dalam kalangan wanita yang memerlukan bantuan perubatan untuk hamil.
Keputusan utama
Bukti adalah terkini sehingga Julai 2016.Sembilan belas kajian temasuk 1,937,880 peserta dikenal pasti yang membandingkan risiko membentuk kanser lapisan rahim (kanser endometrium) dalam kalangan wanita yang diberi ubat perangsang ovari dengan wanita subsubur yang tidak diberi ubat tersebut, atau wanita dari populasi umum.Secara keseluruhannya, pendedahan kepada clomiphene citrate, terutama dos tinggi dan kitaran berulang, mungkin dikaitkan dengan peningkatan risiko membentuk kanser endometrium apabila tua.Bukti hubungkait di antara pendedahan kepada gonadotropin dan kanser endometrium kurang teguh.Adalah tidak pasti untuk menyatakan sama ada penambahan risiko adalah akibat penggunaan ubat perangsang ovulasi atau sebab subkesuburan yang tersirat.
Kualiti bukti
Kualiti bukti penemuan tersebut adalah sangat rendah kerana kajian yang dimasukkan mempunyai limitasi dan pelbagai perbezaan dalam cara perlaksanaannya.
Apakah rumusannya?
Wanita yang memerlukan rawatan dengan clomiphene citrate perlu berwaspada yang mereka berisiko tinggi untuk kanser endometrium, namun ia berkemungkinan besar akibat keadaan subkesuburan dan adalah tidak mungkin untuk menilai kesan clomiphene citrate berdasarkan data sedia ada.
Authors' conclusions
Summary of findings
| Patient or population: Women treated with ovary‐stimulating drugs for subfertility | ||||||
| Outcomes | Anticipated absolute effects* (95% CI) | Relative effect | № of participants | Quality of the evidence | Comments | |
| Risk with no treatment | Risk with exposure to any ovary‐stimulating drug for subfertility | |||||
| Endometrial cancer | Study population | RR 0.96 | 156,774 | ⊕⊝⊝⊝ | ||
| 111 per 100,000 | 109 per 100,000 | |||||
| *The risk in the intervention group (and its 95% confidence interval) is based on the assumed risk in the comparison group and the relative effect of the intervention (and its 95% CI). | ||||||
| GRADE Working Group grades of evidence | ||||||
| 1 Initial level of evidence was 'low' because of the study design (observational studies). | ||||||
| Patient or population: Women treated with ovary‐stimulating drugs for subfertility | ||||||
| Outcomes | Anticipated absolute effects* (95% CI) | Relative effect | № of participants | Quality of the evidence | Comments | |
| Risk with no treatment | Risk with exposure to any ovary‐stimulating drug for subfertility | |||||
| Endometrial cancer | Study population | RR 1.75 | 1,762,829 | ⊕⊝⊝⊝ | ||
| 53 per 100,000 | 92 per 100,000 | |||||
| *The risk in the intervention group (and its 95% confidence interval) is based on the assumed risk in the comparison group and the relative effect of the intervention (and its 95% CI). | ||||||
| GRADE Working Group grades of evidence | ||||||
| 1 Initial level of evidence was 'low' because of the study design (observational studies). | ||||||
| Patient or population: Women treated with ovary‐stimulating drugs for subfertility | ||||||
| Outcomes | Anticipated absolute effects* (95% CI) | Relative effect | № of participants | Quality of the evidence | Comments | |
| Risk with no treatment | Risk with exposure to clomiphene citrate for subfertility | |||||
| Endometrial cancer | Study population | RR 1.32 | 92,849 | ⊕⊝⊝⊝ | ||
| 524 per 100,000 | 691 per 100,000 | |||||
| *The risk in the intervention group (and its 95% confidence interval) is based on the assumed risk in the comparison group and the relative effect of the intervention (and its 95% CI). | ||||||
| GRADE Working Group grades of evidence | ||||||
| 1 Initial level of evidence was 'low' because of the study design (observational studies). | ||||||
| Patient or population: Women treated with ovary‐stimulating drugs for subfertility | ||||||
| Outcomes | Anticipated absolute effects* (95% CI) | Relative effect | № of participants | Quality of the evidence | Comments | |
| Risk with no treatment | Risk with exposure to clomiphene citrate for subfertility | |||||
| Endometrial cancer | Study population | RR 1.87 | 19,614 | ⊕⊝⊝⊝ | ||
| 284 per 100,000 | 529 per 100,000 | |||||
| *The risk in the intervention group (and its 95% confidence interval) is based on the assumed risk in the comparison group and the relative effect of the intervention (and its 95% CI). | ||||||
| GRADE Working Group grades of evidence | ||||||
| 1 Initial level of evidence was 'low' because of the study design (observational studies). | ||||||
| undefined | ||||||
| Patient or population: Women treated with ovary‐stimulating drugs for subfertility | ||||||
| Outcomes | Anticipated absolute effects* (95% CI) | Relative effect | № of participants | Quality of the evidence | Comments | |
| Risk with no treatment | Risk with exposure to gonadotropins for subfertility | |||||
| Endometrial cancer | Study population | RR 1.55 | 17,769 | ⊕⊝⊝⊝ Very low 1,2,3 | ||
| 1291 per 100,000 | 1987 per 100,000 | |||||
| *The risk in the intervention group (and its 95% confidence interval) is based on the assumed risk in the comparison group and the relative effect of the intervention (and its 95% CI). | ||||||
| GRADE Working Group grades of evidence | ||||||
| 1 Initial level of evidence was 'low' because of the study design (observational studies). | ||||||
| Patient or population: Women treated with ovary‐stimulating drugs for subfertility | ||||||
| Outcomes | Anticipated absolute effects* (95% CI) | Relative effect | № of participants | Quality of the evidence | Comments | |
| Risk with no treatment | Risk with exposure to gonadotropins for subfertility | |||||
| Endometrial cancer | Study population | RR 2.12 | 1595 | ⊕⊝⊝⊝ | ||
| 542 per 100,000 | 1148 per 100,000 | |||||
| *The risk in the intervention group (and its 95% confidence interval) is based on the assumed risk in the comparison group and the relative effect of the intervention (and its 95% CI). | ||||||
| GRADE Working Group grades of evidence | ||||||
| 1 Initial level of evidence was 'low' because of the study design (observational studies). | ||||||
| Patient or population: Women treated with ovary‐stimulating drugs for subfertility | ||||||
| Outcomes | Anticipated absolute effects* (95% CI) | Relative effect | № of participants | Quality of the evidence | Comments | |
| Risk with no treatment | Risk with exposure to clomiphene citrate and gonadotropins for subfertility | |||||
| Endometrial cancer | Study population | RR 1.18 | 6345 | ⊕⊝⊝⊝ | ||
| 490 per 100,000 | 579 per 100,000 | |||||
| *The risk in the intervention group (and its 95% confidence interval) is based on the assumed risk in the comparison group and the relative effect of the intervention (and its 95% CI). | ||||||
| GRADE Working Group grades of evidence | ||||||
| 1 Initial level of evidence was 'low' because of the study design (observational studies). | ||||||
| Patient or population: Women treated with ovary‐stimulating drugs for subfertility | ||||||
| Outcomes | Anticipated absolute effects* (95% CI) | Relative effect | № of participants | Quality of the evidence | Comments | |
| Risk with no treatment | Risk with exposure to clomiphene citrate and gonadotropins for subfertility | |||||
| Endometrial cancer | Study population | RR 2.99 | 7789 | ⊕⊝⊝⊝ | ||
| 76 per 100,000 | 245 per 100,000 | |||||
| *The risk in the intervention group (and its 95% confidence interval) is based on the assumed risk in the comparison group and the relative effect of the intervention (and its 95% CI). | ||||||
| GRADE Working Group grades of evidence | ||||||
| 1 Initial level of evidence was 'low' because of the study design (observational studies). | ||||||
| Patient or population: Women treated with ovary‐stimulating drugs for subfertility | ||||||
| Outcomes | Anticipated absolute effects* (95% CI) | Relative effect | № of participants | Quality of the evidence | Comments | |
| Risk with no treatment | Risk with exposure to GnRH analogs for subfertility | |||||
| Endometrial cancer | Study population | RR 1.21 | 42,558 | ⊕⊝⊝⊝ | ||
| 458 per 100,000 | 554 per 100,000 | |||||
| *The risk in the intervention group (and its 95% confidence interval) is based on the assumed risk in the comparison group and the relative effect of the intervention (and its 95% CI). | ||||||
| GRADE Working Group grades of evidence | ||||||
| 1Initial level of evidence was 'low' because of the study design (observational studies). | ||||||
Background
Description of the condition
Subfertility remains a key issue for modern societies in terms of the psychosocial well‐being of those involved, as well as the financial and public health burden (Chambers 2007; Chambers 2013). In the UK, subfertility has been defined as failure to conceive after regular unprotected sexual intercourse for one year in the absence of known reproductive pathology (NICE 2013). The revised glossary published by the International Committee for Monitoring Assisted Reproductive Technology (ICMART), in collaboration with the World Health Organization (WHO) (Zegers‐Hochschild 2009), as well as the Practice Committee of the American Society for Reproductive Medicine (ASRM 2013), also set the time interval for definition of subfertility at one year.
Subfertility has several causes, with male partners' factors prevailing in about 30% of cases and female partners' factors in 50% of cases (DH 2009). The most commonly identifiable female factors are ovulatory disorders, endometriosis (a condition characterized by painful menses and abnormal growth of endometrial tissue outside the uterus), pelvic adhesions (scar tissue), tubal blockage or other tubal abnormalities, and hyperprolactinaemia (increased blood levels of the hormone prolactin) (Fritz 2010; UpToDate 2013).
Endometrial cancer (cancer of the lining of the womb) is a common cancer. In the USA, there is a 2.8% lifetime risk of endometrial cancer. Between 2009 and 2013, the number of new cases of endometrial cancer was 25.4 per 100,000 women per year; 4.5 per 100,000 women per year will die from the disease (SEER 2016). Nulliparity is a recognised risk factor for endometrial cancer (Cetin 2008; Venn 1999), as are conditions associated with subfertility, such as polycystic ovary syndrome (a common endocrine system disorder among women of reproductive age frequently associated with high free adrogen levels and the presence of many growing follicles in the ovaries), diabetes and obesity (DiSaia 2012), and the impact of treatment for subfertility on the risk of endometrial cancer is also being explored (Siristatidis 2013). Pregnancy and use of combined oral contraceptives are known to reduce the risk of endometrial cancer, both of which are less common in women with subfertility (Cetin 2008; DiSaia 2012). These factors make differentiating causation and association extremely challenging.
Description of the intervention
Treatment for subfertility principally involves the use of fertility medication. Ovary‐stimulating drugs are predominantly used for the treatment of women suffering from the ovulation disorders, WHO Group I (hypothalamic pituitary failure) and Group II (hypothalamic pituitary dysfunction, predominantly polycystic ovary syndrome) (NICE 2013). These agents can be used to induce ovulation in anovulatory women (anovulation refers to the non‐release of an oocyte during a menstrual cycle), but can also be implemented for controlled ovarian stimulation in women undergoing assisted reproduction.
Commonly used agents and their uses are listed here:
-
Selective oestrogen receptor modulators (SERMs), such as tamoxifen and clomiphene citrate, make up a class of compounds that act on oestrogen receptors (Steiner 2005).These agents are used during the follicular phase (the first phase of the menstrual cycle before relase of the oocyte) to increase the serum concentration of gonadotropins, which stimulate the ovary and promote follicle (the organized aggregation of cells containing the oocyte) maturation and ovulation (Klip 2000);
-
Gonadotropins (luteinising hormone (LH) and follicle‐stimulating hormone (FSH) that stimulate the ovaries may be used in their recombinant form (i.e. rFSH; produced in the laboratory from DNA coming from different sources) or as human menopausal gonadotropins (hMGs), which consist of LH and FSH extracted from the urine of menopausal women (NICE 2013);
-
Gonadotropin‐releasing hormone (GnRH) agonists (chemicals that mimic the hormone actions) and antagonists (chemicals that inhibit the hormone actions) are nearly always used in conjunction with gonadotropins. They facilitate cycle control during in vitro fertilisation (IVF) treatment (NICE 2013); their inclusion in this review inherently encompasses their combination with hMG or FSH;
-
Human chorionic gonadotropin (hCG), used intramuscularly, mimics the role of LH and induces ovulation or maturation of the oocytes (NICE 2013).
How the intervention might work
Fertility drugs raise the serum levels of endogenous gonadal hormones (estrogens and progesterone naturally produced by women) and gonadotropins and consequently increase the chance of multiple ovulations per menstrual cycle. Although the mechanisms that link fertility drugs to endometrial cancer risk are not completely clear (Jensen 2009), it has been suggested that these agents result in prolonged exposure of the endometrium to 'unopposed' or high levels of oestrogen, hence raising the risk of endometrial cancer by increasing mitotic activity (cell division resulting in increasing number of cells) and DNA replication errors (Akhmedkhanov 2001; Ayhan 2004). However, fertility drugs, by inducing ovulatory cycles and pregnancies, may also induce progesterone production, exerting potentially protective effects in terms of endometrial cancer risk.
Specifically, fertility drugs provide the following effects.
-
Selective oestrogen receptor modulators (SERMs, e.g. clomiphene citrate) are associated with a twofold to threefold increase in the mean oestradiol level, resulting in enhancement of ovulation during treated cycles, as well as an increase in progesterone levels (Dickey 1996; Sovino 2002). Clomiphene citrate might also affect the risk of endometrial cancer by interacting directly with oestrogen receptors within the uterus (Goldstein 2000; Nakamura 1997). Similarly, tamoxifen (Brown 2009; Dhaliwal 2011) has been associated with an increased risk of endometrial cancer (Swerdlow 2005).
-
Treatment with hMG or FSH, as in IVF, may substantially increase the number of ovulations compared with that seen in untreated women (Klip 2000).
-
hCG mimics the function of LH by initiating oocyte (female egg cell) maturation/ovulation (Klip 2000).
-
GnRH modulates the endogenous pituitary release of LH and FSH and subsequent folliculogenesis (maturation of the ovarian follicle). GnRH agonists and antagonists are regularly used as an addition to the treatment of female subfertility (Jensen 2009; Klip 2000).
Moreover, exposure to ovulation‐inducing agents has been implicated in the development of hyperplasia (excessive growth) of the endometrium ‐ a precursor of endometrial cancer (Miannay 1994).
Why it is important to do this review
Exposure to fertility drugs has increased over time, and hence evaluating the long‐term effects of ovulation‐inducing drugs on the risk of endometrial cancer is a matter of great importance.
Over past decades, numerous studies investigating the association between fertility drugs and endometrial cancer risk have yielded conflicting or inconclusive results (Li 2013). We have recently examined the association between controlled ovarian hyperstimulation in the context of IVF and endometrial, ovarian or cervical cancer (Siristatidis 2013). In that review, we observed an association between IVF and increased risk of endometrial cancer comparing exposed women with the general population, but this association dissipated when the comparison was made versus non‐exposed subfertile women. Broadening the research question, we now aim to evaluate all ovary‐stimulation drugs, not just those used in the context of IVF treatment.
Objectives
To evaluate the association between the use of ovary‐stimulating drugs for the treatment of subfertility and the risk of endometrial cancer.
Methods
Criteria for considering studies for this review
Types of studies
We considered prospective and retrospective cohort studies and case‐control studies in this area. Case series, case reports and in vitro and animal studies were excluded.
Types of participants
Women 18 years of age or older, with existing endometrium/uterine body. Women with preexisting cancer diagnoses of any type were excluded, along with women who had undergone fertility preservation treatment after receiving a cancer diagnosis.
Types of interventions
Any of the following regimens, offered alone or in combination, was considered as the exposure: clomiphene citrate (CC), gonadotropins, hCG and GnRH agonists/antagonists.
Outcomes in subfertile women treated with these agents were compared with those of subfertile women who received no intervention and with those of control groups of women who had no fertility problems.
Types of outcome measures
Primary outcomes
Incidence of endometrial (uterine) cancer, clinically or histologically confirmed, at any time following treatment for subfertility.
Secondary outcomes
Incidence of endometrial hyperplasia (complex, simple atypical, and complex atypical).
Search methods for identification of studies
Electronic searches
We searched CENTRAL (Issue 7, 2016), MEDLINE via Ovid (1960 to July week 3 2016) and Embase via Ovid (1980 to week 31 2016). We searched the CENTRAL database for reasons of completeness because, although this review was based on non‐randomised studies (NRSs), CENTRAL contains controlled clinical trials (CCTs), interrupted time series and controlled before and after series, in addition to randomised controlled trials (RCTs).
The search terms included a combination of thesaurus‐based and free‐text terms. CENTRAL, MEDLINE and Embase search strategies are presented in Appendix 1, Appendix 2 and Appendix 3, respectively.
We imposed no restriction on language and publication status. We searched from 1960 onwards, as the interventions sought were not available before that date.
Searching other resources
Reference lists of included studies and any relevant systematic reviews identified were also searched to identify eligible studies for inclusion. The review authors tried to identify the relevant grey literature by looking at the following:
-
OpenGrey, a system for grey literature produced in Europe, such as research reports, doctoral dissertations and conference papers (http://www.opengrey.eu/);
-
ProQuest dissertation and thesis databases (http://www.proquest.com/en‐US/catalogs/databases/detail/pqdt.shtml);
-
Published or ongoing trials in the trial registers for ongoing and registered trials: 'ClinicalTrials.gov', a service of the US National Institutes of Health (http://clinicaltrials.gov/ct2/home) and http://www.controlled‐trials.com, as well as the World Health Organization International Trials Registry Platform search portal (http://www.who.int/trialsearch/Default.aspx), and Physicians Data Query (http://www.nci.nih.gov);
-
Conference proceedings and abstracts through ZETOC (http://zetoc.mimas.ac.uk) and WorldCat Dissertations;
-
Reports of conferences in the following: Gynecologic Oncology (Annual Meeting of the American Society of Gynecologic Oncologists), International Journal of Gynecological Cancer (Annual Meeting of the International Gynecologic Cancer Society), British Journal of Cancer (British Cancer Research Meeting, Annual Meeting of the European Society of Medical Oncology (ESMO) and Annual Meeting of the American Society of Clinical Oncology (ASCO);
-
Personal communication with experts in the field who had been conducting/had led research in the field and on the specific hypothesis of this review.
Data collection and analysis
Selection of studies
We downloaded the search results to a special processing platform developed by Prodromos Kanavidis, a full description of which can be found in our recent publication (Siristatidis 2013).
We removed duplicates and all review coauthors were involved in selecting studies for eligibility. Review coauthors working in pairs (AS & HS, SG & TT, TS & TP) assessed the allocation of titles and abstracts, so that each allocation portion was independently assessed by two review coauthors. We were not blinded to authors’ names and institutions, journal of publication or study results while assessing studies for potential inclusion.
We excluded studies that clearly did not meet the inclusion criteria. For potentially relevant studies, we obtained the full text article for further assessment. We sent letters to study authors to ask for clarification about potentially relevant studies. We resolved all disagreements by consensus.
Data extraction and management
The review authors extracted data using a predesigned Excel file before copying the data into New Reference (Review Manager 2011) for analysis. We previously had piloted the data extraction form (Appendix 4) before using it in our published report (Siristatidis 2013), which, however, focused solely on IVF. We extracted the data independently while working in pairs. We resolved all disagreements by consensus.
The data we extracted included study general information (title, author, year, journal, geographical setting, and clinical setting), study characteristics (study period, number of participants per exposed/unexposed or case/control group, design, follow‐up, ascertainment of exposure and outcome, and matching factors), participant characteristics (inclusion/exclusion criteria, age, race, gynaecological and reproductive history, definition and causes of subfertility, gravidity, parity, and histological subtype of cancer), interventions (type and agent of fertility treatment, dosage of treatment, number of treatment cycles, age at first use, years since first use, reference population for the comparison, and general population or subfertile women), and risk of bias assessment data (cf. below, relevant sections).
In addition, we extracted the following results, when available:
-
Maximally adjusted (adjusted for all covariates) odds ratio (OR) and associated 95% confidence interval (CI), as defined by the study authors.
-
Maximally adjusted risk ratio (RR) and associated 95% CI, as defined by the study authors.
-
Maximally adjusted hazard ratio (HR) and associated 95% CI, based on the number of events (cases) and with consideration of the time‐to‐event.
-
Standardised incidence ratio (SIR) and associated 95% CI, estimated as the ratio of observed over expected number of cases for the exposed group of women.
-
Incidence rate ratio (IRR) and associated 95% CI, estimated from the number of cases per person‐years for exposed and unexposed women.
-
Associated raw data for recalculation (data checking) or de novo estimation of missing measures.
Assessment of risk of bias in included studies
As detailed below, RCTs were not identified, therefore the risk of bias assessment used methodology for non‐randomised studies (NRSs).
The risk of bias was assessed in accordance with relevant sections of the Cochrane Handbook for Systematic Reviews of Interventions (Higgins 2011), as well as in keeping with the rationale adopted in the most recent Cochrane review examining the association between ovarian cancer and ovary‐stimulation drugs for subfertility (Rizzuto 2013). As suggested by the Cochrane Handbook for Systematic Reviews of Interventions (Section 13.5.2.3), items included in the Newcastle‐Ottawa scale (Wells 2011) were customised for inclusion in the detailed item‐to‐item list below.
The assessment of risk of bias encompassed the examination of selection bias (comparability of groups and confounding/adjustment), performance bias, detection bias, attrition bias, reporting bias, and other bias. The qualifications 'low risk', 'high risk' and 'unclear risk' were adopted for each 'risk of bias' domain, in accordance with the guidelines published by the Newcastle‐Ottawa scale (Wells 2011).
Selection bias
The following features of the study design were assessed for selection bias.
Comparability of groups
-
Consecutive recruitment cases (case‐control studies).
-
Population‐based controls derived from the same population as cases (case‐control studies).
-
Non‐exposed women drawn from the same population as the exposed cohort (cohort studies).
-
Comparability on cause of subfertility, diabetes mellitus, polycystic ovary syndrome (PCOS), obesity (all studies).
Confounding/Adjustment
For all studies, the following factors were evaluated as potential confounders, given that they represent known risk factors for endometrial cancer (Adami 2008).
-
Age.
-
Use of oral contraceptives.
-
Use of hormone replacement treatment (HRT).
-
Age at menarche.
-
Age at menopause.
-
Parity.
-
Smoking.
-
Alcohol intake.
-
Body mass index (BMI).
-
Diabetes mellitus.
-
PCOS.
Performance bias
The following features of the study design were evaluated.
-
Blinding of participants and personnel regarding the allocated interventions (all studies).
-
Exposure to ovary‐stimulation drugs was ascertained by a secure source, i.e. medical records or structured interviews (all studies).
-
In cases in which a structured interview was performed, interviewers assessing exposure to fertility treatment were blinded to the presence of endometrial cancer (all studies).
-
The same method was used to ascertain exposure to fertility drugs for both cases and controls (case‐control studies).
Detection bias
The following feature was assessed.
-
Assessors of cancer status were blinded to exposure status (all studies).
Attrition bias
With respect to attrition bias, the following feature was examined.
-
At least 80% of women in all groups were included in the final analysis (all studies).
Selective reporting (reporting bias)
This domain assessed the uniformity in the undertaken analyses in each study. When outcomes were reported in a prespecified way, this indicated low risk of bias. However, instances of nonreported subanalyses or models differentially implemented across various cancer types in the same study, signalled high risk of bias.
Other bias
-
Length of follow‐up was at least 10 years for the exposed group (Siristatidis 2013), as endometrial cancer reaches its peak incidence after the age of 55 years, whereas IVF exposure occurs mostly during the late reproductive years (cohort studies).
-
Study design as a non‐RCT study.
Measures of treatment effect
Both primary and secondary outcome measures were expressed as odds ratios (ORs), risk ratios (RRs), hazard ratios (HRs), standardised incidence ratios (SIRs), or incidence rate ratios (IRRs). The 95% confidence interval (CI) for log(SIR) were reconstructed via the term ± 1.96/(square root (O), where 'O' represented the observed number of events (Alder 2006). We intended to transform ORs, RRs and HRs into a single metric to reduce heterogeneity and to provide more robust estimates and analyse SIRs and IRRs separately; however, since the absolute risk of endometrial cancer is low, the four measures of association (ORs, HRs, SIRs, and IRRs) were expected to yield similar estimates of RR (Adami 2008; Larsson 2007), therefore no transformation was performed.
Unit of analysis issues
The unit of analysis was always the participant.
Dealing with missing data
The corresponding authors of 'potentially relevant' and eligible studies were contacted by email when the need arose to obtain missing data, to ask for additional information or to request methodological clarification. We did not impute missing outcome data for any of the outcomes.
Assessment of heterogeneity
It is generally expected that non‐randomised studies will be more heterogeneous than randomised studies (Cochrane Handbook for Systematic Reviews of Interventions, Section 13.6.1 (Higgins 2011), hence heterogeneity tolerance levels were adjusted accordingly. Inconsistency among studies was quantified by estimating I2 (Higgins 2011). When considerable heterogeneity was noted (I2 > 80%), the pooled estimates were suppressed in the forest plot, and results were reported as narrative text or in descriptive tables. For levels of I2 between 50% and 80%, heterogeneity was considered as moderate, and pooled analysis was attempted by using a RE model to allow for heterogeneity. Heterogeneity was also explored by means of a priori agreed subgroup analyses, by type of effect estimate.
Assessment of reporting biases
As we included more than 10 studies in the review, we assessed publication bias using Egger’s formal statistical test ((Egger 1997); Cochrane Handbook for Systematic Reviews of Interventions, Section 10.4.3.1, (Higgins 2011) at the 90% level, and a funnel plot was constructed. We intended to also use an Egger's modified test (Harbord's test) to assess possible small‐study effect biases (Harbord 2006), however the low number of included studies precluded this opportunity.
Data synthesis
Our intention was to carry out meta‐analyses separately for RCTs in accordance with the intention‐to‐treat principle and for any non‐randomised studies (cohort and case‐control studies); however, no RCTs were identified for inclusion.
We used RE models to present an analysis, where at least two relevant studies had to exist (DerSimonian 1986). We also calculated separate pooled effect estimates for each risk ratio (RR) measures (and OR, HR, SIR, IRR). As mentioned before, the four relative measures were expected to yield similar estimates . As we described earlier, when possible, subgroup analyses by type of effect estimate were performed.
Our intention was to perform sensitivity analyses by type of measure, yet this was not feasible due to the small number of included studies. Separate analyses were carried out for the different reference populations available (general population of women and subfertile women who did not receive fertility treatment).
'Summary of findings' tables
The Grades of Recommendation, Assessment, Development and Evaluation (GRADE) Working Group system was used to build 'Summary of findings' tables as suggested by the Cochrane Handbook for Systematic Reviews of Interventions (Schunemann 2011). This included comparisons of risk of endometrial cancer in women exposed to any ovary‐stimulating drug (clomiphene citrate, gonadotropins, combination of clomiphene citrate and gonadotropins, and GnRH analogues) versus untreated subfertile women or women of the general population.
The quality of evidence was very low for all comparisons. The observational nature of the included studies resulted in an initial rating of 'low' quality of evidence, which was further downgraded mostly because of the high risk of bias, and, in some comparisons, because of imprecision or inconsistency or both.
Subgroup analysis and investigation of heterogeneity
According to data availability, the various therapeutic agents were evaluated by drug subtype (SERMs, gonadotropins, GnRH agonists and antagonists, hCG) and as individual drugs. Subgroup analyses were also performed for each ovary‐stimulation agent by type of effect measures. Separate analyses were performed by:
-
gravidity and/or parity;
-
age groups;
-
causes of subfertility;
-
histological type of cancer;
-
dosage (low: 1000 mg or less; medium: 1000 to 2000 mg; high: 2000 mg or more of clomiphene citrate)
-
number of cycles (low: 1 to 3; medium: 4 to 6; high: 7 or more);
-
number of oocytes (0 to 3; 3 to 6; 6 to 10; 10 or more oocytes)
-
studies including or excluding events during the first year of follow‐up (Siristatidis 2013).
Although we intended to perform meta‐regression analyses to adjust for mutual confounding, the small number of studies precluded any meaningful analysis.
We did not need to statistically adjust for multiple analyses, as such adjustments pertain to multiple comparisons, which were not relevant in the context of our study (Sergentanis 2014; Siristatidis 2013).
Sensitivity analysis
As mentioned earlier, sensitivity analysis for each type of effect measure was not employed, as there were insufficient numbers of available studies. Similarly, sensitivity analyses based on the risk of bias assessment, although planned, were not carried out because of the high risk of bias in all of the examined studies. Sensitivity analyses were only performed for studies with mean or median follow‐up 10 years or more in the exposed cohort.
Results
Description of studies
Results of the search
Searching of all databases resulted in 8314 records: 3716 were retrieved from Medline; 4090 from Embase; and 508 from CENTRAL. Handsearch of references of relevant articles yielded 11 additional relevant studies. No relevant articles were identified by search of the grey literature. Removal of 1336 duplicates yielded 6978 unique records. After reading titles and abstracts, 40 articles were deemed potentially eligible, for which full text was obtained for further scrutiny. Of these, six studies were excluded (Characteristics of excluded studies). Thirty‐four articles corresponding to 19 studies were included. There were no studies meeting eligibility criteria that required translation. All the articles had an abstract in the English language. The selection of study process is graphically represented in a PRISMA Flow Diagram (Figure 1).

PRISMA Flow Diagram
Included studies
Nineteen studies (Benshushan 2001; Brinton 2013a; Brinton 2013b; Calderon‐Margalit 2009; Dor 2002; Dos Santos Silva 2009; Doyle 2002; Jensen 2009; Kessous 2016; Klip 2004; Kristiansson 2007; Lerner‐Geva 2012; Luke 2015; Parazzini 2001; Parazzini 2010; Potashnik 1999; Reigstad 2015; Venn 1999; Yli‐Kuha 2012) were included; Characteristics of included studies are presented in the respective section of the review.
One study was conducted in Australia (Venn 1999), one in Denmark (Jensen 2009), one in Finland (Yli‐Kuha 2012), two in Italy (Parazzini 2001; Parazzini 2010), one in Netherlands (Klip 2004), one in Norway (Reigstad 2015), one in Sweden (Kristiansson 2007), two in the UK (Dos Santos Silva 2009; Doyle 2002), seven in Israel (Benshushan 2001; Brinton 2013a; Calderon‐Margalit 2009; Dor 2002; Kessous 2016; Lerner‐Geva 2012; ; Potashnik 1999), and two in USA (Brinton 2013b; Luke 2015). Thirteen studies were multi‐centre (Benshushan 2001; Brinton 2013a; Brinton 2013b; Dor 2002; Jensen 2009; Klip 2004; Kristiansson 2007; Luke 2015; Parazzini 2001; Parazzini 2010; Reigstad 2015; Venn 1999; Yli‐Kuha 2012), whereas six were single‐centre (Calderon‐Margalit 2009; Dos Santos Silva 2009; Doyle 2002; Kessous 2016; Lerner‐Geva 2012; Potashnik 1999).
Sixteen of the studies were of retrospective cohort design (Brinton 2013a; Brinton 2013b; Calderon‐Margalit 2009; Dor 2002; Dos Santos Silva 2009; Doyle 2002; Jensen 2009; Kessous 2016; Klip 2004; Kristiansson 2007; Lerner‐Geva 2012; Luke 2015; Potashnik 1999; Reigstad 2015; Venn 1999; Yli‐Kuha 2012). Of these, eight studies identified women from IVF centres or reproductive endocrinology practices (Brinton 2013b; Dor 2002; Dos Santos Silva 2009; Doyle 2002; Klip 2004; Lerner‐Geva 2012; Potashnik 1999; Venn 1999), and five from registries (Brinton 2013a; Jensen 2009; Kristiansson 2007; Luke 2015; Reigstad 2015). One study identified its population from major obstetric units in West Jerusalem (Calderon‐Margalit 2009) and another from the reimbursements for drugs or drug combinations that are specific to these subfertility treatments (Yli‐Kuha 2012). Lastly, one study recruited consecutive women who delivered at the sole hospital in Negev, Israel, serving the entire population (Kessous 2016). Comparison of the risk of endometrial cancer in subfertile women receiving οvarian‐stimulating drugs treatment to that of untreated subfertile women, general population, or both was made by three (Brinton 2013a; Brinton 2013b; Jensen 2009), eight (Calderon‐Margalit 2009; Dor 2002; Kessous 2016; Kristiansson 2007; Luke 2015; Potashnik 1999; Reigstad 2015; Yli‐Kuha 2012), and five studies (Dos Santos Silva 2009; Doyle 2002; Klip 2004; Lerner‐Geva 2012; Venn 1999), respectively. Duration of follow‐up was more than 10 years for 10 studies (Brinton 2013b; Calderon‐Margalit 2009; Dos Santos Silva 2009; Doyle 2002; Jensen 2009; Kessous 2016; Klip 2004; Lerner‐Geva 2012; Potashnik 1999; Reigstad 2015) and less than 10 years in six studies (Brinton 2013a; Dor 2002; Kristiansson 2007; Luke 2015; Venn 1999; Yli‐Kuha 2012). All studies were conducted between 1949 and 2011.
Three studies were of case‐control design (Benshushan 2001; Parazzini 2001; Parazzini 2010), two of which included controls retrieved from the same hospitals as cases (Parazzini 2001; Parazzini 2010), and one compared cases derived from a nationwide cancer registry with population‐based controls (Benshushan 2001). All studies were conducted between 1965 and 2006.
Studies used clomiphene citrate, gonadotropins (human menopausal gonadotrophin (hMG) or human chorionic gonadotropin (hCG), and gonadotropin‐releasing hormone (GnRH) agonists, alone or in combination, as ovarian‐stimulating drugs, except for seven studies that did not provide data on the specific medications used (Dor 2002; Klip 2004; Kristiansson 2007; Parazzini 2001; Parazzini 2010; Reigstad 2015; Yli‐Kuha 2012). Twelve studies reported neither the drug doses nor the number of cycles used for subfertility treatment (Benshushan 2001; Calderon‐Margalit 2009; Dor 2002; Doyle 2002; Kessous 2016; Kristiansson 2007; Lerner‐Geva 2012; Luke 2015; Parazzini 2001; Parazzini 2010; Reigstad 2015; Yli‐Kuha 2012), while three studies only provided data on the number of fertility treatment cycles, but not the medicine dosages used (Brinton 2013a; Jensen 2009; Venn 1999).
No relevant studies of tamoxifen as an ovary‐stimulating drug for subfertility were identified. No studies were retrieved evaluating the association between ovarian‐stimulating drugs and endometrial hyperplasia.
Excluded studies
Excluded studies, along with the reason for their exclusion, are presented in the Characteristics of excluded studies section. One study was excluded because data on endometrial cancer were not stated (Klemetti 2005); notification failure email was received after sending an email requesting data to three authors of this study, including the corresponding author. Similarly, three studies were excluded, as they did not include data on exposure to ovarian stimulation drugs (Brinton 1989; ; DeMichele 2008; Yang 2015). Specifically, no response was received to our email addressed to the authors of the study by DeMichele et al. (DeMichele 2008); no data were made available for the studies by Brinton et al (Brinton 1989).), following our detailed communication with Dr. Louise Brinton. Regarding the eligibility of the pooled study by Yang et al. (Yang 2015), the authors were contacted in order to provide the results of the analyses pertaining to subfertility treatments. However, the authors did not provide any additional information, due to the considerably limited number of cases with subfertility treatment information. In one study (Holody‐Zareba 2014) tamoxifen was used exclusively for breast cancer treatment. Lastly, in one study, clomiphene citrate was used specifically for treatment of polycystic ovary syndrome (Wild 2000).
Risk of bias in included studies
Risk of bias of included studies is presented in the Characteristics of included studies section. Figure 2 depicts the assessment of the bias domains of each included study, while Figure 3 provides a graphical representation. No studies were found to be of low risk for bias, primarily because none of the studies was an RCT.

Risk of bias summary: review authors' judgements about each risk of bias item for each included study.

Risk of bias graph: review authors' judgements about each risk of bias item presented as percentages across all included studies.
Allocation
In all cohort studies, non‐exposed women were drawn from the same population as the exposed cohort; furthermore, all cohort studies, but six (Dos Santos Silva 2009; Jensen 2009; Kessous 2016; Lerner‐Geva 2012; Luke 2015; Potashnik 1999), guaranteed that no women had a history of endometrial cancer at the beginning of follow‐up. However, none of the studies guaranteed the comparability of intervention and control group in terms of PCOS, diabetes mellitus, obesity and cause of subfertility, rendering them all at high risk of selection bias
Population controls matched for age and geographical region were selected in one study (Benshushan 2001), whereas in the remaining two case‐control studies (Parazzini 2001; Parazzini 2010), controls constituted women hospitalised for non‐neoplastic ailments. Nevertheless, in all case‐control studies, cases were histologically confirmed and consecutively recruited from a secure source. Similarly to the cohort studies, no comparability among the cases and controls on PCOS, diabetes mellitus, obesity and cause of infertility was ensured,
Regarding adjustment for confounding factors among cohort studies, in one study (Kristiansson 2007), only incidence rate ratios (IRRs) were calculated based on crude estimates and, in another one (Kessous 2016), relative risks (RRs) were calculated on the basis of crude numbers. Six studies (Dor 2002; Dos Santos Silva 2009; Lerner‐Geva 2012; Luke 2015: Potashnik 1999; Venn 1999) reported Standardized Incidence Ratios (SIRs) inherently adjusted just for age and calendar time. Apart from age, two studies adjusted for body mass Index (BMI) (Brinton 2013a; Calderon‐Margalit 2009) and one for smoking (Brinton 2013a). Regarding parity, two studies adjusted for parity at exit (after last ovulation‐induction cycle) (Brinton 2013a; Doyle 2002), whereas two studies (Jensen 2009; Reigstad 2015) controlled both for parity at the beginning of follow‐up and additional births during the follow‐up period. On the other hand, one study (Brinton 2013b) adjusted for gravidity. Moreover, three studies (Brinton 2013a; Calderon‐Margalit 2009; Yli‐Kuha 2012) adjusted for socioeconomic status, one study (Yli‐Kuha 2012) for marital status and another one (Calderon‐Margalit 2009) for family size, ovulatory disorders and geographic origin. Finally, adjustment for year of first visit in the fertility clinic was performed in three studies (Brinton 2013b; Doyle 2002; Jensen 2009).
With respect to case‐control studies, one study controlled only for age (Benshushan 2001) through the matching process, whereas both of the remaining studies (Parazzini 2001; Parazzini 2010) adjusted also for parity, BMI, oral contraceptive use, hormone replacement treatment use, and education. The latter study (Parazzini 2010) additionally adjusted for age at menarche, menopausal status, study centre, and calendar period of interview.
None of the included studies provided appropriate adjustment for age at menopause, alcohol intake and diabetes mellitus, rendering them all at a high risk of bias.
Blinding
None of the studies was blinded regarding the administration of allocated interventions; therefore, all studies were rated as high risk for performance bias. In fifteen of the cohort studies (Brinton 2013a; Brinton 2013b; Dor 2002; Dos Santos Silva 2009; Doyle 2002; Jensen 2009; Kessous 2016: Klip 2004; Kristiansson 2007; Lerner‐Geva 2012; Luke 2015; Potashnik 1999; Reigstad 2015; Venn 1999; Yli‐Kuha 2012), exposure to ovary‐stimulation drugs was ascertained by a secure source, namely, medical records, whereas in one study (Calderon‐Margalit 2009), exposure was ascertained by an interview using a structured questionnaire, yet interviewers were not blinded to presence of endometrial cancer. Similarly, information on exposure in all case‐control studies was collected by trained interviewers using structured questionnaires, without being blinded to case‐control status.
Regarding ascertainment of outcome, it was performed by record linkage in all cohort studies but one (Brinton 2013b). In one study (Brinton 2013b), information on the outcome of approximately12% of participants was based on questionnaires and no blinding process was reported. Regarding case‐control studies (Benshushan 2001; Parazzini 2001; Parazzini 2010), identification of endometrial cancer cases was also registry‐based.
Incomplete outcome data
The majority of cohort studies reported a completeness of follow‐up of at least 80%, which was considered adequate a priori, therefore, these studies were considered at low risk for attrition bias. In one study (Kessous 2016), outcome data were derived from a local hospital and not from a registry, therefore implying attrition bias. In one study (Calderon‐Margalit 2009), despite accounting completeness of follow‐up among its strengths, no quantification of completeness was provided, therefore the risk of attrition bias was considered unclear. Among case‐control studies, the proportion of nonparticipants was considerably low (< 5%) in two studies (Parazzini 2001; Parazzini 2010), whereas in one study (Benshushan 2001) this proportion reached 60%, so this study was judged as being at high risk for attrition bias.
Selective reporting
Two studies (Dor 2002; Potashnik 1999) were considered at high risk for selective reporting bias, as the first one (Dor 2002) did not report results by cause of subfertility, number of IVF cycles, and treatment outcome, while the latter (Potashnik 1999) provided results by cause of subfertility only for breast cancer. In another study (Yli‐Kuha 2012), it was unclear whether analyses by specific ovulation induction drug could be performed. Furthermore, in four studies (Benshushan 2001; Dos Santos Silva 2009; Kristiansson 2007; Lerner‐Geva 2012), selective reporting of results of statistical models was observed. Specifically, one study (Lerner‐Geva 2012) reported selectively the results of the multivariate regression models, another one (Kristiansson 2007) did not provide the endometrial cancer‐specific Standarized Incidence Ratios and Poisson regression results. Likewise, one study (Dos Santos Silva 2009) did not present Cox regression models results and one study (Benshushan 2001) did not report on multivariate logistic regression models' results for the use of subfertility drugs or clomiphene citrate. Finally, one study (Reigstad 2015) did not provide results of stratified analyses for endometrial cancer.
Other potential sources of bias
Only 10 out of the 16 included cohort studies had an adequate length of follow‐up (> 10 years) (Brinton 2013b; Calderon‐Margalit 2009; Dos Santos Silva 2009; Doyle 2002; Jensen 2009; Kessous 2016: Klip 2004; Lerner‐Geva 2012; Potashnik 1999; Reigstad 2015).
Effects of interventions
See: Summary of findings for the main comparison Exposure to any ovary‐stimulating drugs for subfertility compared to untreated subfertile women and endometrial cancer risk; Summary of findings 2 Exposure to any ovary‐stimulating drugs for subfertility compared to general population and endometrial cancer risk; Summary of findings 3 Exposure to clomiphene citrate for subfertility compared to untreated subfertile women and endometrial cancer risk; Summary of findings 4 Exposure to clomiphene citrate for subfertility compared to general population and endometrial cancer risk; Summary of findings 5 Exposure to gonadotropins for subfertility compared to untreated subfertile women and endometrial cancer risk; Summary of findings 6 Exposure to gonadotropins for subfertility compared to general population and endometrial cancer risk; Summary of findings 7 Exposure to clomiphene citrate and gonadotropins for subfertility compared to untreated subfertile women and endometrial cancer risk; Summary of findings 8 Exposure to clomiphene citrate and gonadotropins for subfertility compared to general population and endometrial cancer risk; Summary of findings 9 Exposure to GnRH analogues for subfertility compared to untreated subfertile women and endometrial cancer risk
Any subfertility drug
Any drug: studies versus unexposed subfertile women
Meta‐analysis of six studies, which included 156,774 participants with unexposed subfertile women as the control group (Brinton 2013a; Dos Santos Silva 2009; Doyle 2002; Klip 2004; Lerner‐Geva 2012; Venn 1999) indicated that exposure to any subfertility drug was not associated with the risk of endometrial cancer (pooled RR 0.96, 95% CI 0.67 to 1.37, I2 = 0%; 6 studies,156,774 participants; quality of evidence: very low, Analysis 1.1, Figure 4, summary of findings Table for the main comparison).

Forest plot of comparison: 2 Exposure to any drug; comparison group: subfertile; any, outcome: 2.1 Endometrial cancer; subgroup by effect estimate.
Analyses by parity (pooled RR 1.00, 95% CI 0.05 to 18.85, I2 = 64% for parous (Analysis 2.1) and pooled RR 0.76, 95% CI 0.35 to 1.67, I2 = 0% for nulliparous women (Analysis 3.1), and number of cycles (pooled RR 0.82, 95% CI 0.11 to 6.17, I2 = 71% for low numbers (Analysis 4.1) and pooled RR 0.86, 95% CI: 0.46 to 1.59, I2 = 0% for medium numbers (Analysis 5.1) in two studies (Brinton 2013a; Klip 2004) confirmed the null pattern.
Any drug: studies versus the general population
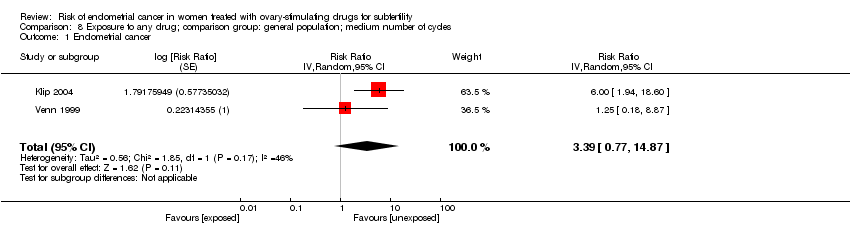
Conversely, meta‐analysis of 15 studies, including 1,762,829 participants, (Benshushan 2001; Calderon‐Margalit 2009; Dor 2002; Dos Santos Silva 2009; Doyle 2002; Kessous 2016; Klip 2004; Kristiansson 2007; Luke 2015; Parazzini 2001; Parazzini 2010; Potashnik 1999; Reigstad 2015; Venn 1999; Yli‐Kuha 2012) adopting the general population as reference, suggested an increased risk of endometrial cancer associated with exposure to any subfertility drug (pooled RR 1.75, 95% CI 1.18 to 2.61, I2 = 65%; 15 studies, 1,762,829 participants; quality of evidence: very low, Analysis 6.1, Figure 5, summary of findings Table 2).

Forest plot of comparison: 6 Exposure to any drug; comparison group: general population; any, outcome: 6.1 Endometrial cancer; subgroup by effect estimate.
Analyses by number of cycles, (pooled RR 2.33, 95% CI 0.93 to 5.87, 2 studies, I2 = 21% for low numbers (Analysis 7.1); pooled RR 3.39, 95% CI 0.77 to 14.87, 2 studies, I2 = 46% for medium numbers (Analysis 8.1), including two studies (Klip 2004; Venn 1999), did not demonstrate a significant effect with a high level of inconsistency. Analyses by number of oocytes (two studies, Klip 2004; Venn 1999) found an association with risk of endometrial cancer for ten or more retrieved oocytes (0 to 3 oocytes retrieved: pooled RR 2.95, 95% CI 0.47 to 18.57, 2 studies, I2 = 58% (Analysis 9.1); more than 10 oocytes retrieved: pooled RR 6.93, 95% CI 2.24 to 21.50, 2 studies, I2 = 0% (Analysis 10.1).
Clomiphene citrate
Clomiphene citrate: studies versus unexposed subfertile women
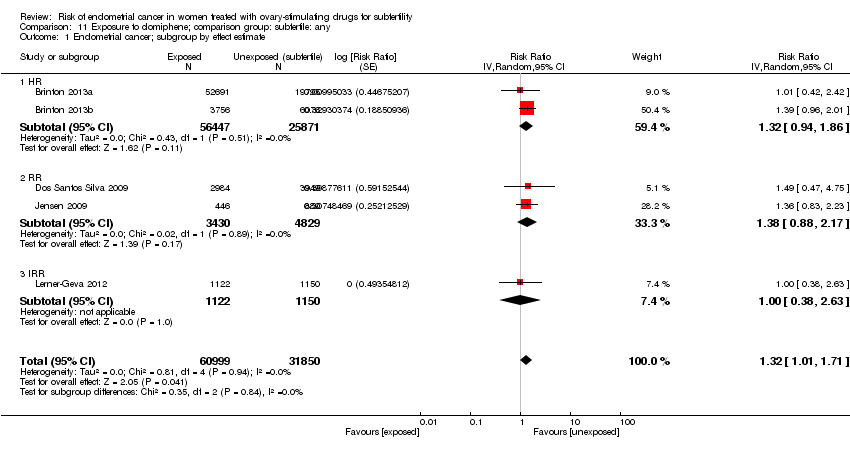
Using unexposed subfertile women as controls, five studies (Brinton 2013a; Brinton 2013b; Dos Santos Silva 2009; Jensen 2009; Lerner‐Geva 2012), reported on the association between exposure to clomiphene citrate and risk of endometrial cancer; meta‐analysis indicated an increased risk (pooled RR 1.32, 95% CI 1.01 to 1.71,I2 = 0%; 5 studies, 92,849 participants; quality of evidence: very low (Analysis 11.1, summary of findings Table 3).
Analyses by dosage pointed to an association only at high dosage (pooled RR 1.69, 95% CI 1.07 to 2.68, I2 = 0% (Analysis 14.1), whereas the analyses pertaining to low dosage (pooled RR 1.30, 95% CI 0.78 to 2.17, I2 = 0% (Analysis 12.1) and medium dosage (pooled RR 1.27, 95% CI 0.76 to 2.13, I2 = 0% (Analysis 13.1), including two studies (Brinton 2013a; Dos Santos Silva 2009) did not yield an association.
The analysis by number of cycles (three studies, Brinton 2013b; Dos Santos Silva 2009; Jensen 2009) was in accordance with that pertaining to dosage, as the effect was evident in women receiving a high number of cycles (pooled RR 1.69, 95% CI 1.16 to 2.47, I2 = 0% (Analysis 16.1) but not in those exposed to a medium number of cycles (pooled RR 1.22, 95% CI 0.87 to 1.73, I2 = 0% (Analysis 15.1).
Analyses by parity in two studies (Brinton 2013a; Jensen 2009) did not yield any associations (pooled RR 1.68, 95% CI 0.82 to 3.43, I2 = 0% for parous women (Analysis 17.1); pooled RR 1.01, 95% CI 0.51 to 2.01, I2 = 29% for nulliparous women (Analysis 18.1).
Clomiphene citrate: studies versus the general population
Four studies, encompassing 19,614 participants (Benshushan 2001; Calderon‐Margalit 2009; Dos Santos Silva 2009; Lerner‐Geva 2012), reported on exposure to clomiphene citrate compared to a general population reference group; the meta‐analysis yielded a pooled RR 1.87 and 95% CI 1.00 to 3.48, I2 = 46%; 4 studies, 19,614 participants; with high risk of bias and very low quality of evidence (Analysis 19.1, summary of findings Table 4).
Analyses by dosage, including two studies (Dos Santos Silva 2009; Potashnik 1999), suggested an association at high dosage (pooled RR 5.48, 95% CI 2.28 to 13.17, I2 = 17% (Analysis 21.1), whereas the analysis pertaining to low dosage (pooled RR 1.52, 95% CI 0.48 to 4.78, I2 = 2% (Analysis 20.1) did not yield any association.
Analysis by number of cycles, based on two studies (Dos Santos Silva 2009; Potashnik 1999), found that there may be an effect in women receiving a high number of cycles (7 or more) (pooled RR 4.17, 95% CI 1.35 to 12.94, I2 = 0% (Analysis 23.1) but there was no difference in women who had received three cycles or fewer (pooled RR 1.82, 95% CI 0.56 to 5.90, I2 = 6% (Analysis 22.1). .
Gonadotropins
Analysis of four studies, with unexposed subfertile women as the control group (Brinton 2013b; Dos Santos Silva 2009; Jensen 2009; Lerner‐Geva 2012), found that exposure to gonadotropins may be associated with increased risk of endometrial cancer (pooled RR 1.55, 95% CI 1.03 to 2.34, I2 = 0%; 4 studies, 17,769 participants; quality of evidence: very low (Analysis 24.1, summary of findings Table 5). This finding was mainly associated with one study (Jensen 2009). Analysis of the two studies (1595 participants) assessing risk against the general population (Dos Santos Silva 2009; Lerner‐Geva 2012) demonstrated no difference (pooled RR 2.12, 95% CI 0.79 to 5.64, I2 = 0%; 2 studies, 1595 participants; quality of evidence: very low (Analysis 27.1, summary of findings Table 6).No consistent dose‐response pattern arose from the subanalyses by number of cycles with subfertile women as the control group (two studies, Brinton 2013b; Jensen 2009); medium number of cycles (pooled RR 1.61, 95% CI 1.00 to 2.60, I2 = 0% (Analysis 25.1); high number of cycles (pooled RR 1.90, 95% CI 0.80 to 4.52, I2 = 0% (Analysis 26.1).
Combination of clomiphene citrate and gonadotropins
The analysis of two studies (Dos Santos Silva 2009; Lerner‐Geva 2012) with unexposed subfertile women as controls (6,345 participants) indicated no association between the combination of clomiphene citrate with gonadotropins on the risk of endometrial cancer (pooled RR 1.18, 95% CI 0.57 to 2.44, I2 = 0%; 2 studies, 6345; quality of evidence: very low (Analysis 28.1, summary of findings Table 7). The respective analysis of three studies (Dos Santos Silva 2009; Lerner‐Geva 2012; Venn 1999) versus the general population (3 studies, 7,789 participants) suggested there was a positive association (pooled RR 2.99, 95% CI 1.53 to 5.86, I2 = 44%, quality of evidence: very low (Analysis 29.1, summary of findings Table 8).
GnRH
Meta‐analysis of two studies, with 42,558 participants (Brinton 2013a; Jensen 2009), reporting on the risk of endometrial cancer after exposure to GnRH (vs subfertile women) found no difference in the risk of endometrial cancer, either at the overall analysis (pooled RR 1.21, 95% CI: 0.65 to 2.27, I2 = 0%, 2 studies, 42,558 participants; quality of evidence: very low (Analysis 30.1, summary of findings Table 9) or at the analyses (two studies, Brinton 2013a; Jensen 2009) by parity (pooled RR 2.88, 95% CI 0.95 to 8.71, I2 = 0% for parous women (Analysis 31.1) and pooled RR 0.75, 95% CI 0.34 to 1.63, I2 = 0% for nulliparous women (Analysis 32.1).
Sensitivity analyses
Where possible, sensitivity analyses were conducted excluding studies with inadequate follow‐up periods in the exposed cohort (mean or median < 10 years). In the analysis of any subfertility drug among the subfertile population, the results remained unchanged after exclusion of studies with inadequate follow‐up (Brinton 2013a; Venn 1999) (pooled RR 0.95, 95% CI 0.63 to 1.44, 2 studies, I2 = 0% (Analysis 33.1). Similarly, the robustness of the findings for the general population was replicated in sensitivity analysis of the five studies (Calderon‐Margalit 2009; Dos Santos Silva 2009; Doyle 2002 ;Kessous 2016; Potashnik 1999) with long enough follow‐up (pooled RR 2.52, 95% CI 1.80 to 3.53, I2 = 0% (Analysis 34.1). Consistent with the respective overall analyses were also the findings for subfertile women in the sensitivity analyses for exposure to clomiphene (pooled RR 1.35, 95% CI 1.03 to 1.78, 4 studies (exclusion of Brinton 2013a), I2 = 0% (Analysis 35.1) and gonadotropins (pooled RR 1.82, 95% CI 1.01 to 3.27, 3 studies (exclusion of Brinton 2013a), I2 = 0% (Analysis 37.1), as well as for the analysis versus the general population regarding clomiphene (pooled RR 2.08, 95% CI 1.01 to 4.28, 3 studies (exclusion of Benshushan 2001), I2 = 58% (Analysis 36.1) and the combination of clomiphene citrate and gonadotropins (pooled RR 3.58, 95% CI 1.82 to 7.06, 2 studies (exclusion of Venn 1999), I2 = 44% (Analysis 38.1).
Discussion
Summary of main results
We examined the effect of ovarian‐stimulating drugs for subfertility on the risk of endometrial cancer. All included studies were non‐randomised: therefore, the quality of the evidence was very low and downgrading was apparent in the GRADE assessment. Similarly to the two previous meta‐analyses by our team (Siristatidis 2013; Sergentanis 2014), studies adopting the general population, in contrast to subfertile women, as the control group, yielded different results. Indeed, results of studies examining comparisons versus the general population were affected by the superimposed effect of subfertility (Siristatidis 2013; Sergentanis 2014), the latter representing a well established risk factor for endometrial cancer (Cetin 2008).
The quality of the evidence was very low due to serious risk of bias and indirectness by GRADE assessment. All studies were at high risk of bias due to the non‐randomised design and bias due to confounders was not taken into account in the studies. The clinical bias should also be emphasized, as the groups were often markedly different and had different underlying risks of endometrial cancer.
The six studies with unexposed subfertile women used as the control group did not suggest an association between exposure to any drug and risk of endometrial cancer (RR 0.96, 95% CI 0.67 to 1.37, 156,774 participants; Analysis 1.1, Figure 4). Drug‐specific analyses of the five available studies, found an association between exposure to clomiphene citrate and risk of endometrial cancer (RR 1.32, 95% CI 1.01 to 1.71, 92,849 participants; Analysis 11.1), especially at high doses (RR 1.69, 95% CI 1.07 to 2.68; Analysis 14.1) and high number of cycles (RR 1.69, 95% CI 1.16 to 2.47; Analysis 16.1), but it was not possible to separate the effect of clomiphene from the underlying condition leading to the need for multiple cycles or high doses from the evidence available. There was no consistent association between gonadotrophin exposure and risk of endometrial cancer, when unexposed subfertile women were used as the control group (RR 1.55, 95% CI 1.03 to 2.34, 4 studies, 17,769 participants; Analysis 24.1), nor was there a consistent dose‐response effect (Analysis 25.1; Analysis 26.1).
Clomiphene citrate, one of the most widely used agents to treat subfertility, directly interacts with the oestrogen receptors in the endometrium (Nakamura 1997; Goldstein 2000) as a selective oestrogen receptor modulator, with chemical properties similar to tamoxifen (Sovino 2002), which has been associated with an increased risk of endometrial cancer (Hu 2015). The dose‐response effects may suggest a causative effect (Hill 1965). However, high doses of clomiphene citrate are very likely to have been preferentially prescribed to women with PCOS, which is a known risk factor for endometrial cancer (Dos Santos Silva 2009).
Studies comparing subfertile women treated with fertility drugs compared to a general population inherently introduced significant bias, especially since nulliparity is a known risk factor for endometrial cancer, whereas pregnancy has a protective effect. Meta‐analyses from these studies comparing exposure to any subfertility agent versus the general population demonstrated a 1.8‐fold increased risk of endometrial cancer (RR 1.75, 95% CI 1.18 to 2.61, 15 studies, 1,762,829 participants; Analysis 6.1). Higher numbers of retrieved oocytes (RR 6.93, 95% CI 2.24 to 21.50; Analysis 10.1) did appear to be associated with an increased risk of endometrial cancer, although the data were based on a highly selected, small number of women, as was the association between the high number of clomiphene cycles (RR 4.17, 95% CI 1.35 to 12.94; Analysis 23.1) or high doses of clomiphene (RR 5.48, 95% CI 2.28 to 13.17; Analysis 21.1).
Overall completeness and applicability of evidence
The included studies based their exposed groups on women who attended subfertility clinics at major hospitals. Most studies relied upon cancer registries for completeness of case ascertainment. The results may demonstrate a possible association between the requirement for treatment with some fertility medications, especially at high doses or high number of cycles, and an increased risk of endometrial cancer, compared to women who do not require treatment. However, the evidence cannot say whether this a causative effect or merely reflects an increased incidence of known risk factors for endometrial cancer in women who require fertility treatment (e.g. nulliparity, PCOS, obesity).
Quality of the evidence
Overall, the quality of the evidence was derived from non‐randomised studies and was rated as very low according to GRADE methodology (summary of findings Table for the main comparison; summary of findings Table 2; summary of findings Table 3; summary of findings Table 4; summary of findings Table 5; summary of findings Table 6; summary of findings Table 7; summary of findings Table 8; summary of findings Table 9), mostly on account of the studies being at very high risk of bias. Moderate inconsistency was highlighted in only two comparisons ( I² > 40%, Analysis 19.1; Analysis 29.1). Furthermore, all comparisons suffered from serious indirectness, mostly on account of differences in the studied populations and the presence, as well as causes, of underlying subfertility.
A variety of limitations in the individual studies may have further interfered with the quality of evidence. Specifically, the lack of adjustment for meaningful confounding factors, as well as the relatively short follow‐up periods of study subjects in relation to peak incidence of endometrial cancer, should be highlighted. . Only 10 (Brinton 2013b; Calderon‐Margalit 2009; Dos Santos Silva 2009; Doyle 2002; Jensen 2009; Kessous 2016: Klip 2004; Lerner‐Geva 2012; Potashnik 1999; Reigstad 2015) out of the 16 included cohort studies (Brinton 2013a; Brinton 2013b; Calderon‐Margalit 2009; Dor 2002; Dos Santos Silva 2009; Doyle 2002; Jensen 2009; Kessous 2016: Klip 2004; Kristiansson 2007; Lerner‐Geva 2012; Luke 2015: Potashnik 1999; Reigstad 2015; Venn 1999; Yli‐Kuha 2012) encompassed a follow‐up period longer than 10 years among exposed women. Both PCOS and obesity, which predispose to development of endometrial cancer at a young age, are known causes of subfertility and therefore may have skewed the detection of young endometrial cancers in the cohorts, under‐reporting the overall risk of endometrial cancer in the control groups. However, these findings were replicated in sensitivity analyses, which excluded studies with short follow‐up. The fact that studies were registry‐based may have minimized attrition and detection bias.
Potential biases in the review process
This systematic review was limited to observational, non‐randomised studies. It was unable to demonstrate causation, merely association, although RCTs in this area are nearly impossible, since it would be ethically challenging to restrict fertility treatment to women requiring it. The meta‐analysis used a publication‐based approach and obtaining individual participant data for each study was not possible, which could have allowed adjustment for confounding factors across included studies.
On the positive side, we adopted clear definitions of exposures and outcome and we adhered to procedures that minimized extraction, recording and retrieval bias, by carefully searching for 'grey' literature; furthermore, no language restriction was adopted. No evidence of publication bias was documented in the only analysis with more than ten study arms, namely that referring to any subfertility drug, with general population women as the reference group (Analysis 6.1), as shown in Figure 6 and verified by Egger's test (P = 0.102).

Funnel plot of comparison: 6 Exposure to any drug; comparison group: general population; any, outcome: 6.1 Endometrial cancer; subgroup by effect estimate.
One other source of bias in the review was due to multiple analyses, without adjustment for multiple analyses (Jakobsen 2014a, Jakobsen 2014b, Jakobsen 2016).
Agreements and disagreements with other studies or reviews
In general, there is a paucity of publications on the association of exposure to subfertility drugs and endometrial cancer. This meta‐analysis is in agreement with the previous systematic review by our team (Siristatidis 2013), which focused exclusively on the context of IVF . Specifically, in that study, risk of endometrial cancer was increased among women undergoing controlled ovarian hyperstimulation for IVF versus the general population (RR 2.04, 95% CI 1.22 to 3.43); on the other hand, no difference in risk was found versus untreated subfertile women (RR 0.45, 95% CI 0.18 to 1.14).
Another meta‐analysis based on six studies did not find an association between fertility treatment and risk of uterine cancer (Saso 2015).

PRISMA Flow Diagram

Risk of bias summary: review authors' judgements about each risk of bias item for each included study.

Risk of bias graph: review authors' judgements about each risk of bias item presented as percentages across all included studies.

Forest plot of comparison: 2 Exposure to any drug; comparison group: subfertile; any, outcome: 2.1 Endometrial cancer; subgroup by effect estimate.

Forest plot of comparison: 6 Exposure to any drug; comparison group: general population; any, outcome: 6.1 Endometrial cancer; subgroup by effect estimate.

Funnel plot of comparison: 6 Exposure to any drug; comparison group: general population; any, outcome: 6.1 Endometrial cancer; subgroup by effect estimate.

Comparison 1 Exposure to any drug; comparison group: subfertile; any, Outcome 1 Endometrial cancer; subgroup by effect estimate.

Comparison 2 Exposure to any drug; comparison group: subfertile; parous women, Outcome 1 Endometrial cancer; subgroup by effect estimate.

Comparison 3 Exposure to any drug; comparison group: subfertile; nulliparous women, Outcome 1 Endometrial cancer.

Comparison 4 Exposure to any drug; comparison group: subfertile; low number of cycles, Outcome 1 Endometrial cancer.

Comparison 5 Exposure to any drug; comparison group: subfertile; medium number of cycles, Outcome 1 Endometrial cancer.

Comparison 6 Exposure to any drug; comparison group: general population; any, Outcome 1 Endometrial cancer; subgroup by effect estimate.

Comparison 7 Exposure to any drug; comparison group: general population; low number of cycles, Outcome 1 Endometrial cancer.
Comparison 8 Exposure to any drug; comparison group: general population; medium number of cycles, Outcome 1 Endometrial cancer.

Comparison 9 Exposure to any drug; comparison group: general population; 0‐3 number of oocytes retrieved, Outcome 1 Endometrial cancer.

Comparison 10 Exposure to any drug; comparison group: general population; >10 number of oocytes retrieved, Outcome 1 Endometrial cancer.
Comparison 11 Exposure to clomiphene; comparison group: subfertile: any, Outcome 1 Endometrial cancer; subgroup by effect estimate.

Comparison 12 Exposure to clomiphene; comparison group: subfertile; low dosage, Outcome 1 Endometrial cancer.

Comparison 13 Exposure to clomiphene; comparison group: subfertile; medium dosage, Outcome 1 Endometrial cancer.

Comparison 14 Exposure to clomiphene; comparison group: subfertile; high dosage, Outcome 1 Endometrial cancer.

Comparison 15 Exposure to clomiphene; comparison group: subfertile; medium number of cycles, Outcome 1 Endometrial cancer; subgroup by effect estimate.

Comparison 16 Exposure to clomiphene; comparison group: subfertile; high number of cycles, Outcome 1 Endometrial cancer; subgroup by effect estimate.

Comparison 17 Exposure to clomiphene; comparison group: subfertile: parous women, Outcome 1 Endometrial cancer; subgroup by effect estimate.

Comparison 18 Exposure to clomiphene; comparison group: subfertile; nulliparous women, Outcome 1 Endometrial cancer.

Comparison 19 Exposure to clomiphene; comparison group: general population; any, Outcome 1 Endometrial cancer; subgroup by effect estimate.

Comparison 20 Exposure to clomiphene; comparison group: general population; low dosage, Outcome 1 Endometrial cancer.

Comparison 21 Exposure to clomiphene; comparison group: general population; high dosage, Outcome 1 Endometrial cancer.

Comparison 22 Exposure to clomiphene; comparison group: general population; low number of cycles, Outcome 1 Endometrial cancer.

Comparison 23 Exposure to clomiphene; comparison group: general population; high number of cycles, Outcome 1 Endometrial cancer.

Comparison 24 Exposure to gonadotropins; comparison group: subfertile; any, Outcome 1 Endometrial cancer; subgroup by effect estimate.

Comparison 25 Exposure to gonadotropins; comparison group: subfertile; medium number of cycles, Outcome 1 Endometrial cancer.

Comparison 26 Exposure to gonadotropins; comparison group: subfertile; high number of cycles, Outcome 1 Endometrial cancer.

Comparison 27 Exposure to gonadotropins; comparison group: general population; any, Outcome 1 Endometrial cancer.

Comparison 28 Exposure to clomiphene + gonadotropins; comparison group: subfertile; any, Outcome 1 Endometrial cancer.

Comparison 29 Exposure to clomiphene + gonadotropins; comparison group: general population; any, Outcome 1 Endometrial cancer.

Comparison 30 Exposure to GnRH; comparison group: subfertile; any, Outcome 1 Endometrial cancer.

Comparison 31 Exposure to GnRH; comparison group: subfertile; parous women, Outcome 1 Endometrial cancer.

Comparison 32 Exposure to GnRH; comparison group: subfertile; nulliparous women, Outcome 1 Endometrial cancer.

Comparison 33 Exposure to any drug; comparison group: subfertile; any; follow‐up >10 years, Outcome 1 Endometrial cancer; subgroup by effect estimate.

Comparison 34 Exposure to any drug; comparison group: general population; any; follow‐up>10 years, Outcome 1 Endometrial cancer; subgroup by effect estimate.

Comparison 35 Exposure to clomiphene; comparison group: subfertile; any; follow‐up>10 years, Outcome 1 Endometrial cancer; subgroup by effect estimate.

Comparison 36 Exposure to clomiphene; comparison group: general population; any; follow‐up>10 years, Outcome 1 Endometrial cancer; subgroup by effect estimate.

Comparison 37 Exposure to gonadotropins; comparison group: subfertile; any; follow‐up>10 years, Outcome 1 Endometrial cancer; subgroup by effect estimate.

Comparison 38 Exposure to clomiphene + gonadotropins; comparison group: general population; any; follow‐up>10 years, Outcome 1 Endometrial cancer.
| Patient or population: Women treated with ovary‐stimulating drugs for subfertility | ||||||
| Outcomes | Anticipated absolute effects* (95% CI) | Relative effect | № of participants | Quality of the evidence | Comments | |
| Risk with no treatment | Risk with exposure to any ovary‐stimulating drug for subfertility | |||||
| Endometrial cancer | Study population | RR 0.96 | 156,774 | ⊕⊝⊝⊝ | ||
| 111 per 100,000 | 109 per 100,000 | |||||
| *The risk in the intervention group (and its 95% confidence interval) is based on the assumed risk in the comparison group and the relative effect of the intervention (and its 95% CI). | ||||||
| GRADE Working Group grades of evidence | ||||||
| 1 Initial level of evidence was 'low' because of the study design (observational studies). | ||||||
| Patient or population: Women treated with ovary‐stimulating drugs for subfertility | ||||||
| Outcomes | Anticipated absolute effects* (95% CI) | Relative effect | № of participants | Quality of the evidence | Comments | |
| Risk with no treatment | Risk with exposure to any ovary‐stimulating drug for subfertility | |||||
| Endometrial cancer | Study population | RR 1.75 | 1,762,829 | ⊕⊝⊝⊝ | ||
| 53 per 100,000 | 92 per 100,000 | |||||
| *The risk in the intervention group (and its 95% confidence interval) is based on the assumed risk in the comparison group and the relative effect of the intervention (and its 95% CI). | ||||||
| GRADE Working Group grades of evidence | ||||||
| 1 Initial level of evidence was 'low' because of the study design (observational studies). | ||||||
| Patient or population: Women treated with ovary‐stimulating drugs for subfertility | ||||||
| Outcomes | Anticipated absolute effects* (95% CI) | Relative effect | № of participants | Quality of the evidence | Comments | |
| Risk with no treatment | Risk with exposure to clomiphene citrate for subfertility | |||||
| Endometrial cancer | Study population | RR 1.32 | 92,849 | ⊕⊝⊝⊝ | ||
| 524 per 100,000 | 691 per 100,000 | |||||
| *The risk in the intervention group (and its 95% confidence interval) is based on the assumed risk in the comparison group and the relative effect of the intervention (and its 95% CI). | ||||||
| GRADE Working Group grades of evidence | ||||||
| 1 Initial level of evidence was 'low' because of the study design (observational studies). | ||||||
| Patient or population: Women treated with ovary‐stimulating drugs for subfertility | ||||||
| Outcomes | Anticipated absolute effects* (95% CI) | Relative effect | № of participants | Quality of the evidence | Comments | |
| Risk with no treatment | Risk with exposure to clomiphene citrate for subfertility | |||||
| Endometrial cancer | Study population | RR 1.87 | 19,614 | ⊕⊝⊝⊝ | ||
| 284 per 100,000 | 529 per 100,000 | |||||
| *The risk in the intervention group (and its 95% confidence interval) is based on the assumed risk in the comparison group and the relative effect of the intervention (and its 95% CI). | ||||||
| GRADE Working Group grades of evidence | ||||||
| 1 Initial level of evidence was 'low' because of the study design (observational studies). | ||||||
| undefined | ||||||
| Patient or population: Women treated with ovary‐stimulating drugs for subfertility | ||||||
| Outcomes | Anticipated absolute effects* (95% CI) | Relative effect | № of participants | Quality of the evidence | Comments | |
| Risk with no treatment | Risk with exposure to gonadotropins for subfertility | |||||
| Endometrial cancer | Study population | RR 1.55 | 17,769 | ⊕⊝⊝⊝ Very low 1,2,3 | ||
| 1291 per 100,000 | 1987 per 100,000 | |||||
| *The risk in the intervention group (and its 95% confidence interval) is based on the assumed risk in the comparison group and the relative effect of the intervention (and its 95% CI). | ||||||
| GRADE Working Group grades of evidence | ||||||
| 1 Initial level of evidence was 'low' because of the study design (observational studies). | ||||||
| Patient or population: Women treated with ovary‐stimulating drugs for subfertility | ||||||
| Outcomes | Anticipated absolute effects* (95% CI) | Relative effect | № of participants | Quality of the evidence | Comments | |
| Risk with no treatment | Risk with exposure to gonadotropins for subfertility | |||||
| Endometrial cancer | Study population | RR 2.12 | 1595 | ⊕⊝⊝⊝ | ||
| 542 per 100,000 | 1148 per 100,000 | |||||
| *The risk in the intervention group (and its 95% confidence interval) is based on the assumed risk in the comparison group and the relative effect of the intervention (and its 95% CI). | ||||||
| GRADE Working Group grades of evidence | ||||||
| 1 Initial level of evidence was 'low' because of the study design (observational studies). | ||||||
| Patient or population: Women treated with ovary‐stimulating drugs for subfertility | ||||||
| Outcomes | Anticipated absolute effects* (95% CI) | Relative effect | № of participants | Quality of the evidence | Comments | |
| Risk with no treatment | Risk with exposure to clomiphene citrate and gonadotropins for subfertility | |||||
| Endometrial cancer | Study population | RR 1.18 | 6345 | ⊕⊝⊝⊝ | ||
| 490 per 100,000 | 579 per 100,000 | |||||
| *The risk in the intervention group (and its 95% confidence interval) is based on the assumed risk in the comparison group and the relative effect of the intervention (and its 95% CI). | ||||||
| GRADE Working Group grades of evidence | ||||||
| 1 Initial level of evidence was 'low' because of the study design (observational studies). | ||||||
| Patient or population: Women treated with ovary‐stimulating drugs for subfertility | ||||||
| Outcomes | Anticipated absolute effects* (95% CI) | Relative effect | № of participants | Quality of the evidence | Comments | |
| Risk with no treatment | Risk with exposure to clomiphene citrate and gonadotropins for subfertility | |||||
| Endometrial cancer | Study population | RR 2.99 | 7789 | ⊕⊝⊝⊝ | ||
| 76 per 100,000 | 245 per 100,000 | |||||
| *The risk in the intervention group (and its 95% confidence interval) is based on the assumed risk in the comparison group and the relative effect of the intervention (and its 95% CI). | ||||||
| GRADE Working Group grades of evidence | ||||||
| 1 Initial level of evidence was 'low' because of the study design (observational studies). | ||||||
| Patient or population: Women treated with ovary‐stimulating drugs for subfertility | ||||||
| Outcomes | Anticipated absolute effects* (95% CI) | Relative effect | № of participants | Quality of the evidence | Comments | |
| Risk with no treatment | Risk with exposure to GnRH analogs for subfertility | |||||
| Endometrial cancer | Study population | RR 1.21 | 42,558 | ⊕⊝⊝⊝ | ||
| 458 per 100,000 | 554 per 100,000 | |||||
| *The risk in the intervention group (and its 95% confidence interval) is based on the assumed risk in the comparison group and the relative effect of the intervention (and its 95% CI). | ||||||
| GRADE Working Group grades of evidence | ||||||
| 1Initial level of evidence was 'low' because of the study design (observational studies). | ||||||
| Outcome or subgroup title | No. of studies | No. of participants | Statistical method | Effect size |
| 1 Endometrial cancer; subgroup by effect estimate Show forest plot | 6 | 156774 | Risk Ratio (Random, 95% CI) | 0.96 [0.67, 1.37] |
| 1.1 RR | 2 | 12548 | Risk Ratio (Random, 95% CI) | 1.31 [0.61, 2.81] |
| 1.2 IRR | 2 | 32131 | Risk Ratio (Random, 95% CI) | 0.86 [0.46, 1.63] |
| 1.3 HR | 2 | 112095 | Risk Ratio (Random, 95% CI) | 0.90 [0.52, 1.54] |
| Outcome or subgroup title | No. of studies | No. of participants | Statistical method | Effect size |
| 1 Endometrial cancer; subgroup by effect estimate Show forest plot | 2 | Risk Ratio (Random, 95% CI) | 1.00 [0.05, 18.85] | |
| Outcome or subgroup title | No. of studies | No. of participants | Statistical method | Effect size |
| 1 Endometrial cancer Show forest plot | 2 | Risk Ratio (Random, 95% CI) | 0.76 [0.35, 1.67] | |
| Outcome or subgroup title | No. of studies | No. of participants | Statistical method | Effect size |
| 1 Endometrial cancer Show forest plot | 2 | Risk Ratio (Random, 95% CI) | 0.82 [0.11, 6.17] | |
| Outcome or subgroup title | No. of studies | No. of participants | Statistical method | Effect size |
| 1 Endometrial cancer Show forest plot | 2 | Risk Ratio (Random, 95% CI) | 0.86 [0.46, 1.59] | |
| Outcome or subgroup title | No. of studies | No. of participants | Statistical method | Effect size |
| 1 Endometrial cancer; subgroup by effect estimate Show forest plot | 15 | 1.762829E6 | Risk Ratio (Random, 95% CI) | 1.75 [1.18, 2.61] |
| 1.1 SIR | 7 | 165366 | Risk Ratio (Random, 95% CI) | 1.61 [0.92, 2.82] |
| 1.2 OR | 4 | 22450 | Risk Ratio (Random, 95% CI) | 1.87 [0.96, 3.64] |
| 1.3 IRR | 1 | 647704 | Risk Ratio (Random, 95% CI) | 1.71 [0.11, 25.85] |
| 1.4 HR | 2 | 821278 | Risk Ratio (Random, 95% CI) | 1.51 [0.32, 7.19] |
| 1.5 RR | 1 | 106031 | Risk Ratio (Random, 95% CI) | 3.52 [1.67, 7.41] |
| Outcome or subgroup title | No. of studies | No. of participants | Statistical method | Effect size |
| 1 Endometrial cancer Show forest plot | 2 | Risk Ratio (Random, 95% CI) | 2.33 [0.93, 5.87] | |
| Outcome or subgroup title | No. of studies | No. of participants | Statistical method | Effect size |
| 1 Endometrial cancer Show forest plot | 2 | Risk Ratio (Random, 95% CI) | 3.39 [0.77, 14.87] | |
| Outcome or subgroup title | No. of studies | No. of participants | Statistical method | Effect size |
| 1 Endometrial cancer Show forest plot | 2 | Risk Ratio (Random, 95% CI) | 2.95 [0.47, 18.57] | |
| Outcome or subgroup title | No. of studies | No. of participants | Statistical method | Effect size |
| 1 Endometrial cancer Show forest plot | 2 | Risk Ratio (Random, 95% CI) | 6.93 [2.24, 21.50] | |
| Outcome or subgroup title | No. of studies | No. of participants | Statistical method | Effect size |
| 1 Endometrial cancer; subgroup by effect estimate Show forest plot | 5 | 92849 | Risk Ratio (Random, 95% CI) | 1.32 [1.01, 1.71] |
| 1.1 HR | 2 | 82318 | Risk Ratio (Random, 95% CI) | 1.32 [0.94, 1.86] |
| 1.2 RR | 2 | 8259 | Risk Ratio (Random, 95% CI) | 1.38 [0.88, 2.17] |
| 1.3 IRR | 1 | 2272 | Risk Ratio (Random, 95% CI) | 1.0 [0.38, 2.63] |
| Outcome or subgroup title | No. of studies | No. of participants | Statistical method | Effect size |
| 1 Endometrial cancer Show forest plot | 2 | Risk Ratio (Random, 95% CI) | 1.30 [0.78, 2.17] | |
| Outcome or subgroup title | No. of studies | No. of participants | Statistical method | Effect size |
| 1 Endometrial cancer Show forest plot | 2 | Risk Ratio (Random, 95% CI) | 1.27 [0.76, 2.13] | |
| Outcome or subgroup title | No. of studies | No. of participants | Statistical method | Effect size |
| 1 Endometrial cancer Show forest plot | 2 | Risk Ratio (Random, 95% CI) | 1.69 [1.07, 2.68] | |
| Outcome or subgroup title | No. of studies | No. of participants | Statistical method | Effect size |
| 1 Endometrial cancer; subgroup by effect estimate Show forest plot | 3 | Risk Ratio (Random, 95% CI) | 1.22 [0.87, 1.73] | |
| 1.1 RR | 2 | Risk Ratio (Random, 95% CI) | 1.08 [0.61, 1.92] | |
| 1.2 HR | 1 | Risk Ratio (Random, 95% CI) | 1.31 [0.85, 2.01] | |
| Outcome or subgroup title | No. of studies | No. of participants | Statistical method | Effect size |
| 1 Endometrial cancer; subgroup by effect estimate Show forest plot | 3 | Risk Ratio (Random, 95% CI) | 1.69 [1.16, 2.47] | |
| 1.1 RR | 2 | Risk Ratio (Random, 95% CI) | 1.99 [1.08, 3.64] | |
| 1.2 HR | 1 | Risk Ratio (Random, 95% CI) | 1.53 [0.95, 2.48] | |
| Outcome or subgroup title | No. of studies | No. of participants | Statistical method | Effect size |
| 1 Endometrial cancer; subgroup by effect estimate Show forest plot | 2 | Risk Ratio (Random, 95% CI) | 1.68 [0.82, 3.43] | |
| Outcome or subgroup title | No. of studies | No. of participants | Statistical method | Effect size |
| 1 Endometrial cancer Show forest plot | 2 | Risk Ratio (Random, 95% CI) | 1.01 [0.51, 2.01] | |
| Outcome or subgroup title | No. of studies | No. of participants | Statistical method | Effect size |
| 1 Endometrial cancer; subgroup by effect estimate Show forest plot | 4 | 19614 | Risk Ratio (Random, 95% CI) | 1.87 [1.00, 3.48] |
| 1.1 SIR | 2 | 4106 | Risk Ratio (Random, 95% CI) | 1.61 [0.79, 3.29] |
| 1.2 OR | 1 | 683 | Risk Ratio (Random, 95% CI) | 1.00 [0.24, 4.19] |
| 1.3 HR | 1 | 14825 | Risk Ratio (Random, 95% CI) | 4.56 [1.56, 13.33] |
| Outcome or subgroup title | No. of studies | No. of participants | Statistical method | Effect size |
| 1 Endometrial cancer Show forest plot | 2 | Risk Ratio (Random, 95% CI) | 1.52 [0.48, 4.78] | |
| Outcome or subgroup title | No. of studies | No. of participants | Statistical method | Effect size |
| 1 Endometrial cancer Show forest plot | 2 | Risk Ratio (Random, 95% CI) | 5.48 [2.28, 13.17] | |
| Outcome or subgroup title | No. of studies | No. of participants | Statistical method | Effect size |
| 1 Endometrial cancer Show forest plot | 2 | Risk Ratio (Random, 95% CI) | 1.82 [0.56, 5.90] | |
| Outcome or subgroup title | No. of studies | No. of participants | Statistical method | Effect size |
| 1 Endometrial cancer Show forest plot | 2 | Risk Ratio (Random, 95% CI) | 4.17 [1.35, 12.94] | |
| Outcome or subgroup title | No. of studies | No. of participants | Statistical method | Effect size |
| 1 Endometrial cancer; subgroup by effect estimate Show forest plot | 4 | 17769 | Risk Ratio (Random, 95% CI) | 1.55 [1.03, 2.34] |
| 1.1 RR | 2 | 6390 | Risk Ratio (Random, 95% CI) | 2.15 [1.11, 4.17] |
| 1.2 IRR | 1 | 1547 | Risk Ratio (Random, 95% CI) | 1.0 [0.28, 3.51] |
| 1.3 HR | 1 | 9832 | Risk Ratio (Random, 95% CI) | 1.34 [0.76, 2.37] |
| Outcome or subgroup title | No. of studies | No. of participants | Statistical method | Effect size |
| 1 Endometrial cancer Show forest plot | 2 | Risk Ratio (Random, 95% CI) | 1.61 [1.00, 2.60] | |
| Outcome or subgroup title | No. of studies | No. of participants | Statistical method | Effect size |
| 1 Endometrial cancer Show forest plot | 2 | Risk Ratio (Random, 95% CI) | 1.90 [0.80, 4.52] | |
| Outcome or subgroup title | No. of studies | No. of participants | Statistical method | Effect size |
| 1 Endometrial cancer Show forest plot | 2 | 1595 | Risk Ratio (Random, 95% CI) | 2.12 [0.79, 5.64] |
| Outcome or subgroup title | No. of studies | No. of participants | Statistical method | Effect size |
| 1 Endometrial cancer Show forest plot | 2 | 6345 | Risk Ratio (Random, 95% CI) | 1.18 [0.57, 2.44] |
| Outcome or subgroup title | No. of studies | No. of participants | Statistical method | Effect size |
| 1 Endometrial cancer Show forest plot | 3 | 7789 | Risk Ratio (Random, 95% CI) | 2.99 [1.53, 5.86] |
| Outcome or subgroup title | No. of studies | No. of participants | Statistical method | Effect size |
| 1 Endometrial cancer Show forest plot | 2 | 42558 | Risk Ratio (Random, 95% CI) | 1.21 [0.65, 2.27] |
| Outcome or subgroup title | No. of studies | No. of participants | Statistical method | Effect size |
| 1 Endometrial cancer Show forest plot | 2 | Risk Ratio (Random, 95% CI) | 2.88 [0.95, 8.71] | |
| Outcome or subgroup title | No. of studies | No. of participants | Statistical method | Effect size |
| 1 Endometrial cancer Show forest plot | 2 | Risk Ratio (Random, 95% CI) | 0.75 [0.34, 1.63] | |
| Outcome or subgroup title | No. of studies | No. of participants | Statistical method | Effect size |
| 1 Endometrial cancer; subgroup by effect estimate Show forest plot | 4 | 39671 | Risk Ratio (Random, 95% CI) | 0.95 [0.63, 1.44] |
| 1.1 RR | 2 | 12548 | Risk Ratio (Random, 95% CI) | 1.31 [0.61, 2.81] |
| 1.2 IRR | 1 | 2431 | Risk Ratio (Random, 95% CI) | 1.0 [0.49, 2.06] |
| 1.3 HR | 1 | 24692 | Risk Ratio (Random, 95% CI) | 0.71 [0.36, 1.39] |
| Outcome or subgroup title | No. of studies | No. of participants | Statistical method | Effect size |
| 1 Endometrial cancer; subgroup by effect estimate Show forest plot | 5 | 129209 | Risk Ratio (Random, 95% CI) | 2.52 [1.80, 3.53] |
| 1.1 SIR | 3 | 8148 | Risk Ratio (Random, 95% CI) | 2.17 [1.44, 3.26] |
| 1.2 HR | 1 | 15030 | Risk Ratio (Random, 95% CI) | 3.39 [1.28, 8.97] |
| 1.3 RR | 1 | 106031 | Risk Ratio (Random, 95% CI) | 3.52 [1.67, 7.41] |
| Outcome or subgroup title | No. of studies | No. of participants | Statistical method | Effect size |
| 1 Endometrial cancer; subgroup by effect estimate Show forest plot | 4 | 20363 | Risk Ratio (Random, 95% CI) | 1.35 [1.03, 1.78] |
| 1.1 HR | 1 | 9832 | Risk Ratio (Random, 95% CI) | 1.39 [0.96, 2.01] |
| 1.2 RR | 2 | 8259 | Risk Ratio (Random, 95% CI) | 1.38 [0.88, 2.17] |
| 1.3 IRR | 1 | 2272 | Risk Ratio (Random, 95% CI) | 1.0 [0.38, 2.63] |
| Outcome or subgroup title | No. of studies | No. of participants | Statistical method | Effect size |
| 1 Endometrial cancer; subgroup by effect estimate Show forest plot | 3 | 18931 | Risk Ratio (Random, 95% CI) | 2.08 [1.01, 4.28] |
| 1.1 SIR | 2 | 4106 | Risk Ratio (Random, 95% CI) | 1.61 [0.79, 3.29] |
| 1.2 HR | 1 | 14825 | Risk Ratio (Random, 95% CI) | 4.56 [1.56, 13.33] |
| Outcome or subgroup title | No. of studies | No. of participants | Statistical method | Effect size |
| 1 Endometrial cancer; subgroup by effect estimate Show forest plot | 3 | 7937 | Risk Ratio (Random, 95% CI) | 1.82 [1.01, 3.27] |
| 1.1 RR | 2 | 6390 | Risk Ratio (Random, 95% CI) | 2.15 [1.11, 4.17] |
| 1.2 IRR | 1 | 1547 | Risk Ratio (Random, 95% CI) | 1.0 [0.28, 3.51] |
| Outcome or subgroup title | No. of studies | No. of participants | Statistical method | Effect size |
| 1 Endometrial cancer Show forest plot | 2 | 1246 | Risk Ratio (Random, 95% CI) | 3.58 [1.82, 7.06] |