Intervensi untuk mengurangkan duduk di tempat kerja
Referencias
References to studies included in this review
References to studies excluded from this review
References to studies awaiting assessment
References to ongoing studies
Additional references
Characteristics of studies
Characteristics of included studies [ordered by study ID]
| Methods | Non‐random allocation by clusters: CBA Single‐blind Study duration: 3 months Dropout: 9% Location: Australia Recruitment: control group participants were recruited from locations separated from the intervention group participants by at least 1 building level | |
| Participants | Population: employees in public health research centres within 2 academic institutions, aged 20‐65 years Intervention group: 18 participants Control group: 12 participants Demographics: BMI: intervention group 22.6 (SD 2.6) kg/m², control group 21.5 (SD 2.6) kg/m² | |
| Interventions | Duration: 3 months Intervention: sit‐stand desk Control: sit‐desk | |
| Outcomes | Outcome name, measurement time/tool (units of measurement)
| |
| Notes | This study was funded by a University of Queensland Major Equipment and Infrastructure grant. Alkhajah was supported by a United Arab Emirates Ministry of Higher Education and Scientifıc Research Scholarship; Reeves was supported by a National Health and Medical Research Council (NHMRC) Early Career Fellowship; Eakin was supported by an NHMRC Senior Research Fellowship; Owen was supported by an NHMRC Senior Principal Research Fellowship; and Healy was supported by an NHMRC Early Career Fellowship. Authors reported no financial disclosures. | |
| Risk of bias | ||
| Bias | Authors' judgement | Support for judgement |
| Random sequence generation (selection bias) | High risk | Randomisation was not done as participants in intervention and control groups were selected from different building locations. |
| Allocation concealment (selection bias) | High risk | Intervention and control groups were selected from two separate locations. However no information on allocation concealment. |
| Blinding of participants and personnel (performance bias) | High risk | The intervention group had sit‐stand desks installed at their workplace and received verbal instruction on their use, as well as written instructions on the correct ergonomic posture for both sitting and standing and the importance of regular postural change throughout the day. The control group had no change in desks and participants were advised to maintain usual day‐to‐day activity. The participants were probably aware of their allocation. The authors do not report who gave the instructions to the intervention and control groups. |
| Blinding of outcome assessment (detection bias) | Unclear risk | Not reported |
| Incomplete outcome data (attrition bias) | Low risk | Virtually no attrition: only one participant was missing from the control group because of a malfunctioning accelerometer‐inclinometer. |
| Selective reporting (reporting bias) | Low risk | All outcomes mentioned in the method section were reported. Study protocol was not available. |
| Baseline comparability/ imbalance | High risk | Baseline data for age and gender were similar. It seems probable that there were baseline imbalances in awareness and physical activity levels between intervention and control groups as participants to the intervention group were selected from an academic institution focused on sedentary behaviour research whereas participants in the control group were never involved in physical activity research. |
| Validity of outcome measure | Low risk | The accelerometer‐inclinometer is a valid instrument for the measurement of sitting time. |
| Methods | Random allocation by clusters Single‐blind Study duration: 12 months Dropout: more than 45% in both groups. Location: Australia Recruitment: participants were invited to attend an information session, during which eligibility was confirmed and informed written consent was obtained. | |
| Participants | Population: employees from an international property and infrastructure group, located at two cities: Sydney and Brisbane. Organisational‐support intervention (ORG) group: 9 teams with 117 employees ORG + tracker group: 9 teams with 93 employees Demographics: Mean age: ORG group: 40.0 (SD 8.0), ORG + tracker group: 37.6 (SD 7.8) % of males: ORG group 60 %, ORG+ tracker group 47 % BMI: ORG group 25.0 (SD 3.4) kg/m², ORG + tracker group 24.1 (SD 3.4) kg/m² | |
| Interventions | Duration: 12 months Organisational‐support intervention (ORG group): information booklet, five fortnightly emails consisting of chosen activity‐promoting tips, comments from participants or managers, images of participants taking part in the ‘Stand Up, Sit Less, Move More’ message and the organisation’s branding. ORG + tracker group: organisational support combined with activity tracker | |
| Outcomes | Outcome name, measurement time/tool (units of measurement)
| |
| Notes | The authors declared that they have no competing interests. | |
| Risk of bias | ||
| Bias | Authors' judgement | Support for judgement |
| Random sequence generation (selection bias) | Low risk | Randomisation sequence was generated using randomisation website. |
| Allocation concealment (selection bias) | Low risk | A university staff member not involved in the study randomised teams by strata (location B/small location A teams/large location A teams) to either Group ORG or Group ORG + tracker. |
| Blinding of participants and personnel (performance bias) | High risk | Neither the research team nor participants were blinded to participants’ randomisation status. |
| Blinding of outcome assessment (detection bias) | Unclear risk | Not reported |
| Incomplete outcome data (attrition bias) | Low risk | Missing data were imputed by chained equations. |
| Selective reporting (reporting bias) | Low risk | All the outcomes mentioned in the protocol were reported. |
| Baseline comparability/ imbalance | High risk | Group ORG had a higher proportion of males, senior leaders and overweight participants, had fewer managers and reported more lower‐extremity musculoskeletal problems than Group ORG + tracker. |
| Validity of outcome measure | Low risk | The accelerometer is a valid instrument for the measurement of sitting time. |
| Methods | Random allocation Single‐blind Study duration: 8 months Drop out: 10% (five participants were lost to follow‐up and one discontinued the intervention). Location: USA Recruitment: participants were recruited via an electronic advertisement on the company’s well‐being website. The advertisement included a link to an online eligibility survey. Research staff contacted interested and eligible employees via telephone to schedule a baseline testing session. | |
| Participants | Population: healthy adults working in full‐time sedentary jobs at a large private company were invited to participate via an electronic advertisement on the company’s well‐being website. They were physically inactive, overweight/obese. Intervention group: 27 participants Control group: 27 participants Demographics: Mean age: intervention: 45.2 (SD 10.9), control 45 (SD 10.7), 70% participants were females in both intervention and control groups BMI: intervention 34.5 (SD 6.8) kg/m², control 33 (SD 5.6)kg/m² | |
| Interventions | Duration of intervention: 16 weeks Intervention: ergonomic workstation intervention; three activity‐promoting emails/week and access to a seated active workstation (elliptical machine, activeLife Trainer). Control: ergonomic intervention and emails only. | |
| Outcomes | Outcome name, measurement time/tool (units of measurement)
| |
| Notes | The second author, Dr Christoph Leonhard, owns propriety rights to the activeLife Trainer. No other financial disclosures were reported by the authors. | |
| Risk of bias | ||
| Bias | Authors' judgement | Support for judgement |
| Random sequence generation (selection bias) | Low risk | A 1:1 randomisation scheme was generated by the principal investigator using an online random sequence generator. |
| Allocation concealment (selection bias) | Low risk | Based on the randomisation scheme, participants were provided a sealed envelope indicating their treatment assignment. |
| Blinding of participants and personnel (performance bias) | High risk | The envelope was provided by a research assistant who was previously unaware of the randomisation schedule, but the participants were not blinded. |
| Blinding of outcome assessment (detection bias) | Unclear risk | Not reported |
| Incomplete outcome data (attrition bias) | Low risk | 54 of the 60 participants completed all assessments. Five were lost to follow‐up and one discontinued the intervention thus yielding a total attrition of 10%. |
| Selective reporting (reporting bias) | Low risk | All outcomes mentioned in the method section were reported. |
| Baseline comparability/ imbalance | Low risk | Mean age: intervention: 45.2 (10.9), control 45 (10.7), 70% participants were females in both intervention and control groups, BMI: intervention 34.5 (6.8) kg/m², control 33 (5.6)kg/m² |
| Validity of outcome measure | Low risk | The accelerometer is a valid instrument for the measurement of sitting time. |
| Methods | Random allocation with cross‐over and wait‐list control Participants were allocated randomly by drawing from the ballot four at a time. The first four were allocated to intervention group and next four to control group for four weeks. The remaining participants were assigned to the wait‐list control condition and were placed on the waiting list in seven groups (four to five people per group). After the initial four weeks, the previous control group received the intervention with the next group from the ballot draw serving as their controls. This was repeated until all nine groups had received the intervention. Unblinded Study duration: 9 weeks Dropout: 7% Location: Australia Recruitment: project was advertised to staff as part of their workplace wellness program via internal mail, staff meetings and information fliers in the office. Staff members who were interested in participating contacted the research team and received additional project information and an expression of interest form. They could then join the study ballot by returning the expression of interest form. | |
| Participants | Population: staff from a non‐government health agency in New South Wales, Australia Demographics: BMI (kg/m²): underweight (< 18.5): 13%, normal range (18.5–24.9): 50%, overweight (25–29.9): 25%, obese (≥ 30): 13% | |
| Interventions | Duration of intervention: 9 weeks Intervention: sit‐stand desk Control: no sit‐stand desk | |
| Outcomes | Outcome name, measurement time/tool (units of measurement)
| |
| Notes | This research was supported by funding from Heart Foundation New South Wales, and Australian National Health and Medical Research Council Program Grant (#569940). | |
| Risk of bias | ||
| Bias | Authors' judgement | Support for judgement |
| Random sequence generation (selection bias) | Low risk | Randomly drawn from a ballot by a researcher in the presence of potential participants and other researchers. Participants were allocated to the intervention group, control group and wait‐list control condition. |
| Allocation concealment (selection bias) | High risk | Allocation concealment was not possible due to the open plan nature of the study office environment. |
| Blinding of participants and personnel (performance bias) | High risk | Research staff, participants, and assessors were not blinded to group allocation. |
| Blinding of outcome assessment (detection bias) | Unclear risk | Not reported |
| Incomplete outcome data (attrition bias) | Low risk | Three participants who were missing age or BMI values were not included in the analyses. Imputing values for these missing covariate values did not influence the effect of the intervention on the adjusted estimates for the outcomes, nor did it change the effects age or BMI had on the outcome. |
| Selective reporting (reporting bias) | Low risk | All outcomes mentioned in the methods section were reported. The study protocol was not available. |
| Baseline comparability/ imbalance | Low risk | Since the trial used a cross‐over design, all the participants would receive the interventions at some point. |
| Validity of outcome measure | Low risk | The accelerometer is a valid instrument for the measurement of sitting time. |
| Methods | Non‐random allocation: CBA Single‐blind Study duration: 20 weeks Dropout: 22% Location: Australia Recruitment: the research team gave a presentation about the study to team leaders and managers, who then discussed the study with their staff. Participants joined the study by returning a signed consent form to the researchers. | |
| Participants | Population: customer care (call centre) staff from two teams working at one worksite of a large telecommunications company in Sydney, Australia. Intervention group: 16 participants Control group: 15 participants Demographics: Mean age: control 35.1 (SD 11.5), intervention 31.0 (SD 10.0) The intervention group had higher BMI than control group. | |
| Interventions | Duration: 19 weeks Intervention: sit‐stand desk + email reminders Control: no sit‐stand desk | |
| Outcomes | Outcome name, measurement time/tool (units of measurement)
| |
| Notes | A co‐author, Amanda Sainsbury has received payment from Eli Lilly, the Pharmacy Guild of Australia, Novo Nordisk, and the Dietitians Association of Australia for seminar presentations at conferences. She is also the author of The Don’t Go Hungry Diet (Bantam, Australia, and New Zealand, 2007) and Don’t Go Hungry For Life (Bantam, Australia, and New Zealand, 2011). | |
| Risk of bias | ||
| Bias | Authors' judgement | Support for judgement |
| Random sequence generation (selection bias) | High risk | Randomisation was not performed. |
| Allocation concealment (selection bias) | High risk | Allocation was not concealed. |
| Blinding of participants and personnel (performance bias) | High risk | Neither the research team nor participants were blinded. |
| Blinding of outcome assessment (detection bias) | Unclear risk | Not reported |
| Incomplete outcome data (attrition bias) | High risk | Low participant adherence to activity monitor use and device malfunction resulted in high attrition rates. |
| Selective reporting (reporting bias) | Low risk | All outcomes mentioned in the method section were reported. Study protocol was not available. |
| Baseline comparability/ imbalance | Low risk | Both groups were comparable at baseline for age, sex and BMI. |
| Validity of outcome measure | Low risk | The accelerometer and Occupational Sitting and Physical Activity Questionnaire (OSPAQ) are valid tools for the measurement of sitting time. |
| Methods | Random allocation by clusters Single‐blind | |
| Participants | Population description: office employees (18 years or above), working at the Dutch financial service provider Demographics: Age in years: group motivational interviewing (GMI) 43.6 (SD 10.3); environmental modification 42.2 (SD 10.5); GMI + environmental modification 38.0 (SD 10.5); no intervention 40.7 (SD 9.2) Male [n (%)]: GMI 73 (SD 61.9); Environmental modification 60 (SD 62.5); GMI + Environmental modification 51 (SD 55.4); no intervention 65 (SD 61.3) | |
| Interventions | Duration of intervention: environmental modification: 12 months and GMI: 3.5 months The Be Active & Relax program was evaluated using 4 arms: GMI derived from Motivational Interviewing (MI). MI is a counselling style that stimulates behavioural change by focusing on exploring and resolving ambivalence. A group setting has several benefits, e.g. sharing experiences, providing feedback and giving support. | |
| Outcomes | Outcome name, measurement time/tool (units of measurement)
| |
| Notes | ||
| Risk of bias | ||
| Bias | Authors' judgement | Support for judgement |
| Random sequence generation (selection bias) | Low risk | Randomisation was executed by an independent researcher by using a computer generated list from SPSS. |
| Allocation concealment (selection bias) | Unclear risk | No information |
| Blinding of participants and personnel (performance bias) | High risk | Blinding of the participants and intervention providers for the social environmental intervention was impossible. |
| Blinding of outcome assessment (detection bias) | Unclear risk | Not reported |
| Incomplete outcome data (attrition bias) | Low risk | Incompleteness of the data is taken into account with the multilevel analysis. Loss to follow‐up at 6 months was considerable (> 20%). However, there were no significant differences at baseline between responders and non‐responders. |
| Selective reporting (reporting bias) | Low risk | All mentioned outcomes in the study protocol were reported. |
| Baseline comparability/ imbalance | Low risk | No differences regarding age, gender, education, marital status, ethnicity, working hours, general health, job demands, supervisor support. Males were slightly over‐represented. |
| Validity of outcome measure | High risk | Validity of the questionnaire used in the study has not been tested. |
| Methods | Random allocation by clusters Single‐blind Study duration: 3 months Dropout: Location: Denmark Recruitment: recruited through a press release and an open invitation in an electronic newsletter aimed at practitioners and health workers in municipalities and private workplaces all over Denmark | |
| Participants | Population: practitioners and health workers in municipalities and private workplaces all over Denmark Intervention group: 173 participants in 10 offices Control group: 144 participants in 9 offices Demographics: Mean age: intervention 46 (SD 10), control 45 (SD 11) % of females: intervention 61%, control 73% BMI: intervention group 26 (SD 5.0) kg/m², control group 27 (SD 4.8) kg/m² | |
| Interventions | Duration: 3 months Intervention: a multi‐component work‐based intervention (ambassadors, environmental changes, lecture, workshop, emails and texts). Control: no intervention | |
| Outcomes | Outcome name, measurement time/tool (units of measurement)
| |
| Notes | Funded by Tryg Fonden, Denmark. The funders had no role in study design, data collection or analysis, decision to publish or preparation of the manuscript. | |
| Risk of bias | ||
| Bias | Authors' judgement | Support for judgement |
| Random sequence generation (selection bias) | Low risk | A senior researcher carried out the randomisation, using random number sequence in Stata |
| Allocation concealment (selection bias) | Low risk | Randomisation took place before baseline measurements were recorded, but allocation was not disclosed to participants, researchers or data collectors until the baseline assessments had been completed |
| Blinding of participants and personnel (performance bias) | High risk | The researchers were not blinded at follow‐up. |
| Blinding of outcome assessment (detection bias) | Low risk | A blinded version of the data was used for data management and analysis. |
| Incomplete outcome data (attrition bias) | Low risk | Final levels of missing data on primary outcomes were 9% at baseline, 15% at 1‐month follow‐up and 20% at 3‐ months follow‐up. however missing data were imputed by multiple imputations using chained equations. |
| Selective reporting (reporting bias) | Low risk | All outcomes mentioned in the study protocol has been reported. |
| Baseline comparability/ imbalance | Low risk | Both groups were comparable at baseline for age, sex and BMI. |
| Validity of outcome measure | Low risk | ActiGraph GT3X accelerometer is a valid instrument for assessing physical activity and sedentary behaviour |
| Methods | Random allocation by clusters Single‐blind Study duration: 3 months Dropout: Location: Belgium Recruitment: employees were invited to participate by email | |
| Participants | Population: employees of 2 companies (a university and an environmental agency) in Flanders Intervention group: tailored group: 78 participants (2 departments), Generic group: 84 participants (2 departments) Control group: 51 participants (2 departments) Demographics: Age in years: tailored 40.5 (SD 8.6), generic 40.7 (SD 9.7), control 39.3 (SD 9.0) % of males: tailored 32%, generic 27%, control 15% % of participants with high school/university education: tailored 58%, generic 70%, control 46% BMI: tailored 24.2 (3.1) kg/m², generic 23.6 (SD 3.5) kg/m², control group 23.7 (SD 3.5) kg/m² | |
| Interventions | Duration: 3 months Intervention: tailored group: personalised computer‐tailored feedback about sitting time, including tips and suggestions on how to interrupt (taking short standing breaks) and reduce (replacing sitting by periods of standing) sitting, and in the end motivated participants were invited to create an action plan to convert intentions into specific actions. Generic group: generic information on the importance of reducing and interrupting sitting Control: usual lifestyle | |
| Outcomes | Outcome name, measurement time/tool (units of measurement) Self‐reported changes in sitting (total sitting, sitting at work, domains of leisure sitting) measured at 3 months | |
| Notes | The first author is supported by the Research Foundation Flanders (FWO) (postdoctoral research fellowship: FWO11/PDO/097). Authors declared no conflict of interest. | |
| Risk of bias | ||
| Bias | Authors' judgement | Support for judgement |
| Random sequence generation (selection bias) | Unclear risk | Not reported |
| Allocation concealment (selection bias) | Unclear risk | Not reported |
| Blinding of participants and personnel (performance bias) | Unclear risk | Not reported |
| Blinding of outcome assessment (detection bias) | Unclear risk | Not reported |
| Incomplete outcome data (attrition bias) | High risk | More than 10% participants were lost to follow‐up in each comparison groups. |
| Selective reporting (reporting bias) | High risk | Not every outcome mentioned in the study protocol has been reported. |
| Baseline comparability/ imbalance | Low risk | The comparison groups did not differ in sociodemographic, work‐related, and health‐related variables. |
| Validity of outcome measure | Low risk | The WSQ has acceptable reliability (interclass correlation coefficient = .63) and validity against objectively accelerometer‐measured sitting time (r = .34 to r = .45). |
| Methods | Random allocation by minimization Single‐blind Study duration: 12 weeks Drop out: 8% Location: Switzerland | |
| Participants | Population: staff from the confederate Swiss health insurance company EGK Intervention: 15 participants Control: 16 participants Demographics: Age: intervention: 45 (SD 12), control: 40 (SD10) Sex (m/f): intervention 4/11, control 4/12 BMI (kg/m²): Intervention: 23.7 (SD 3.7), control: 24.7 (SD 5) | |
| Interventions | Duration of intervention: 12 weeks Intervention: computer prompt + information Control: information only | |
| Outcomes | Outcome name, measurement time/tool (units of measurement)
| |
| Notes | Authors reported no conflict of interest | |
| Risk of bias | ||
| Bias | Authors' judgement | Support for judgement |
| Random sequence generation (selection bias) | Low risk | Group assignment was randomly conducted according to the minimization method: age, gender, BMI, physical activity and working time served as strata criteria in order to minimize group differences in demographical variables. |
| Allocation concealment (selection bias) | Unclear risk | No information |
| Blinding of participants and personnel (performance bias) | High risk | Testing personnel were blinded to group allocation. Participants were not blinded. |
| Blinding of outcome assessment (detection bias) | Unclear risk | Not reported |
| Incomplete outcome data (attrition bias) | High risk | 3 participants in the control group and 4 participants in the intervention group withdrew due to job changes and illness (8% of participants). They were not included in the analysis (i.e. no intention‐to‐treat analysis). |
| Selective reporting (reporting bias) | Low risk | All outcomes mentioned in the method section were reported. Study protocol was not available. |
| Baseline comparability/ imbalance | Low risk | Group differences were minimized. |
| Validity of outcome measure | Low risk | The accelerometer is a valid instrument for the measurement of sitting time. |
| Methods | Random allocation with cross‐over Unblinded Study duration: 10 weeks Dropout: 1231 working hours data were missing Location: USA Recruitment: a word‐of‐mouth search was performed for finding interested companies to host the study and Caldrea Inc. volunteered. A recruitment presentation was made at an all‐employee meeting (n ˜ 50) and was followed a few days later by enrolment interviews. | |
| Participants | Population: employees of Caldrea Inc. company, USA Demographics: average age: 40.4 years; out of 28 participants, 19 were female | |
| Interventions | Duration of intervention: 4 weeks Intervention: sit‐stand desk Three different models of desks were used: Workfit‐S, a setup that attaches to the front of one’s existing desk that can hold the computer monitor, keyboard and mouse; Workfit‐A, a setup that is identical to Workfit‐S but attaches to the back of one’s existing desk; and Workfit‐D, a whole desk that is easily moved up and down. The Workfit‐A and S also came with an added work‐surface and all three types of desks came with anti‐fatigue floor mats for comfort during standing. Control: no sit‐stand desk | |
| Outcomes | Outcome name, measurement time/tool (units of measurement) Sitting time, standing time, and light activity at work self‐reported and objectively assessed with accelerometer‐inclinometer Self‐reported energy and relaxation levels | |
| Notes | James A. Levine has patents in accelerometer algorithms with Gruve Technologies Inc. but he did not access or analyse the raw the data from the Gruve device. | |
| Risk of bias | ||
| Bias | Authors' judgement | Support for judgement |
| Random sequence generation (selection bias) | Low risk | Participants were randomly assigned to receive the intervention during period 1 or period 2, using a 1:1 allocation in 1 block of 35, using Microsoft Excel 2007. |
| Allocation concealment (selection bias) | High risk | Allocation concealment was not possible due to the nature of the intervention. |
| Blinding of participants and personnel (performance bias) | High risk | Blinding of participants and personnel was not possible due to the nature of intervention. |
| Blinding of outcome assessment (detection bias) | Unclear risk | Not reported |
| Incomplete outcome data (attrition bias) | High risk | If we assume a person works for 40 hours per week, then for 28 participants the working hours will be 8960 hours for 8 weeks (4 weeks intervention and 4 weeks control period). However the study reported only 7,729 working hours based on accelerometer data. |
| Selective reporting (reporting bias) | Low risk | All outcomes mentioned in the methods section were reported. The study protocol was not available. |
| Baseline comparability/ imbalance | Low risk | There were no significant differences in age or BMI between interventions and control groups. Most of the participants were female. |
| Validity of outcome measure | Low risk | The accelerometer is a valid instrument for the measurement of sitting time. |
| Methods | Random allocation Unblinded Study duration: 12 weeks No dropouts Location: Germany Only part of the study was presented as all the data have not been analysed. | |
| Participants | Population: desk‐based employees at VDU workplaces Demographics: mean age (years): 40.7 (range 24 to 58), control 42.1 (range 25 to 61) 4 female participants in both intervention and control groups Mean BMI: 26.3 (SD 3.2) kg/m² | |
| Interventions | Duration of intervention: 12 weeks Intervention
Control: usual office work | |
| Outcomes | Outcome name, measurement time/tool (units of measurement)
| |
| Notes | This project was initiated and funded by the German Social Accident Insurance (DGUV). | |
| Risk of bias | ||
| Bias | Authors' judgement | Support for judgement |
| Random sequence generation (selection bias) | Low risk | Following correspondence with the authors, they replied: "Randomization by computer generated list". |
| Allocation concealment (selection bias) | Low risk | Following correspondence with the authors, they replied: "our secretary, who was not involved in the project, generated the allocation list". |
| Blinding of participants and personnel (performance bias) | High risk | Following correspondence with the authors, they replied: "The participants were blinded, the personnel was not blinded (they knew according to the subject code, who belongs to the Intervention group and to the Control group)". |
| Blinding of outcome assessment (detection bias) | Unclear risk | Not reported |
| Incomplete outcome data (attrition bias) | Low risk | No attrition |
| Selective reporting (reporting bias) | Low risk | All outcomes mentioned in the method section were reported. |
| Baseline comparability/ imbalance | Low risk | Participants were recruited from different VDU workplaces. No significant difference in age of participants between intervention and control groups. 4 female participants in both intervention and control groups. |
| Validity of outcome measure | Low risk | The accelerometer is a valid instrument for the measurement of sitting time. |
| Methods | Random allocation: RCT Single‐blind Study duration: 10 days Dropout: 7% Location: United Kingdom Recruitment: healthy working adults who could stand unassisted recruited via poster and email | |
| Participants | Population: healthy adults working in an office at Glasgow Caledonian University in Scotland Intervention group: 14 participants (computer prompts (CP)) Control group: 14 participants (education) Demographics: CP group (mean age 49 (SD 8 years) were older than the education group (mean age 39 (SD 10) years), predominantly female (11 in CP group and 11 in education group), worked as administrators (4 in CP group and 3 in education group), researchers (5 in CP group and 7 in education group), lecturers (5 in CP group and 4 in education group) BMI: CP group 23.7 (SD 3.5) vs. education group 23.6 (SD 2.8) | |
| Interventions | Duration of intervention: 5 days but the participants were followed up for 10 days. Intervention: CP + information Control: information only (a short educational talk) All participants received a short educational talk regarding the health risks of prolonged sitting stating that standing every 30 minutes could be beneficial, and a short information leaflet was also provided. Then participants in the intervention group had a prompting software installed in their personal computer to remind them to take a break for 1 min every 30 minutes. | |
| Outcomes | Outcome name, measurement time/tool (units of measurement) Assessed with thigh‐mounted accelerometer‐inclinometer
| |
| Notes | This study was funded by the School of Health, Glasgow Caledonian University and formed the dissertation project for Masters of Rehabilitation Science of Rhian Evans, Henrietta Fawole, and Stephanie Sheriff. No financial support was received from any commercial company. No financial disclosures were reported by the authors of this publication. | |
| Risk of bias | ||
| Bias | Authors' judgement | Support for judgement |
| Random sequence generation (selection bias) | Low risk | Random number generation was used. |
| Allocation concealment (selection bias) | Low risk | Information on the group assignment was placed into sequentially numbered sealed opaque envelopes. The researcher was involved in opening the envelope immediately after the education. |
| Blinding of participants and personnel (performance bias) | High risk | Both the researcher and participants were aware of the allocation. Awareness of the purpose of the study may have led the education group participants to behave differently during the study, which may have affected the outcomes. |
| Blinding of outcome assessment (detection bias) | Low risk | Data treatment was conducted by a researcher blinded to the allocation of the participants. |
| Incomplete outcome data (attrition bias) | Low risk | 2 participants were excluded from analyses due to incomplete data: 1 from the CP group and 1 from the education group. As the same proportion of participants were excluded from both groups, the missing data did not have much impact on outcomes. |
| Selective reporting (reporting bias) | High risk | Not all outcomes mentioned in the study protocol were reported. |
| Baseline comparability/ imbalance | Low risk | CP group (mean age 49 (SD 8) years) was older than the education group (mean age 39 (SD 10) years), participants worked as administrators (4 in CP group, 3 in education group), researchers (5 in CP group, 7 in education group), or lecturers (5 in CP group, 4 in education group) and were predominantly female (11 in CP group, 11 in education group) |
| Validity of outcome measure | Low risk | The accelerometer is a valid instrument for the measurement of sitting time. |
| Methods | Non‐random allocation Unblinded Study duration: 6 months Dropouts: 49% Location: University of Jyväskylä, Finland Recruitment: all faculty employees (n = 170) were invited to fill out a questionnaire between August and September 2012 and again in February 2013. | |
| Participants | Population: healthy adults working in a university setting: researchers, teachers, administrative workers, assistants, professors and technical workers. Intervention group: 24 participants Control group: 21 participants Demographics: mean age: intervention 47.8 (SD 10.8) years, control 39 (SD 8.5) years. 70.8% were females in the intervention group and 81% were females in the control group. BMI (kg/m²): intervention: 24.8 (SD 3.9), control: 23.3 (SD 3.8) | |
| Interventions | Duration of intervention: 6 months Intervention: sit‐stand desk Control: no intervention | |
| Outcomes | Outcome name, measurement time/tool (units of measurement)
| |
| Notes | The study was funded by the China Scholarship Council (201206320092). | |
| Risk of bias | ||
| Bias | Authors' judgement | Support for judgement |
| Random sequence generation (selection bias) | High risk | The study did not employ randomisation. Part of the personnel moved to a renovated building with sit‐stand desks. |
| Allocation concealment (selection bias) | High risk | Allocation was not concealed. |
| Blinding of participants and personnel (performance bias) | High risk | No blinding |
| Blinding of outcome assessment (detection bias) | Unclear risk | Not reported |
| Incomplete outcome data (attrition bias) | High risk | The questionnaire was returned by 92 employees at baseline, before working at sit–stand desks, and 61 employees after 6 months. Those who completed the questionnaire only once were excluded, leaving 45 individuals who were included in the analysis. The study lost 49% participants during follow‐up. |
| Selective reporting (reporting bias) | Low risk | All outcomes mentioned in the protocol were reported. |
| Baseline comparability/ imbalance | High risk | In the intervention group participants were older and had more experience of office work. 70.8% were females in the intervention group and 81% were females in the control group. BMI (kg/m²): intervention: 24.8 (3.9), control: 23.3 (3.8) |
| Validity of outcome measure | High risk | Validity of the questionnaire used in the study has not been tested. |
| Methods | Random allocation Unblinded Study duration: 10 weeks Dropout: 16% Location: UK, Australia and Spain Recruitment: participants came from 3 major regional universities in 3 countries, represented by a lead investigator in each university, who had expressed an interest in running an employee intervention at their respective university as part of an evolving, international project. | |
| Participants | Population: white‐collar (i.e. professional, managerial, or administrative) university staff from the UK (n = 64), Australia (n = 70) and Spain (n = 80) Intervention groups:
Control group: 60 participants Demographics: mean age (years): route walking group 42.1 (SD 9.2); incidental walking group 41 (SD 9.7), control group 40.8 (SD 11.4) Women were predominant in all 3 groups Mean BMI (kg/m²): route walking group 25.1 (SD 4), incidental walking group 25.4 (SD 4.3), control group 24.2 (SD 3.8) | |
| Interventions | Duration of intervention: 10 weeks Interventions: walking strategies (route and incidental walking) Control: no intervention | |
| Outcomes | Outcome name, measurement time/tool (units of measurement)
| |
| Notes | Authors declared that they had no competing interests. | |
| Risk of bias | ||
| Bias | Authors' judgement | Support for judgement |
| Random sequence generation (selection bias) | Low risk | Pre‐intervention workday step counts and block stratification were used to assign participants at each site randomly and equally to a waiting list control or one of two intervention groups. |
| Allocation concealment (selection bias) | Unclear risk | Not reported |
| Blinding of participants and personnel (performance bias) | Unclear risk | Not reported |
| Blinding of outcome assessment (detection bias) | Unclear risk | Not reported |
| Incomplete outcome data (attrition bias) | High risk | From a potential sample size of 214 participants, 16% (n = 35) had missing data at pre‐intervention or 2 or more intervention measurement points. These data were removed prior to analyses, resulting in a final sample size of n = 179. |
| Selective reporting (reporting bias) | Low risk | All outcomes mentioned in the methods section were reported. The study protocol was not available. |
| Baseline comparability/ imbalance | Low risk | Age was not significantly different between groups: 42.1 (SD 9.2) years in the route walking group; 41 (SD 9.7) years in the incidental walking group and 40.8 (SD 11.4) years in the control group. Study participants were predominantly women. All participants were white collar workers (i.e. professional, managerial, or administrative). |
| Validity of outcome measure | Low risk | Paper‐based diaries were used to report sitting time at work. |
| Methods | Random allocation Unblinded Study duration: 10 weeks Dropout: 14% Location: USA Recruitment: strategically placed fliers posted around the Arizona State University Downtown Phoenix Campus, email advertisements delivered to employees through the Employee Wellness Committee, and word of mouth. | |
| Participants | Population: currently employed adults with predominantly sedentary occupations working in the Greater Phoenix area in 2012‐2013 Intervention group: 12 participants Control group: 10 participants Demographics: Mean age: intervention 44.2 (SD 12.5), control 47.2 (SD 13.5) 50% females in both groups BMI: intervention 24.1 (SD 3) kg/m², control 30.6 (SD 5) kg/m² Intervention group composed of significantly more “official and managerial level” individuals. | |
| Interventions | Duration of intervention: 10 weeks Intervention: one orientation to walking workstation, 5 bi‐weekly newsletters, specifically targeting workplace sitting behaviours, 5 bi‐weekly FAQ’s and access to study website for intervention content, latest sedentary behaviour research and links for tools for decreasing sitting time at work. Control: health education | |
| Outcomes | Outcome name, measurement time/tool (units of measurement) Sitting time/workday (minutes/8‐hour workday) measured by accelerometer‐inclinometer. Participants were also asked to complete a daily log to determine work schedule and verify obtained inclinometer and accelerometer data | |
| Notes | Thesis presented in partial fulfilment of the requirements for the degree Master of Science. | |
| Risk of bias | ||
| Bias | Authors' judgement | Support for judgement |
| Random sequence generation (selection bias) | Low risk | Group allocation was decided by tossing a coin. |
| Allocation concealment (selection bias) | Unclear risk | Not reported |
| Blinding of participants and personnel (performance bias) | Unclear risk | Not reported |
| Blinding of outcome assessment (detection bias) | Unclear risk | Not reported |
| Incomplete outcome data (attrition bias) | Low risk | One participant from both groups withdrew, due to busy schedule; 1 participant from both groups was excluded due to device malfunction; and 1 participant from the control group was excluded due to refusal to wear accelerometer. Intention‐to‐treat analysis was followed for data analysis. |
| Selective reporting (reporting bias) | Low risk | All outcomes mentioned in the method section were reported. Study protocol was not available. |
| Baseline comparability/ imbalance | High risk | Intervention group composed of significantly more “official and managerial level” individuals. Age of participants in the control group was 47.2 (SD 13.5) and in the intervention group was 44.2 (SD 12.5). There were 50% females in both groups. There was significant difference in BMI of participants between intervention and control groups. |
| Validity of outcome measure | Low risk | The accelerometer is a valid instrument for the measurement of sitting time. |
| Methods | Random allocation Unblinded Study duration: 8 weeks Dropout: 4% Location: UK Recruitment: consent was sought from 11 departmental managers for employee recruitment. All employees in consenting departments received an overview of the study and participant information sheet, and were invited to a study information session via an email from the research team. | |
| Participants | Population: office workers from one organisation (Liverpool John Moores University, Liverpool, UK). Employees within the approached departments were predominantly administrative staff. Intervention group: 26 participants Control group: 21 participants Demographics: Mean age: intervention 38.8 (SD 9.8) years, control 38.4 (SD 9.3) years 89% in intervention group and 67% in control group were females BMI (kg/m²): intervention 67.4 (SD 13.8), control 70.5 (SD 16.4) | |
| Interventions | Duration of intervention: 8 weeks Intervention: sit‐stand desk combined with face‐to‐face training and ergonomic information. Control: no intervention | |
| Outcomes | Outcome name, measurement time/tool (units of measurement)
| |
| Notes | Ergotron Ltd provided the sit‐stand desks but had no involvement on the provenance, commissioning, conduct or findings of the study. No other financial disclosures were reported by the authors of this paper. | |
| Risk of bias | ||
| Bias | Authors' judgement | Support for judgement |
| Random sequence generation (selection bias) | Low risk | Participants were randomised using a randomised block design and random number table. |
| Allocation concealment (selection bias) | High risk | One member of the research team assigned the participants to a treatment arm, based on a design and table with alternating scheme. |
| Blinding of participants and personnel (performance bias) | High risk | Researchers were aware of the allocation and participants may have also been aware of the allocation due to the nature of the intervention. |
| Blinding of outcome assessment (detection bias) | Unclear risk | Not reported |
| Incomplete outcome data (attrition bias) | Low risk | The authors conducted a per‐protocol analysis and excluded participants from analyses for outcomes to which they did not contribute data. For workplace sitting, standing and walking, the per‐protocol analysis was compared with an intention‐to‐treat analysis, as a sensitivity analysis. |
| Selective reporting (reporting bias) | Low risk | All outcomes mentioned in the method section were reported. |
| Baseline comparability/ imbalance | Low risk | Groups were comparable at baseline except for a higher proportion of women in the intervention group (89% versus 67% in the control group). |
| Validity of outcome measure | Low risk | Ecological Momentary Assessment diaries were used to report sitting time at work. |
| Methods | Non‐random allocation by clusters (floor): CBA Unblinded Study duration: 3 months Dropout: 14% Location: Melbourne, Australia Recruitment: an invitation email was sent to all potential participants to attend one of two 30‐minute study information sessions delivered by research staff. Participants who subsequently expressed interest were screened via telephone for eligibility. | |
| Participants | Population: from a single workplace (Comcare: the government agency responsible for workplace safety, rehabilitation and compensation for Australian government workplaces) in metropolitan Melbourne, Australia Intervention group: 19 participants Control group: 19 participants Demographics: mean age 42.4 (SD 10.6) years in the intervention group and 42.9 (SD 10.3) years in the control group Women were predominant in the intervention group and men were predominant in the control group. Mean BMI (kg/m²): intervention group 27.5 (SD 6.1); control group 26.2 (SD 4.6) | |
| Interventions | Duration of intervention: 4 weeks Intervention: the intervention communicated 3 key messages: “Stand Up, Sit Less, Move More” and had the following components:
Control: no intervention | |
| Outcomes | Outcome name, measurement time/tool (units of measurement)
| |
| Notes | This study was funded by an NHMRC project grant and the Victorian Health Promotion Foundation. Ergotron provided the height‐adjustable desks (www.ergotron.com). No financial disclosures were reported by the authors and the authors declared that there were no conflicts of interest. | |
| Risk of bias | ||
| Bias | Authors' judgement | Support for judgement |
| Random sequence generation (selection bias) | High risk | Randomisation was not done. |
| Allocation concealment (selection bias) | High risk | Allocation into groups was by floor, with intervention participants (primarily administrative staff) working on the floor above the control participants (predominantly senior administrative staff). |
| Blinding of participants and personnel (performance bias) | High risk | Research staff, participants, and assessors were not blinded to group allocation. |
| Blinding of outcome assessment (detection bias) | High risk | Assessors were not blinded to group allocation. |
| Incomplete outcome data (attrition bias) | Low risk | 4 participants, 2 each from the intervention and control groups withdrew and 2 further participants, 1 each from the intervention and control groups were lost during follow‐up. As the same proportion of participants were excluded from both groups, the missing data did not have much impact on outcomes. |
| Selective reporting (reporting bias) | Low risk | All outcomes mentioned in the methods section were reported. The study protocol was not available. |
| Baseline comparability/ imbalance | Low risk | There were more women in the intervention group than in the control group. The mean age of both groups was similar. All participants were recruited from a single workplace in metropolitan Melbourne, Australia. |
| Validity of outcome measure | Low risk | The accelerometer is a valid instrument for the measurement of sitting time. |
| Methods | Random allocation by clusters Single‐blind Study duration: 3 months Dropout: 12 months Location: Australia Recruitment: an information session about the study was presented for consenting teams within each site, with summary material also provided via e‐mail. Employees within these participating teams were then screened by telephone for eligibility. | |
| Participants | Population: staff from the department of human services (a large Australian Government organisation), desk‐based office workers Intervention group: 7 worksites, 164 participants Control group: 7 worksites, 144 participants Demographics: Mean age in years: intervention 44.6 (SD 9.1), control 47.0 (SD 9.7) % females: intervention 65.4%, control 72.6% BMI: intervention group 28.61 (SD 6.46) kg/m², control group 28.61 (SD 5.48) kg/m² | |
| Interventions | Duration: 3 months Intervention: multicomponent intervention composed of organisational (Consultation workshop, tailored email messages to promote organisational strategies by team champions) environmental (dual screen sit‐stand desk), and individual‐level strategies and targeted change at both the individual and the cluster levels (face to face coaching and telephone calls by study‐trained health coaches). Control: usual practice | |
| Outcomes | Outcome name, measurement time/tool (units of measurement)
| |
| Notes | ||
| Risk of bias | ||
| Bias | Authors' judgement | Support for judgement |
| Random sequence generation (selection bias) | Low risk | Randomisation was done by generating a randomisation plan for up to 24 clusters in one block |
| Allocation concealment (selection bias) | High risk | Participants and study staff were unblinded to group allocation. |
| Blinding of participants and personnel (performance bias) | Unclear risk | Randomisation was performed by a research staff member not involved in recruitment or data collection. However no information on blinding of participants. |
| Blinding of outcome assessment (detection bias) | Unclear risk | Not reported |
| Incomplete outcome data (attrition bias) | Low risk | The sensitivity of results were assessed by using multiple imputation by chained equations. |
| Selective reporting (reporting bias) | Low risk | All outcomes mentioned in the protocol section were reported. |
| Baseline comparability/ imbalance | Low risk | There were more females in the intervention group compared to control group. Both groups were comparable in terms of age and BMI. |
| Validity of outcome measure | Low risk | activPal accelerometer is a valid instrument for assessing physical activity and sedentary behaviour. |
| Methods | Non‐random allocation Study duration: 6 months Drop outs: 47% Location: United States Recruitment: participants were contacted by email with an invitation to participate in the study | |
| Participants | Population: call centre workers in a company (healthways) in USA. Healthways Inc., a well‐being improvement company with headquarters in Franklin, Tennessee, has multiple call centres in which their Health Coaches, Clinicians (Nurses and Dieticians), and Customer Service Representatives work. Intervention: sit‐stand desks (45 participants0, standing desks(46 participants) Control: seated (47 participants) Demographics: mean age in years: sit‐stand 34.8 (SD 11.5), standing 28.9 (6.8), seated 35 (SD 13.2) % female participants: sit‐stand 71%, standing 59%, seated 70% BMI: sit‐stand 29 (SD 9.13), standing 26.8 (SD 5.5), seated 27.8 (SD 5.7) | |
| Interventions | Duration of intervention: 6 months Sit‐stand desk vs. standing desk | |
| Outcomes | Outcome name, measurement time/tool (units of measurement)
| |
| Notes | Data for seated group not reported. | |
| Risk of bias | ||
| Bias | Authors' judgement | Support for judgement |
| Random sequence generation (selection bias) | High risk | Likely not random and it may be that people swapped desks because of open design of call centre. |
| Allocation concealment (selection bias) | High risk | Assignment to the workstation type was dependent on Healthways, and it made assignments as random as possible. |
| Blinding of participants and personnel (performance bias) | Unclear risk | Not reported |
| Blinding of outcome assessment (detection bias) | Unclear risk | Not reported |
| Incomplete outcome data (attrition bias) | High risk | High dropout (47% attrition) |
| Selective reporting (reporting bias) | Low risk | All outcomes mentioned in the methods section were reported. The study protocol was not available. |
| Baseline comparability/ imbalance | Low risk | Mean age of participants was higher for sit‐desk (control) group. Both groups were comparable at baseline for gender and BMI. |
| Validity of outcome measure | Unclear risk | The armband accelerometer (SenseWear model) is a valid instrument for assessing physical activity and sedentary behaviour |
| Methods | Random allocation Single‐blind Study duration: 5 weeks Dropout: 18% Location: Australia Recruitment: employees were invited to participate through internal email communication. | |
| Participants | Population: employees from the Health Promotion Unit (HPU) of a local health district in the Sydney metropolitan region. Control group: Group 1 (10 participants) Intervention group: Group 2 with 8 participants, Group 3 with 7 participants, Group 4 with 7 participants Demographics: BMI: intervention group 22.6 (SD 2.6) kg/m², control group 21.5 (SD 2.6) kg/m² | |
| Interventions | Duration: 4 weeks Control: Group 1 usual seated work Intervention: sit‐stand desk: Group 2 alternated between 40 minutes sitting and 20 minutes standing, Group 3 alternated between 30 minutes sitting and 30 minutes standing, Group 4 alternated between 20 minutes sitting and 40 minutes standing; in addition all intervention group received email reminders | |
| Outcomes | Outcome name, measurement time/tool (units of measurement)
| |
| Notes | Authors reported no conflict of interest. | |
| Risk of bias | ||
| Bias | Authors' judgement | Support for judgement |
| Random sequence generation (selection bias) | Low risk | Participants were assigned identification codes that were randomised using permuted blocks with block size 8 and 4. |
| Allocation concealment (selection bias) | Low risk | Group allocation sequence was generated by a study investigator who was not involved in data analysis. |
| Blinding of participants and personnel (performance bias) | High risk | Blinding participants or all members of the research team to group allocation was not possible due to the nature of the trial. |
| Blinding of outcome assessment (detection bias) | Low risk | The researcher conducting the data analysis was blinded to the group allocation of participants until analyses were completed. |
| Incomplete outcome data (attrition bias) | High risk | 7 participants in intervention and 1 in control group lost to follow‐up (25% attrition rate). |
| Selective reporting (reporting bias) | High risk | All outcomes mentioned in the study protocol were not reported. |
| Baseline comparability/ imbalance | Low risk | Intervention and control group were comparable for age, sex and BMI at baseline. |
| Validity of outcome measure | Low risk | activPal accelerometer is a valid instrument for assessing physical activity and sedentary behaviour |
| Methods | Random allocation Single‐blind Study duration: 3 months Dropout: 11% Location: Australia Recruitment: through posters and word‐of‐mouth | |
| Participants | Population: full‐time desk‐based employees in the Charlottetown area. Intervention group: 16 participants Control group: 12 participants Demographics: Mean age in years: intervention 43.2 (SD 9.7), control 48.9 (SD 11.4) BMI: intervention group 36.5 (SD 9) kg/m², control group 34.6 (SD 7) kg/m² | |
| Interventions | Duration: 3 months Intervention: sit‐stand desk Control: no sit‐stand desk | |
| Outcomes | Outcome name, measurement time/tool (units of measurement)
| |
| Notes | The project was supported by StepsCount, Inc | |
| Risk of bias | ||
| Bias | Authors' judgement | Support for judgement |
| Random sequence generation (selection bias) | Low risk | Participants were randomly assigned via coin flip to intervention and control group. |
| Allocation concealment (selection bias) | Unclear risk | Not reported |
| Blinding of participants and personnel (performance bias) | Unclear risk | Not reported |
| Blinding of outcome assessment (detection bias) | Unclear risk | Not reported |
| Incomplete outcome data (attrition bias) | High risk | Four participants were excluded from analysis (14% attrition). |
| Selective reporting (reporting bias) | Low risk | All outcomes mentioned in the study protocol were reported. |
| Baseline comparability/ imbalance | High risk | Participants in the control group were older (48.9 years, SD 11.4) than the intervention group (43.2 years, SD 9.7) and the intervention group had higher BMI (36.5 kg/m2, SD 9) than the control group (34.6 kg/m2 SD 7). |
| Validity of outcome measure | Low risk | activPal accelerometer is a valid instrument for assessing physical activity and sedentary behaviour |
| Methods | Random allocation Single‐blind Study duration: 9 weeks Dropout: 22% Location: United States Recruitment: university email lists and flyers distributed at local businesses. | |
| Participants | Population: university employees in office settings with set hours (8:00 a.m.‐5:00 p.m.) but not set break schedules Long break group: 25 participants Short break group: 24 participants Demographics: Mean age in years: long break: 38.92 (SD 7.88), short break: 38.50 (SD8.67) All participants were females and 60% of them were obese | |
| Interventions | Duration: 8 weeks Long break (LB) vs. short break (SB) | |
| Outcomes | Outcome name, measurement time/tool (units of measurement)
| |
| Notes | ||
| Risk of bias | ||
| Bias | Authors' judgement | Support for judgement |
| Random sequence generation (selection bias) | Low risk | Participants were randomised to the SB or LB group using a random digit generation Microsoft Excel. |
| Allocation concealment (selection bias) | Low risk | Participants were randomised to the SB or LB group, by an investigator not involved with testing. |
| Blinding of participants and personnel (performance bias) | High risk | Participants were not blinded to their treatment group assignment. |
| Blinding of outcome assessment (detection bias) | Unclear risk | Not reported |
| Incomplete outcome data (attrition bias) | High risk | Total 11 employees (22.4%) dropped out over 8 weeks. No ITT analysis |
| Selective reporting (reporting bias) | Low risk | All the outcomes mentioned in the protocol were reported. |
| Baseline comparability/ imbalance | High risk | Participants assigned to the LB group had higher total cholesterol (P = 0.02) and fewer minutes of sedentary time per workday (P = 0.05) at baseline than participants assigned to the SB group |
| Validity of outcome measure | Low risk | Actigraph GT3X accelerometer is a valid instrument for assessing physical activity and sedentary behaviour. |
| Methods | Allocation by clusters, 2 groups randomly and 2 group non‐randomly: CBA Unblinded Study duration: 3 months Dropout: 13.6% Location: University of Queensland, Brisbane, Australia Recruitment: a recruitment email explaining the study's purpose and procedures was sent to all staff from consenting units. Interested employees emailed the project manager and were interviewed via telephone to assess eligibility. | |
| Participants | Population: desk‐based office workers located on the same office floor, aged between 20–65 years from 3 different campuses Intervention group:
Control group: 13 participants Demographics: mean age in the multi component group was 37.3 (SD 10.7) years, 43 (SD 10.2) years in the workstation only group, and 48 (SD 11.6) years in the control group. There were no men in the multi component group, 3 in the workstation only group, and 4 in the control group. | |
| Interventions | Duration of intervention: 3 months Interventions:
Control: no intervention | |
| Outcomes | Outcome name, measurement time/tool (units of measurement) All outcomes were assessed at 3‐month follow‐up
| |
| Notes | Funding source: Australian Postgraduate Award Scholarship, UQ School of Population Health Top‐Up Scholarship and research student funding, Queensland Health Core Infrastructure Funding, and UQ Major Equipment and Infrastructure and NHMRC Equipment Grant. No other financial disclosures were reported by the authors. | |
| Risk of bias | ||
| Bias | Authors' judgement | Support for judgement |
| Random sequence generation (selection bias) | High risk | The 2 units that were located closer to the research centre were randomised to the intervention arms and the more distant unit was allocated to the control arm. No further information provided on the method used to generate the random sequence. |
| Allocation concealment (selection bias) | High risk | The faculty staff were allocated to the multi component group, department staff were allocated to the workstation only group and campus staff were allocated to the control group. |
| Blinding of participants and personnel (performance bias) | High risk | The participants and personnel knew the group to which they had been allocated. |
| Blinding of outcome assessment (detection bias) | Unclear risk | Not reported |
| Incomplete outcome data (attrition bias) | High risk | 25% of participants were lost in the sit‐stand desk plus counselling group, and one participant, i.e. 7% each, in of the other two groups. The high attrition of participants from the sit‐stand desk plus counselling group will have affected the outcome. |
| Selective reporting (reporting bias) | High risk | Not all the outcomes mentioned in the study protocol were reported. |
| Baseline comparability/ imbalance | Low risk | All the participants had desk‐based jobs at the University of Queensland in Brisbane, Australia. The mean age in the multi component group was 37.3 (SD 10.7) years, in the workstation only group it was 43 (SD 10.2) years, and 48 (SD 11.6) years in the control group. There were no men in the multi component group, 3 in the workstation only group, and 4 in the control group. |
| Validity of outcome measure | Low risk | The accelerometer is a valid instrument for the measurement of sitting time. |
| Methods | Random allocation Unblinded Study duration: 13 weeks No dropouts Location: Tasmania, Australia | |
| Participants | Population: chosen from 460 desk‐based Tasmania Police employees across several metropolitan sectors Intervention group: 17 participants Control group: 17 participants Demographics: mean age: intervention group 41.5 (SD 12.39) years, control group 43.88 (SD 9.65) years | |
| Interventions | Duration of intervention:13 weeks Intervention: computer prompts Control: no intervention | |
| Outcomes | Outcome name, measurement time/tool (units of measurement) Published: daily workplace energy expenditure (calories/workday) for different activities estimated from occupational physical activity questionnaire at 13 weeks vs. baseline Unpublished: self‐reported time spent sitting at work (minutes/day) at 13 weeks | |
| Notes | This research was launched through a research partnership between the Tasmania State Police Department and the University of Tasmania; funded by the Tasmanian government’s Healthy@Work grant scheme. The authors report no conflicts of interest. | |
| Risk of bias | ||
| Bias | Authors' judgement | Support for judgement |
| Random sequence generation (selection bias) | Low risk | Following correspondence with the authors, they replied: "We used a random numbers generation software through the web". |
| Allocation concealment (selection bias) | High risk | Following correspondence with the authors, they replied: "The researchers did randomisation, so we did not blind to the allocation". |
| Blinding of participants and personnel (performance bias) | High risk | Following correspondence with the authors, they replied: "Since it was field based, participants were not blind to the treatment groups". |
| Blinding of outcome assessment (detection bias) | Unclear risk | Not reported |
| Incomplete outcome data (attrition bias) | Low risk | There were no drop outs or exclusion of data. |
| Selective reporting (reporting bias) | Low risk | All outcomes mentioned in the methods section were reported. A study protocol was not available. |
| Baseline comparability/ imbalance | Low risk | All participants were employees of the Tasmania police department. Age was not significantly different between groups: 41.5 (12.4) years in the intervention group, and 43.88 (9.6) years in the control group. |
| Validity of outcome measure | Low risk | Occupational Sedentary and Physical Activity Questionnaire (OSPAQ) which had moderate validity was used for assessing time spent sitting at work. |
| Methods | Non‐random allocation: CBA Study duration: 6 months Dropout: 45% Location: United States Recruitment: email from human resource department of company | |
| Participants | Population: employees of a call centre company in the Eastern United States. Intervention group: sit‐to‐stand (45 participants) and standing (46 participants) Control group: seated (47 participants) Demographics: Mean age in years: sit‐stand group: 34.8 (SD 11.5), stand group: 28.9 (SD 6.8), seated group: 35.0 (SD 13.2) % of females: sit‐stand group 71.1%, stand group 58.7%, seated group 70.2% BMI: sit‐stand group 29.0 (SD 9.13) kg/m², stand group 26.8 (SD 5.5) kg/m², seated group 27.8 (SD 5.7) kg/m² | |
| Interventions | Duration: 3 months Sit‐to‐stand vs. standing vs. seated workstation | |
| Outcomes | Outcome name, measurement time (units of measurement)
| |
| Notes | Authors have not reported post intervention values for seated control group | |
| Risk of bias | ||
| Bias | Authors' judgement | Support for judgement |
| Random sequence generation (selection bias) | High risk | While not completely random, management did their best to randomise employees between the workstation conditions. The call centre layout and team make‐ups consisted of groups of four to eight workstations. Because of this, and the arrangement within the facility, management kept the type of workstation within each group constant. |
| Allocation concealment (selection bias) | High risk | Not reported but based on above quote, unlikely the allocation was concealed |
| Blinding of participants and personnel (performance bias) | Unclear risk | Not reported |
| Blinding of outcome assessment (detection bias) | Unclear risk | Not reported |
| Incomplete outcome data (attrition bias) | High risk | High dropout rate at three months (30%) and six months (45%) follow‐up times. No ITT analysis. |
| Selective reporting (reporting bias) | Low risk | All the outcomes mentioned in the methods section were reported |
| Baseline comparability/ imbalance | High risk | Age and sex is significantly different where persons using a standing workstation were 5 years younger and had more men. Also many more in this group were ‘health coaches’ and fewer were in customer services. |
| Validity of outcome measure | Low risk | The questionnaire used to assess activity outcomes in this study were based on the International Physical Activity Questionnaire (IPAQ), and the Modified Occupational Sitting and Physical Activity Questionnaire (OSPAQ) |
| Methods | Random allocation Study duration: 13 days Dropout: 32% Location: Canada Recruitment: email sent by human resource personnel on the researchers' behalf to potential participants. | |
| Participants | Population: office workers employed in the head office of one large private company in Canada High personal/high contextual norm (n = 35), high personal/low contextual norm (n = 36), low personal/high contextual norm (n = 35) and low personal/low contextual norm (n = 36) Demographics: Mean age in years: 40.30 (SD 12.02) 66% of participants were females | |
| Interventions | Duration: 10 days High personal/high contextual norm vs. high personal/ ow contextual norm vs. low personal/high contextual norm vs. low personal/low contextual norm | |
| Outcomes | Outcome name, measurement time (units of measurement)
| |
| Notes | This work was supported by a Vanier Canada Graduate Scholarship (first author) from the Social Sciences and Humanities Research Council of Canada. | |
| Risk of bias | ||
| Bias | Authors' judgement | Support for judgement |
| Random sequence generation (selection bias) | Low risk | Participants were manually randomly assigned using random number tables to one of four conditions. |
| Allocation concealment (selection bias) | Unclear risk | Not reported |
| Blinding of participants and personnel (performance bias) | Unclear risk | Not reported |
| Blinding of outcome assessment (detection bias) | Unclear risk | Not reported |
| Incomplete outcome data (attrition bias) | High risk | Very high dropout (32% attrition) |
| Selective reporting (reporting bias) | Low risk | No protocol. All the outcomes mentioned in the method section were reported. |
| Baseline comparability/ imbalance | Unclear risk | Not reported |
| Validity of outcome measure | Unclear risk | Not reported |
| Methods | Random allocation by cluster Single blind Study duration: 27 weeks Dropouts: 28% Location: Spain Recruitment: office workers were first invited to participate in an on‐line survey to identify those with low and moderate PA levels. Then they were invited to participate in the intervention by email or phone calls. | |
| Participants | Population: administrative and academic staff working at six campuses in four Spanish Universities in Galicia, the Basque Country and Catalonia Intervention group: 135 participants (3 clusters) Control group: 129 participants (3 clusters) | |
| Interventions | Duration of intervention: 8 weeks Intervention: automated web‐based intervention (W@WS) to encourage incidental walking and short walks during the workday. The walking strategies focused on breaking occupational sitting time by incidental walking into work tasks such as moving rather than sitting during lectures and seminars, not sitting to take phone calls, short walks (5–10 minutes) within University campuses, active transport (e.g. walking to work whenever possible) or active lunch breaks. Control: no intervention | |
| Outcomes | Outcome name, measurement time/tool (units of measurement) Self‐reported occupational sitting time (minutes/day) measured by paper dairy log Daily step counts measured by Pedometer, Yamax‐200 Physical risk factors (waist circumference, BMI, blood pressure) | |
| Notes | The study was funded by the Spanish Ministry of Science and Innovation (MICCIN) (project reference DEP 2009‐1147). The funders had no role in study design, data collection and analysis, decision to publish, or preparation of the manuscript. | |
| Risk of bias | ||
| Bias | Authors' judgement | Support for judgement |
| Random sequence generation (selection bias) | Unclear risk | Campuses were randomly assigned by worksite to an intervention (n = 3; deployed W@WS) or comparative group (n = 3; maintained normal behaviour). In each region, one university campus was randomly assigned to the program (intervention group; IG) and another campus acted as a comparison group (CG). Authors replied to our request for further information but their reasoning was unclear. |
| Allocation concealment (selection bias) | Unclear risk | Authors replied to our request for further information but their reasoning was unclear. |
| Blinding of participants and personnel (performance bias) | High risk | Following correspondence with authors, they replied: “In the "big universities": the comparison and the intervention campuses were located in different cities and therefore, participants from each campus were not aware that another campus was doing the intervention. In the "small universities": Each university was located in a different city (Barcelona and Vic). Thus, participants did not know there was another university doing the intervention.” However because of the self‐evident nature of the intervention awareness of their own exposure to a certain changed environment or intervention might have changed their behaviour. |
| Blinding of outcome assessment (detection bias) | Unclear risk | Not reported |
| Incomplete outcome data (attrition bias) | High risk | Number of withdrawals was unbalanced in two groups, with more in the intervention group. There were 33 (24%) in the intervention and 41 (32%) in the control group. |
| Selective reporting (reporting bias) | Low risk | All the outcomes mentioned in the protocol were reported. |
| Baseline comparability/ imbalance | Unclear risk | Not reported |
| Validity of outcome measure | Low risk | Paper‐based diary was used to report sitting time at work. |
| Methods | Random allocation Single‐blind Study duration: 14 weeks Dropouts: 14% Location: Australia Recruitment: participants were recruited via an email | |
| Participants | Population: employees of Lockheed Martin Mission System and Training business unit: primarily develops software solutions and training/simulation technologies for both civil and commercial markets. 2500 full‐time employees of whom 90% in sedentary computer work for a large percentage of their workday Intervention group: ergonomic training (16 participants), adjustable desks (23 participants), training and desks (20 participants) Control group: 13 participants Demographics: mean age in years: 37.2 (SD 9.4) BMI: 26.9 (SD 4.4) kg/m2 | |
| Interventions | Duration of intervention: 14 weeks Intervention: Training vs. adjustable desks vs. training and desks Control: no intervention | |
| Outcomes | Outcome name, measurement time/tool (units of measurement)
| |
| Notes | No conflict of interest reported | |
| Risk of bias | ||
| Bias | Authors' judgement | Support for judgement |
| Random sequence generation (selection bias) | Low risk | Participants were listed out in Excel and randomly placed into one of the four groups. |
| Allocation concealment (selection bias) | Unclear risk | Not reported |
| Blinding of participants and personnel (performance bias) | Unclear risk | Not reported |
| Blinding of outcome assessment (detection bias) | Unclear risk | Not reported |
| Incomplete outcome data (attrition bias) | Low risk | < 10% attrition rate |
| Selective reporting (reporting bias) | Low risk | No protocol; all the outcomes mentioned in the methods section are reported. |
| Baseline comparability/ imbalance | Unclear risk | Baseline characteristics of participants not reported |
| Validity of outcome measure | High risk | Only mentioned self report. No information on validity of questionnaires used. |
| Methods | Random allocation Single‐blind Study duration: 3 months Dropouts: 24% Location: USA Recruitment: in‐house distribution of print and electronic media. Potential participants received an email providing a link to an online survey that included a series of screening questions designed to assess participant eligibility. | |
| Participants | Population: pool of 728 overweight/obese and sedentary employees at a single office Intervention group: 15 participants Control group: 16 participants Demographics: mean age: intervention 40 (SD 9.5) years, control 40.3 (SD 10.9) years One male participant and 40 female participants BMI: intervention 36.1 (SD 8.7) kg/m², control 35.6 (SD 8.2) kg/m² | |
| Interventions | Duration of intervention: 3 months Intervention: treadmill desk plus counselling Control: no intervention | |
| Outcomes | Outcome name, measurement time/tool (units of measurement) Physical activity (minutes/hour) and sedentary behaviour (minutes/hour) measured by accelerometer‐inclinometer. Body mass, body fat percentage, and BMI | |
| Notes | This research was supported by Blue Cross and Blue Shield of Louisiana. | |
| Risk of bias | ||
| Bias | Authors' judgement | Support for judgement |
| Random sequence generation (selection bias) | Low risk | Following correspondence with authors, they replied: "Statisticians generated a random list". |
| Allocation concealment (selection bias) | Low risk | Following correspondence with authors, they replied: “The randomisation codes were sealed in envelopes with randomisation numbers”. |
| Blinding of participants and personnel (performance bias) | High risk | Following correspondence with authors, they replied: “Participants were not blinded. Intervention personnel and Project Manager were not blinded”. |
| Blinding of outcome assessment (detection bias) | Unclear risk | Not reported |
| Incomplete outcome data (attrition bias) | Low risk | Does not appear to have attrition bias |
| Selective reporting (reporting bias) | High risk | The trial registry mentions a follow‐up of 6 months but the study reports only 3 months' follow‐up. |
| Baseline comparability/ imbalance | Low risk | Age, sex and occupation were similar in both the intervention group and the control group at baseline. |
| Validity of outcome measure | Low risk | The accelerometer is a valid instrument for the measurement of sitting time. |
| Methods | Random allocation by cluster Unblinded Study duration: 6 days Dropouts: 23% Location: USA Recruitment: employees with clerical positions were identified through University directory. | |
| Participants | Population: full‐time employees (employed > 20 years) engaged in a sedentary occupation Intervention: stand group: 29 participants; step group: 31 participants Demographics: mean age: stand: 42.3 (SD 11.6) years, step: 46.1 (SD 10.5) years 60% were females in stand group and 75% were females in step group BMI: stand: 29.3 (SD 7.3) kg/m², step: 27.7 (SD 7.4) kg/m² | |
| Interventions | Duration of intervention: 3 days Intervention: computer‐based versus wrist worn prompts | |
| Outcomes | Outcome name, measurement time/tool (units of measurement) Total sitting time (minutes/workday), duration of longest sitting bout (minutes/workday), number of sitting bouts/workday of 30 min or more, standing time (minutes/workday), stepping time, sit/stand transitions measured by accelerometer‐inclinometers. | |
| Notes | The Clinical and Translational Science Institute of Southeastern Wisconsin supported this research. | |
| Risk of bias | ||
| Bias | Authors' judgement | Support for judgement |
| Random sequence generation (selection bias) | Low risk | Random number generation was used to assign participants to either the stand group or step group. |
| Allocation concealment (selection bias) | Low risk | Assignments were written out and placed in sealed numbered envelopes. |
| Blinding of participants and personnel (performance bias) | High risk | The envelopes were opened sequentially by a researcher; participants were informed of group assignment. |
| Blinding of outcome assessment (detection bias) | Unclear risk | Not reported |
| Incomplete outcome data (attrition bias) | High risk | 18 participants were excluded, 9 each from stand group and step group. Reasons were dropout, equipment malfunction and not wearing monitor properly. The authors did not conduct intention‐to‐treat analysis. |
| Selective reporting (reporting bias) | Low risk | All outcomes mentioned in the methods section were reported. The study protocol was not available. |
| Baseline comparability/ imbalance | Low risk | No baseline differences were found between the two groups for age, body mass, height or BMI. There was however difference in gender with the Stand group having 60% females and the Step group having 75%. |
| Validity of outcome measure | Low risk | The accelerometer is a valid instrument for the measurement of sitting time. |
| Methods | Random allocation Single‐blind Study duration: 5 weeks Dropouts: 29% Location: Australia Recruitment: participants were recruited via an email sent to all staff working in the study locations | |
| Participants | Population: participants were recruited from four locations across two organisations. The organisations were a non‐government organisation and a university. All locations were office‐based environments. Intervention group: 26 participants Control group: 26 participants Demographics: mean age in years: intervention 34.8 (SD 10.5), control 34.3 (SD 8.9) % female participants: intervention 89%, control 84% | |
| Interventions | Duration of intervention: 5 weeks Intervention: sit‐stand desk + instructions/ergonomic assessment Control: no intervention | |
| Outcomes | Outcome name, measurement time/tool (units of measurement)
| |
| Notes | This study was funded by Healthway (File No: Healthway Promotion Research Agreement 24008). The sit‐stand workstations were supplied by Ergotron (www.ergotron.com). Authors had no conflicts of interest to report | |
| Risk of bias | ||
| Bias | Authors' judgement | Support for judgement |
| Random sequence generation (selection bias) | Unclear risk | Not reported (only use the word randomised, no protocol to check) |
| Allocation concealment (selection bias) | Unclear risk | Not reported |
| Blinding of participants and personnel (performance bias) | High risk | Participants were probably aware of allocation because of self evident nature of intervention. |
| Blinding of outcome assessment (detection bias) | Unclear risk | Not reported |
| Incomplete outcome data (attrition bias) | Low risk | Similar proportions of participants were missing from final analysis in both groups. |
| Selective reporting (reporting bias) | Low risk | All outcomes mentioned in the method section were reported. Study protocol was not available. |
| Baseline comparability/ imbalance | Low risk | Participants in control and intervention groups were comparable in age, sex, BMI and education at baseline. |
| Validity of outcome measure | Low risk | activPAL is a valid instrument for assessment of physical activity and sedentary behaviour |
| Methods | Random allocation Single‐blind Study duration: 2 weeks Dropouts: 8% Location: United States Recruitment: not reported | |
| Participants | Population: staff at a United States university in desk jobs Intervention group: 26 participants Control group: 22 participants Demographics: mean age in years: 48 (SD 10) All participants were females Mean BMI: 30.5 (SD 8.2) kg/m2 | |
| Interventions | Duration of intervention: 1 week Intervention: audible alert and text message every hour and information on behavioural choices and health risks associated with prolonged sitting Control: no intervention | |
| Outcomes | Outcome name, measurement time/tool (units of measurement)
| |
| Notes | No conflict of interest reported | |
| Risk of bias | ||
| Bias | Authors' judgement | Support for judgement |
| Random sequence generation (selection bias) | Low risk | Random assignment included assigning participants by table of random numbers to 1 of 2 groups. |
| Allocation concealment (selection bias) | Unclear risk | Not reported |
| Blinding of participants and personnel (performance bias) | High risk | Group assignment was doubly blinded until the end of week 1, at which time both the participants and the investigator were aware of group assignment. However, Its not for the duration of intervention |
| Blinding of outcome assessment (detection bias) | Unclear risk | Not reported |
| Incomplete outcome data (attrition bias) | Low risk | Low attrition (8%) |
| Selective reporting (reporting bias) | Low risk | All outcomes mentioned in the method section were reported. Study protocol was not available. |
| Baseline comparability/ imbalance | Unclear risk | Participants characteristics at baseline not reported |
| Validity of outcome measure | Low risk | activPAL is a valid instrument for assessing physical activity and sedentary behaviour. |
| Methods | Random allocation Unblinded Study duration: 12 months Dropout: 11% Location: Amsterdam, the Netherlands | |
| Participants | Population: all employees from 2 Dutch research institutes were invited to participate, between April and November 2010 Intervention group: 129 participants Control group: 128 participants Demographics: mean age of the study population was 46 years 67% of participants were women About 60% of the study population had a healthy weight (BMI 18.5‐25). | |
| Interventions | Duration of intervention: 6 months but the participants were followed up for 12 months. Intervention: the Mindful VIP intervention consists of 8 weeks of in‐company mindfulness training with homework exercises, followed by 8 sessions of e–coaching. The homework exercises comprised a variety of formal (“body scan” meditation, sitting meditation) and informal exercises (small exercises, such as breathing exercises when starting up the computer, and grocery shopping mindfully). Additionally, free fruit and snack vegetables were provided during the 6 months. In addition, lunch walking routes, and a buddy‐system were offered as supportive tools. Control: received information on existing lifestyle behaviour‐related facilities that were already available at the worksite. | |
| Outcomes | Outcome name, measurement time/tool (units of measurement)
| |
| Notes | The authors report no conflicts of interest. | |
| Risk of bias | ||
| Bias | Authors' judgement | Support for judgement |
| Random sequence generation (selection bias) | Low risk | Participants were individually randomised to either the intervention or control group, using a computer‐generated randomisation sequence. |
| Allocation concealment (selection bias) | High risk | After randomisation, the research assistant notified each participant by email about the group to which he or she was allocated. |
| Blinding of participants and personnel (performance bias) | High risk | Blinding of the participants and the trainers was not possible. |
| Blinding of outcome assessment (detection bias) | Unclear risk | Not reported |
| Incomplete outcome data (attrition bias) | Low risk | 8 participants were lost to follow‐up from the intervention group and 17 from the control group. The authors conducted intention‐to‐treat analysis by linear mixed‐effect models. |
| Selective reporting (reporting bias) | Low risk | All outcomes mentioned in the study protocol were reported. |
| Baseline comparability/ imbalance | Low risk | Mean age was similar between the intervention group and control group. There were 63.6% women in the intervention group and 71% in the control group. All participants were from two Dutch research institutes. |
| Validity of outcome measure | High risk | Validity of the questionnaire used in the study has not been tested. |
| Methods | Allocation randomly by cluster Double‐blind Study duration: 6 months Dropout: 43% in occupational physicians (OPs) and 10% in employees Location: Amsterdam, the Netherlands Recruitment: OPs were recruited by the Netherlands Society of Occupational Medicine via a direct mailing to their members' registry (> 2100 OPs). OPs were asked to recruit 1 or more companies of medium or large size (> 100 workers). Next, OPs recruited employees via a health risk appraisal consisting of anthropometric measurements and subsequent health advice. | |
| Participants | Population: OPs from the Netherlands Society of Occupational Medicine and employees from medium or large sized companies in the Netherlands Intervention group: OPs (n = 7), employees (n = 274) Control group: OPs (n = 9), employees (n = 249) Demographics: mean age of employees in the intervention group was 46 (SD 8) years, mean age in the control group was 48 (SD 9) years. Percentages of men were 62% and 65% in the intervention and control groups respectively. 33% of employees in the intervention group and 27% of employees in the control group had a normal BMI. Type of worker Intervention group: blue collar (manual labour) 15%; white collar 70%; client contact 15% Control group: blue collar 17%; white collar 73%; client contact 10% | |
| Interventions | Duration of intervention: 6 months Intervention: guideline‐based counselling by OP providing advice to employers on how to assess and intervene on the obesogenic work environment. Conducted by OPs as 5 face‐to‐face behavioural change counselling sessions for employees to improve their lifestyle to prevent weight gain. Control: usual care by physician | |
| Outcomes | Outcome name, measurement time/tool (units of measurement)
| |
| Notes | This study was funded by the Netherlands Organisation for Health Research and Development. The authors report no conflicts of interest. | |
| Risk of bias | ||
| Bias | Authors' judgement | Support for judgement |
| Random sequence generation (selection bias) | Low risk | OPs who consented to participate were randomly assigned to the intervention or control group by an independent researcher using Random Allocation Software (V.1.0; Isfahan University of Medical Sciences) |
| Allocation concealment (selection bias) | High risk | After randomisation, the principal researcher notified OPs of the group to which they had been allocated. |
| Blinding of participants and personnel (performance bias) | Low risk | As OPs themselves were the intervention providers, they could not be blinded for allocation. OPs were asked not to reveal their group to participating employees or assistants performing measurements. |
| Blinding of outcome assessment (detection bias) | Unclear risk | Waist circumference, body weight and height were measured by unblinded OPs or by blinded clinic employees. However blinding for assessment of sitting was not reported |
| Incomplete outcome data (attrition bias) | High risk | 28 OPs were randomised, but 12 (43%) did not participate in the study at all. However, the remaining OPs recruited employees well, matching the number of planned employees. During the 6‐month intervention period, employees from both groups were lost to follow‐up (7 from the intervention group and 16 from the control group). These subjects (n = 53) were significantly younger, women, and had a lower income than study completers. |
| Selective reporting (reporting bias) | Low risk | All outcomes mentioned in the study protocol were reported. |
| Baseline comparability/ imbalance | Low risk | Age, sex and occupation were similar in both the intervention group and the control group at baseline. |
| Validity of outcome measure | High risk | Validity of the questionnaire used in the study has not been tested. |
Abbreviations
BMI: body‐mass index
CBA: controlled before‐and‐after study
h: hour(s)
OP: occupational physician
CP: computer prompts
RCT: randomised controlled trial
SD: standard deviation
Characteristics of excluded studies [ordered by study ID]
| Study | Reason for exclusion |
| Not conducted in a workplace setting. Did not report workplace sitting, only total sitting. | |
| Not all the participants were working. Did not report workplace sitting as a separate outcome. Total sitting time reported. | |
| Did not report workplace sitting as a separate outcome. Sitting time reported separately for working days and non‐working days but the working days included both work and leisure time. | |
| Not RCT or CBA. Did not report workplace sitting. | |
| Did not report workplace sitting | |
| Not conducted in a workplace setting. | |
| Did not report workplace sitting | |
| Did not report data on sitting time at work separately. Daily sitting time (during waking hours) was measured with an accelerometer but it included both work and leisure time. | |
| Not RCT or CBA. | |
| Not conducted in a workplace setting. | |
| Not RCT or CBA. | |
| Did not report workplace sitting | |
| This was a stair‐climbing training study that took place during working hours, but sitting time was not assessed. | |
| Not RCT or CBA. | |
| Did not report workplace sitting. | |
| Not RCT or CBA. | |
| No data reported for sitting time at work. Daily sedentary time (criterion: 0 steps/minute) was measured with StepWatch (accelerometer attached on ankle), but it included both work and leisure time (the monitor was kept during all wakeful hours for 7 consecutive days). Correspondence with the author was unclear regarding the distinction between work and leisure in sitting time. It is also not clear what the StepWatch measures as an accelerometer. | |
| Not RCT or CBA. Does not describe a full working day. | |
| Not RCT or CBA (pre‐post design). All the participants did not complete the program. | |
| Did not report workplace sitting. | |
| Did not report workplace sitting. Following correspondence with authors they replied: "We did not specifically measure sitting time but had an indication of the time spent in the office (these are desk bound participants‐ when they filled in the questionnaire of alertness by the hour (0900‐1700hrs)". | |
| Not RCT or CBA. | |
| Not RCT or CBA. Pedometers were used to record sitting time and step counts. | |
| Not RCT or CBA. | |
| Did not report workplace sitting. Sitting time was assessed (IPAQ) but it included both work and leisure time. | |
| Not RCT or CBA. Outcome is energy expenditure not time spent sitting at work. | |
| Not RCT or CBA. | |
| Did not report workplace sitting | |
| Not RCT or CBA. | |
| Not an RCT or CBA. Workplace sitting not reported. Sitting time was questioned separately for weekdays and weekend days but it included both work and leisure. | |
| Did not report workplace sitting | |
| Not conducted in a workplace setting. | |
| Not an RCT or CBA. Did not report workplace sitting. | |
| Not RCT or CBA. | |
| Not an RCT or CBA. | |
| Not an RCT or CBA. | |
| Not RCT or CBA. | |
| Not an RCT or CBA. | |
| Did not report workplace sitting | |
| Sitting time was not reported in hours (only %). The length of intervention was not the same for everybody (no detailed information, stated “4‐6 wks”). | |
| Not an RCT or CBA. No quantitative data on sitting time at work. | |
| Not RCT or CBA. | |
| Not an RCT or CBA. Did not report workplace sitting. Daily sitting time (waking hours) was measured with an accelerometer, but it included both work and leisure time. | |
| Did not report workplace sitting | |
| Did not report workplace sitting, only total sitting time. | |
| Did not report workplace sitting. | |
| Not conducted in a workplace setting. | |
| Not an RCT or CBA. | |
| Not an RCT or CBA. Did not report workplace sitting. | |
| Not RCT or CBA. | |
| Not RCT or CBA. Participants were university students. | |
| Did not report workplace sitting | |
| Did not report workplace sitting. | |
| Did not report workplace sitting. | |
| Did not report workplace sitting. Sitting time was assessed (IPAQ, short version) but it included both work and leisure time (reported as ‘weekday sitting time’). | |
| Not a normal working day, but an experimental office facility. Not an RCT or CBA. | |
| Did not report workplace sitting. | |
| Following correspondence with the authors, they replied: "Ours is not a work place intervention study, but a 'total sitting time' community‐based intervention study where the individual behavioural intervention addresses all domains of life, i.e. leisure time, work, transportation etc. Approximately 1/3 of participants are not working (retired or unemployed) and those who do work, do not necessarily have sedentary work, since our main inclusion criterion was minimum 3.5 hours of leisure time sitting/day. Consequently our primary outcome measure is objectively measured total daily sitting time (activPAL), and we only have rather crude self‐report measures on sitting time at work." | |
| Did not report workplace sitting | |
| Did not report workplace sitting. Sitting time was assessed (IPAQ) but it included both work and leisure time. | |
| Not conducted in a workplace setting. Participants were sedentary overweight females. | |
| Did not report workplace sitting. Reported sedentary time measured by accelerometer. Sedentary time was defined as an activity having less than 100 counts on an accelerometer. | |
| Did not report workplace sitting | |
| Did not report workplace sitting | |
| Not an RCT or CBA. | |
| Not RCT or CBA. | |
| Did not report workplace sitting | |
| Did not report workplace sitting. Daily sitting time (waking hours) was measured with an accelerometer, but it included both work and leisure time. | |
| Did not report workplace sitting. Sedentary time assessed during leisure. | |
| Not an RCT or CBA. | |
| Did not report workplace sitting | |
| Did not report workplace sitting. | |
| Did not report workplace sitting. The authors used accelerometers, but converted their results into energy expenditure/day (no separation between work and leisure time). | |
| Outcome is energy expenditure not time spent sitting at work. | |
| Did not report workplace sitting | |
| Not RCT or CBA. | |
| Did not report workplace sitting | |
| Not RCT or CBA. | |
| Not conducted in a workplace setting. | |
| Did not report workplace sitting. | |
| Not an RCT or CBA. |
Abbreviations
CBA: controlled before‐and‐after study
IPAQ: International physical activity questionnaire
RCT: randomised controlled trial
Characteristics of studies awaiting assessment [ordered by study ID]
| Methods | Randomised controlled trial |
| Participants | Sedentary office workers (n = 127; ages 22‐64; BMI = 28.5±6.1 kg/m²) were recruited from three Minnesota employers. |
| Interventions | The intervention consisted of 4 groups for 6 months: 1) Control, 2) Move (30 minutes of light activity during the workday), 3) Stand (standing 50% of the workday using a sit‐stand workstation), or 4) Stand + Move (combined Stand and Move). |
| Outcomes | Outcomes were assessed at baseline and at 6 months' follow‐up using the following cardiometabolic risk factors: blood pressure, fasting blood glucose, log of fasting triglycerides, and HDL‐cholesterol. |
| Notes | We could not find the full‐text article. |
| Methods | No information available |
| Participants | No information available |
| Interventions | No information available |
| Outcomes | No information available |
| Notes | We could not find the full‐text article. |
| Methods | Pre‐post design |
| Participants | Scottish working adults |
| Interventions | A 30‐minute individual discussion incorporating cognitive behavioural strategies (e.g. decisional balance, goal setting) to encourage individuals to think about their current sedentary behaviour and strategies to change. Duration of intervention: 2 weeks |
| Outcomes | Time spent sitting/lying, standing, stepping, step counts and sit‐to‐stand transitions. |
| Notes | We could not find the full‐text article. |
| Methods | Random allocation |
| Participants | Desk‐based employees |
| Interventions | Intervention: height‐adjustable workstation Control: no intervention |
| Outcomes | Change in workplace sedentary time assessed at 4 weeks after installation of height‐adjustable workstations, and 4 weeks after removal of height‐adjustable workstations Change in workplace absenteeism using the World Health Organization Health and Work Performance Questionnaire Change in workplace presenteeism using the World Health Organization Health and Work Performance Questionnaire |
| Notes | Principal Investigator: Simon H Till, Sheffield Hallam University |
Characteristics of ongoing studies [ordered by study ID]
| Trial name or title | |
| Methods | Random allocation in clusters Location: Australia Recruitment: not yet recruiting |
| Participants | Population: male and female employees of Rockhampton Regional Council working either full‐time or part‐time, aged 18‐65 years |
| Interventions | Participants will be asked to wear a pedometer during the 6‐week challenge and to record the number of steps they have taken each day on the Central Queensland University 10,000 Steps website. Control: no intervention |
| Outcomes | Primary outcome: total steps of physical activity measured using the Yamax Digiwalker DW‐150 pedometer Secondary outcomes
|
| Starting date | It is unclear whether the study has started at all. The study was promised to take place in 2013 and the study registration has not been updated. |
| Contact information | Mitch Duncan, email: [email protected] |
| Notes | Primary sponsor: Government funding body Central Queensland Hospital and Health Service |
| Trial name or title | |
| Methods | Random allocation Recruitment: not yet recruiting |
| Participants | Population: office‐based workers aged 18 years and over, working at least 0.6 full‐time equivalent |
| Interventions | The organisational plus technology support intervention lasts for 8 weeks and consists of the following components:
Control: will receive all the elements of the intervention except PLUS technology support. |
| Outcomes | Primary outcome
Secondary outcomes
|
| Starting date | It is unclear whether the study has started despite mentioning anticipated date of first participant enrolment 17/03/2014. The study registration has not been updated. |
| Contact information | Genevieve Healy, email: [email protected] |
| Notes | Primary sponsor: University Cancer Prevention Research Centre, The University of Queensland, Australia |
| Trial name or title | The Inphact treadmill study |
| Methods | Random allocation Location: Sweden Recruitment: recruitment and screening of participants has been completed. |
| Participants | Population description: healthy overweight and obese office workers (n = 80) with mainly sedentary tasks will be recruited from office workplaces in Umeå, Sweden. |
| Interventions | The intervention group will receive a health consultation and a treadmill desk, which they will use for at least one hour per day for 13 months. Control: the control group will receive the same health consultation, but continue to work at their regular workstations. |
| Outcomes | Primary outcome: Physical activity and sedentary time during workdays and non‐workdays as well as during working and non‐working hours on workdays will be measured objectively using accelerometers (Actigraph and activPAL) at baseline and after 2, 6, 10, and 13 months of follow‐up. Secondary outcome: Food intake will be recorded and metabolic and anthropometric variables, body composition, stress, pain, depression, anxiety, cognitive function, and functional magnetic resonance imaging will be measured at 3–5 time points during the study period. |
| Starting date | November 2013 |
| Contact information | Tommy Olsson, email: [email protected] |
| Notes | Sponsors: Not reported |
| Trial name or title | Stand & Move at Work |
| Methods | Random allocation by clusters Location: United States Recruitment: not yet recruiting |
| Participants | Population description: worksites will be enrolled in the greater Phoenix, AZ, USA and Minneapolis, MN, USA metropolitan regions. Selected worksites will be drawn from three distinct work sectors: higher education, industry/healthcare (e.g., law firms, health insurance providers), and government (e.g. state departments). |
| Interventions | Multicomponent interventions comprising of sit‐stand workstation, e‐newsletter, individualised coaching, prompts and engagement of worksite administrators and managers to enact policy‐level workplace modifications |
| Outcomes | Primary outcomes: time spent sitting and LPA at work, will be assessed with the activPAL3 accelerometer‐inclinometer Secondary outcomes: cardiometabolic risk, workplace productivity, work engagement, and workplace satisfaction |
| Starting date | |
| Contact information | Matthew P. Buman, email address: [email protected] |
| Notes | Study supported by the National Institutes of Health [R01CA198971]. |
| Trial name or title | Stand Up Victoria |
| Methods | Random allocation Location: Australia Recruitment: not yet recruiting |
| Participants | Population description: employees aged 18‐65 years, from 16 work sites located in Victoria, Australia |
| Interventions | The intervention consists of four distinct components:
Control: no intervention |
| Outcomes | Primary outcome
Secondary outcomes Examine the effect of the intervention on cardiometabolic markers of health and disease including:
Explore workplace and individual‐level mediators (how did the intervention work?) and moderators (for whom did it work?) of change using a specially formulated questionnaire. |
| Starting date | July 2011 |
| Contact information | David Dunstan, email: [email protected] |
| Notes | Sponsors: National Health and Medical Research Council and Vic Health |
| Trial name or title | TRial of Economic Incentives to Promote Physical Activity (TRIPPA) |
| Methods | Random allocation Location: Singapore Recruitment: on a rolling basis, and in two steps. In the first step, companies were engaged through existing contacts and “cold calls”. If companies responded positively, a study briefing was conducted to apprise the management of study details. Once we received confirmation of participation from the management team, we proceeded to step two of the recruitment process. Recruitment materials (e.g., electronic direct mails, posters, and newsletters) communicating the nature of the research study were disseminated to employees through internal channels unique to each company. The materials directed potential participants to the study website for additional information. Employees were also invited to attend a presentation conducted by the study team at each participating worksite. |
| Participants | Population description: employees from 13 companies spanning 15 worksites in Singapore |
| Interventions | 4 arms: “basic package” comprising two educational booklets, Fitbit arm, two incentive arms (cash or charity) |
| Outcomes | Primary outcome: MVPA bout minutes/week as measured via accelerometry Secondary outcomes:
|
| Starting date | |
| Contact information | Eric A. Finkelstein, e‐mail address: eric.finkelstein@duke‐nus.edu.sg |
| Notes | This study is supported by the Singapore Ministry of Health's Health Services Research Competitive Research Grant (HSRG/022/2012). |
| Trial name or title | |
| Methods | Random allocation Location: Finland Recruitment: recruitment is performed in the city of Jyväskylä, Finland, by delivering advertisements to parents via kindergartens and primary schools that have been pre‐randomised to control and intervention groups after balancing different environmental and socioeconomic regions within the city. |
| Participants | Population description: families from Jyväskylä region, Finland |
| Interventions | Tailored counselling targeted to decrease sitting time by focusing on commuting and work time. Control: no intervention |
| Outcomes | Changes in physical activity, health‐related indices and maintenance of the behavioural change |
| Starting date | December 2011 |
| Contact information | Taija Juutinen, email: [email protected] |
| Notes | Study sponsors: Ministry of Education and Culture, Finland |
| Trial name or title | Take A Stand for Workplace Health: A Sit‐stand Workstation Project Evaluation |
| Methods | Random allocation Recruitment: active, not recruiting |
| Participants | Population: office employees primarily engaged in desk‐based work at one of the two worksites involved in the study (Macmillan Cancer Support, Public Health England) |
| Interventions | Duration of intervention: 12 months Three‐arm trial Intervention: a sit‐stand workstation only and a multi‐component sit‐stand workstation intervention including individual and organisation‐level approaches Control: usual practice (seated workstation) |
| Outcomes |
|
| Starting date | May 2014 |
| Contact information | Jenifer Hall, email: [email protected] |
| Notes | Sponsors and collaborators: Brunel University, Macmillan Cancer Support, Ergotron, Public Health England |
| Trial name or title | Booster breaks: health promoting work breaks |
| Methods | Random allocation |
| Participants | Population: employees with sedentary office jobs from four workplaces in a large, urban southwestern U.S. city. |
| Interventions | Three‐arm trial Intervention: Computer Prompt (individualized PA work breaks) group and Booster Break group Control: usual break group |
| Outcomes | Primary outcomes: lipid profile, blood pressure, height, weight, International Physical Activity Questionnaire (IPAQ), pedometer readings Secondary outcomes: physical activity mediators and employee and organisational psychosocial constructs: self‐report assessments. |
| Starting date | January 2009 |
| Contact information | Wendell Taylor, email: [email protected] |
| Notes | Sponsor: National Institutes of Health (USA) |
| Trial name or title | |
| Methods | Random allocation Location: Australia |
| Participants | Population: employees of 1 of 3 of the university’s campuses located in Sydney and Melbourne, working on a part‐time or full‐time basis in either a job with an academic or administrative designation. |
| Interventions | Duration of intervention: 12 weeks The intervention will comprise 2 distinct treatment phases targeting behaviour adoption (weeks 1‐4) and adherence (weeks 5‐12) using 'stages of behaviour change' principles
Control: no intervention |
| Outcomes | Primary outcome: Average workday step count: measured by pedometer (Yamax SW‐200) and averaged over 5 workdays at each time point Secondary outcomes
|
| Starting date | March 2010 |
| Contact information | Martin Mackey, email: [email protected] |
| Notes | Study sponsors: Australian Research Council: ARC (Industry) Linkage Grant Professor Philip Taylor |
| Trial name or title | |
| Methods | Random allocation Location: United Kingdom Recruitment: will be recruited through: 1) employment databases and invited via letter/email, and 2) adverts in local newsletters and flyers posted within the buildings of target organisations. |
| Participants | Population description: office‐based employees from two companies in Cambridge, UK |
| Interventions | Intervention: sit‐stand desks Control: no intervention |
| Outcomes |
|
| Starting date | |
| Contact information | Correspondence: [email protected] |
| Notes | The study is supported by a grant from the Department of Health Policy Research Program (Policy Research Unit in Behaviour and Health [PR‐UN‐0409‐10109]), the Medical Research Council (Unit Programme number MC_UU_12015/3) and the British Heart Foundation (Intermediate Basic Science Research Fellowship grant FS/12/58/29709 to KW) |
| Trial name or title | SedestActiv Project |
| Methods | Random allocation Location: Spain Recruitment: a total of 232 subjects will be randomly allocated to an intervention and control group (116 individuals each group). In addition, 50 subjects with fibromyalgia will be included. |
| Participants | Population description: professionals from 13 primary health care centres will randomly invite mildly obese or overweight patients of both genders, aged 25‐65 years, to participate. |
| Interventions | 6‐month primary care intervention Control: no intervention |
| Outcomes | Duration of intervention: 6 months Primary outcome: to assess the effectiveness of a 6‐month primary care intervention to reduce diary hours of sitting time in overweight and obese patients, as well as to increase their weekly energy expenditure Secondary outcomes
|
| Starting date | June 2012 |
| Contact information | Carme Martín‐Borràs Email: [email protected] |
| Notes | Study sponsor: Jordi Gol i Gurina Foundation |
| Trial name or title | |
| Methods | Random allocation Recruitment: active, not recruiting |
| Participants | Population: sedentary office employees |
| Interventions | Height‐adjustable desk installation in office |
| Outcomes | Primary outcome: workplace sitting time Secondary outcomes
|
| Starting date | January 2013 |
| Contact information | |
| Notes | Study sponsor: USDA (United States Department of Agriculture) Grand Forks Human Nutrition Research Center |
| Trial name or title | |
| Methods | Random allocation Recruitment: active, not recruiting |
| Participants | Population: sedentary employees who use a single computer workstation for the majority of their workday |
| Interventions | Sit‐stand workstation with three arms
|
| Outcomes |
|
| Starting date | November 2013 |
| Contact information | |
| Notes | Study sponsor: University of Minnesota ‐ Clinical and Translational Science Institute |
| Trial name or title | Modifying the workplace to decrease sedentary behaviour and improve health |
| Methods | Random allocation |
| Participants | Healthy volunteers employed in a full‐time sedentary job |
| Interventions | Duration of intervention: 12 months Three‐arm trial Intervention: treadmill workstation and sit‐stand workstation Control: participants will be asked to engage in three 10 min walking bouts each workday |
| Outcomes | Change in weight |
| Starting date | April 2014 |
| Contact information | Anne Thorndike, email: [email protected] |
| Notes | Study sponsor: Northeastern University |
| Trial name or title | |
| Methods | Random allocation |
| Participants | Employees from 10 organisations involved with the Healthy Working Lives initiative |
| Interventions | Duration of intervention: 12 weeks Intervention: hourly prompts to stand for a period of 10 weeks plus education on why and how to reduce prolonged sitting Control: education on why and how to reduce prolonged sitting |
| Outcomes | Total time spent sitting at work, accessed by 7 day ActivPal and diary measurement Time spent sitting in prolonged sedentary bouts at work Number of sitting events at work Number of prolonged sitting events at work |
| Starting date | 1 February 2015 |
| Contact information | |
| Notes | Pricinpal Investigator: Philippa Dall, PhD |
| Trial name or title | |
| Methods | Random allocation |
| Participants | Desk‐based office employees |
| Interventions | Duration: 12 weeks Intervention: an education session on the health benefits of breaking prolonged sitting and feedback on baseline sitting behaviour followed by hourly prompts to stand delivered by Microsoft Outlook for a period of 10 weeks. The messages will be short in length, varied and centre around the key message of breaking prolonged sitting by standing. Control: same education session as the prompt group, as well as feedback on their baseline sitting behaviour. |
| Outcomes | Total time spent sitting at work will be objectively measured using a tri‐axial accelerometer Total time spent sitting at work in continuous bouts of at least 30 minutes Number of sitting events at work Number of prolonged sitting events at work Time after prompt to stand |
| Starting date | March 2016 |
| Contact information | Philippa Dall, PhD |
| Notes |
| Trial name or title | |
| Methods | Random allocation |
| Participants | Desk‐based employees |
| Interventions | Treadmill workstation versus sit‐stand workstation |
| Outcomes |
|
| Starting date | August 2017 |
| Contact information | Mark Pereira, [email protected] |
| Notes |
| Trial name or title | SMArT Work: Stand More AT Work |
| Methods | Random allocation in clusters Location: UK Recruitment: participant recruitment will be coordinated via the research team at the Leicester Diabetes Centre. The study team currently hold a database of office units within the University Hospitals of Leicester NHS Trust and will promote this study to them initially through the use of the Trust’s intranet and emails to department managers. This will be followed up with a face‐to‐face presentation/meeting if necessary. |
| Participants | Desk‐based office workers (n = 238) from a stratified sample of NHS staff (e.g. employees, managers, gender, job role) |
| Interventions | Height‐adjustable workstations at the environmental, organisational and individual level that support less occupational sitting. |
| Outcomes |
|
| Starting date | October 2014 |
| Contact information | Dr Ben Jackson, email: [email protected] |
| Notes |
| Trial name or title | The Healthier Office Study |
| Methods | Quasi‐random allocation Location: Australia Recruitment: "Posters will be placed in staff tearooms and common areas, inviting staff to participate. The advertisements will contain general information informing participants that we are testing simple occupational health interventions and that participants will be provided with an ergonomic device or advice about improving healthy work practices. The study will also be advertised at Faculty staff meetings to improve potential participants’ awareness of the study" |
| Participants | Population description: participants will be recruited from academic and administrative staff of The University of Sydney, Sydney, Australia |
| Interventions | Intervention: 3 groups (1 control group and 2 intervention groups) will be conducted in an office workplace setting. The education intervention group will receive an education package that encourages reduction in sitting behaviours. The sit‐stand desk intervention group will receive the same education package along with an adjustable sit‐stand desk. The control group will receive no information or advice about postural change and no modification to their office desk set‐up. |
| Outcomes | Average daily sedentary time during work hours, measured by an accelerometer |
| Starting date | March 2013 |
| Contact information | |
| Notes | Study sponsors: this research is supported by funding from the Heart Foundation, Sydney, NSW, Australia, and by Australian National Health and Medical Research Council Program Grant (number: 569940; AB). Sit‐stand workstations were donated by Sit Back and Relax, Alexandria, NSW, Australia. |
| Trial name or title | |
| Methods | Random allocation Location: Belgium Recruitment: all participants were recruited from working places in Flanders (Belgium) through flyers, emails, pharmacists, and word of mouth |
| Participants | Population: employees (male and female) aged 19‐67 years who mentioned not being physically active during the last year |
| Interventions | Interventions: Participants were randomised into one of the following four intervention groups.
|
| Outcomes | Primary outcome: physical activity level Secondary outcomes
|
| Starting date | |
| Contact information | |
| Notes | No conflict of interest |
Abbreviation
BMI: body mass index
Data and analyses
| Outcome or subgroup title | No. of studies | No. of participants | Statistical method | Effect size |
| 1 Mean difference in time spent sitting at work follow‐up short‐term Show forest plot | 10 | 323 | Mean Difference (Random, 95% CI) | ‐100.16 [‐115.83, ‐84.48] |
| Analysis 1.1 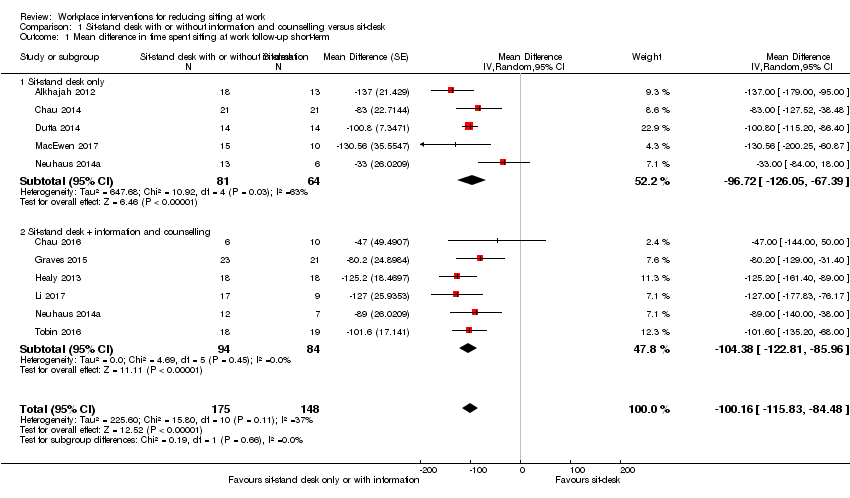 Comparison 1 Sit‐stand desk with or without information and counselling versus sit‐desk, Outcome 1 Mean difference in time spent sitting at work follow‐up short‐term. | ||||
| 1.1 Sit‐stand desk only | 5 | 145 | Mean Difference (Random, 95% CI) | ‐96.72 [‐126.05, ‐67.39] |
| 1.2 Sit‐stand desk + information and counselling | 6 | 178 | Mean Difference (Random, 95% CI) | ‐104.38 [‐122.81, ‐85.96] |
| 2 Mean difference in time spent sitting at work, follow‐up short‐term ‐ sensitivity analysis Show forest plot | 10 | 323 | Mean Difference (Random, 95% CI) | ‐100.16 [‐115.83, ‐84.48] |
| Analysis 1.2 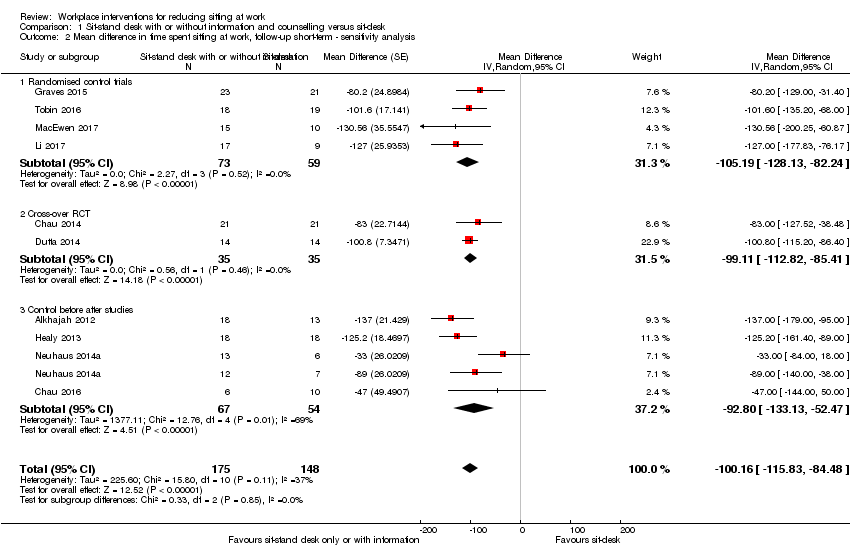 Comparison 1 Sit‐stand desk with or without information and counselling versus sit‐desk, Outcome 2 Mean difference in time spent sitting at work, follow‐up short‐term ‐ sensitivity analysis. | ||||
| 2.1 Randomised control trials | 4 | 132 | Mean Difference (Random, 95% CI) | ‐105.19 [‐128.13, ‐82.24] |
| 2.2 Cross‐over RCT | 2 | 70 | Mean Difference (Random, 95% CI) | ‐99.11 [‐112.82, ‐85.41] |
| 2.3 Control before after studies | 4 | 121 | Mean Difference (Random, 95% CI) | ‐92.80 [‐133.13, ‐52.47] |
| 3 Mean difference in time spent sitting at work. follow‐up medium‐term (CBA) Show forest plot | 2 | 60 | Mean Difference (Fixed, 95% CI) | ‐57.08 [‐98.76, ‐15.41] |
| Analysis 1.3  Comparison 1 Sit‐stand desk with or without information and counselling versus sit‐desk, Outcome 3 Mean difference in time spent sitting at work. follow‐up medium‐term (CBA). | ||||
| 4 Mean difference in time in sitting bouts lasting 30 minutes or more, follow‐up short‐term (CBA) Show forest plot | 2 | 74 | Mean Difference (Fixed, 95% CI) | ‐52.57 [‐78.79, ‐26.35] |
| Analysis 1.4 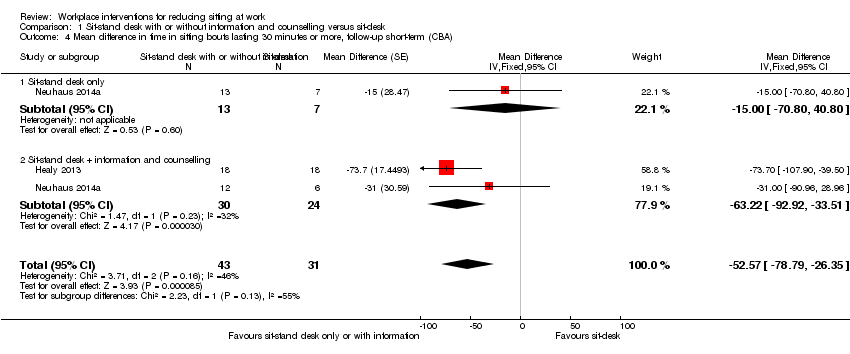 Comparison 1 Sit‐stand desk with or without information and counselling versus sit‐desk, Outcome 4 Mean difference in time in sitting bouts lasting 30 minutes or more, follow‐up short‐term (CBA). | ||||
| 4.1 Sit‐stand desk only | 1 | 20 | Mean Difference (Fixed, 95% CI) | ‐13.00 [‐70.80, 40.80] |
| 4.2 Sit‐stand desk + information and counselling | 2 | 54 | Mean Difference (Fixed, 95% CI) | ‐63.22 [‐92.92, ‐33.51] |
| 5 Mean difference in total time spent sitting (including sitting at and outside work), follow‐up short‐term Show forest plot | 2 | 56 | Mean Difference (Fixed, 95% CI) | ‐81.67 [‐123.99, ‐39.36] |
| Analysis 1.5  Comparison 1 Sit‐stand desk with or without information and counselling versus sit‐desk, Outcome 5 Mean difference in total time spent sitting (including sitting at and outside work), follow‐up short‐term. | ||||
| 6 Mean difference in time spent standing at work, follow‐up short‐term Show forest plot | 9 | 295 | Mean Difference (Fixed, 95% CI) | 89.38 [76.44, 102.32] |
| Analysis 1.6  Comparison 1 Sit‐stand desk with or without information and counselling versus sit‐desk, Outcome 6 Mean difference in time spent standing at work, follow‐up short‐term. | ||||
| 6.1 Sit‐stand desk only | 4 | 117 | Mean Difference (Fixed, 95% CI) | 75.78 [57.56, 94.01] |
| 6.2 Sit‐stand desk + information and counselling | 6 | 178 | Mean Difference (Fixed, 95% CI) | 103.20 [84.83, 121.58] |
| 7 Mean difference in time spent standing at work, follow‐up short‐term (RCT only) Show forest plot | 4 | 132 | Mean Difference (Fixed, 95% CI) | 98.65 [74.94, 122.36] |
| Analysis 1.7  Comparison 1 Sit‐stand desk with or without information and counselling versus sit‐desk, Outcome 7 Mean difference in time spent standing at work, follow‐up short‐term (RCT only). | ||||
| 8 Mean difference in time spent stepping at work follow‐up short‐term Show forest plot | 8 | 270 | Mean Difference (Random, 95% CI) | ‐0.52 [‐3.88, 2.85] |
| Analysis 1.8  Comparison 1 Sit‐stand desk with or without information and counselling versus sit‐desk, Outcome 8 Mean difference in time spent stepping at work follow‐up short‐term. | ||||
| 9 Mean difference in time spent standng at work, follow‐up medium‐term (CBA) Show forest plot | 2 | 60 | Mean Difference (IV, Fixed, 95% CI) | 53.36 [16.59, 90.14] |
| Analysis 1.9  Comparison 1 Sit‐stand desk with or without information and counselling versus sit‐desk, Outcome 9 Mean difference in time spent standng at work, follow‐up medium‐term (CBA). | ||||
| 10 Work performance (1‐10 scale), follow‐up short‐term (CBA) Show forest plot | 3 | 109 | Mean Difference (Fixed, 95% CI) | 0.35 [‐0.10, 0.79] |
| Analysis 1.10  Comparison 1 Sit‐stand desk with or without information and counselling versus sit‐desk, Outcome 10 Work performance (1‐10 scale), follow‐up short‐term (CBA). | ||||
| 10.1 Sit‐stand desk only | 2 | 52 | Mean Difference (Fixed, 95% CI) | 0.82 [0.00, 1.63] |
| 10.2 Sit‐stand desk + information and counselling | 2 | 57 | Mean Difference (Fixed, 95% CI) | 0.15 [‐0.38, 0.68] |
| 11 Proportion with ≥ 1 sick days in the last three months (CBA) Show forest plot | 1 | Risk Ratio (M‐H, Fixed, 95% CI) | Totals not selected | |
| Analysis 1.11  Comparison 1 Sit‐stand desk with or without information and counselling versus sit‐desk, Outcome 11 Proportion with ≥ 1 sick days in the last three months (CBA). | ||||
| 12 Proportion with ≥ 1 sick days in the last month (CBA) Show forest plot | 2 | 78 | Risk Ratio (M‐H, Fixed, 95% CI) | 0.77 [0.49, 1.21] |
| Analysis 1.12  Comparison 1 Sit‐stand desk with or without information and counselling versus sit‐desk, Outcome 12 Proportion with ≥ 1 sick days in the last month (CBA). | ||||
| 12.1 Sit‐stand desk only | 1 | 20 | Risk Ratio (M‐H, Fixed, 95% CI) | 0.94 [0.42, 2.13] |
| 12.2 Sit‐stand desk + information and counselling | 2 | 58 | Risk Ratio (M‐H, Fixed, 95% CI) | 0.72 [0.41, 1.24] |
| 13 Mean difference in musculoskeletal symptoms, follow‐up short‐term Show forest plot | 1 | 46 | Mean Difference (Fixed, 95% CI) | ‐0.51 [‐1.03, ‐0.00] |
| Analysis 1.13  Comparison 1 Sit‐stand desk with or without information and counselling versus sit‐desk, Outcome 13 Mean difference in musculoskeletal symptoms, follow‐up short‐term. | ||||
| 14 Mean difference in musculoskeletal symptoms, follow‐up Medium‐term Show forest plot | 1 | 45 | Mean Difference (Fixed, 95% CI) | ‐0.54 [‐0.89, ‐0.19] |
| Analysis 1.14 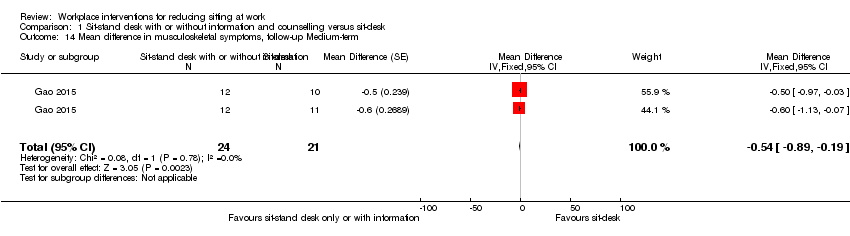 Comparison 1 Sit‐stand desk with or without information and counselling versus sit‐desk, Outcome 14 Mean difference in musculoskeletal symptoms, follow‐up Medium‐term. | ||||
| Outcome or subgroup title | No. of studies | No. of participants | Statistical method | Effect size |
| 1 Mean difference in time spent sitting at work, follow‐up short‐term Show forest plot | 1 | Mean Difference (IV, Fixed, 95% CI) | Totals not selected | |
| Analysis 2.1 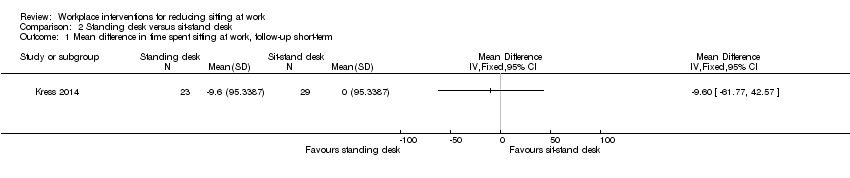 Comparison 2 Standing desk versus sit‐stand desk, Outcome 1 Mean difference in time spent sitting at work, follow‐up short‐term. | ||||
| 2 Mean difference in time spent sitting at work, follow‐up medium‐term Show forest plot | 1 | Mean Difference (IV, Fixed, 95% CI) | Totals not selected | |
| Analysis 2.2 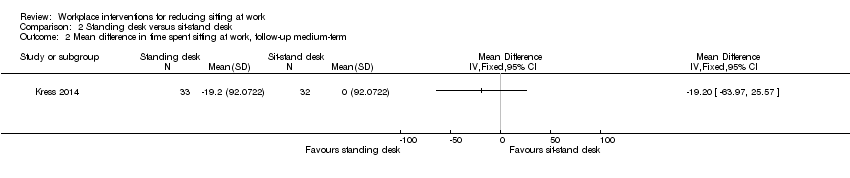 Comparison 2 Standing desk versus sit‐stand desk, Outcome 2 Mean difference in time spent sitting at work, follow‐up medium‐term. | ||||
| Outcome or subgroup title | No. of studies | No. of participants | Statistical method | Effect size |
| 1 Mean difference in time spent sitting at work, follow‐up short‐term Show forest plot | 1 | Mean Difference (IV, Fixed, 95% CI) | Totals not selected | |
| Analysis 3.1 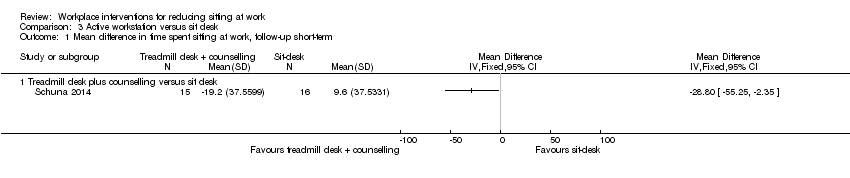 Comparison 3 Active workstation versus sit desk, Outcome 1 Mean difference in time spent sitting at work, follow‐up short‐term. | ||||
| 1.1 Treadmill desk plus counselling versus sit desk | 1 | Mean Difference (IV, Fixed, 95% CI) | 0.0 [0.0, 0.0] | |
| 2 Mean difference in time spent in inactive sitting at work, follow‐up medium term Show forest plot | 1 | Mean Difference (IV, Fixed, 95% CI) | Totals not selected | |
| Analysis 3.2  Comparison 3 Active workstation versus sit desk, Outcome 2 Mean difference in time spent in inactive sitting at work, follow‐up medium term. | ||||
| 2.1 Cycling desk + information and counselling versus information and counselling only | 1 | Mean Difference (IV, Fixed, 95% CI) | 0.0 [0.0, 0.0] | |
| Outcome or subgroup title | No. of studies | No. of participants | Statistical method | Effect size |
| 1 Mean difference in time spent sitting at work, follow‐up short term Show forest plot | 1 | 179 | Mean Difference (Fixed, 95% CI) | ‐15.49 [‐49.65, 18.67] |
| Analysis 4.1  Comparison 4 Walking strategies versus no intervention, Outcome 1 Mean difference in time spent sitting at work, follow‐up short term. | ||||
| 1.1 Route versus no intervention | 1 | 90 | Mean Difference (Fixed, 95% CI) | ‐16.0 [‐64.98, 32.98] |
| 1.2 Incidental versus no intervention | 1 | 89 | Mean Difference (Fixed, 95% CI) | ‐15.0 [‐62.66, 32.66] |
| 2 Mean difference in time spent sitting at work, follow‐up medium‐term Show forest plot | 1 | 264 | Mean Difference (IV, Fixed, 95% CI) | ‐16.50 [‐60.55, 27.55] |
| Analysis 4.2 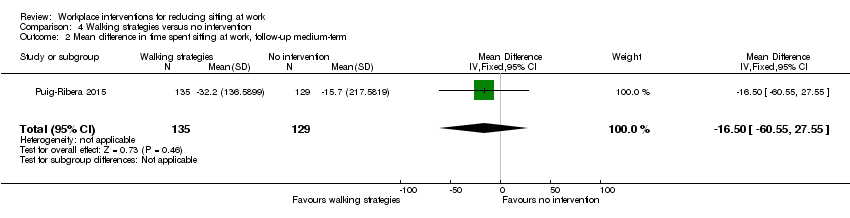 Comparison 4 Walking strategies versus no intervention, Outcome 2 Mean difference in time spent sitting at work, follow‐up medium‐term. | ||||
| 3 Percentage of lost work productivity (WLQ Index Score) follow‐up medium‐term Show forest plot | 1 | Mean Difference (Fixed, 95% CI) | Totals not selected | |
| Analysis 4.3 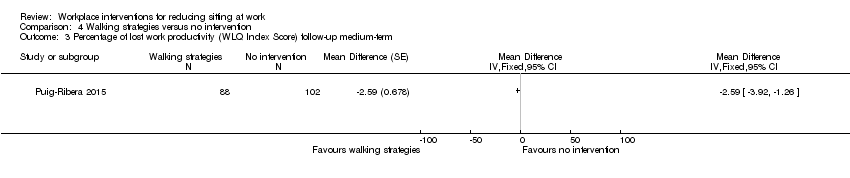 Comparison 4 Walking strategies versus no intervention, Outcome 3 Percentage of lost work productivity (WLQ Index Score) follow‐up medium‐term. | ||||
| Outcome or subgroup title | No. of studies | No. of participants | Statistical method | Effect size |
| 1 Mean difference in time spent sitting at work, follow‐up short‐term Show forest plot | 1 | Mean Difference (IV, Fixed, 95% CI) | Totals not selected | |
| Analysis 5.1  Comparison 5 Short break versus long break, Outcome 1 Mean difference in time spent sitting at work, follow‐up short‐term. | ||||
| Outcome or subgroup title | No. of studies | No. of participants | Statistical method | Effect size |
| 1 Mean difference in time spent sitting at work, follow‐up short term Show forest plot | 2 | 63 | Mean Difference (IV, Fixed, 95% CI) | ‐19.23 [‐57.05, 18.58] |
| Analysis 6.1 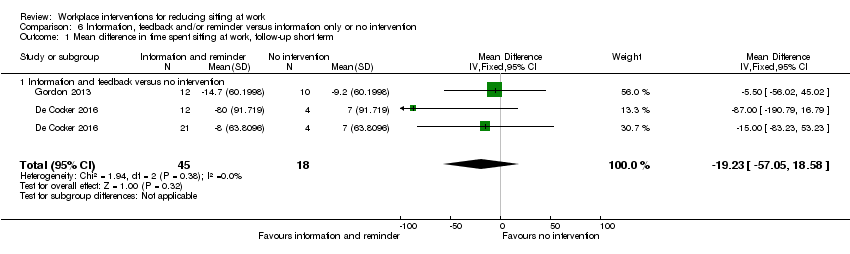 Comparison 6 Information, feedback and/or reminder versus information only or no intervention, Outcome 1 Mean difference in time spent sitting at work, follow‐up short term. | ||||
| 1.1 Information and feedback versus no intervention | 2 | 63 | Mean Difference (IV, Fixed, 95% CI) | ‐19.23 [‐57.05, 18.58] |
| 2 Mean difference in time spent sitting at work, follow‐up medium‐term Show forest plot | 2 | 747 | Mean Difference (Fixed, 95% CI) | ‐28.38 [‐51.49, ‐5.26] |
| Analysis 6.2  Comparison 6 Information, feedback and/or reminder versus information only or no intervention, Outcome 2 Mean difference in time spent sitting at work, follow‐up medium‐term. | ||||
| 2.1 Counselling versus no intervention | 2 | 747 | Mean Difference (Fixed, 95% CI) | ‐28.38 [‐51.49, ‐5.26] |
| 3 Mean difference in total time spent sitting (including sitting at and outside work), follow‐up short‐term Show forest plot | 1 | Mean Difference (Fixed, 95% CI) | Subtotals only | |
| Analysis 6.3  Comparison 6 Information, feedback and/or reminder versus information only or no intervention, Outcome 3 Mean difference in total time spent sitting (including sitting at and outside work), follow‐up short‐term. | ||||
| 3.1 Information and feedback versus no intervention | 1 | 37 | Mean Difference (Fixed, 95% CI) | ‐16.40 [‐96.85, 64.06] |
| 4 Mean difference in total time spent sitting (including sitting at and outside work), follow‐up medium term Show forest plot | 1 | Mean Difference (Fixed, 95% CI) | Subtotals only | |
| Analysis 6.4 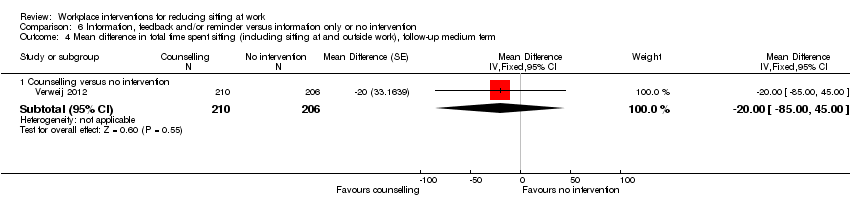 Comparison 6 Information, feedback and/or reminder versus information only or no intervention, Outcome 4 Mean difference in total time spent sitting (including sitting at and outside work), follow‐up medium term. | ||||
| 4.1 Counselling versus no intervention | 1 | 416 | Mean Difference (Fixed, 95% CI) | ‐20.0 [‐85.00, 45.00] |
| 5 Mean difference in time spent standing at work follow‐up short‐term Show forest plot | 1 | Mean Difference (Fixed, 95% CI) | Subtotals only | |
| Analysis 6.5 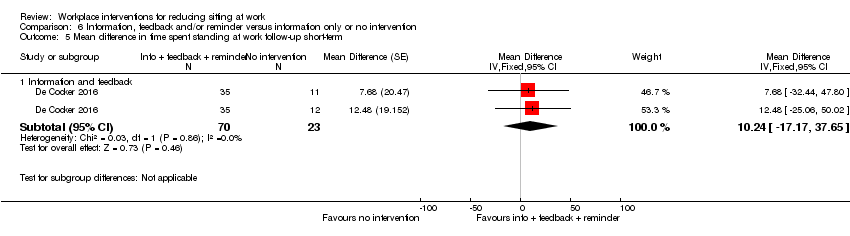 Comparison 6 Information, feedback and/or reminder versus information only or no intervention, Outcome 5 Mean difference in time spent standing at work follow‐up short‐term. | ||||
| 5.1 Information and feedback | 1 | 93 | Mean Difference (Fixed, 95% CI) | 10.24 [‐17.17, 37.65] |
| 6 Work engagement (0‐6 scale), follow‐up medium‐term Show forest plot | 1 | Mean Difference (Fixed, 95% CI) | Subtotals only | |
| Analysis 6.6  Comparison 6 Information, feedback and/or reminder versus information only or no intervention, Outcome 6 Work engagement (0‐6 scale), follow‐up medium‐term. | ||||
| 6.1 Counseling versus no intervention | 1 | 224 | Mean Difference (Fixed, 95% CI) | 0.1 [‐0.10, 0.30] |
| Outcome or subgroup title | No. of studies | No. of participants | Statistical method | Effect size |
| 1 Mean difference in time spent sitting at work, follow‐up short term Show forest plot | 2 | 75 | Mean Difference (IV, Fixed, 95% CI) | ‐10.48 [‐44.88, 23.92] |
| Analysis 7.1  Comparison 7 Prompts plus information versus information alone, Outcome 1 Mean difference in time spent sitting at work, follow‐up short term. | ||||
| 2 Mean difference in time spent sitting at work, follow‐up medium‐term Show forest plot | 1 | 34 | Mean Difference (Fixed, 95% CI) | ‐54.92 [‐95.82, ‐14.02] |
| Analysis 7.2 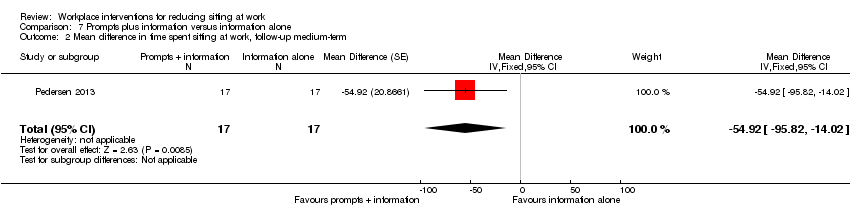 Comparison 7 Prompts plus information versus information alone, Outcome 2 Mean difference in time spent sitting at work, follow‐up medium‐term. | ||||
| 3 Mean difference in number of sitting bouts lasting 30 minutes or more, follow‐up short‐term Show forest plot | 1 | Mean Difference (Fixed, 95% CI) | Totals not selected | |
| Analysis 7.3 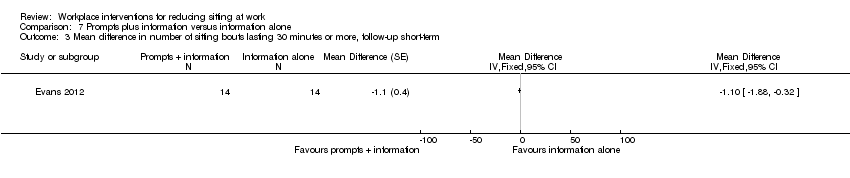 Comparison 7 Prompts plus information versus information alone, Outcome 3 Mean difference in number of sitting bouts lasting 30 minutes or more, follow‐up short‐term. | ||||
| 4 Mean difference in time in sitting bouts lasting 30 minutes or more, follow‐up short‐term Show forest plot | 1 | 28 | Mean Difference (Fixed, 95% CI) | ‐73.92 [‐123.78, ‐24.06] |
| Analysis 7.4  Comparison 7 Prompts plus information versus information alone, Outcome 4 Mean difference in time in sitting bouts lasting 30 minutes or more, follow‐up short‐term. | ||||
| 5 Mean difference in total time spent sitting (including sitting at and outside work), follow‐up short‐term Show forest plot | 1 | Mean Difference (Fixed, 95% CI) | Totals not selected | |
| Analysis 7.5  Comparison 7 Prompts plus information versus information alone, Outcome 5 Mean difference in total time spent sitting (including sitting at and outside work), follow‐up short‐term. | ||||
| 6 Mean difference in time spent standing at work follow‐up short‐term Show forest plot | 1 | Mean Difference (Fixed, 95% CI) | Totals not selected | |
| Analysis 7.6  Comparison 7 Prompts plus information versus information alone, Outcome 6 Mean difference in time spent standing at work follow‐up short‐term. | ||||
| 7 Mean difference in energy expenditure, follow‐up medium‐term Show forest plot | 1 | Mean Difference (Fixed, 95% CI) | Totals not selected | |
| Analysis 7.7  Comparison 7 Prompts plus information versus information alone, Outcome 7 Mean difference in energy expenditure, follow‐up medium‐term. | ||||
| Outcome or subgroup title | No. of studies | No. of participants | Statistical method | Effect size |
| 1 Mean difference in time spent sitting at work, follow‐up short‐term Show forest plot | 1 | Mean Difference (IV, Fixed, 95% CI) | Totals not selected | |
| Analysis 8.1  Comparison 8 Computer prompts to step versus computer prompts to stand, Outcome 1 Mean difference in time spent sitting at work, follow‐up short‐term. | ||||
| 2 Mean difference in number of sitting bouts lasting 30 minutes or more, follow‐up short‐term Show forest plot | 1 | Mean Difference (IV, Fixed, 95% CI) | Totals not selected | |
| Analysis 8.2  Comparison 8 Computer prompts to step versus computer prompts to stand, Outcome 2 Mean difference in number of sitting bouts lasting 30 minutes or more, follow‐up short‐term. | ||||
| 3 Mean difference in time spent standing at work, follow‐up short‐term Show forest plot | 1 | Mean Difference (IV, Fixed, 95% CI) | Totals not selected | |
| Analysis 8.3  Comparison 8 Computer prompts to step versus computer prompts to stand, Outcome 3 Mean difference in time spent standing at work, follow‐up short‐term. | ||||
| 4 Mean difference in time spent stepping at work, follow‐up short‐term Show forest plot | 1 | Mean Difference (IV, Fixed, 95% CI) | Totals not selected | |
| Analysis 8.4  Comparison 8 Computer prompts to step versus computer prompts to stand, Outcome 4 Mean difference in time spent stepping at work, follow‐up short‐term. | ||||
| Outcome or subgroup title | No. of studies | No. of participants | Statistical method | Effect size |
| 1 Mean difference in time in sitting bouts lasting 30 minutes or more, follow‐up short‐term Show forest plot | 1 | Mean Difference (Fixed, 95% CI) | Totals not selected | |
| Analysis 9.1  Comparison 9 High personalised or contextualised information versus less personalised or contextualised information, Outcome 1 Mean difference in time in sitting bouts lasting 30 minutes or more, follow‐up short‐term. | ||||
| Outcome or subgroup title | No. of studies | No. of participants | Statistical method | Effect size |
| 1 Mean difference in time spent sitting at work, follow‐up medium‐term Show forest plot | 1 | 257 | Mean Difference (Fixed, 95% CI) | ‐22.69 [‐62.55, 17.17] |
| Analysis 10.1  Comparison 10 Mindfulness training versus no intervention, Outcome 1 Mean difference in time spent sitting at work, follow‐up medium‐term. | ||||
| 2 Work engagement (0‐6 scale), follow‐up medium‐term Show forest plot | 1 | Mean Difference (Fixed, 95% CI) | Totals not selected | |
| Analysis 10.2 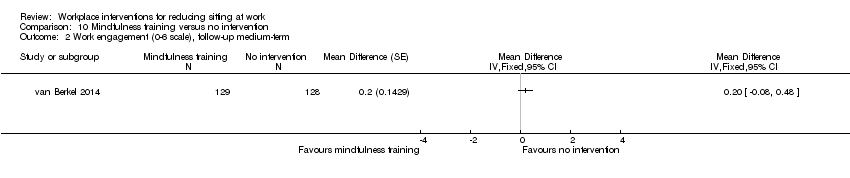 Comparison 10 Mindfulness training versus no intervention, Outcome 2 Work engagement (0‐6 scale), follow‐up medium‐term. | ||||
| Outcome or subgroup title | No. of studies | No. of participants | Statistical method | Effect size |
| 1 Mean difference in time spent sitting at work, follow‐up short‐term Show forest plot | 1 | Mean Difference (Fixed, 95% CI) | Totals not selected | |
| Analysis 11.1  Comparison 11 Activity tracker combined with organisational support versus organisational support only, Outcome 1 Mean difference in time spent sitting at work, follow‐up short‐term. | ||||
| 2 Mean difference in time spent sitting at work, follow‐up medium‐term Show forest plot | 1 | Mean Difference (Fixed, 95% CI) | Totals not selected | |
| Analysis 11.2 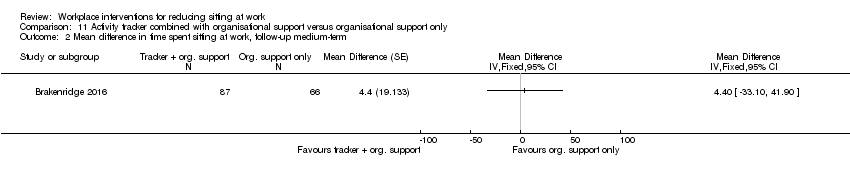 Comparison 11 Activity tracker combined with organisational support versus organisational support only, Outcome 2 Mean difference in time spent sitting at work, follow‐up medium‐term. | ||||
| 3 Mean difference in time in sitting bouts lasting 30 minutes or more, follow‐up short‐term Show forest plot | 1 | Mean Difference (IV, Fixed, 95% CI) | Totals not selected | |
| Analysis 11.3 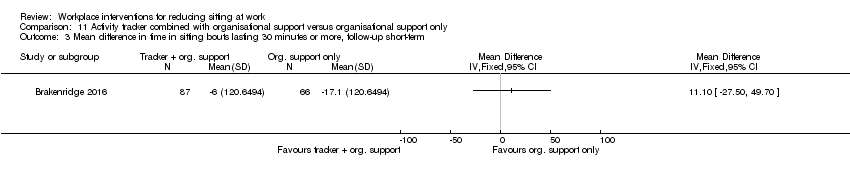 Comparison 11 Activity tracker combined with organisational support versus organisational support only, Outcome 3 Mean difference in time in sitting bouts lasting 30 minutes or more, follow‐up short‐term. | ||||
| 4 Mean difference in time in sitting bouts lasting 30 minutes or more, follow‐up medium‐term Show forest plot | 1 | Mean Difference (IV, Fixed, 95% CI) | Totals not selected | |
| Analysis 11.4 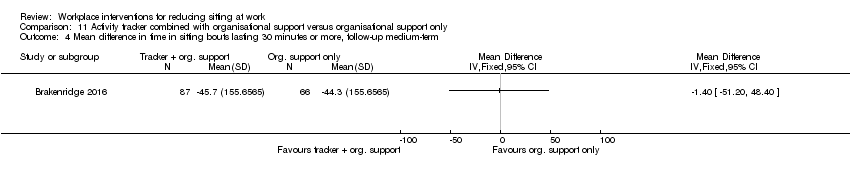 Comparison 11 Activity tracker combined with organisational support versus organisational support only, Outcome 4 Mean difference in time in sitting bouts lasting 30 minutes or more, follow‐up medium‐term. | ||||
| 5 Mean difference in total time spent sitting (including sitting at and outside work), follow‐up short‐term Show forest plot | 1 | Mean Difference (IV, Fixed, 95% CI) | Totals not selected | |
| Analysis 11.5 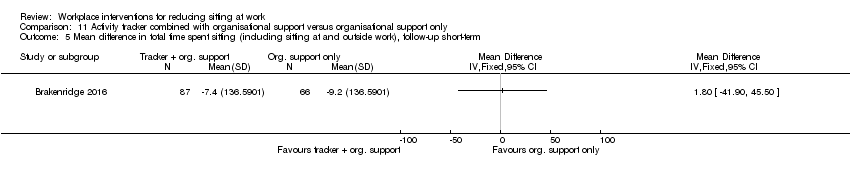 Comparison 11 Activity tracker combined with organisational support versus organisational support only, Outcome 5 Mean difference in total time spent sitting (including sitting at and outside work), follow‐up short‐term. | ||||
| 6 Mean difference in total time spent sitting (including sitting at and outside work), follow‐up medium‐term Show forest plot | 1 | Mean Difference (IV, Fixed, 95% CI) | Totals not selected | |
| Analysis 11.6 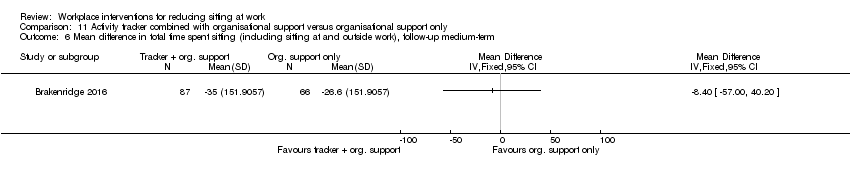 Comparison 11 Activity tracker combined with organisational support versus organisational support only, Outcome 6 Mean difference in total time spent sitting (including sitting at and outside work), follow‐up medium‐term. | ||||
| 7 Mean difference in time spent standing at work follow‐up short‐term Show forest plot | 1 | Mean Difference (Fixed, 95% CI) | Totals not selected | |
| Analysis 11.7  Comparison 11 Activity tracker combined with organisational support versus organisational support only, Outcome 7 Mean difference in time spent standing at work follow‐up short‐term. | ||||
| 8 Mean difference in time spent stepping at work, follow‐up short‐term Show forest plot | 1 | Mean Difference (Fixed, 95% CI) | Totals not selected | |
| Analysis 11.8  Comparison 11 Activity tracker combined with organisational support versus organisational support only, Outcome 8 Mean difference in time spent stepping at work, follow‐up short‐term. | ||||
| 9 Mean difference in time spent standing at work follow‐up medium‐term Show forest plot | 1 | Mean Difference (Fixed, 95% CI) | Totals not selected | |
| Analysis 11.9 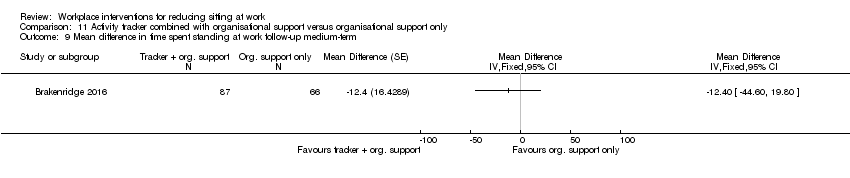 Comparison 11 Activity tracker combined with organisational support versus organisational support only, Outcome 9 Mean difference in time spent standing at work follow‐up medium‐term. | ||||
| 10 Mean difference in time spent stepping at work, follow‐up medium‐term Show forest plot | 1 | Mean Difference (Fixed, 95% CI) | Totals not selected | |
| Analysis 11.10  Comparison 11 Activity tracker combined with organisational support versus organisational support only, Outcome 10 Mean difference in time spent stepping at work, follow‐up medium‐term. | ||||
| Outcome or subgroup title | No. of studies | No. of participants | Statistical method | Effect size |
| 1 Mean difference in time spent sitting at work, follow‐up short‐term Show forest plot | 3 | Mean Difference (IV, Fixed, 95% CI) | Totals not selected | |
| Analysis 12.1  Comparison 12 Multi‐component intervention versus no intervention, Outcome 1 Mean difference in time spent sitting at work, follow‐up short‐term. | ||||
| 2 Mean difference in time spent sitting at work, follow‐up medium‐term Show forest plot | 2 | 562 | Mean Difference (IV, Fixed, 95% CI) | ‐45.60 [‐62.54, ‐28.66] |
| Analysis 12.2  Comparison 12 Multi‐component intervention versus no intervention, Outcome 2 Mean difference in time spent sitting at work, follow‐up medium‐term. | ||||
| 3 Mean difference in number of sitting bouts lasting 30 minutes or more, follow‐up short‐term Show forest plot | 1 | Mean Difference (Fixed, 95% CI) | Totals not selected | |
| Analysis 12.3  Comparison 12 Multi‐component intervention versus no intervention, Outcome 3 Mean difference in number of sitting bouts lasting 30 minutes or more, follow‐up short‐term. | ||||
| 4 Mean difference in time in sitting bouts lasting 30 minutes or more, follow‐up short‐term Show forest plot | 2 | Mean Difference (Fixed, 95% CI) | Totals not selected | |
| Analysis 12.4  Comparison 12 Multi‐component intervention versus no intervention, Outcome 4 Mean difference in time in sitting bouts lasting 30 minutes or more, follow‐up short‐term. | ||||
| 5 Mean difference in time in sitting bouts lasting 30 minutes or more, follow‐up medium‐term Show forest plot | 1 | Mean Difference (Fixed, 95% CI) | Totals not selected | |
| Analysis 12.5  Comparison 12 Multi‐component intervention versus no intervention, Outcome 5 Mean difference in time in sitting bouts lasting 30 minutes or more, follow‐up medium‐term. | ||||
| 6 Mean difference in total time spent sitting (including sitting at and outside work), follow‐up short‐term Show forest plot | 2 | 227 | Mean Difference (Fixed, 95% CI) | ‐72.73 [‐91.87, ‐53.59] |
| Analysis 12.6  Comparison 12 Multi‐component intervention versus no intervention, Outcome 6 Mean difference in total time spent sitting (including sitting at and outside work), follow‐up short‐term. | ||||
| 7 Mean difference in total time spent sitting (including sitting at and outside work), follow‐up medium‐term Show forest plot | 1 | Mean Difference (IV, Fixed, 95% CI) | Totals not selected | |
| Analysis 12.7  Comparison 12 Multi‐component intervention versus no intervention, Outcome 7 Mean difference in total time spent sitting (including sitting at and outside work), follow‐up medium‐term. | ||||
| 8 Mean difference in time spent standing at work follow‐up short‐term Show forest plot | 2 | Mean Difference (IV, Fixed, 95% CI) | Totals not selected | |
| Analysis 12.8  Comparison 12 Multi‐component intervention versus no intervention, Outcome 8 Mean difference in time spent standing at work follow‐up short‐term. | ||||
| 9 Mean difference in time spent stepping at work follow‐up short‐term Show forest plot | 1 | Mean Difference (IV, Fixed, 95% CI) | Totals not selected | |
| Analysis 12.9 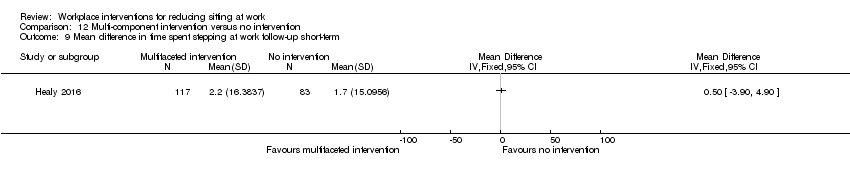 Comparison 12 Multi‐component intervention versus no intervention, Outcome 9 Mean difference in time spent stepping at work follow‐up short‐term. | ||||
| 10 Mean difference in time spent standing at work follow‐up medium‐term Show forest plot | 1 | Mean Difference (IV, Fixed, 95% CI) | Totals not selected | |
| Analysis 12.10 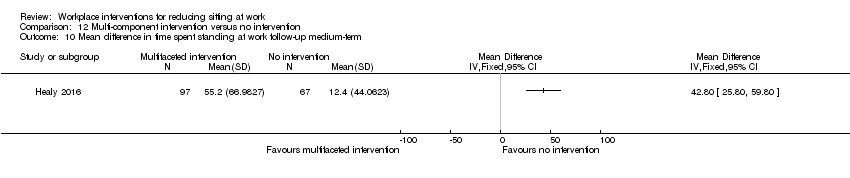 Comparison 12 Multi‐component intervention versus no intervention, Outcome 10 Mean difference in time spent standing at work follow‐up medium‐term. | ||||
| 11 Mean difference in time spent stepping at work follow‐up medium‐term Show forest plot | 1 | Mean Difference (IV, Fixed, 95% CI) | Totals not selected | |
| Analysis 12.11  Comparison 12 Multi‐component intervention versus no intervention, Outcome 11 Mean difference in time spent stepping at work follow‐up medium‐term. | ||||
| 12 Work engagement (0‐6 scale), follow‐up short‐term Show forest plot | 1 | Mean Difference (Fixed, 95% CI) | 0.0 [‐0.14, 0.14] | |
| Analysis 12.12  Comparison 12 Multi‐component intervention versus no intervention, Outcome 12 Work engagement (0‐6 scale), follow‐up short‐term. | ||||
| 12.1 Environmental interventions only | 1 | Mean Difference (Fixed, 95% CI) | 0.1 [‐0.10, 0.30] | |
| 12.2 Environmental interventions + counselling | 1 | Mean Difference (Fixed, 95% CI) | ‐0.1 [‐0.30, 0.10] | |
| 13 Mean difference in musculoskeletal symptoms all sites (score 0–6) at short‐term follow‐up Show forest plot | 1 | Mean Difference (Fixed, 95% CI) | Totals not selected | |
| Analysis 12.13  Comparison 12 Multi‐component intervention versus no intervention, Outcome 13 Mean difference in musculoskeletal symptoms all sites (score 0–6) at short‐term follow‐up. | ||||

PRISMA study flow diagram

Risk of bias graph: review authors' judgements about each risk of bias item presented as percentages across all included studies.

Risk of bias summary: review authors' judgements about each risk of bias item for each included study.
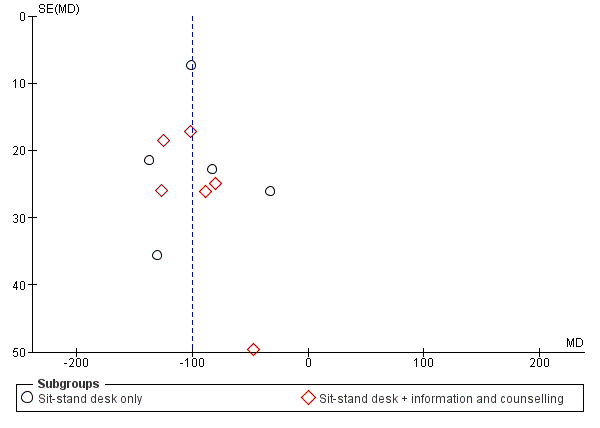
Funnel plot of comparison: 1 Sit‐stand desk with or without information and counselling versus sit‐desk, outcome: 1.1 Mean difference in time spent sitting at work: short‐term follow‐up.

Comparison 1 Sit‐stand desk with or without information and counselling versus sit‐desk, Outcome 1 Mean difference in time spent sitting at work follow‐up short‐term.

Comparison 1 Sit‐stand desk with or without information and counselling versus sit‐desk, Outcome 2 Mean difference in time spent sitting at work, follow‐up short‐term ‐ sensitivity analysis.
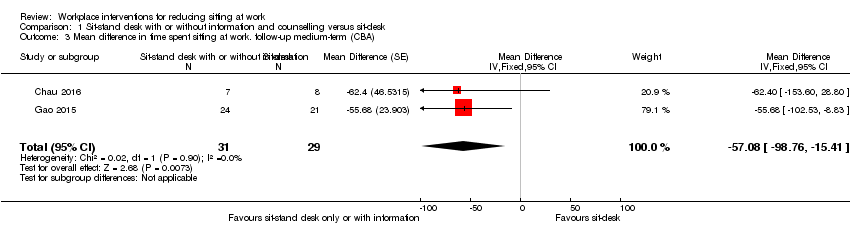
Comparison 1 Sit‐stand desk with or without information and counselling versus sit‐desk, Outcome 3 Mean difference in time spent sitting at work. follow‐up medium‐term (CBA).

Comparison 1 Sit‐stand desk with or without information and counselling versus sit‐desk, Outcome 4 Mean difference in time in sitting bouts lasting 30 minutes or more, follow‐up short‐term (CBA).
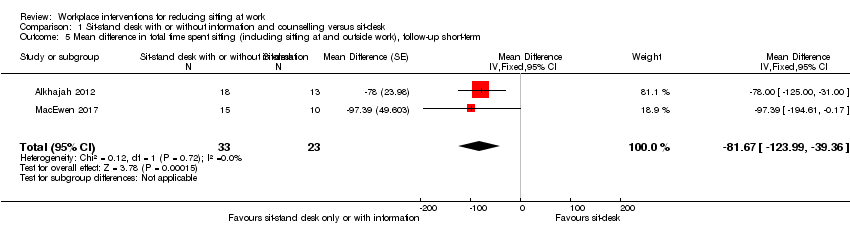
Comparison 1 Sit‐stand desk with or without information and counselling versus sit‐desk, Outcome 5 Mean difference in total time spent sitting (including sitting at and outside work), follow‐up short‐term.
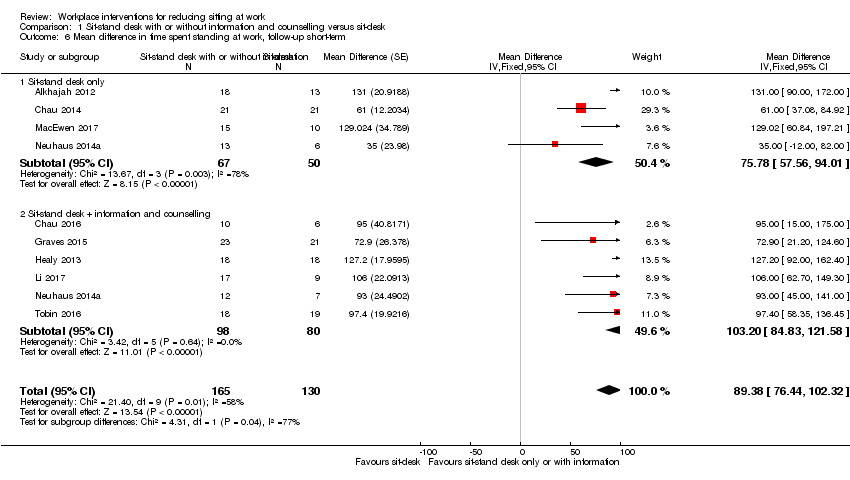
Comparison 1 Sit‐stand desk with or without information and counselling versus sit‐desk, Outcome 6 Mean difference in time spent standing at work, follow‐up short‐term.
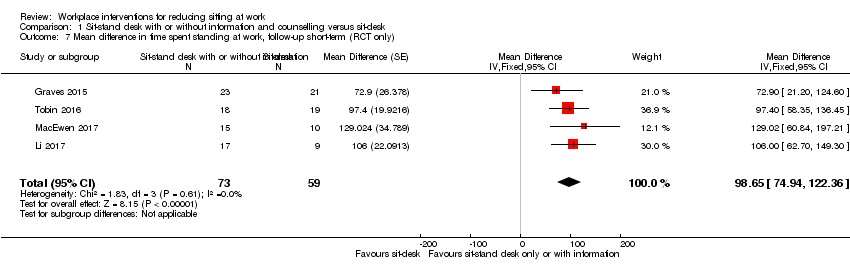
Comparison 1 Sit‐stand desk with or without information and counselling versus sit‐desk, Outcome 7 Mean difference in time spent standing at work, follow‐up short‐term (RCT only).

Comparison 1 Sit‐stand desk with or without information and counselling versus sit‐desk, Outcome 8 Mean difference in time spent stepping at work follow‐up short‐term.

Comparison 1 Sit‐stand desk with or without information and counselling versus sit‐desk, Outcome 9 Mean difference in time spent standng at work, follow‐up medium‐term (CBA).

Comparison 1 Sit‐stand desk with or without information and counselling versus sit‐desk, Outcome 10 Work performance (1‐10 scale), follow‐up short‐term (CBA).

Comparison 1 Sit‐stand desk with or without information and counselling versus sit‐desk, Outcome 11 Proportion with ≥ 1 sick days in the last three months (CBA).

Comparison 1 Sit‐stand desk with or without information and counselling versus sit‐desk, Outcome 12 Proportion with ≥ 1 sick days in the last month (CBA).
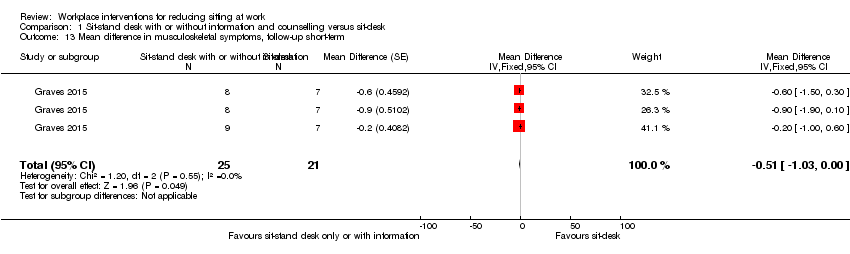
Comparison 1 Sit‐stand desk with or without information and counselling versus sit‐desk, Outcome 13 Mean difference in musculoskeletal symptoms, follow‐up short‐term.

Comparison 1 Sit‐stand desk with or without information and counselling versus sit‐desk, Outcome 14 Mean difference in musculoskeletal symptoms, follow‐up Medium‐term.

Comparison 2 Standing desk versus sit‐stand desk, Outcome 1 Mean difference in time spent sitting at work, follow‐up short‐term.

Comparison 2 Standing desk versus sit‐stand desk, Outcome 2 Mean difference in time spent sitting at work, follow‐up medium‐term.

Comparison 3 Active workstation versus sit desk, Outcome 1 Mean difference in time spent sitting at work, follow‐up short‐term.
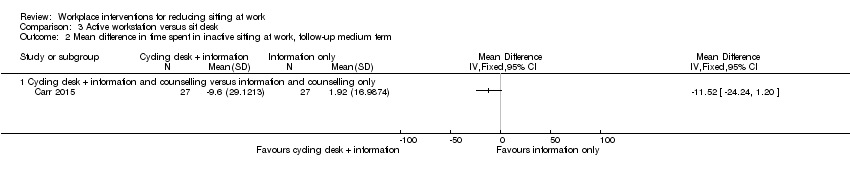
Comparison 3 Active workstation versus sit desk, Outcome 2 Mean difference in time spent in inactive sitting at work, follow‐up medium term.
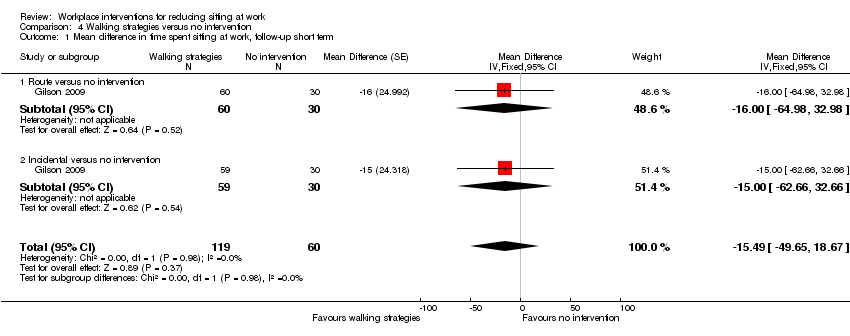
Comparison 4 Walking strategies versus no intervention, Outcome 1 Mean difference in time spent sitting at work, follow‐up short term.

Comparison 4 Walking strategies versus no intervention, Outcome 2 Mean difference in time spent sitting at work, follow‐up medium‐term.

Comparison 4 Walking strategies versus no intervention, Outcome 3 Percentage of lost work productivity (WLQ Index Score) follow‐up medium‐term.
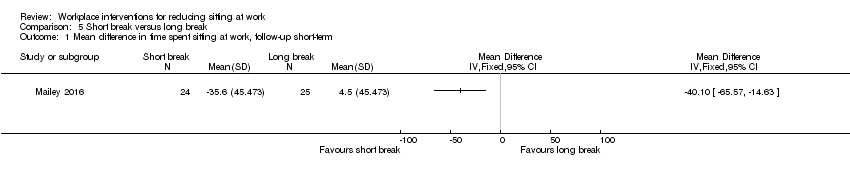
Comparison 5 Short break versus long break, Outcome 1 Mean difference in time spent sitting at work, follow‐up short‐term.

Comparison 6 Information, feedback and/or reminder versus information only or no intervention, Outcome 1 Mean difference in time spent sitting at work, follow‐up short term.
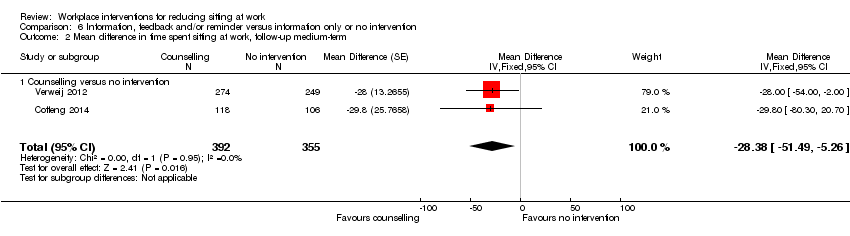
Comparison 6 Information, feedback and/or reminder versus information only or no intervention, Outcome 2 Mean difference in time spent sitting at work, follow‐up medium‐term.
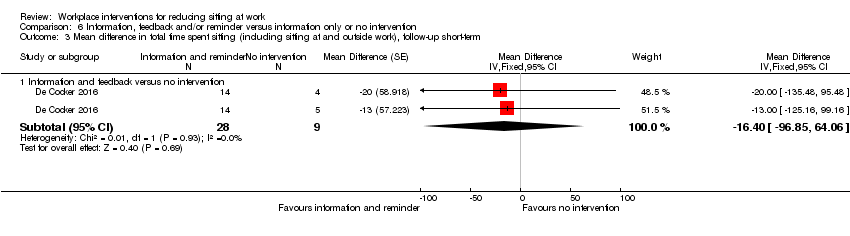
Comparison 6 Information, feedback and/or reminder versus information only or no intervention, Outcome 3 Mean difference in total time spent sitting (including sitting at and outside work), follow‐up short‐term.

Comparison 6 Information, feedback and/or reminder versus information only or no intervention, Outcome 4 Mean difference in total time spent sitting (including sitting at and outside work), follow‐up medium term.

Comparison 6 Information, feedback and/or reminder versus information only or no intervention, Outcome 5 Mean difference in time spent standing at work follow‐up short‐term.
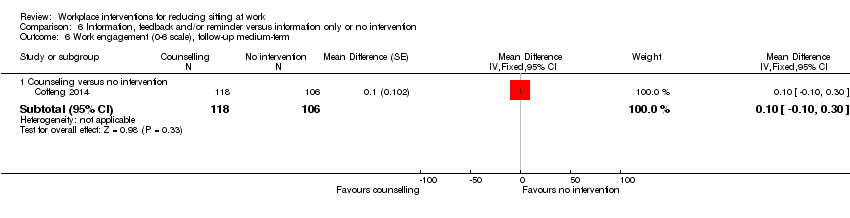
Comparison 6 Information, feedback and/or reminder versus information only or no intervention, Outcome 6 Work engagement (0‐6 scale), follow‐up medium‐term.

Comparison 7 Prompts plus information versus information alone, Outcome 1 Mean difference in time spent sitting at work, follow‐up short term.

Comparison 7 Prompts plus information versus information alone, Outcome 2 Mean difference in time spent sitting at work, follow‐up medium‐term.

Comparison 7 Prompts plus information versus information alone, Outcome 3 Mean difference in number of sitting bouts lasting 30 minutes or more, follow‐up short‐term.
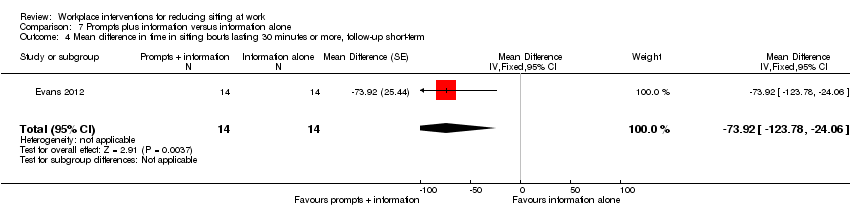
Comparison 7 Prompts plus information versus information alone, Outcome 4 Mean difference in time in sitting bouts lasting 30 minutes or more, follow‐up short‐term.

Comparison 7 Prompts plus information versus information alone, Outcome 5 Mean difference in total time spent sitting (including sitting at and outside work), follow‐up short‐term.
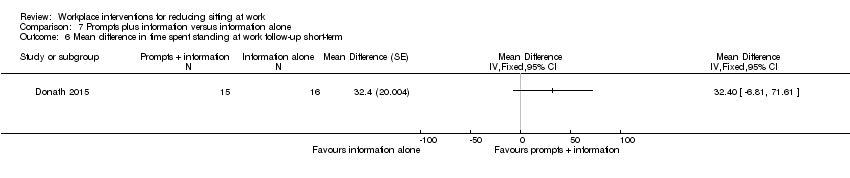
Comparison 7 Prompts plus information versus information alone, Outcome 6 Mean difference in time spent standing at work follow‐up short‐term.

Comparison 7 Prompts plus information versus information alone, Outcome 7 Mean difference in energy expenditure, follow‐up medium‐term.

Comparison 8 Computer prompts to step versus computer prompts to stand, Outcome 1 Mean difference in time spent sitting at work, follow‐up short‐term.
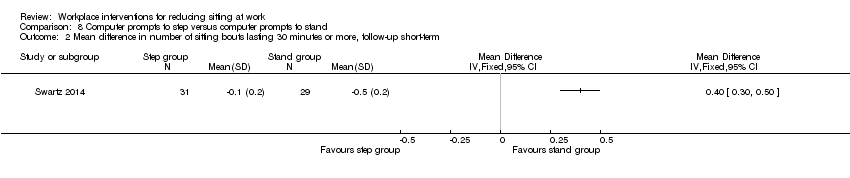
Comparison 8 Computer prompts to step versus computer prompts to stand, Outcome 2 Mean difference in number of sitting bouts lasting 30 minutes or more, follow‐up short‐term.

Comparison 8 Computer prompts to step versus computer prompts to stand, Outcome 3 Mean difference in time spent standing at work, follow‐up short‐term.
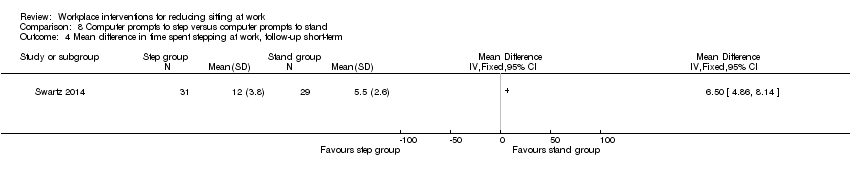
Comparison 8 Computer prompts to step versus computer prompts to stand, Outcome 4 Mean difference in time spent stepping at work, follow‐up short‐term.

Comparison 9 High personalised or contextualised information versus less personalised or contextualised information, Outcome 1 Mean difference in time in sitting bouts lasting 30 minutes or more, follow‐up short‐term.
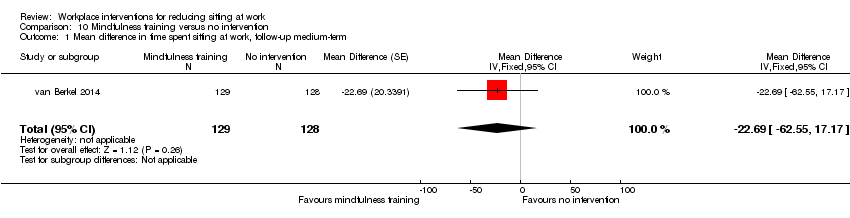
Comparison 10 Mindfulness training versus no intervention, Outcome 1 Mean difference in time spent sitting at work, follow‐up medium‐term.

Comparison 10 Mindfulness training versus no intervention, Outcome 2 Work engagement (0‐6 scale), follow‐up medium‐term.

Comparison 11 Activity tracker combined with organisational support versus organisational support only, Outcome 1 Mean difference in time spent sitting at work, follow‐up short‐term.

Comparison 11 Activity tracker combined with organisational support versus organisational support only, Outcome 2 Mean difference in time spent sitting at work, follow‐up medium‐term.

Comparison 11 Activity tracker combined with organisational support versus organisational support only, Outcome 3 Mean difference in time in sitting bouts lasting 30 minutes or more, follow‐up short‐term.

Comparison 11 Activity tracker combined with organisational support versus organisational support only, Outcome 4 Mean difference in time in sitting bouts lasting 30 minutes or more, follow‐up medium‐term.

Comparison 11 Activity tracker combined with organisational support versus organisational support only, Outcome 5 Mean difference in total time spent sitting (including sitting at and outside work), follow‐up short‐term.

Comparison 11 Activity tracker combined with organisational support versus organisational support only, Outcome 6 Mean difference in total time spent sitting (including sitting at and outside work), follow‐up medium‐term.

Comparison 11 Activity tracker combined with organisational support versus organisational support only, Outcome 7 Mean difference in time spent standing at work follow‐up short‐term.

Comparison 11 Activity tracker combined with organisational support versus organisational support only, Outcome 8 Mean difference in time spent stepping at work, follow‐up short‐term.

Comparison 11 Activity tracker combined with organisational support versus organisational support only, Outcome 9 Mean difference in time spent standing at work follow‐up medium‐term.
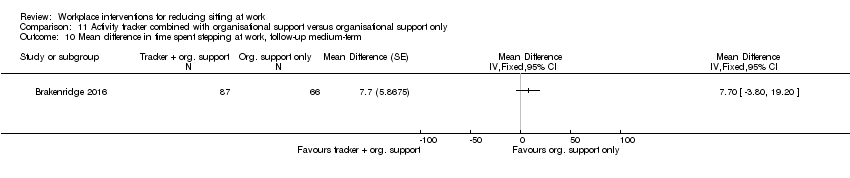
Comparison 11 Activity tracker combined with organisational support versus organisational support only, Outcome 10 Mean difference in time spent stepping at work, follow‐up medium‐term.
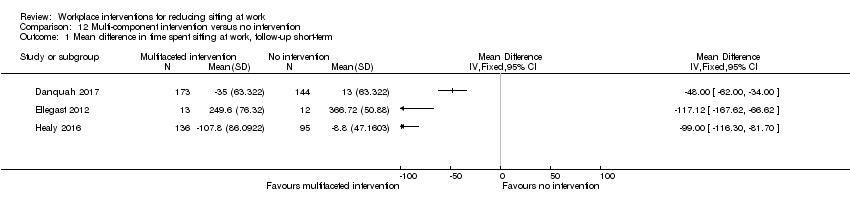
Comparison 12 Multi‐component intervention versus no intervention, Outcome 1 Mean difference in time spent sitting at work, follow‐up short‐term.
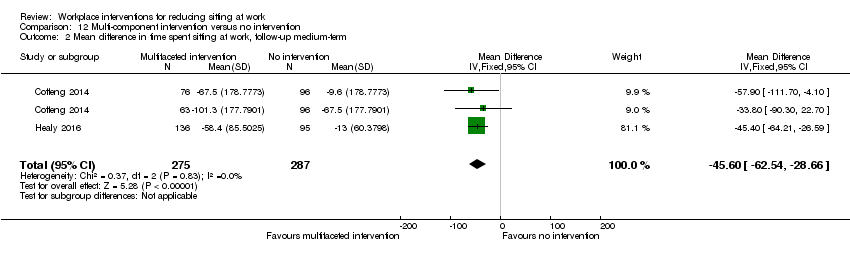
Comparison 12 Multi‐component intervention versus no intervention, Outcome 2 Mean difference in time spent sitting at work, follow‐up medium‐term.
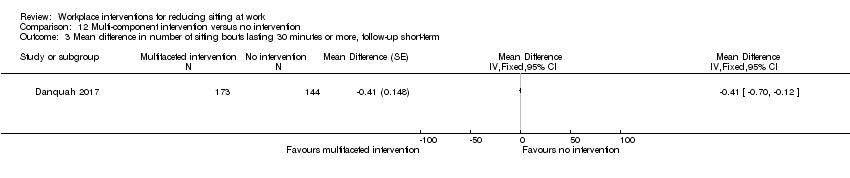
Comparison 12 Multi‐component intervention versus no intervention, Outcome 3 Mean difference in number of sitting bouts lasting 30 minutes or more, follow‐up short‐term.

Comparison 12 Multi‐component intervention versus no intervention, Outcome 4 Mean difference in time in sitting bouts lasting 30 minutes or more, follow‐up short‐term.
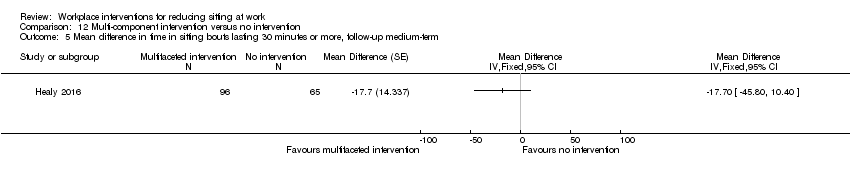
Comparison 12 Multi‐component intervention versus no intervention, Outcome 5 Mean difference in time in sitting bouts lasting 30 minutes or more, follow‐up medium‐term.

Comparison 12 Multi‐component intervention versus no intervention, Outcome 6 Mean difference in total time spent sitting (including sitting at and outside work), follow‐up short‐term.

Comparison 12 Multi‐component intervention versus no intervention, Outcome 7 Mean difference in total time spent sitting (including sitting at and outside work), follow‐up medium‐term.
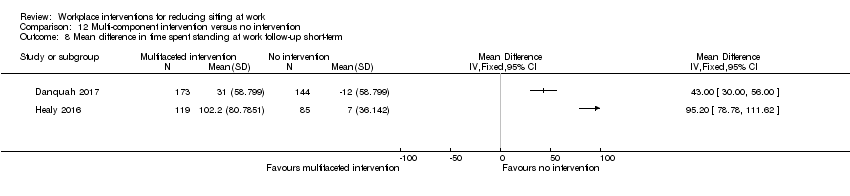
Comparison 12 Multi‐component intervention versus no intervention, Outcome 8 Mean difference in time spent standing at work follow‐up short‐term.

Comparison 12 Multi‐component intervention versus no intervention, Outcome 9 Mean difference in time spent stepping at work follow‐up short‐term.

Comparison 12 Multi‐component intervention versus no intervention, Outcome 10 Mean difference in time spent standing at work follow‐up medium‐term.

Comparison 12 Multi‐component intervention versus no intervention, Outcome 11 Mean difference in time spent stepping at work follow‐up medium‐term.

Comparison 12 Multi‐component intervention versus no intervention, Outcome 12 Work engagement (0‐6 scale), follow‐up short‐term.
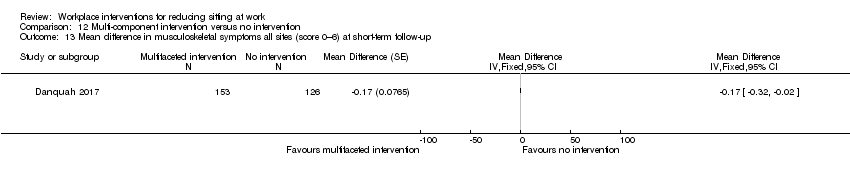
Comparison 12 Multi‐component intervention versus no intervention, Outcome 13 Mean difference in musculoskeletal symptoms all sites (score 0–6) at short‐term follow‐up.
| Alternative desks and workstations compared to sit‐desks for reducing sitting at work | |||||
| Patient or population: employees who sit at work | |||||
| Outcomes | Anticipated absolute effects* (95% CI) | № of participants | Certainty of the evidence | Comments | |
| Risk with sit‐desk | Risk with changes in desk | ||||
| Comparison: sit‐stand desk with or without information and counselling versus sit‐desk | |||||
| Mean difference in time spent sitting at work, short‐term follow‐up (up to 3 months) | The mean difference in time spent sitting at work (short‐term follow‐up) was 364 minutes | MD 100 minutes lower | 323 | ⊕⊕⊝⊝ | Subgroup analysis showed no difference in effect between sit‐stand desks used alone or in combination with information and counselling. Restricting the analysis to RCTs only did not show any difference in effect either. |
| Mean difference in time in sitting bouts lasting 30 minutes or more, short‐term follow‐up | The mean difference in time in sitting bouts lasting 30 minutes or more (short‐term follow‐up) was 167 minutes | MD 53 minutes lower | 74 | ⊕⊝⊝⊝ | |
| Comparison: treadmill desk combined with counselling versus sit‐desk | |||||
| Mean difference in time spent sitting at work, short‐term follow‐up (up to 3 months) | The mean difference in time spent sitting at work (short‐term follow‐up) was 342 minutes | MD 29 minutes lower | 31 | ⊕⊕⊝⊝ | |
| Mean difference in time in sitting bouts lasting 30 minutes or more, short‐term follow‐up — not reported | ‐ | ‐ | ‐ | ‐ | |
| Comparison: cycling desk + information and counselling versus sit‐desk + information and counselling | |||||
| Mean difference in time spent in inactive sitting at work, medium‐term follow‐up (from 3 to 12 months) | The mean difference in time spent in inactive sitting at work (medium‐term follow‐up) was 413 minutes | MD 12 minutes lower | 54 | ⊕⊕⊝⊝ | |
| *The risk in the intervention group (and its 95% confidence interval) is based on the assumed risk in the comparison group and the relative effect of the intervention (and its 95% CI). | |||||
| GRADE Working Group grades of evidence | |||||
| 1 Of the six RCTs, five were at high risk of bias. The non‐randomised controlled before‐and‐after study/studies were also at high risk of bias; downgraded one level 2 Imprecision with wide confidence intervals, small sample size; downgraded one level 3 Unconcealed allocation, unblinded outcome assessment and attrition bias; downgraded two levels 4 Unblinded outcome assessment; downgraded one level 5 Unblinded outcome assessment and attrition bias; downgraded one level | |||||
| Workplace policy changes compared to no intervention for reducing sitting at work | |||||
| Patient or population: employees who sit at work | |||||
| Outcomes | Anticipated absolute effects* (95% CI) | № of participants | Certainty of the evidence | Comments | |
| Risk with no intervention | Risk with Policy changes | ||||
| Comparision: walking strategies versus no intervention | |||||
| Mean difference in time spent sitting at work, short‐term follow‐up | The mean difference in time spent sitting at work (short‐term follow‐up) was 344 minutes | MD 15 minutes lower | 179 | ⊕⊕⊝⊝ | |
| Mean difference in time in sitting bouts lasting 30 minutes or more, short‐term follow‐up — not reported | ‐ | ‐ | ‐ | ‐ | |
| Comparision: short break versus long break | |||||
| Mean difference in time spent sitting at work, short‐term follow‐up | The mean difference in time spent sitting at work (short term follow‐up) was 131 minutes | MD 40 minutes lower | 49 | ⊕⊕⊝⊝ | |
| Mean difference in time in sitting bouts lasting 30 minutes or more, short‐term follow‐up — not reported | ‐ | ‐ | ‐ | ‐ | |
| *The risk in the intervention group (and its 95% confidence interval) is based on the assumed risk in the comparison group and the relative effect of the intervention (and its 95% CI). | |||||
| GRADE Working Group grades of evidence | |||||
| 1 Risk of bias high due to unblinded outcome assessment and lack of allocation concealment; downgraded with one level 2 Imprecision with wide confidence intervals; downgraded with one level 3 Unconcealed allocation and attrition bias | |||||
| Information and counselling compared to information only or no intervention for reducing sitting at work | |||||
| Patient or population: employees who sit at work | |||||
| Outcomes | Anticipated absolute effects* (95% CI) | № of participants | Certainty of the evidence | Comments | |
| Risk with information only or no intervention | Risk with Information and counselling | ||||
| Information, feedback and counselling versus no intervention | |||||
| Mean difference in time spent sitting at work, short‐term follow‐up — information and feedback versus no intervention | The mean difference in time spent sitting at work (short‐term follow‐up) was 550 minutes | MD 19 minutes lower | 63 | ⊕⊕⊝⊝ | |
| Mean difference in time spent sitting at work, medium‐term follow‐up — counselling versus no intervention | The mean difference in time spent sitting at work (medium‐term follow‐up) was 462 minutes | MD 28 minutes lower | 747 | ⊕⊕⊝⊝ | |
| Mean difference in time in sitting bouts lasting 30 minutes or more, short‐term follow‐up ‐ not reported | ‐ | ‐ | ‐ | ‐ | |
| Prompts combined with information versus information alone | |||||
| Mean difference in time spent sitting at work, short‐term follow‐up | The mean difference in time spent sitting at work (short‐term follow‐up) was 349 minutes | MD 10 minutes lower | 75 | ⊕⊕⊝⊝ | |
| Mean difference in time in sitting bouts lasting 30 minutes or more, short‐term follow‐up | The mean difference in time in sitting bouts lasting 30 minutes or more (short‐term follow‐up) was 286 minutes | MD 74 minutes lower | 28 | ⊕⊕⊝⊝ | |
| Mindfulness training versus no intervention | |||||
| Mean difference in time spent sitting at work, medium‐term follow‐up | The mean difference in time spent sitting at work (medium‐term follow‐up) was 316 minutes | MD 23 minutes lower | 257 | ⊕⊕⊝⊝ | |
| Mean difference in time in sitting bouts lasting 30 minutes or more, medium‐term follow‐up — not reported | ‐ | ‐ | ‐ | ‐ | |
| *The risk in the intervention group (and its 95% confidence interval) is based on the assumed risk in the comparison group and the relative effect of the intervention (and its 95% CI). | |||||
| GRADE Working Group grades of evidence | |||||
| 1 Imprecision with wide confidence intervals, small sample size; downgraded with one level 2 Unblinded outcome assessment and attrition bas 3 Risk of bias, allocation not concealed, lack of blinding, high attrition rate; downgraded with one level 4 Lack of blinding of participants and selective reporting 5 Lack of blinding of participants and attrition bias 6 Risk of bias high due to unconcealed allocation and unblinded outcome assessment; downgraded with one level 7 Lack of blinding of participants | |||||
| Multi‐component intervention compared to no intervention for reducing sitting at work | |||||
| Patient or population: employees who sit at work | |||||
| Outcomes | Anticipated absolute effects* (95% CI) | № of participants | Certainty of the evidence | Comments | |
| Risk with no intervention | Risk with Multi‐component intervention | ||||
| Mean difference in time spent sitting at work, short‐term follow‐up | See comment | see comment | 573 | ⊕⊝⊝⊝ | Not pooled |
| Mean difference in time in sitting bouts lasting 30 minutes or more, short‐term follow‐up | See comment | See comment | 518 | ⊕⊝⊝⊝ | Not pooled |
| *The risk in the intervention group (and its 95% confidence interval) is based on the assumed risk in the comparison group and the relative effect of the intervention (and its 95% CI). CI: Confidence interval; RR: Risk ratio; OR: Odds ratio; RCT: randomised controlled trial | |||||
| GRADE Working Group grades of evidence | |||||
| 1 Unconcealed allocation and unblinded outcome assessment 2 Imprecision with wide confidence interval, small sample size 3 Not pooled due to high heterogeneity 3 Small sample size | |||||
| Outcome or subgroup title | No. of studies | No. of participants | Statistical method | Effect size |
| 1 Mean difference in time spent sitting at work follow‐up short‐term Show forest plot | 10 | 323 | Mean Difference (Random, 95% CI) | ‐100.16 [‐115.83, ‐84.48] |
| 1.1 Sit‐stand desk only | 5 | 145 | Mean Difference (Random, 95% CI) | ‐96.72 [‐126.05, ‐67.39] |
| 1.2 Sit‐stand desk + information and counselling | 6 | 178 | Mean Difference (Random, 95% CI) | ‐104.38 [‐122.81, ‐85.96] |
| 2 Mean difference in time spent sitting at work, follow‐up short‐term ‐ sensitivity analysis Show forest plot | 10 | 323 | Mean Difference (Random, 95% CI) | ‐100.16 [‐115.83, ‐84.48] |
| 2.1 Randomised control trials | 4 | 132 | Mean Difference (Random, 95% CI) | ‐105.19 [‐128.13, ‐82.24] |
| 2.2 Cross‐over RCT | 2 | 70 | Mean Difference (Random, 95% CI) | ‐99.11 [‐112.82, ‐85.41] |
| 2.3 Control before after studies | 4 | 121 | Mean Difference (Random, 95% CI) | ‐92.80 [‐133.13, ‐52.47] |
| 3 Mean difference in time spent sitting at work. follow‐up medium‐term (CBA) Show forest plot | 2 | 60 | Mean Difference (Fixed, 95% CI) | ‐57.08 [‐98.76, ‐15.41] |
| 4 Mean difference in time in sitting bouts lasting 30 minutes or more, follow‐up short‐term (CBA) Show forest plot | 2 | 74 | Mean Difference (Fixed, 95% CI) | ‐52.57 [‐78.79, ‐26.35] |
| 4.1 Sit‐stand desk only | 1 | 20 | Mean Difference (Fixed, 95% CI) | ‐13.00 [‐70.80, 40.80] |
| 4.2 Sit‐stand desk + information and counselling | 2 | 54 | Mean Difference (Fixed, 95% CI) | ‐63.22 [‐92.92, ‐33.51] |
| 5 Mean difference in total time spent sitting (including sitting at and outside work), follow‐up short‐term Show forest plot | 2 | 56 | Mean Difference (Fixed, 95% CI) | ‐81.67 [‐123.99, ‐39.36] |
| 6 Mean difference in time spent standing at work, follow‐up short‐term Show forest plot | 9 | 295 | Mean Difference (Fixed, 95% CI) | 89.38 [76.44, 102.32] |
| 6.1 Sit‐stand desk only | 4 | 117 | Mean Difference (Fixed, 95% CI) | 75.78 [57.56, 94.01] |
| 6.2 Sit‐stand desk + information and counselling | 6 | 178 | Mean Difference (Fixed, 95% CI) | 103.20 [84.83, 121.58] |
| 7 Mean difference in time spent standing at work, follow‐up short‐term (RCT only) Show forest plot | 4 | 132 | Mean Difference (Fixed, 95% CI) | 98.65 [74.94, 122.36] |
| 8 Mean difference in time spent stepping at work follow‐up short‐term Show forest plot | 8 | 270 | Mean Difference (Random, 95% CI) | ‐0.52 [‐3.88, 2.85] |
| 9 Mean difference in time spent standng at work, follow‐up medium‐term (CBA) Show forest plot | 2 | 60 | Mean Difference (IV, Fixed, 95% CI) | 53.36 [16.59, 90.14] |
| 10 Work performance (1‐10 scale), follow‐up short‐term (CBA) Show forest plot | 3 | 109 | Mean Difference (Fixed, 95% CI) | 0.35 [‐0.10, 0.79] |
| 10.1 Sit‐stand desk only | 2 | 52 | Mean Difference (Fixed, 95% CI) | 0.82 [0.00, 1.63] |
| 10.2 Sit‐stand desk + information and counselling | 2 | 57 | Mean Difference (Fixed, 95% CI) | 0.15 [‐0.38, 0.68] |
| 11 Proportion with ≥ 1 sick days in the last three months (CBA) Show forest plot | 1 | Risk Ratio (M‐H, Fixed, 95% CI) | Totals not selected | |
| 12 Proportion with ≥ 1 sick days in the last month (CBA) Show forest plot | 2 | 78 | Risk Ratio (M‐H, Fixed, 95% CI) | 0.77 [0.49, 1.21] |
| 12.1 Sit‐stand desk only | 1 | 20 | Risk Ratio (M‐H, Fixed, 95% CI) | 0.94 [0.42, 2.13] |
| 12.2 Sit‐stand desk + information and counselling | 2 | 58 | Risk Ratio (M‐H, Fixed, 95% CI) | 0.72 [0.41, 1.24] |
| 13 Mean difference in musculoskeletal symptoms, follow‐up short‐term Show forest plot | 1 | 46 | Mean Difference (Fixed, 95% CI) | ‐0.51 [‐1.03, ‐0.00] |
| 14 Mean difference in musculoskeletal symptoms, follow‐up Medium‐term Show forest plot | 1 | 45 | Mean Difference (Fixed, 95% CI) | ‐0.54 [‐0.89, ‐0.19] |
| Outcome or subgroup title | No. of studies | No. of participants | Statistical method | Effect size |
| 1 Mean difference in time spent sitting at work, follow‐up short‐term Show forest plot | 1 | Mean Difference (IV, Fixed, 95% CI) | Totals not selected | |
| 2 Mean difference in time spent sitting at work, follow‐up medium‐term Show forest plot | 1 | Mean Difference (IV, Fixed, 95% CI) | Totals not selected | |
| Outcome or subgroup title | No. of studies | No. of participants | Statistical method | Effect size |
| 1 Mean difference in time spent sitting at work, follow‐up short‐term Show forest plot | 1 | Mean Difference (IV, Fixed, 95% CI) | Totals not selected | |
| 1.1 Treadmill desk plus counselling versus sit desk | 1 | Mean Difference (IV, Fixed, 95% CI) | 0.0 [0.0, 0.0] | |
| 2 Mean difference in time spent in inactive sitting at work, follow‐up medium term Show forest plot | 1 | Mean Difference (IV, Fixed, 95% CI) | Totals not selected | |
| 2.1 Cycling desk + information and counselling versus information and counselling only | 1 | Mean Difference (IV, Fixed, 95% CI) | 0.0 [0.0, 0.0] | |
| Outcome or subgroup title | No. of studies | No. of participants | Statistical method | Effect size |
| 1 Mean difference in time spent sitting at work, follow‐up short term Show forest plot | 1 | 179 | Mean Difference (Fixed, 95% CI) | ‐15.49 [‐49.65, 18.67] |
| 1.1 Route versus no intervention | 1 | 90 | Mean Difference (Fixed, 95% CI) | ‐16.0 [‐64.98, 32.98] |
| 1.2 Incidental versus no intervention | 1 | 89 | Mean Difference (Fixed, 95% CI) | ‐15.0 [‐62.66, 32.66] |
| 2 Mean difference in time spent sitting at work, follow‐up medium‐term Show forest plot | 1 | 264 | Mean Difference (IV, Fixed, 95% CI) | ‐16.50 [‐60.55, 27.55] |
| 3 Percentage of lost work productivity (WLQ Index Score) follow‐up medium‐term Show forest plot | 1 | Mean Difference (Fixed, 95% CI) | Totals not selected | |
| Outcome or subgroup title | No. of studies | No. of participants | Statistical method | Effect size |
| 1 Mean difference in time spent sitting at work, follow‐up short‐term Show forest plot | 1 | Mean Difference (IV, Fixed, 95% CI) | Totals not selected | |
| Outcome or subgroup title | No. of studies | No. of participants | Statistical method | Effect size |
| 1 Mean difference in time spent sitting at work, follow‐up short term Show forest plot | 2 | 63 | Mean Difference (IV, Fixed, 95% CI) | ‐19.23 [‐57.05, 18.58] |
| 1.1 Information and feedback versus no intervention | 2 | 63 | Mean Difference (IV, Fixed, 95% CI) | ‐19.23 [‐57.05, 18.58] |
| 2 Mean difference in time spent sitting at work, follow‐up medium‐term Show forest plot | 2 | 747 | Mean Difference (Fixed, 95% CI) | ‐28.38 [‐51.49, ‐5.26] |
| 2.1 Counselling versus no intervention | 2 | 747 | Mean Difference (Fixed, 95% CI) | ‐28.38 [‐51.49, ‐5.26] |
| 3 Mean difference in total time spent sitting (including sitting at and outside work), follow‐up short‐term Show forest plot | 1 | Mean Difference (Fixed, 95% CI) | Subtotals only | |
| 3.1 Information and feedback versus no intervention | 1 | 37 | Mean Difference (Fixed, 95% CI) | ‐16.40 [‐96.85, 64.06] |
| 4 Mean difference in total time spent sitting (including sitting at and outside work), follow‐up medium term Show forest plot | 1 | Mean Difference (Fixed, 95% CI) | Subtotals only | |
| 4.1 Counselling versus no intervention | 1 | 416 | Mean Difference (Fixed, 95% CI) | ‐20.0 [‐85.00, 45.00] |
| 5 Mean difference in time spent standing at work follow‐up short‐term Show forest plot | 1 | Mean Difference (Fixed, 95% CI) | Subtotals only | |
| 5.1 Information and feedback | 1 | 93 | Mean Difference (Fixed, 95% CI) | 10.24 [‐17.17, 37.65] |
| 6 Work engagement (0‐6 scale), follow‐up medium‐term Show forest plot | 1 | Mean Difference (Fixed, 95% CI) | Subtotals only | |
| 6.1 Counseling versus no intervention | 1 | 224 | Mean Difference (Fixed, 95% CI) | 0.1 [‐0.10, 0.30] |
| Outcome or subgroup title | No. of studies | No. of participants | Statistical method | Effect size |
| 1 Mean difference in time spent sitting at work, follow‐up short term Show forest plot | 2 | 75 | Mean Difference (IV, Fixed, 95% CI) | ‐10.48 [‐44.88, 23.92] |
| 2 Mean difference in time spent sitting at work, follow‐up medium‐term Show forest plot | 1 | 34 | Mean Difference (Fixed, 95% CI) | ‐54.92 [‐95.82, ‐14.02] |
| 3 Mean difference in number of sitting bouts lasting 30 minutes or more, follow‐up short‐term Show forest plot | 1 | Mean Difference (Fixed, 95% CI) | Totals not selected | |
| 4 Mean difference in time in sitting bouts lasting 30 minutes or more, follow‐up short‐term Show forest plot | 1 | 28 | Mean Difference (Fixed, 95% CI) | ‐73.92 [‐123.78, ‐24.06] |
| 5 Mean difference in total time spent sitting (including sitting at and outside work), follow‐up short‐term Show forest plot | 1 | Mean Difference (Fixed, 95% CI) | Totals not selected | |
| 6 Mean difference in time spent standing at work follow‐up short‐term Show forest plot | 1 | Mean Difference (Fixed, 95% CI) | Totals not selected | |
| 7 Mean difference in energy expenditure, follow‐up medium‐term Show forest plot | 1 | Mean Difference (Fixed, 95% CI) | Totals not selected | |
| Outcome or subgroup title | No. of studies | No. of participants | Statistical method | Effect size |
| 1 Mean difference in time spent sitting at work, follow‐up short‐term Show forest plot | 1 | Mean Difference (IV, Fixed, 95% CI) | Totals not selected | |
| 2 Mean difference in number of sitting bouts lasting 30 minutes or more, follow‐up short‐term Show forest plot | 1 | Mean Difference (IV, Fixed, 95% CI) | Totals not selected | |
| 3 Mean difference in time spent standing at work, follow‐up short‐term Show forest plot | 1 | Mean Difference (IV, Fixed, 95% CI) | Totals not selected | |
| 4 Mean difference in time spent stepping at work, follow‐up short‐term Show forest plot | 1 | Mean Difference (IV, Fixed, 95% CI) | Totals not selected | |
| Outcome or subgroup title | No. of studies | No. of participants | Statistical method | Effect size |
| 1 Mean difference in time in sitting bouts lasting 30 minutes or more, follow‐up short‐term Show forest plot | 1 | Mean Difference (Fixed, 95% CI) | Totals not selected | |
| Outcome or subgroup title | No. of studies | No. of participants | Statistical method | Effect size |
| 1 Mean difference in time spent sitting at work, follow‐up medium‐term Show forest plot | 1 | 257 | Mean Difference (Fixed, 95% CI) | ‐22.69 [‐62.55, 17.17] |
| 2 Work engagement (0‐6 scale), follow‐up medium‐term Show forest plot | 1 | Mean Difference (Fixed, 95% CI) | Totals not selected | |
| Outcome or subgroup title | No. of studies | No. of participants | Statistical method | Effect size |
| 1 Mean difference in time spent sitting at work, follow‐up short‐term Show forest plot | 1 | Mean Difference (Fixed, 95% CI) | Totals not selected | |
| 2 Mean difference in time spent sitting at work, follow‐up medium‐term Show forest plot | 1 | Mean Difference (Fixed, 95% CI) | Totals not selected | |
| 3 Mean difference in time in sitting bouts lasting 30 minutes or more, follow‐up short‐term Show forest plot | 1 | Mean Difference (IV, Fixed, 95% CI) | Totals not selected | |
| 4 Mean difference in time in sitting bouts lasting 30 minutes or more, follow‐up medium‐term Show forest plot | 1 | Mean Difference (IV, Fixed, 95% CI) | Totals not selected | |
| 5 Mean difference in total time spent sitting (including sitting at and outside work), follow‐up short‐term Show forest plot | 1 | Mean Difference (IV, Fixed, 95% CI) | Totals not selected | |
| 6 Mean difference in total time spent sitting (including sitting at and outside work), follow‐up medium‐term Show forest plot | 1 | Mean Difference (IV, Fixed, 95% CI) | Totals not selected | |
| 7 Mean difference in time spent standing at work follow‐up short‐term Show forest plot | 1 | Mean Difference (Fixed, 95% CI) | Totals not selected | |
| 8 Mean difference in time spent stepping at work, follow‐up short‐term Show forest plot | 1 | Mean Difference (Fixed, 95% CI) | Totals not selected | |
| 9 Mean difference in time spent standing at work follow‐up medium‐term Show forest plot | 1 | Mean Difference (Fixed, 95% CI) | Totals not selected | |
| 10 Mean difference in time spent stepping at work, follow‐up medium‐term Show forest plot | 1 | Mean Difference (Fixed, 95% CI) | Totals not selected | |
| Outcome or subgroup title | No. of studies | No. of participants | Statistical method | Effect size |
| 1 Mean difference in time spent sitting at work, follow‐up short‐term Show forest plot | 3 | Mean Difference (IV, Fixed, 95% CI) | Totals not selected | |
| 2 Mean difference in time spent sitting at work, follow‐up medium‐term Show forest plot | 2 | 562 | Mean Difference (IV, Fixed, 95% CI) | ‐45.60 [‐62.54, ‐28.66] |
| 3 Mean difference in number of sitting bouts lasting 30 minutes or more, follow‐up short‐term Show forest plot | 1 | Mean Difference (Fixed, 95% CI) | Totals not selected | |
| 4 Mean difference in time in sitting bouts lasting 30 minutes or more, follow‐up short‐term Show forest plot | 2 | Mean Difference (Fixed, 95% CI) | Totals not selected | |
| 5 Mean difference in time in sitting bouts lasting 30 minutes or more, follow‐up medium‐term Show forest plot | 1 | Mean Difference (Fixed, 95% CI) | Totals not selected | |
| 6 Mean difference in total time spent sitting (including sitting at and outside work), follow‐up short‐term Show forest plot | 2 | 227 | Mean Difference (Fixed, 95% CI) | ‐72.73 [‐91.87, ‐53.59] |
| 7 Mean difference in total time spent sitting (including sitting at and outside work), follow‐up medium‐term Show forest plot | 1 | Mean Difference (IV, Fixed, 95% CI) | Totals not selected | |
| 8 Mean difference in time spent standing at work follow‐up short‐term Show forest plot | 2 | Mean Difference (IV, Fixed, 95% CI) | Totals not selected | |
| 9 Mean difference in time spent stepping at work follow‐up short‐term Show forest plot | 1 | Mean Difference (IV, Fixed, 95% CI) | Totals not selected | |
| 10 Mean difference in time spent standing at work follow‐up medium‐term Show forest plot | 1 | Mean Difference (IV, Fixed, 95% CI) | Totals not selected | |
| 11 Mean difference in time spent stepping at work follow‐up medium‐term Show forest plot | 1 | Mean Difference (IV, Fixed, 95% CI) | Totals not selected | |
| 12 Work engagement (0‐6 scale), follow‐up short‐term Show forest plot | 1 | Mean Difference (Fixed, 95% CI) | 0.0 [‐0.14, 0.14] | |
| 12.1 Environmental interventions only | 1 | Mean Difference (Fixed, 95% CI) | 0.1 [‐0.10, 0.30] | |
| 12.2 Environmental interventions + counselling | 1 | Mean Difference (Fixed, 95% CI) | ‐0.1 [‐0.30, 0.10] | |
| 13 Mean difference in musculoskeletal symptoms all sites (score 0–6) at short‐term follow‐up Show forest plot | 1 | Mean Difference (Fixed, 95% CI) | Totals not selected | |