Intervenciones para facilitar la toma de decisiones conjunta en cuanto al uso de antibióticos para las infecciones respiratorias agudas en la atención primaria
Información
- DOI:
- https://doi.org/10.1002/14651858.CD010907.pub2Copiar DOI

- Base de datos:
-
- Cochrane Database of Systematic Reviews
- Versión publicada:
-
- 11 noviembre 2015see what's new
- Tipo:
-
- Intervention
- Etapa:
-
- Review
- Grupo Editorial Cochrane:
-
Grupo Cochrane de Infecciones respiratorias agudas
- Copyright:
-
- Copyright © 2017 The Cochrane Collaboration. Published by John Wiley & Sons, Ltd.
Cifras del artículo
Altmetric:
Citado por:
Autores
Contributions of authors
Tammy Hoffmann (TH) conceived the original idea for the review.
Peter Coxeter (PC) was responsible for drafting the protocol.
TH and Chris Del Mar (CDM) contributed content and methodological expertise and provided advice and guidance on the development of the draft protocol and final editing.
Elaine Beller (EB) provided statistical advice and guidance.
Leanne McGregor conducted independent screening (titles/abstract and full text) and data extraction.
Sources of support
Internal sources
-
No sources of support supplied
External sources
-
National Health and Medical Research (NHMRC), Australia.
The Centre for Research Excellence in Minimising Antibiotic Resistance from Acute Respiratory Infections (CREMARA; NHMRC grant APP1044904).
Declarations of interest
Peter Coxeter: none declared
Chris B Del Mar: none declared
Leanne McGregor: none declared
Elaine M Beller: none declared
Tammy Hoffmann: none declared
Acknowledgements
Thanks to the staff and editors of the Cochrane Acute Respiratory Infections Group. We thank the following people for commenting on the draft protocol: Adrian Edwards, Sreekumaran Nair and Sandra Arnold, and Inge Axelsson. We also thank those people commenting on the draft of this review: Jenny Negus, Noorin Bhimani, Sandra Arnold, Helena Liirra, Teresa Neeman, Inge Axelsson and Susan Smith. Finally, we are grateful to Toby Lasserson for comments during pre‐publication screening (Cochrane Editorial Unit).
Version history
| Published | Title | Stage | Authors | Version |
| 2015 Nov 11 | Interventions to facilitate shared decision making to address antibiotic use for acute respiratory infections in primary care | Review | Peter Coxeter, Chris B Del Mar, Leanne McGregor, Elaine M Beller, Tammy C Hoffmann | |
| 2014 Jan 13 | Shared decision making for acute respiratory infections in primary care | Protocol | Peter Coxeter, Tammy Hoffmann, Chris B Del Mar | |
Keywords
MeSH
Medical Subject Headings (MeSH) Keywords
Medical Subject Headings Check Words
Humans;
PICO
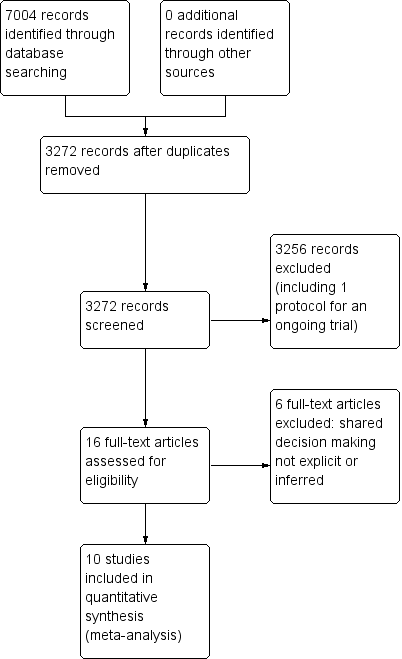
PRISMA study flow diagram.
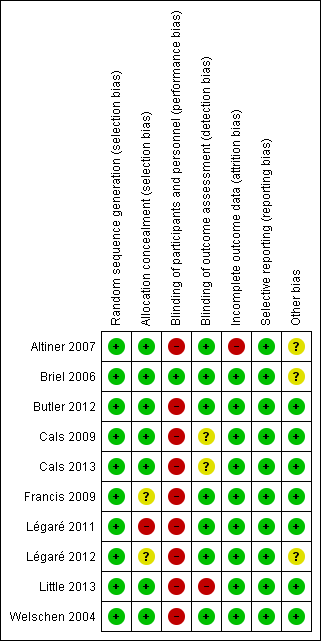
'Risk of bias' summary: review authors' judgements about each risk of bias item for each included study.
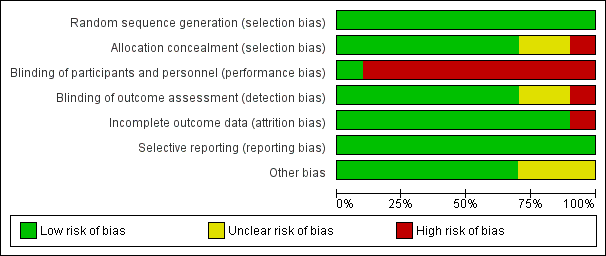
'Risk of bias' graph: review authors' judgements about each risk of bias item presented as percentages across all included studies.
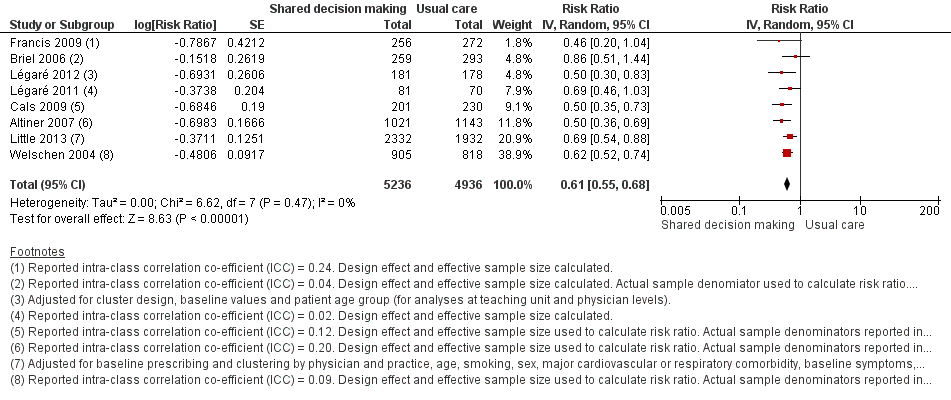
Forest plot of comparison: 1 Shared decision making versus usual care (control), outcome: 1.1 Antibiotics prescribed, dispensed or decision to use (short‐term, index consultation to ≤ 6 weeks).
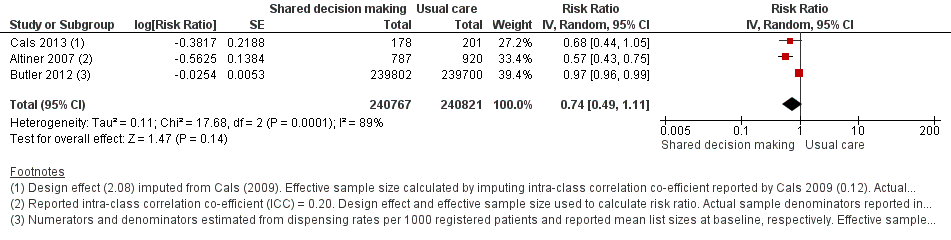
Forest plot of comparison: 1 Shared decision making versus usual care (control), outcome: 1.2 Antibiotics prescribed or dispensed (longer‐term, ≥ 12 months).
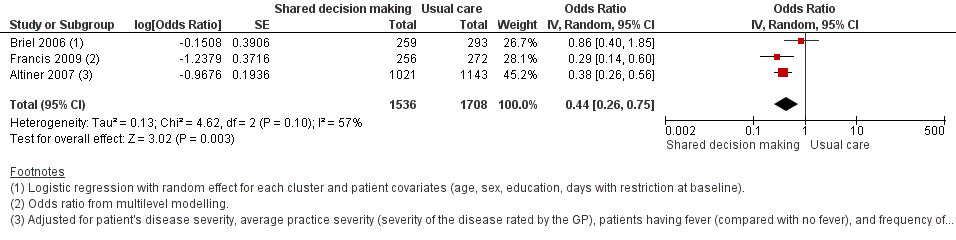
Forest plot of comparison: 1 Shared decision making versus usual care (control), outcome: 1.3 Antibiotic prescriptions (index consultation) (adjusted odds ratio).
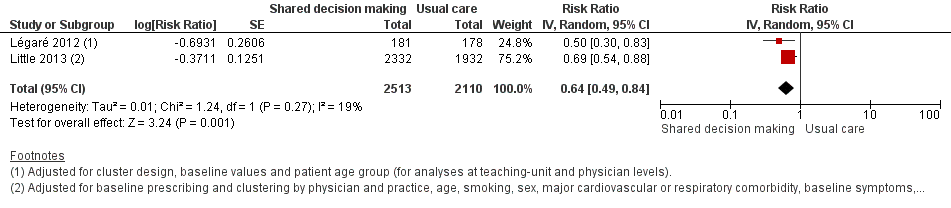
Forest plot of comparison: 1 Shared decision making versus usual care (control), outcome: 1.4 Antibiotic prescriptions (index consultation) (adjusted risk ratio).
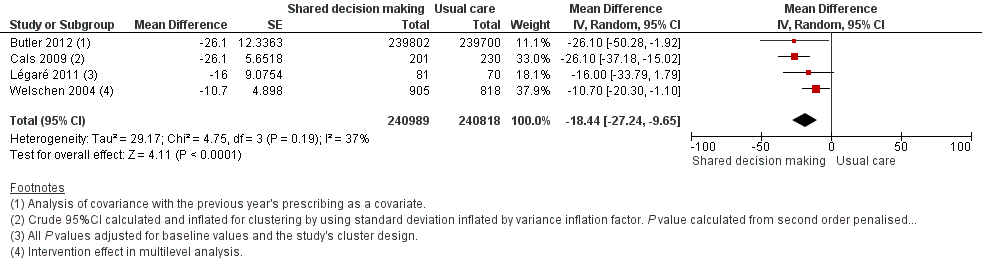
Forest plot of comparison: 1 Shared decision making versus usual care (control), outcome: 1.5 Antibiotic prescriptions (index consultation or population rate per unit of time) (adjusted risk difference).
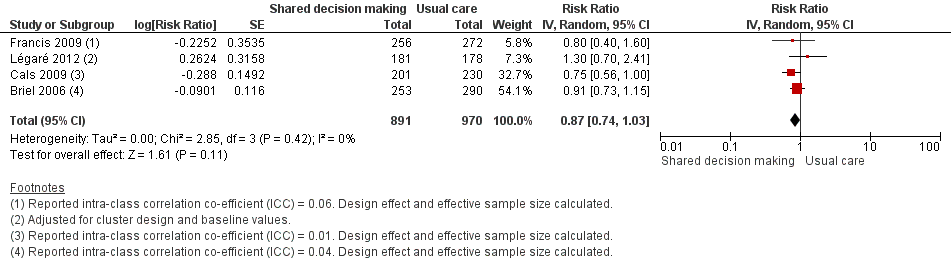
Forest plot of comparison: 1 Shared decision making versus usual care (control), outcome: 1.6 Number or rate of re‐consultations (risk ratio).
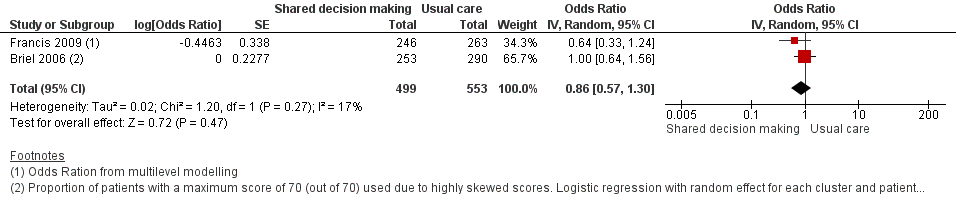
Forest plot of comparison: 1 Shared decision making versus usual care (control), outcome: 1.7 Patient satisfaction with the consultation.
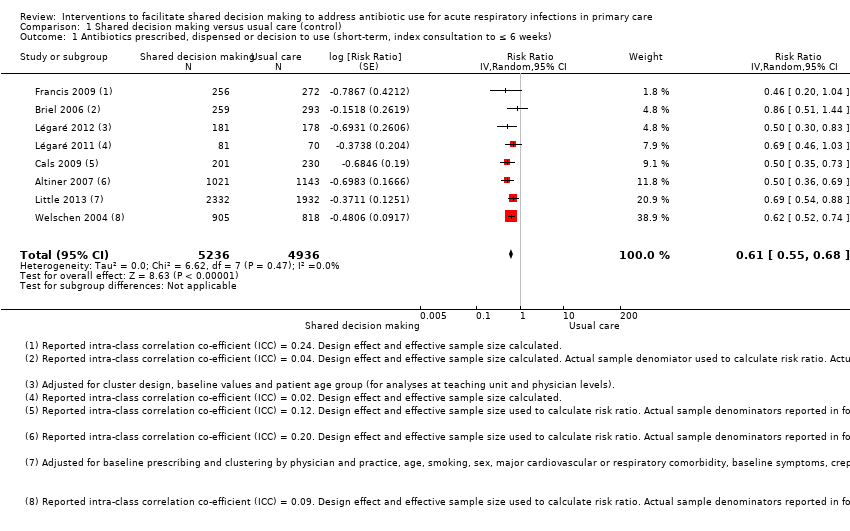
Comparison 1 Shared decision making versus usual care (control), Outcome 1 Antibiotics prescribed, dispensed or decision to use (short‐term, index consultation to ≤ 6 weeks).
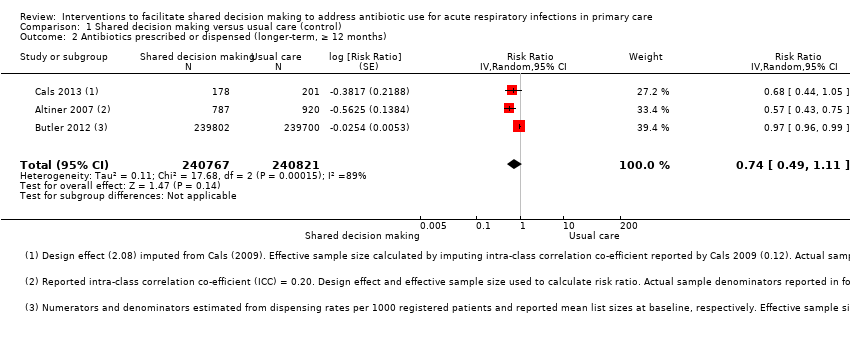
Comparison 1 Shared decision making versus usual care (control), Outcome 2 Antibiotics prescribed or dispensed (longer‐term, ≥ 12 months).
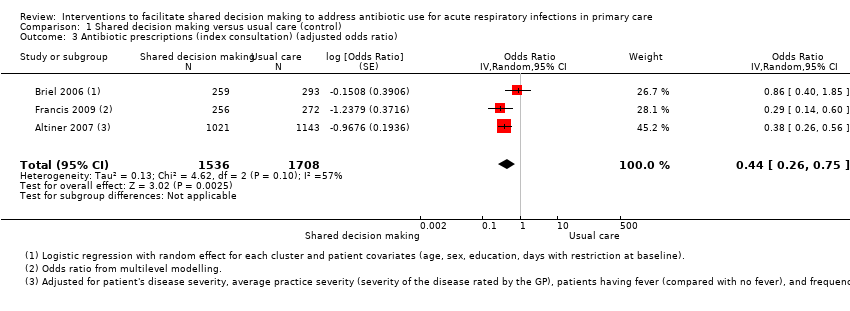
Comparison 1 Shared decision making versus usual care (control), Outcome 3 Antibiotic prescriptions (index consultation) (adjusted odds ratio).
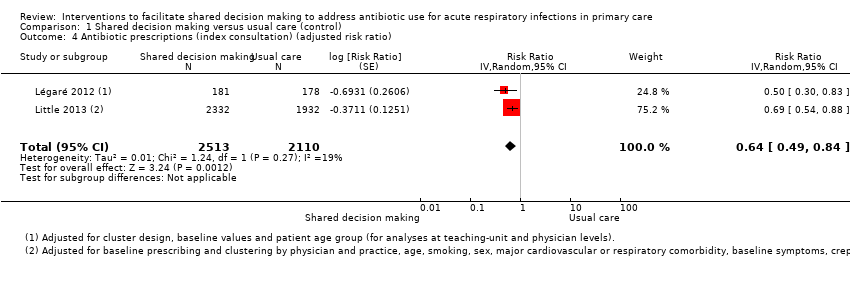
Comparison 1 Shared decision making versus usual care (control), Outcome 4 Antibiotic prescriptions (index consultation) (adjusted risk ratio).
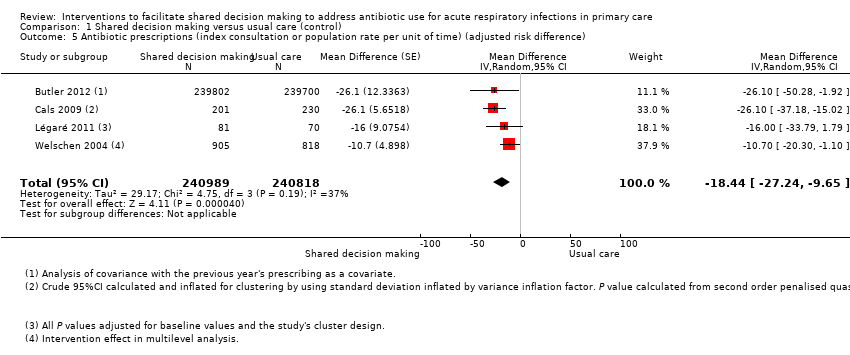
Comparison 1 Shared decision making versus usual care (control), Outcome 5 Antibiotic prescriptions (index consultation or population rate per unit of time) (adjusted risk difference).
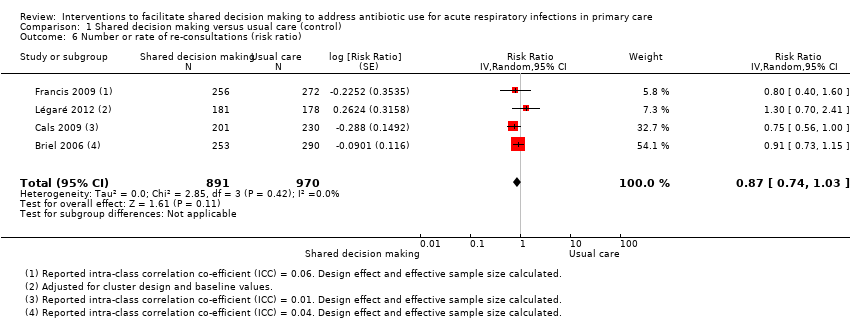
Comparison 1 Shared decision making versus usual care (control), Outcome 6 Number or rate of re‐consultations (risk ratio).

Comparison 1 Shared decision making versus usual care (control), Outcome 7 Patient satisfaction with the consultation.
| Shared decision making compared to usual care for acute respiratory infections in primary care | ||||||
| Patient or population: antibiotic use in acute respiratory infections | ||||||
| Outcomes | Anticipated absolute effects* (95% CI) | Relative effect | № of participants | Quality of the evidence | Comments | |
| Risk with usual care | Risk with Interventions to facilitate shared decision making | |||||
| Antibiotics prescribed or dispensed (6 weeks or less) | Moderate | RR 0.61 | 10172 | ⊕⊕⊕⊝ | ||
| 47 per 100 | 29 per 100 | |||||
| Antibiotics prescribed or dispensed (12 months or greater) | Moderate | RR 0.74 | 481588 | ⊕⊕⊝⊝ | ||
| 47 per 100 | 35 per 100 | |||||
| Patient initiated re‐consultations for the same illness episode | Moderate | RR 0.87 | 1861 | ⊕⊕⊕⊝ | ||
| 40 per 100 | 35 per 100 | |||||
| Patient satisfaction with the consultation | Moderate | OR 0.86 | 1052 | ⊕⊕⊝⊝ | ||
| 71 per 100 | 68 per 100 | |||||
| *The risk in the intervention group (and its 95% confidence interval) is based on the assumed risk in the comparison group and the relative effect of the intervention (and its 95% CI). | ||||||
| GRADE Working Group grades of evidence | ||||||
| 1 Downgraded one level because of risk of bias: participants in most studies were aware of whether they had received the intervention or not. 2 Downgraded one level because of imprecision: confidence interval includes reduction and possible increase in use of antibiotics. There was considerable heterogeneity in the rates of antibiotic prescribing during longer‐term follow‐up (12 months or greater). 3 Sample numbers in one trial, Butler 2012, were calculated from mean list size at baseline multiplied by the number of participating practices in each group (practice list sizes vary over time and no denominator data were available). 4 Downgraded one level due to imprecision: confidence interval includes both satisfaction and lack of satisfaction of patients with the consultation. | ||||||
| Author year | Brief name | Recipient | Why | What (materials) | What (procedures) | Who provided | How | Where | When and how much | Tailoring | Modification of intervention throughout trial | Strategies to improve or maintain intervention fidelity | Extent of intervention fidelity |
| Altiner 2007 | Complex GP peer‐led educational intervention | GPs and patients | Focused on communication within a consultation and the mutual discordance between patients' expectations and doctors' perceived patient expectations, empowering patients to raise the issue within the consultation. By 'informing' both sides in the consultation, it is hoped that doctors and patients would openly talk about the issue and thus reduce unnecessary antibiotic prescriptions | Peers used a semi‐structured dialogue script for outreach visits Patient materials (leaflet and poster) provided in waiting room primarily focused on the patients' role doctor‐patient 'antibiotic misunderstanding' and brief evidence‐based information on acute cough and antibiotics | GP peer‐led outreach visits. Peers were trained to explore GPs' 'opposite' motivational background to address their beliefs and attitudes. GPs were motivated to explore patient expectations and demands, to elicit anxieties and make antibiotic prescribing a subject in the consultation Patient materials were aimed at empowering patients to raise and clarify issues within the consultation | 5 practising GPs and teaching academics in the lead authors' department (2 female, 33 to 63 years of age); trained in 3 sessions for outreach visits | Face‐to‐face outreach visits to GPs | GP clinics during normal working hours | 1 outreach visit performed per GP (duration not specified) | Not described | Not described | Not described | 51/52 GPs received intervention |
| Briel 2006 | Brief training programme in patient‐centred communication | GPs | Focused on teaching GPs how to understand and modify patients' concepts and beliefs about the use of antibiotics for ARIs. GPs were introduced to a model (Prochaska 1992) for identifying patients' attitude and readiness for behaviour change | Evidence‐based guidelines for diagnosis and treatment of ARIs (updated, locally adapted and reviewed by local experts) distributed as a booklet [URL provided is no longer active] | GPs were trained in elements of active listening, to respond to emotional cues, and to tailor information given to patients. Physicians used a model were introduced to a model (Prochaska 1992) to identify patients' attitude and readiness for behaviour change | Not specified | Seminar in small groups (number not specified) and personal feedback by telephone prior to the start of the trial. Evidence‐based guidelines were distributed as a booklet | Not specified | Attendance at 1 x 6‐hour seminar and 1 x 2‐hour telephone call to give personal feedback prior to the trial start | Not described | Not described | Not described | Not described |
| Butler 2012 | Multifaceted flexible blended learning approach for clinicians | GPs and nurse practitioners | Blended learning experience to develop clinicians' sense of the importance about change and their confidence in their ability to achieve change based on Social Learning Theory Clinicians reflected on practice‐level antibiotic dispensing and resistance data, reflected on own clinical practice (context‐bound learning), and were trained in novel communication skills derived from principles of motivational interviewing | Summaries of research evidence and guidelines, web‐based modules using video‐rich material presenting novel communication skills, and a web‐based forum to share experiences and views (see for online component) | Intervention consist of 7 components: experiential learning, updated summaries of research evidence and guidelines; web‐based learning in novel communication skills; practising consulting skills in routine care; facilitator‐led practice‐based seminar on practice‐level data on antibiotic prescribing and resistance; reflections on own clinical practice, and a web‐based forum to share experiences and views | A facilitator conducted the face‐to‐face seminar | Intervention consisted of 7 parts (5 online modules, 1 face‐to‐face seminar and 1 facilitator‐led practice‐based seminar) | The face‐to‐face and facilitator‐led seminars were presented at the general practice | 7 components (5 online, 1 face‐to‐face and 1 facilitator‐led practice‐based seminar) A booster module (6 to 8 months after completion of initial training) reinforced these skills | Intervention was flexible so clinicians could access the online components and try out new skills with their patients at their convenience | Not described | Not described | 138/139 completed all online training and uploaded descriptions of consultations for the portfolio tasks; 129/139 attended the practice‐based seminars; 76/139 completed the optional booster session at 6 months; 11/139 entered new threads on the online forum with 81 posts and 1485 viewings of posts and threads |
| Cals 2009 | Enhanced communication skills training | GPs | Focused on information exchange based on the elicit‐provide‐elicit framework from counselling in behaviour change ‐ exploring patients' fears and expectations, patients' opinion on antibiotics and outlining the natural duration of cough in lower respiratory tract infections | Pre and post‐workshop transcripts of simulated patients | Brief context‐learning based workshop in small groups (5 to 8 GPs), preceded and followed by practice‐based consultations with simulated patients. GPs reflected on own transcripts of consultations with simulated patients, which were also peer‐reviewed by colleagues | Experienced moderator to lead seminars | Brief workshop (5 to 8 GPs), preceded and followed by practice‐based consultation with simulated patients | General practice | 1 x 2‐hour moderator‐led small groups workshop, preceded and followed by practice‐based consultation with simulated patients | Not described | Not described | Not described | 66% of patients recruited by GPs allocated to training in enhanced communication skills recalled their GP's use at least 3 of 4 specific communication skills compared with 19% in the no training group |
| Francis 2009 | Interactive booklet for parents and clinician training in its use | GPs and patients | Focused on specific communication skills, such as exploring parent's main concerns, asking about their expectations, and discussing prognosis, treatment options and reasons that should prompt re‐consultation | 8‐page booklet (now at ); online training in use of the booklet included videos to demonstrate use of the booklet within a consultation, as well as audio feeds, pictures and links to study materials [original URL no longer active] | Booklet given to parents to use in the consultation and as a take‐home resource (no further details provided) Online training on the use of the booklet was provided to GPs: describing the content and aims of the booklet, and encouraging use within the consultation to facilitate use of specific communication skills | N/A (online training) | Parents used the booklet face‐to‐face in the consultation with GPs and took it home; GP training in use of booklet was online | General practice; parents' homes | 1 x 40‐minute online training module | Not described | Not described | Online clinician training monitored through study website: whether a GP has logged on to the site, how much time spent on it and which pages were viewed | Stated that treatment fidelity was not measured so that assessors could remain blind to the study group |
| Légaré 2012 | Shared decision making training program (DECISION+2) | Family physicians (including teachers and residents) | A shared decision making training program that aimed to help physicians communicate to patients the probability of a bacterial ARI and the benefits and harms associated with the use of antibiotics | Online tutorial and workshop included videos, exercises and decision aids to help physicians communicate to their patients the probability of bacterial ARIs and benefits/harms of antibiotic use. Decision aids were available in the consultation rooms in all family practice teaching units | Online self tutorial comprising 5 modules 2‐hour online tutorial followed by a facilitator‐led on‐site interactive workshops aimed to help physicians review and integrate concepts acquired during online training | Trained facilitators | Online tutorial and face‐to‐face workshop | Family practice teaching units | 1 x 2‐hour online tutorial, followed by 1 x 2‐hour on‐site interactive workshop. Participants had 1 month to complete the programme | Not described | Not described | Not described | Of the 162 physicians, 103 completed both the online tutorial and workshop; 16 completed only the workshop; 15 only the tutorial; and 28 completed none of the training components |
| Légaré 2011 | Multiple‐component, continuing professional development program in shared decision making (DECISION+) | Family medicine groups (physicians and nurses) | Aimed to help family physicians communicate to patients the probability of bacterial ARI and benefits and harms of antibiotic use | Workshops included videos (simulated consultations of usual care and SDM) and exercises (facilitators and barriers to SDM). GPs trained in the use of 5 decision support tools using video examples and group exercises. A booklet summarising workshop content provided to participants. Postcard reminders sent | Interactive workshops and related material, reminders of expected behaviours and GP feedback on agreement between their decisional conflict and that of their patients | Trained facilitators | Face‐to‐face workshop | Family medicine groups | 3 x 3‐hour interactive workshops and related material, in addition to reminders of expected behaviours and GP feedback on agreement between their decisional conflict and that of their patients. DECISION+ conducted over 4 to 6 months | Not described | 4 pilot workshops held rather than 3 as the second workshop was redesigned and re‐piloted after feedback on its first testing | Not described | Not described |
| Little 2013 | Internet‐based training in enhanced communication skills | GPs | Rationale was that Internet‐based training can be more widely disseminated than face‐to‐face training. Training focused on eliciting patients' expectations and concerns, natural disease course, treatments, agreement on a management plan, summing up and guidance on when to re‐consult | Interactive booklet for use by GPs within consultations Training supported by video demonstrations of consultation techniques | Online modules and an interactive booklet for use within consultations. (Group practices also appointed a lead GP to organise a structured meeting on prescribing issues) | N/A (online modules) other than lead GP at each practice to organise a meeting (not specific to just this arm of the intervention though) | Online modules (and GP‐led structured practice‐based meeting) | General practice | Internet modules completed alone or in a group | Not described | Not described | Not described | 94/108 practices (87%) completed the communication training. Mean (SD) time spent on the website was 37 (29) minutes |
| Welschen 2004 | Group education meeting with consensus procedure and communication skills training | GPs/pharmacists and their assistants, and patients | GPs discussed evidence for antibiotic benefit/risk, and learned communication techniques to explore patients' expectations and concerns, inform about natural course of symptoms, self‐ medication and alarm symptoms. Patient education provided information on the self‐ limiting nature or ARIs, self‐medication and alarm symptoms requiring re‐consultation | Group consensus guidelines and patient waiting room materials (poster/leaflets) | Group education meeting with consensus procedure, with a summary, and guidelines mailed 1 month later to reinforce consensus reached; feedback on prescribing behaviour (post‐ and pre‐intervention insurance claims data) and practice‐level reporting of extent prescribing behaviours aligned with consensus reached; group education session for GP and pharmacists assistants (Dutch guidelines and skills training in patient education); waiting room education al material for patients | Jointly led by GP and pharmacist | Group education meeting for GPs with consensus procedure and communication skills training, Group education for GPs' and pharmacists' assistants, monitoring and feedback on prescribing behaviour, and patient education materials | Not described | 1 x group education meeting with consensus procedure; 1 x 2‐hour group education session for GP and pharmacists' assistants; monitoring and feedback of prescribing behaviour at 6 months post‐intervention | Not described | Not described | Not described | Not described |
| ARI: acute respiratory infection | |||||||||||||
| Author | Outcome | Measurement time point | Intervention (n) | Control | Effect estimate | P value | Notes |
| Adjusted odds ratio (95% CI) | |||||||
| Francis (2009) | Antibiotics prescribed at the index consultation | 14 days | (30 practices) Patients = 50/256 (19.5%) | (31 practices) | 0.29 (0.14 to 0.60)a | NR | ICC = 0.24 |
| Altiner (2007) | Rate of antibiotic prescriptions (per acute cough and per GP) | 6 weeks | GPs = 42 | GPs = 44 | 0.38 (0.26 to 0.56)b | < 0.001 | ICC=0.20 |
| 12 months | GPs = 28 | GPs = 33 | 0.55 (0.38 to 0.80)b | 0.002 | |||
| Briel (2006) | Uptake of antibiotic prescriptions as reported by pharmacists < 2 weeks after the consultation | 14 days | GPs = 15 | GPs = 15 | 0.86 (0.40 to 1.93)c | NR | ICC = 0.04 Design effect = 1.6 |
| Adjusted risk ratio (95% CI) | |||||||
| Little (2013) | Antibiotic prescription | index consultation | Practices = 61 | Practices = 61 | 0.69 (0.54 to 0.87)d | < 0.0001 | — |
| Légaré (2012) | % patients who decided to use antibiotics immediately after the consultation | Index consultation | Practice units = 6 | Practice units = 6 | 0.50 (0.30 to 0.70)e | — | — |
| Adjusted risk difference (95% CI) | |||||||
| Légaré (2011) | % patients who decided to use antibiotics immediately after the consultation | Index consultation | Medicine groups = 2 | Medicine groups | ‐16 (‐31 to 1)f | 0.08 | — |
| Butler (2012) | Total no. dispensed oral antibiotic items per 1000 registered patients for the year after the intervention | 12‐month period | Practices = 34 Patients = 7053 | Practices = 34 Patients = 7050 | ‐4.2 (‐0.6 to ‐7.7) | 0.02 | — |
| Cals (2009) | Antibiotic prescribing at the index consultation | Index consultation | n/N = 55/201 % crude (95% CI)G 27.4 (25.6 to 36.6) | n/N = 123/230 % crude (95% CI)g 53.5 (43.8 to 63.2) | ‐26.1 (% crude) | < 0.01h | ICC = 0.12 |
| Cals (2013) | Proportion of episodes of respiratory tract infections during follow‐up for which a GP was seen and that antibiotics were prescribed for | Mean 3.67 years follow‐up | n = 178 % (95% CI) 26.3 (20.6 to 32.0) | n = 201 % (95% CI) 39.1 (33.1 to 45.1) | ‐10.4i | 0.02i | — |
| Welschen (2006) | % practice encounters for acute symptoms of the respiratory tract for which antibiotics were prescribed | Index consultation | Review groups = 6 | Review groups = 6 | –10.7 (–20.3 to –1.0)j | — | Practice = 0.17 Review group = 0.09 |
| aTwo level (practice and patient) random intercept logistic regression models. CI: confidence interval | |||||||
| Author | Outcome | Measurement time point | Intervention | Control | Effect estimate | P value | Notes |
| Briel (2006) | Re‐consultations | Within 14 days | n/N (%) 113/253 (44.7) | n/N (%) 143/290 (49.3) | Adjusted rate ratio (95% CI)a 0.97 (0.78 to 1.21) | NR | — |
| Butler (2013) | Re‐consultations after index consultation)b | Within 7 days Within 14 days Within 31 days | Median (IQR) 2.66 (1.88 to 4.25) 5.10 (4.70 to 7.92) 9.06 (7.53 to 12.62) | Median (IQR) 3.35 (2.16 to 4.31) 6.43 (4.04 to 7.84) 11.38 (7.39 to 14.05) | Median difference (95% CI)c ‐0.65 (‐1.69 to 0.55) ‐1.33 (‐2.12 to 0.74) ‐2.32 (‐4.76 to 1.95) | P value = 0.446d P value = 0.411d P value = 0.503d | — |
| Cals (2009) | Re‐consultations | Within 28 days | n/N = 56/201 % crude (95% CI)e 27.9 (21.4 to 34.4) | n/N = 85/230 % crude (95% CI)e 37.0 (30.4, 43.6) | Absolute difference 9.1 (% crude) | 0.14f | ICC = 0.01 |
| Francis (2009) | Re‐consultationg | Within 14 days | n/N (%) 33/256 (12.9) | n/N (%) 44/272 (16.2) | Adjusted odds ratio (95% CI) 0.75 (0.41 to 1.38) | NR | ICC = 0.06 |
| Légaré (2012) | Re‐consultation | Baseline (pre) | 21.6 (12.1 to 29.7) | 22.7 (10.3 to 27.3) | Adjusted risk ratio (95% CI)h 1.3 (0.7 to 2.3) Absolute difference = 7.5 | NR | — |
| Within 14 days (post) | 13.4 (9.9 to 15.9) | 15.2 (11.9 to 19.4) | |||||
| Little (2013) | New or worsening symptomsi | — | n/N (%) 451/2242 (20%) | n/N (%) 309/1879 (16%) | Adjusted risk ratio (95% CI)j 1.33 (0.99 to 1.74) | P value = 0.055 | — |
| aPoisson regression with random effects for each cluster and patient covariates (age, sex, education, days with restrictions at baseline). CI: confidence interval ICC: intra‐class correlation co‐efficient | |||||||
| Author | Outcome | Measurement time point | Intervention | Control | Effect estimate | P value | Notes |
| Briel (2006) | Hospital admissions | < 28 days of study enrolment | n/N = 2/253 | n/N = 1/290 | NR | NR | — |
| Butler (2012) | Hospital admissionsa | Baseline Follow‐up | Mean 7.7 7.5 | Mean 8.7 8.0 | % reduction (intervention relative to controlsb (95% CI) ‐1.9 (‐13.2 to 8.2) | P value = 0.72 | — |
| Cals (2013) | Hospital admissions | Mean 3.67 year follow‐up | n/N 0/178 | n/N 5/201 | NR | NR | — |
| Francis (2009) | Hospital admissions (or observed in a paediatric assessment unit) | < 14 days | n/N 3/256 | n/N 4/272 | NR | NR | — |
| Little (2013) | Hospital admissionsc | < 4 weeks | n/N 6/1170 | n/N 2/870 | NR | — | — |
| aAnnual number of hospital episodes for possible respiratory tract infections and complications of common infections per 1000 registered patients. A single admission occurred if patient admitted to hospital for a possible RTI or complication. If patient admitted more than once, and gap between admissions was 30 days or more, this was considered a separate complication episode. bDifference between means in intervention group and control group as percentage of mean control group. cFactorial analysis data not reported NR: not reported | |||||||
| Author | Outcome | Measurement time point | Intervention | Control | Effect estimate | P value | Notes |
| Briel (2006) | Pneumonia | < 28 days | n/N = 0/253 | 1/290 | NR | NR | — |
| Cals (2013) | Pneumonia | Mean 3.67 year follow‐up | n/N = 0/178 | n/N = 1/201 | NR | NR | — |
| NR: not reported | |||||||
| Author | Outcome | Measurement time point | Intervention | Control | Effect estimate | P value | Notes |
| Briel (2006) | Patient satisfaction (Patient Satisfaction Questionnaire)a | 7 and 14 days | 121/253 (47.8) | 142/290 (49.0) | Adjusted OR (95% CI)b 1.00 (0.64 to 1.31) | NR | — |
| Cals (2009) | Patient satisfaction (% at least 'very satisfied' on Likert scale)c | 28 days | n/N = 144/201 % (crude 95% CI)d 78.7 (72.5 to 84.9) | n/N = 151/230 % (crude 95% CI)d 74.4 (68.2 to 80.6) | 4.3 | P value = 0.88e | — |
| Francis (2009) | Parent satisfaction (Likert scale)f | 14 days | n/N (%) = 222/246 (90.2) | n/N (%) = 246/263 (93.5) | Adjusted OR (95% CI)g 0.6 (0.3 to 1.2) | NR | — |
| Welschen (2006) | Patient satisfaction (Likert scale)h | Index consultation | Patient satisfaction (%) Baseline (pre) = 4.3 (0.3) Follow‐up (post) = 4.3 (0.3) % change (SD) = 0 (0.4) | Patient satisfaction (%) Baseline (pre) = 4.2 (0.4) Follow‐up (post) = 4.2 (0.3) % change (SD): 0 (0.4) | Mean difference of changes (95% CI) 0 (–0.2 to 0.1) i | NR | — |
| a% patients with a maximum score of 70 reported, as satisfaction scores (scale 14 to 70; median 68/70) were highly skewed. CI: confidence interval | |||||||
| Author | Outcome | Measurement time point | Intervention | Control | Effect estimate | P value | Notes |
| Légaré (2012) | Decisional conflict (GPs)a | Immediately after consultation | Baseline: 4.5 (0 to 9.0) Follow‐up: 4.6 (0 to 6.1) | Baseline: 3.0 (0 to 5.9) Follow‐up:1.1 (0 to 2.4) | Adjusted RR 3.4 (0.3 to 38.0) | NR | — |
| Légaré (2012) | Decisional conflict (patients)a | Immediately after consultation | Baseline: 5.1 (0 to 13.5) Follow‐up: 4.6 (2.6 to 7.4) | Baseline: 4.2 (0 to 8.9) Follow‐up: 6.3 (0 to 12.8) | Adjusted RR: 0.8 (0.2 to 2.4) | NR | — |
| Légaré (2011) | Correlation of decisional conflict between GPs and patientsa | Immediately after consultation | Baseline: 0.14 Follow‐up: 0.24 | Baseline: ‐0.05 Follow‐up: 0.02 | Difference at follow‐up (95% CI) 0.26 (‐0.06 to 0.53) | 0.06 | — |
| aProportion of participants who had a value of 2.5 or more on the Decision Conflict Scale (where 1 = low decisional conflict and 5 = very high decisional conflict). CI: confidence interval | |||||||
| Author | Outcome | Measurement time point | Intervention | Control | Effect estimate | P value | Notes |
| Légaré (2012) | Decisional regret a | 2 weeks after consultation | Baseline: 10.5 ± 15.4 Follow‐up: 12.4 ± 19.1 | Baseline: 10.8 ± 20.8 Follow‐up: 7.6 ± 13.7 | Adjusted mean difference 4.8 (0.9 to 8.7) | — | — |
| Légaré (2011) | Patients (%) with decisional regret | 2 weeks after consultation | Baseline: 1 Follow‐up: 7 | Baseline: 1 Follow‐up: 9 | Difference at follow‐up (95% CI) ‐2 (‐12 to 5) | 0.91 | — |
| a = Decisional Regret Scale used, where 0 = very low regret and 100 = very high regret CI: confidence interval | |||||||
| Author | Outcome | Measurement time point | Intervention | Control | Effect estimate | P value | Notes |
| Briel (2006) | Patient enablement (Patient Enablement Instrument; scale 0 to 12) | 7 and 14 days | Mean (SD): 8.49 (1.98) | Mean (SD): 8.15 (2.03) | Adjusted coefficient (95% CI)a 0.35 (‐0.05 to 0.75) | NR | — |
| Cals (2009) | Patient enablement (Patient Enablement Instrument; max score is 12) | 28 days | Median (IQR) score: 3 (4) Mean (SD) score: 3.29 (2.52) | Median (IQR) score: 3 (4)d Mean (SD) score: 3.06 (2.54) | — | NR 0.70b | — |
| Francis (2009) | Parent enablement (Modified Patient Enablement Instrument, scale 1 to 10)c | 14 days | n/N (%): 99/246 (40.2) | n/N (%): 94/262 (35.9) | Adjusted OR (95% CI) 1.20 (0.84 to 1.73) | NR | — |
| aLinear regression with random effects for each cluster and patient covariates (age, sex, education, days with restrictions at baseline). CI: confidence interval | |||||||
| Author | Outcome | Measurement time point | Intervention | Control | Effect estimate | P value | Notes |
| Légaré (2012) | Quality of decision made (GPs) (0 to 10 Likert scale) | After consultation | Baseline: 8.7 ± 1.5 Follow‐up: 8.5 ± 1.6 | Baseline: 8.7 ± 1.5 Follow‐up: 8.5 ± 1.5 | Adjusted mean difference 0.0 (‐0.4 to 0.4) | NR | — |
| Légaré (2011) | Quality of decision made (GPs) (0 to 10 Likert scale) | After consultation | Baseline: 8.8 ± 1.1 Follow‐up: 8.7 ± 1.2 | Baseline: 8.3 ± 1.4 Follow‐up: 8.5 ± 1.3 | Difference at follow‐up (95% CI) 0.2 (‐0.34 to 0.89) | 0.29 | — |
| CI: confidence interval | |||||||
| Author | Outcome | Measurement time point | Intervention | Control | Effect estimate | P value | Notes |
| Légaré (2012) | Quality of decision made (patients) (0 to 10 Likert scale) a | After consultation | Baseline: 8.2 ± 1.1 Follow‐up: 8.2 ± 1.3 | Baseline: 8.2 ± 1.4 Follow‐up: 8.4 ± 1.0 | Adjusted mean difference 0.2 (‐0.6 to 0.2) | NR | — |
| Légaré (2011) | Quality of the decision made (patients) (0 to 10 Likert scale) a | After consultation | Baseline: 8.2 ± 2.1 Follow‐up: 8.7 ± 1.9 | Baseline: 8.4 ± 1.9 Follow‐up: 8.6 ± 1.9 | Difference at follow‐up (95% CI) 0.1 (‐0.88 to 0.94) | 0.57 | — |
| aLikert scale where 0 = very low quality and 10 = very high quality. CI: confidence interval | |||||||
| Outcome or subgroup title | No. of studies | No. of participants | Statistical method | Effect size |
| 1 Antibiotics prescribed, dispensed or decision to use (short‐term, index consultation to ≤ 6 weeks) Show forest plot | 8 | 10172 | Risk Ratio (Random, 95% CI) | 0.61 [0.55, 0.68] |
| 2 Antibiotics prescribed or dispensed (longer‐term, ≥ 12 months) Show forest plot | 3 | 481588 | Risk Ratio (Random, 95% CI) | 0.74 [0.49, 1.11] |
| 3 Antibiotic prescriptions (index consultation) (adjusted odds ratio) Show forest plot | 3 | 3244 | Odds Ratio (Random, 95% CI) | 0.44 [0.26, 0.75] |
| 4 Antibiotic prescriptions (index consultation) (adjusted risk ratio) Show forest plot | 2 | 4623 | Risk Ratio (Random, 95% CI) | 0.64 [0.49, 0.84] |
| 5 Antibiotic prescriptions (index consultation or population rate per unit of time) (adjusted risk difference) Show forest plot | 4 | 481807 | Mean Difference (Random, 95% CI) | ‐18.44 [‐27.24, ‐9.65] |
| 6 Number or rate of re‐consultations (risk ratio) Show forest plot | 4 | 1861 | Risk Ratio (Random, 95% CI) | 0.87 [0.74, 1.03] |
| 7 Patient satisfaction with the consultation Show forest plot | 2 | 1052 | Odds Ratio (Random, 95% CI) | 0.86 [0.57, 1.30] |