Interventions visant à faciliter la prise de décision partagée par rapport à l'utilisation d'antibiotiques pour les infections respiratoires aiguës en soins primaires
Résumé scientifique
Contexte
La prise de décision partagée est une composante importante des soins centrés sur le patient. Il s'agit d'un ensemble de compétences de communication et de pratique basée sur les données probantes qui permettent de recueillir les attentes des patients, de clarifier les perceptions erronées et de discuter des meilleures données disponibles par rapport aux avantages et inconvénients du traitement. Les infections respiratoires aiguës (IRA) sont un des motifs les plus courants de consultation en soins primaires et de prescription d'antibiotiques. Cependant, les antibiotiques offrent peu d'effets bénéfiques pour les IRA, et leur utilisation excessive contribue à la résistance aux antibiotiques – une crise de santé publique en évolution. Une considération plus explicite du compromis entre les avantages et les inconvénients grâce à la prise de décision partagée pourrait réduire la prescription d'antibiotiques pour les IRA en soins primaires.
Objectifs
Évaluer si les interventions visant à faciliter la prise de décision partagée augmentent ou réduisent la prescription d'antibiotiques pour les IRA en soins primaires.
Stratégie de recherche documentaire
Nous avons effectué des recherches dans CENTRAL (2014, numéro 11), MEDLINE (de 1946 à la 3e semaine de novembre 2014), EMBASE (de 2010 à décembre 2014) et Web of Science (de 1985 à décembre 2014). Nous avons recherché d'autres études publiées, non publiées ou en cours en effectuant des recherches dans les bibliographies des articles publiés, en communiquant avec les principaux auteurs des études et experts en la matière, ainsi qu'en consultant les registres d'essais cliniques du National Institutes of Health et de l'Organisation mondiale de la Santé.
Critères de sélection
Essais contrôlés randomisés (ECR) (randomisation au niveau individuel ou en grappes), ayant évalué l'efficacité d'interventions visant à promouvoir la prise de décision partagée (en tant que composante principale ou secondaire de l'intervention) par rapport à la prescription d'antibiotiques pour les IRA en soins primaires.
Recueil et analyse des données
Deux auteurs de la revue ont indépendamment extrait et recueilli les données. L'issue primaire était la prescription d'antibiotiques, et les issues secondaires incluaient les effets cliniques indésirables importants (p. ex. les consultations répétées, les hospitalisations ou la mortalité) ainsi que les mesures de processus (p. ex. la satisfaction du patient). Nous avons évalué le risque de biais de tous les essais inclus ainsi que la qualité des données probantes. Nous avons contacté les auteurs des essais afin d'obtenir les informations manquantes lorsqu'elles étaient disponibles.
Résultats principaux
Nous avons identifié dix rapports publiés portant sur neuf ECR (un rapport était un suivi à long terme de l'essai original) incluant plus de 1100 médecins en soins primaires et environ 492 000 patients.
Pour la plupart des études, les principaux risques de biais provenaient des participants qui savaient s'ils avaient reçu ou non l'intervention, et nous avons rabaissé l'évaluation de la qualité des données probantes pour cette raison.
Nous avons effectué une méta‐analyse sur l'issue primaire et les issues secondaires principales à l'aide d'un modèle à effets aléatoires, et avons officiellement évalué l'hétérogénéité. Les autres résultats sont présentés sous forme narrative.
Il existe des données probantes de qualité modérée démontrant que les interventions visant à faciliter la prise de décision partagée réduisent l'utilisation des antibiotiques pour les IRA en soins primaires (immédiatement après ou dans les six semaines suivant la consultation) en comparaison avec les soins habituels, de 47 % à 29 % : risque relatif (RR) 0,61, intervalle de confiance (IC) à 95 % de 0,55 à 0,68. Une réduction de la prescription d'antibiotiques est survenue sans augmentation du nombre de consultations initiées par le patient (RR 0,87, IC à 95 % de 0,74 à 1,03, données probantes de qualité modérée) ou diminution de la satisfaction des patients par rapport à la consultation (RC 0,86, IC à 95 % de 0,57 à 1,30, données probantes de faible qualité). Les données étaient insuffisantes pour évaluer les effets de l'intervention sur la réduction durable de la prescription d'antibiotiques, les effets cliniques indésirables (tels que l'hospitalisation, l'incidence de pneumonie et la mortalité), ou les mesures de l'implication du patient et du proche aidant dans la prise de décision partagée (telles que la satisfaction par rapport à la consultation, le regret ou le conflit décisionnel, ou l'observance au traitement suite à la décision). Aucune étude n'a évalué la résistance aux antibiotiques des organismes colonisateurs ou infectieux.
Conclusions des auteurs
Les interventions visant à faciliter la prise de décision partagée réduisent la prescription d'antibiotiques dans les soins primaires à court terme. Les effets sur les taux de prescription à plus long terme sont incertains et des données supplémentaires sont nécessaires afin de déterminer comment toute réduction durable de la prescription d'antibiotiques affecte l'hospitalisation, la pneumonie et le décès.
PICO
Plain language summary
Interventions that facilitate shared decisions between primary care clinicians and patients about antibiotic use for acute respiratory infections
Review question
We wanted to see if shared decision making was better or worse than usual care in reducing antibiotic prescribing for an acute respiratory infection in primary care.
Background
Shared decision making enables health decisions to be made jointly by a clinician and patient. The decision making occurs after the options and their benefits and harms have been discussed together with the patient's values and preferences.
Acute respiratory infections (such as an acute cough, middle ear infection or sore throat) are one of the most common reasons to see a health professional, and antibiotics are commonly prescribed despite good evidence that they have little benefit for these conditions. Any decision to prescribe an antibiotic should be balanced by any benefits against the risk of common harms (such as rash and stomach upset) and the contribution to antibiotic resistance ‐ now a major threat to human health.
Shared decision making provides an ideal opportunity within a primary care consultation for greater consideration about the trade‐off between benefit and harm of antibiotics for acute respiratory illnesses. Antibiotic prescribing may decrease as a result.
Study characteristics
We identified 10 studies (nine trials and one follow‐up study) up to December 2014. In total, the studies involved over 1100 primary care doctors and around 492,000 patients. The intervention was different in each study. Six of the studies involved training clinicians (mostly primary care doctors) in communication skills that are needed to facilitate shared decision making. In three studies, as well as training doctors in these skills, patients were also given written information about antibiotics for acute respiratory infections. All included trials received funding from government sources. No studies declared a conflict of interest.
Key results
Interventions that aim to facilitate shared decision making significantly reduce antibiotic prescribing for acute respiratory infections in primary care, without a decrease in patients' satisfaction with the consultation, or an increase in repeat consultations for the same illness. There was not enough information to decide whether shared decision making affects other clinically adverse secondary outcomes, measures of clinician and patient involvement in sharing decision making, or antibiotic resistance.
Quality of the evidence
We rated the quality of the evidence as moderate or low for all outcomes.
Authors' conclusions
Summary of findings
| Shared decision making compared to usual care for acute respiratory infections in primary care | ||||||
| Patient or population: antibiotic use in acute respiratory infections | ||||||
| Outcomes | Anticipated absolute effects* (95% CI) | Relative effect | № of participants | Quality of the evidence | Comments | |
| Risk with usual care | Risk with Interventions to facilitate shared decision making | |||||
| Antibiotics prescribed or dispensed (6 weeks or less) | Moderate | RR 0.61 | 10172 | ⊕⊕⊕⊝ | ||
| 47 per 100 | 29 per 100 | |||||
| Antibiotics prescribed or dispensed (12 months or greater) | Moderate | RR 0.74 | 481588 | ⊕⊕⊝⊝ | ||
| 47 per 100 | 35 per 100 | |||||
| Patient initiated re‐consultations for the same illness episode | Moderate | RR 0.87 | 1861 | ⊕⊕⊕⊝ | ||
| 40 per 100 | 35 per 100 | |||||
| Patient satisfaction with the consultation | Moderate | OR 0.86 | 1052 | ⊕⊕⊝⊝ | ||
| 71 per 100 | 68 per 100 | |||||
| *The risk in the intervention group (and its 95% confidence interval) is based on the assumed risk in the comparison group and the relative effect of the intervention (and its 95% CI). | ||||||
| GRADE Working Group grades of evidence | ||||||
| 1 Downgraded one level because of risk of bias: participants in most studies were aware of whether they had received the intervention or not. 2 Downgraded one level because of imprecision: confidence interval includes reduction and possible increase in use of antibiotics. There was considerable heterogeneity in the rates of antibiotic prescribing during longer‐term follow‐up (12 months or greater). 3 Sample numbers in one trial, Butler 2012, were calculated from mean list size at baseline multiplied by the number of participating practices in each group (practice list sizes vary over time and no denominator data were available). 4 Downgraded one level due to imprecision: confidence interval includes both satisfaction and lack of satisfaction of patients with the consultation. | ||||||
Background
Description of the condition
Acute respiratory infections (ARIs) are one of the most common reasons for consulting in primary care. Antibiotics are often prescribed (Gill 2006; Gonzales 1997; Gonzales 2001), often unnecessarily as systematic reviews conclude that antibiotics have little benefit for reducing symptom duration or complications in acute otitis media (Venekamp 2015), sore throat (Spinks 2013), bronchitis (Smith 2014), and sinusitis (Ahovuo‐Saloranta 2014), and no benefit for laryngitis (Gonzales 2001) or colds (Kenealy 2013). The limited benefits of antibiotics for ARIs may be outweighed by unnecessary exposure to common adverse reactions (such as diarrhoea, candidiasis, rash, abdominal pain and/or diarrhoea and nausea and/or vomiting (Gillies 2015)), increased healthcare costs and contribution to antibiotic resistance (Chung 2007; Costelloe 2010).
Several doctor‐ and patient‐related factors influence clinicians' prescribing behaviour. They include: clinical uncertainty and fear of disease progression; inadequate physician knowledge (Altiner 2007); underestimates of the contribution of prescribing antibiotics to the development of resistance (Wood 2013); and perceived patient expectations for an antibiotic and the subsequent pressure felt to meet this expectation (Arroll 2002). Antibiotic prescribing for ARIs also creates a 'vicious cycle' through the medicalisation of otherwise uncomplicated and self limiting illnesses, encouraging patients to re‐consult with similar expectations for an antibiotic for similar illness episodes in the future (Butler 1998).
Antibiotic use exerts a selection pressure on bacteria to develop resistance (WHO 2012). Patients prescribed an antibiotic for respiratory tract infections develop measurable bacterial resistance in their commensal bacteria to that antibiotic for up to 12 months (Costelloe 2010). Although the development of individual resistance is transient, and decays after about a year in the absence of antibiotic use, it is sufficient to sustain high levels of population resistance (Chung 2007). Persistent prescribing of antibiotics, and excessive use of broad spectrum antibiotics in place of narrower spectrum ones, are modifiable factors that contribute to resistance (WHO 2012). Antibiotic resistance is now an evolving global threat to public health (WHO 2012). The rational use of antibiotics is therefore one of the most important strategies for preserving the therapeutic benefit of antibiotic treatment (WHO 2001; WHO 2012).
Description of the intervention
Shared decision making is the process of enabling a health professional and patient to make a joint treatment or management decision based on the best available evidence and the patient's values and preferences (Charles 1997; Makoul 2006). It consists of eliciting patients' expectations and clarifying any misperceptions, discussing treatment options, and communicating the benefits and harms of each option and their likelihood. Shared decision making supports the principle of patient autonomy and the right to self determination (Elwyn 2012), and has been shown to improve patients' satisfaction with decisions and concordance of decisions with their values (Spatz 2012). Some of the skills required of clinicians to facilitate shared decision making include proficient communication and rapport building skills as well as access to the best available evidence. It is one of the most important ways of bringing evidence to the point of clinical decisions and a potential strategy for reducing the overuse of ineffective treatments (Elwyn 2012).
How the intervention might work
The diagnostic uncertainty associated with ARIs and the trade‐off between the benefits and harms of antibiotics mean that shared decision making may provide an ideal opportunity for clinicians and their patients to choose appropriate treatment or management options, including the decision to not use an antibiotic (Butler 2001). By engaging the patient and clinician to explicitly discuss the benefits and harms of antibiotics against a background of evidence demonstrating that it is less effective than most patients expect, there is high potential for it to be effective. Many patients elect for conservative treatment options after participating in shared decision making (Elwyn 2012).
Why it is important to do this review
Concern about antibiotic resistance is now an international public health crisis (WHO 2012), and finding ways to minimise unnecessary antibiotic prescribing in primary care is imperative. Shared decision making may be an important process to achieve this.
Several related Cochrane systematic reviews have been undertaken. Arnold 2005 reviewed the effectiveness of interventions to improve antibiotic stewardship in outpatient care (including the decision to prescribe an antibiotic, and the type, dose and duration of antibiotic therapy). However, broad inclusion criteria and subsequent heterogeneity of the identified interventions limited the generalisability of practice recommendations. Importantly, this review also did not focus on, or explicitly consider, shared decision making interventions for inclusion.
The review by Stacey assessed the effectiveness of decision aids for people facing any treatment or screening decision (Stacey 2014). Decision aids are only one tool used to facilitate shared decision making in clinical care, and it may be enabled through methods other than, or in addition to, decision aids. Similarly, the review by Kinnersley evaluated the effect of interventions to encourage patient health communication and information seeking prior to the primary care consultation that shared some but not all components necessary for shared decision making to occur (Kinnersley 2007). Légaré 2014 assessed the effectiveness of interventions to facilitate clinicians' uptake of shared decision making but not the use or effect of shared decision making in a particular condition. The growing interest in shared decision making for potential improvement in treatment decisions and patient outcomes is evident from Cochrane systematic reviews in other clinically important areas including mental health (Duncan 2010) and paediatric oncology (Coyne 2013). If shared decision making is shown to reduce prescribing among primary care doctors, then steps can be taken to incorporate it into primary care consultations for ARI across many countries.
Objectives
To assess whether interventions that aim to facilitate shared decision making increase or reduce antibiotic prescribing for ARIs in primary care.
Methods
Criteria for considering studies for this review
Types of studies
Randomised controlled trials (RCTs) (individual level or cluster‐RCTs), which evaluated the effectiveness of shared decision making in reducing antibiotic prescribing in primary care. Quasi‐RCTs, quasi‐experimental studies (controlled clinical trials), controlled before and after studies and interrupted time series analyses were not eligible.
Types of participants
As interventions that aim to facilitate shared decision making may be directed at clinicians, patients, or both, participants eligible for this review could be:
-
clinicians who provide primary care (community practices, hospital‐affiliated or government‐run outpatient clinics); or
-
patients who present with any combination of symptoms of acute (less than four weeks' duration) respiratory infection (or the parents of similarly affected children).
Types of interventions
There is no one accepted definition of shared decision making (Makoul 2006); nor is there consensus on the core skills that shared decision making training should address (Légaré 2013). Therefore, we considered interventions eligible if the trial explicitly stated that the intervention was aimed at facilitating shared decision making or if the intervention explicitly addressed more than one of the essential elements of shared decision making that are described by Makoul 2006. These include: explaining the problem to be addressed; discussing options; communicating benefits and risks of each option; eliciting patient expectations, values, preferences or concerns; discussing patients' ability/self efficacy; and checking or clarifying understanding.
These elements may have been addressed by providing training in specific skills or providing decision support information or tools (such as decision aids (Stacey 2014), option grids (Elwyn 2013), or decision boxes (Giguere 2012)), which provide information about relevant issues (such as options, benefits, harms, questions to ask, etc). The skills training and information/tools could be provided to either clinicians, patients, or both. Interventions may have been delivered in any primary care environment and we imposed no restriction on the training and/or information mode, format or intensity of delivery.
We did not include interventions that consisted solely of the passive provision of patient information without the two‐way sharing of information necessary for shared decision making, or which aimed to enhance clinicians' and/or patients' general communication skills.
Types of outcome measures
Primary outcomes
-
Prescription of antibiotics (for example, antibiotics prescribed per consultation, or a change in the population rate of antibiotic prescriptions per unit of time).
Secondary outcomes
-
Number or rate of patient‐initiated re‐consultations for unresolved ARI (i.e. same illness episode).
-
Incidence of colonisation with, or infection due to, antibiotic‐resistant organisms.
-
Incidence of hospital admission.
-
Incidence of pneumonia (clinical with radiological confirmation).
-
Incidence of acute otitis media complications (for example, tympanic membrane perforation, contralateral otitis (in unilateral cases), mastoiditis, meningitis).
-
Mortality due to respiratory illness or similar.
-
All‐cause mortality.
-
Measures of patient and caregiver satisfaction.
-
Measures of patient and caregiver satisfaction with the decision reached, decisional conflict and decisional regret.
-
Measures of extent of patient involvement in the decision making process (for example, consultations analysed using tools such as the OPTION instrument; Elwyn 2003).
-
Measures of treatment compliance or adherence to decision reached.
Search methods for identification of studies
Electronic searches
We searched the Cochrane Central Register of Controlled Trials (CENTRAL 2014, Issue 11), which includes the Cochrane Acute Respiratory Infections Group's Specialised Register, MEDLINE (1946 to November week 3, 2014), EMBASE (2010 to December 2014) and Web of Science (1985 to December 2014).
We searched MEDLINE using the search terms described in Appendix 1. We combined the MEDLINE search with the Cochrane Highly Sensitive Search Strategy for identifying randomised trials in MEDLINE: sensitivity‐ and precision‐maximising version (2008 revision); Ovid format. We used the MEDLINE search strategy to search CENTRAL and adapted it to search EMBASE (Appendix 2) and Web of Science (Appendix 3). We imposed no language, publication date or publication status restrictions on the electronic database searches.
We searched the National Institutes of Health registry of clinical trials (www.clinicaltrials.gov) and the World Health Organization's (WHO) clinical trials registry (www.who.int/ictrp/en/) for completed and ongoing studies eligible for inclusion. We searched Web of Science and EMBASE to identify potentially relevant conference abstracts and proceedings.
Searching other resources
We searched the bibliographies of retrieved articles and published reviews for additional studies. We personally communicated with trial authors of significant publications and content experts (Professor Paul Little, Professor Christopher Butler and Professor France Légaré) to identify further published, unpublished or ongoing trials.
Data collection and analysis
Selection of studies
We merged search results into reference management software (Endnote X6) and removed duplicate references. Two review authors (PC, LM) independently screened the titles and abstracts of retrieved records. We attempted to identify multiple reports of single studies following the criteria recommended in the Cochrane Handbook for Systematic Reviews of Interventions (Higgins 2011). We retrieved full‐text copies of all potentially relevant articles for full‐text evaluation. The final list of eligible trials was confirmed following discussion and consensus among review authors (PC, TH, LM, CDM).
Data extraction and management
Two review authors (PC, LM) independently extracted data from each included trial using a specifically designed electronic data extraction form. We resolved disagreements by discussion and consensus, with one review author (CDM) acting as arbitrator where required. Data extraction was blind to names of authors, institutions and publication title. We extracted the following key study features where available:
-
Trial characteristics and methodological quality – risk of bias (see below); trial design, including unit of randomisation and number of comparator arms; blinding; generation of allocation sequence; allocation concealment; number of participants; theoretical or conceptual basis of the intervention; number of intervention components; description of intervention and comparator arms; length of follow‐up; sample size estimate (power calculation); number of patients randomised to each intervention arm; number of patients completing the trial; reasons for withdrawal; and intention‐to‐treat (ITT) or per protocol analysis.
-
Patient (and/or caregiver) characteristics ‐ age, gender and sociodemographic variables; types of ARI; duration of ARI prior to study recruitment; co‐morbidities.
-
Healthcare professional characteristics – age; gender; experience; primary care setting type.
-
Outcome measures – all primary and secondary outcomes.
Assessment of risk of bias in included studies
Two authors (PC, LM) independently assessed the risk of bias of included studies and two acted as arbitrators (TH, CDM). We assessed risk of bias using the 'Risk of bias' tool available in RevMan 2014 and the criteria explained in the Cochrane Handbook for Systematic Reviews of Interventions (Higgins 2011). We assessed the reliability of the sequence generation, allocation concealment, blinding (participants, personnel and outcome assessors), incomplete outcome data and selective outcome reporting bias, as well as other sources of bias. We ranked studies as high, low or unclear risk of bias as described in the Cochrane Handbook for Systematic Reviews of Interventions and present our assessments in a 'Risk of bias' summary figure (Higgins 2011). As all included studies were cluster‐RCTs, we assessed additional sources of bias including recruitment bias, baseline imbalance between clusters, loss of clusters and incorrect analysis (Higgins 2011).
Measures of treatment effect
Measures of treatment effect included dichotomous (binary), rate and continuous primary or secondary outcome data. Some studies calculated mean difference (MD) for continuous outcomes (median difference or median and interquartile range where data are not normally distributed) and for dichotomous outcomes, risk ratio (RR), odds ratio (OR) or rate ratio (RaR) were reported. In accordance with our protocol we have based the primary analysis on data reported as adjusted risk ratios. Additional analyses of the prescribing outcomes also present adjusted odds ratios and risk differences to incorporate additional information as analysed in the included studies.
Unit of analysis issues
Studies presented effect measures adjusted for clustering effects (at practice, provider and/or patient hierarchies) or potential confounders in multilevel analysis, and/or applied generalised linear mixed models or generalised estimating equations. Intraclass correlation coefficients were estimated in sample size calculations (Briel 2006; Cals 2009; Francis 2009; Légaré 2012; Little 2013; Welschen 2004), or reported (Briel 2006; Francis 2009), to account for clustering effects. Where intraclass correlation coefficients were not reported (Butler 2012; Cals 2013), we imputed them from another similar included study.
Dealing with missing data
The majority of studies performed ITT analyses (Briel 2006; Butler 2012; Cals 2009; Francis 2009; Légaré 2011; Little 2013; Welschen 2004). One study presented data only from practices with complete follow‐up (Altiner 2007). The long‐term follow‐up study of Cals 2009 included data only where medical records could be accessed for the follow‐up period (87.9% of original trial cohort) (Cals 2013). The principle of analysis was not stated in one study (Légaré 2012). Drop‐out rates and contributing reasons were sufficiently disclosed in all studies, and one study reporting relatively high attrition performed a sensitivity analysis to explore effects from differential missing values (Altiner 2007).
Assessment of heterogeneity
We used a random‐effects model for all meta‐analyses due the observed methodological diversity and used the I2 statistic to measure heterogeneity as recommended in the Cochrane Handbook for Systematic Reviews of Interventions (Higgins 2011).
Assessment of reporting biases
We minimised reporting bias by conducting a comprehensive search for studies that met the eligibility criteria, including grey literature and unpublished trials; and by contacting trials authors for missing information. There were insufficient studies to test for publication bias using a funnel plot.
Data synthesis
Meta‐analyses of studies were limited to studies reporting a comparable effect estimate. Therefore, the test for overall effect is limited to analysis in each subgroup. Studies reporting data that could not be combined for meta‐analysis are reported narratively. Forest plots were also not generated for data reported by a single study, or where the synthesis of available pilot data to the substantive study (for example, Légaré 2011) would not meaningfully increase the power or precision of observed effects. Similarly, meta‐analyses of secondary outcomes were limited to studies reporting comparable measures, those providing similar effect estimates, or where there were sufficient trials for comparison (such as patient satisfaction with the consultation). Caution is warranted for conclusions for each outcome due to the low numbers of trials for each comparison. We used RevMan 2014 to enter and analyse data to estimate a weighted treatment effect (with 95% confidence intervals (CIs). We analysed data using the random‐effects model due to the expected heterogeneity in combining diverse shared decision making interventions.
We created summary of findings Table for the main comparison using the following outcomes: antibiotic prescribing in the short term (less than six weeks), longer‐term antibiotic prescribing (12 months or longer), re‐consultation for the same illness episode and patient satisfaction with the consultation. We used the five GRADE considerations (study limitations, consistency of effect, imprecision, indirectness and publication bias) to assess the quality of evidence of the studies contributing data for meta‐analyses of prespecified outcomes (GRADE Working Group 2004). We used the methods and recommendations described in Section 8.5 and Chapter 12 of the Cochrane Handbook for Systematic Reviews of Interventions (Higgins 2011), using GRADEpro GDT software (GRADEproGDT 2015). We justified decisions to downgrade or upgrade the quality of studies using footnotes and comments to aid the reader's understanding of the review.
Subgroup analysis and investigation of heterogeneity
There were insufficient studies to conduct a subgroup analysis of trials that incorporate shared decision making as part of a multifaceted intervention compared with trials in which shared decision making was the standalone intervention. Subgroup analysis of interventions targeted at clinicians versus patients/parents was also not conducted due to a lack of studies. We did not conduct planned subgroup analyses of children versus adult trial populations, trials with low risk of bias versus high risk, and cluster‐RCTs versus individually randomised studies due to insufficient studies.
Sensitivity analysis
Insufficient studies prevented a planned sensitivity analysis excluding trials found to have a higher versus low risk of bias to examine the effect of trial quality on the magnitude and direction of effect.
Results
Description of studies
Results of the search
We retrieved a total of 3272 studies from the searches of the electronic databases after duplicates were removed. Two review authors (PC, LM) independently screened record titles and abstracts and, following consensus, 3256 records did not meet our inclusion criteria and were excluded. A recent published study protocol was identified and we contacted the lead author to confirm the study was ongoing and study results would not be available in time for this review (Altiner 2012). We retrieved full‐text reports of the remaining 16 records and two review authors (PC, LM) screened these independently. We excluded six studies after they did not meet the a priori eligibility criteria for shared decision making interventions. All review authors (PC, TH, LM, CDM) considered the provisional list of 10 studies for inclusion. We contacted trial authors of two of these studies for further elaboration on respective study interventions to determine that both were eligible for inclusion (Altiner 2007; Briel 2006). We included 10 published reports of nine original studies: one publication reports long‐term follow‐up outcome data of an earlier study (Cals 2013), and another published report, Légaré 2011, presents pilot data for relevant outcomes distinct from the subsequent substantive cluster‐RCT (Légaré 2012). See Figure 1.

PRISMA study flow diagram.
Included studies
Study design
Six studies used a two‐arm randomised group design: experimental versus control (usual care) (Altiner 2007; Butler 2012; Francis 2009; Légaré 2011; Légaré 2012; Welschen 2004). In one study the control group received the intervention after the experimental group had been exposed to the programme (Légaré 2011). Briel 2006 compared three arms: full intervention versus limited intervention versus non‐randomised controls that acted as distractors to the intention of the real comparison and were not analysed). Two studies compared four parallel study arms: intervention (a) versus intervention (b) versus intervention (a + b) versus control (Cals 2009; Little 2013). These two cluster‐RCTs incorporated a pre‐specified factorial analysis plan (Cals 2009; Little 2013). Trial data for interventions not relevant to the present review (such as C‐reactive protein point of care testing (Cals 2009; Little 2013), or costs (Butler 2012)) are not presented.
All nine original studies included were cluster‐RCTs. The unit of randomisation in studies was the general practitioner (GP) (Altiner 2007; Briel 2006), general practice (Butler 2012; Cals 2009; Francis 2009; Little 2013), GP peer review group (Welschen 2004), family practice teaching unit (Légaré 2012), and family medicine group (Légaré 2011).
All trials received funding. None disclosed conflicts of interest except Cals 2013 (one study author received travel/lecture funds from a point of care test device manufacturer being evaluated in the study, for which data were not relevant to this review). Ethical approval was documented in all studies.
Characteristics of settings and participants
The studies were conducted in Germany (Altiner 2007), Switzerland (Briel 2006), the Netherlands (Cals 2009; Cals 2013; Welschen 2004); England (Francis 2009), Wales (Butler 2012; Francis 2009), and Canada (Légaré 2011; Légaré 2012). One multinational trial was conducted across six European countries (Netherlands, Belgium, Spain, Poland, England and Wales) (Little 2013).
Recruitment of clinicians
Participating general practitioners (GPs) were recruited directly (Altiner 2007; Briel 2006), or through participating general practices (Butler 2012; Cals 2009; Francis 2009; Little 2013), peer review groups (Welschen 2004), family practice teaching units (Légaré 2012), or family medicine groups (Légaré 2011). The existing nationwide structure of GP peer review groups in the Netherlands comprise GPs and collaborating pharmacists that aim to promote rational prescribing through audit and feedback (Welschen 2004). UK general practices comprise GPs and nurse prescribers (Little 2013). GPs within Family Medicine Groups in Canada (Quebec) also work closely with nurses for care of registered individuals (Légaré 2011). Family Practice Teaching Units in Quebec include both physician teachers and residents (Légaré 2012).
Recruitment of patients
Specific ARI diagnoses and participant eligibility varied a little across studies. In several studies GPs recruited all patients (adults and children accompanied by a legal guardian) (Légaré 2011; Légaré 2012; Welschen 2004), or only adult patients (Briel 2006), consulting with symptoms of ARI. One study included adult patients presenting predominately with acute lower respiratory tract infections (LRTIs) and upper respiratory tract infections (URTIs) (Little 2013). Cals 2009 included adult patients only with suspected LRTI. Altiner 2007 restricted patient eligibility to patients over 16 years of age consulting for acute cough. Conversely, Butler 2012 included patients with any condition registered with participating practices. Francis 2009 included only children (six months to 14 years) and their parents consulting for a respiratory tract infection.
Study exclusion criteria also differed a little among studies. Asthma was an explicit exclusion criterion in two studies (Altiner 2007; Francis 2009), and was not reason for exclusion in another (Welschen 2004). Patients with chronic obstructive pulmonary disease (COPD) were ineligible in one study (Altiner 2007), although were eligible for inclusion in two trials (Briel 2006; Welschen 2004). The proportion of patients diagnosed with asthma/COPD ranged from ˜ 2% to ˜ 3.5% (Briel 2006; Welschen 2004) up to ˜ 18.5% (Little 2013). Patients with pneumonia were excluded from participation in one study (Briel 2006). However, they were eligible in two studies (Little 2013; Welschen 2004), and this was diagnosed in ˜ 3.5% of participants in Welschen 2004.
Characteristics of interventions and comparisons
Interventions
Included trials assessed various multi‐component interventions primarily aimed at facilitating clinicians shared management of decisions to reduce antibiotics for ARIs and their related symptoms in primary care.
The delivery of interventions occurred in usual clinical settings or central locations, and varied in intervention elements and scope and the frequency and duration (i.e. intensity) of sessions. All studies provided education and communication skills training that aimed to improve GPs' understanding of topics such as: the probability of bacterial or viral ARI; evidence for the benefit/risk of antibiotics and/or other treatment options; risk communication techniques; information exchange about symptoms and natural disease course; methods of eliciting patients' concerns and expectations; and agreement with the patient about a management plan and summing up. Communicative techniques used were derived from various theoretical models or frameworks.
Training in specific education and communication skills was delivered through peer‐ or facilitator‐led interactive workshops and seminars or via web‐based platforms, and supported with the use of videos, interactive exercises and decision aids or interactive booklets to facilitate patient participation in treatment decisions. Other programme components in some studies included consensus procedures, simulated patient consultations, personal reflection on clinical practice, reminders of expected behaviours and provision of antibiotic resistance trend data. Several interventions contained materials developed for patients, including education materials in waiting rooms (poster and leaflet), an interactive booklet for use within the consultation and as a take home resource, or decision support tool).
A summary of the main intervention components is described using the items from the Template for Intervention Description and Replication (TIDieR) checklist (Hoffmann 2014) (see Table 1).
| Author year | Brief name | Recipient | Why | What (materials) | What (procedures) | Who provided | How | Where | When and how much | Tailoring | Modification of intervention throughout trial | Strategies to improve or maintain intervention fidelity | Extent of intervention fidelity |
| Altiner 2007 | Complex GP peer‐led educational intervention | GPs and patients | Focused on communication within a consultation and the mutual discordance between patients' expectations and doctors' perceived patient expectations, empowering patients to raise the issue within the consultation. By 'informing' both sides in the consultation, it is hoped that doctors and patients would openly talk about the issue and thus reduce unnecessary antibiotic prescriptions | Peers used a semi‐structured dialogue script for outreach visits Patient materials (leaflet and poster) provided in waiting room primarily focused on the patients' role doctor‐patient 'antibiotic misunderstanding' and brief evidence‐based information on acute cough and antibiotics | GP peer‐led outreach visits. Peers were trained to explore GPs' 'opposite' motivational background to address their beliefs and attitudes. GPs were motivated to explore patient expectations and demands, to elicit anxieties and make antibiotic prescribing a subject in the consultation Patient materials were aimed at empowering patients to raise and clarify issues within the consultation | 5 practising GPs and teaching academics in the lead authors' department (2 female, 33 to 63 years of age); trained in 3 sessions for outreach visits | Face‐to‐face outreach visits to GPs | GP clinics during normal working hours | 1 outreach visit performed per GP (duration not specified) | Not described | Not described | Not described | 51/52 GPs received intervention |
| Briel 2006 | Brief training programme in patient‐centred communication | GPs | Focused on teaching GPs how to understand and modify patients' concepts and beliefs about the use of antibiotics for ARIs. GPs were introduced to a model (Prochaska 1992) for identifying patients' attitude and readiness for behaviour change | Evidence‐based guidelines for diagnosis and treatment of ARIs (updated, locally adapted and reviewed by local experts) distributed as a booklet [URL provided is no longer active] | GPs were trained in elements of active listening, to respond to emotional cues, and to tailor information given to patients. Physicians used a model were introduced to a model (Prochaska 1992) to identify patients' attitude and readiness for behaviour change | Not specified | Seminar in small groups (number not specified) and personal feedback by telephone prior to the start of the trial. Evidence‐based guidelines were distributed as a booklet | Not specified | Attendance at 1 x 6‐hour seminar and 1 x 2‐hour telephone call to give personal feedback prior to the trial start | Not described | Not described | Not described | Not described |
| Butler 2012 | Multifaceted flexible blended learning approach for clinicians | GPs and nurse practitioners | Blended learning experience to develop clinicians' sense of the importance about change and their confidence in their ability to achieve change based on Social Learning Theory Clinicians reflected on practice‐level antibiotic dispensing and resistance data, reflected on own clinical practice (context‐bound learning), and were trained in novel communication skills derived from principles of motivational interviewing | Summaries of research evidence and guidelines, web‐based modules using video‐rich material presenting novel communication skills, and a web‐based forum to share experiences and views (see for online component) | Intervention consist of 7 components: experiential learning, updated summaries of research evidence and guidelines; web‐based learning in novel communication skills; practising consulting skills in routine care; facilitator‐led practice‐based seminar on practice‐level data on antibiotic prescribing and resistance; reflections on own clinical practice, and a web‐based forum to share experiences and views | A facilitator conducted the face‐to‐face seminar | Intervention consisted of 7 parts (5 online modules, 1 face‐to‐face seminar and 1 facilitator‐led practice‐based seminar) | The face‐to‐face and facilitator‐led seminars were presented at the general practice | 7 components (5 online, 1 face‐to‐face and 1 facilitator‐led practice‐based seminar) A booster module (6 to 8 months after completion of initial training) reinforced these skills | Intervention was flexible so clinicians could access the online components and try out new skills with their patients at their convenience | Not described | Not described | 138/139 completed all online training and uploaded descriptions of consultations for the portfolio tasks; 129/139 attended the practice‐based seminars; 76/139 completed the optional booster session at 6 months; 11/139 entered new threads on the online forum with 81 posts and 1485 viewings of posts and threads |
| Cals 2009 | Enhanced communication skills training | GPs | Focused on information exchange based on the elicit‐provide‐elicit framework from counselling in behaviour change ‐ exploring patients' fears and expectations, patients' opinion on antibiotics and outlining the natural duration of cough in lower respiratory tract infections | Pre and post‐workshop transcripts of simulated patients | Brief context‐learning based workshop in small groups (5 to 8 GPs), preceded and followed by practice‐based consultations with simulated patients. GPs reflected on own transcripts of consultations with simulated patients, which were also peer‐reviewed by colleagues | Experienced moderator to lead seminars | Brief workshop (5 to 8 GPs), preceded and followed by practice‐based consultation with simulated patients | General practice | 1 x 2‐hour moderator‐led small groups workshop, preceded and followed by practice‐based consultation with simulated patients | Not described | Not described | Not described | 66% of patients recruited by GPs allocated to training in enhanced communication skills recalled their GP's use at least 3 of 4 specific communication skills compared with 19% in the no training group |
| Francis 2009 | Interactive booklet for parents and clinician training in its use | GPs and patients | Focused on specific communication skills, such as exploring parent's main concerns, asking about their expectations, and discussing prognosis, treatment options and reasons that should prompt re‐consultation | 8‐page booklet (now at ); online training in use of the booklet included videos to demonstrate use of the booklet within a consultation, as well as audio feeds, pictures and links to study materials [original URL no longer active] | Booklet given to parents to use in the consultation and as a take‐home resource (no further details provided) Online training on the use of the booklet was provided to GPs: describing the content and aims of the booklet, and encouraging use within the consultation to facilitate use of specific communication skills | N/A (online training) | Parents used the booklet face‐to‐face in the consultation with GPs and took it home; GP training in use of booklet was online | General practice; parents' homes | 1 x 40‐minute online training module | Not described | Not described | Online clinician training monitored through study website: whether a GP has logged on to the site, how much time spent on it and which pages were viewed | Stated that treatment fidelity was not measured so that assessors could remain blind to the study group |
| Légaré 2012 | Shared decision making training program (DECISION+2) | Family physicians (including teachers and residents) | A shared decision making training program that aimed to help physicians communicate to patients the probability of a bacterial ARI and the benefits and harms associated with the use of antibiotics | Online tutorial and workshop included videos, exercises and decision aids to help physicians communicate to their patients the probability of bacterial ARIs and benefits/harms of antibiotic use. Decision aids were available in the consultation rooms in all family practice teaching units | Online self tutorial comprising 5 modules 2‐hour online tutorial followed by a facilitator‐led on‐site interactive workshops aimed to help physicians review and integrate concepts acquired during online training | Trained facilitators | Online tutorial and face‐to‐face workshop | Family practice teaching units | 1 x 2‐hour online tutorial, followed by 1 x 2‐hour on‐site interactive workshop. Participants had 1 month to complete the programme | Not described | Not described | Not described | Of the 162 physicians, 103 completed both the online tutorial and workshop; 16 completed only the workshop; 15 only the tutorial; and 28 completed none of the training components |
| Légaré 2011 | Multiple‐component, continuing professional development program in shared decision making (DECISION+) | Family medicine groups (physicians and nurses) | Aimed to help family physicians communicate to patients the probability of bacterial ARI and benefits and harms of antibiotic use | Workshops included videos (simulated consultations of usual care and SDM) and exercises (facilitators and barriers to SDM). GPs trained in the use of 5 decision support tools using video examples and group exercises. A booklet summarising workshop content provided to participants. Postcard reminders sent | Interactive workshops and related material, reminders of expected behaviours and GP feedback on agreement between their decisional conflict and that of their patients | Trained facilitators | Face‐to‐face workshop | Family medicine groups | 3 x 3‐hour interactive workshops and related material, in addition to reminders of expected behaviours and GP feedback on agreement between their decisional conflict and that of their patients. DECISION+ conducted over 4 to 6 months | Not described | 4 pilot workshops held rather than 3 as the second workshop was redesigned and re‐piloted after feedback on its first testing | Not described | Not described |
| Little 2013 | Internet‐based training in enhanced communication skills | GPs | Rationale was that Internet‐based training can be more widely disseminated than face‐to‐face training. Training focused on eliciting patients' expectations and concerns, natural disease course, treatments, agreement on a management plan, summing up and guidance on when to re‐consult | Interactive booklet for use by GPs within consultations Training supported by video demonstrations of consultation techniques | Online modules and an interactive booklet for use within consultations. (Group practices also appointed a lead GP to organise a structured meeting on prescribing issues) | N/A (online modules) other than lead GP at each practice to organise a meeting (not specific to just this arm of the intervention though) | Online modules (and GP‐led structured practice‐based meeting) | General practice | Internet modules completed alone or in a group | Not described | Not described | Not described | 94/108 practices (87%) completed the communication training. Mean (SD) time spent on the website was 37 (29) minutes |
| Welschen 2004 | Group education meeting with consensus procedure and communication skills training | GPs/pharmacists and their assistants, and patients | GPs discussed evidence for antibiotic benefit/risk, and learned communication techniques to explore patients' expectations and concerns, inform about natural course of symptoms, self‐ medication and alarm symptoms. Patient education provided information on the self‐ limiting nature or ARIs, self‐medication and alarm symptoms requiring re‐consultation | Group consensus guidelines and patient waiting room materials (poster/leaflets) | Group education meeting with consensus procedure, with a summary, and guidelines mailed 1 month later to reinforce consensus reached; feedback on prescribing behaviour (post‐ and pre‐intervention insurance claims data) and practice‐level reporting of extent prescribing behaviours aligned with consensus reached; group education session for GP and pharmacists assistants (Dutch guidelines and skills training in patient education); waiting room education al material for patients | Jointly led by GP and pharmacist | Group education meeting for GPs with consensus procedure and communication skills training, Group education for GPs' and pharmacists' assistants, monitoring and feedback on prescribing behaviour, and patient education materials | Not described | 1 x group education meeting with consensus procedure; 1 x 2‐hour group education session for GP and pharmacists' assistants; monitoring and feedback of prescribing behaviour at 6 months post‐intervention | Not described | Not described | Not described | Not described |
ARI: acute respiratory infection
GP: general practitioner
N/A: not applicable
Comparators
In all trials the comparator was usual care, with the exception of Briel 2006 where GPs received training in a two‐hour seminar on evidence‐based US guidelines for ARIs.
Excluded studies
We excluded six studies as shared decision making was not explicit or inferred in the interventions evaluated (Characteristics of excluded studies).
Risk of bias in included studies
The methodological characteristics of the studies are reported in the Characteristics of included studies table. The 'Risk of bias' summary and 'Risk of bias' graph are presented in Figure 2 and Figure 3, respectively.
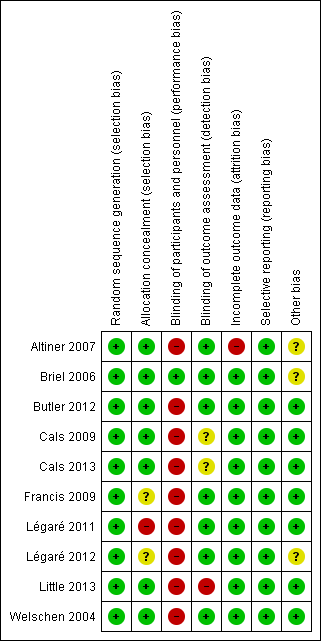
'Risk of bias' summary: review authors' judgements about each risk of bias item for each included study.
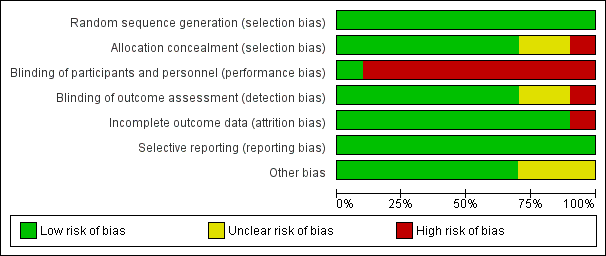
'Risk of bias' graph: review authors' judgements about each risk of bias item presented as percentages across all included studies.
Allocation
Methods of sequence generation comprised computer and/or program‐generated methods (Altiner 2007; Briel 2006; Francis 2009; Légaré 2011; Légaré 2012; Little 2013). Studies used stratification and minimisation techniques (Little 2013), or dynamic block allocation (Butler 2012; Francis 2009), to achieve balanced groups on selected variables.
Concealed allocation occurred in most trials, with GPs blinded to group allocation until after randomisation, although methods of doing so were not clearly described in several trials (Altiner 2007; Briel 2006; Cals 2009; Francis 2009; Little 2013; Welschen 2004). In Légaré 2012, the family practice units were recruited before randomisation, but it is not clear when physicians in the units were recruited/consented. In Légaré 2011, individual family physicians were recruited after randomisation of the family medicine groups.
Blinding
The nature of the interventions meant blinding of the clinicians delivering the intervention was not possible. Briel 2006 reported blinding of general practitioners although this is not credible. Blinding of outcome assessment was not reported in Little 2013, although it was adequately described in all other included studies.
Incomplete outcome data
One study had high risk of attrition bias. Altiner 2007 reported that 17% of GPs were lost to follow‐up at six weeks post‐intervention and 41% at 12 months. The study authors explored the effect of high attrition by conducting a cluster level sensitivity analysis by imputing new values for missing average antibiotic rates: firstly, by performing a regression analysis according to GPs with complete data sets to receive a prediction rule of six weeks and 12 months prescribing rates from baseline prescribing rates and, secondly, by using these rules to estimate follow‐up prescription rates for those physicians that dropped out of the study. Alternative estimates using last observations (baseline or six weeks) were similar, and the results of both sensitivity analyses were in line with reported results. Légaré 2012 reported that three of 12 randomised family practice teaching units were lost to follow‐up. The loss of clusters was noted as a study limitation, but no further analysis was performed. Neither of these studies reported conducting statistical analysis on an intention‐to‐treat (ITT) basis.
The risk of attrition bias was low in the remaining studies.
Selective reporting
Several studies reported prospective trial registration (Butler 2012; Cals 2009; Cals 2013; Francis 2009; Légaré 2012; Little 2013), and/or had published trial protocols (Butler 2012; Cals 2009; Francis 2009; Légaré 2011; Légaré 2012). We detected no reporting bias by comparing these to the final reports. Only Briel 2006 neither reported trial registration nor published a protocol.
Other potential sources of bias
We considered recruitment bias to be minimal in the included trials as the unit of allocation was recruited into the trial before clusters were randomised. Similarly, we considered baseline imbalances between study group characteristics minimal as all studies disclosed baseline comparability and adjusted for important baseline differences in the analysis. In two studies there was sufficient loss of clusters following randomisation that may have introduced bias (Altiner 2007; Légaré 2012). All studies sufficiently reported the use of robust statistical methods to account for clustering in the analysis.
All studies reported a sample size calculation with the exception of Légaré 2011, which was designed as a pilot trial. An ITT analysis was pre‐specified in all but two trials (Altiner 2007; Légaré 2012). Altiner 2007 included only practices with complete follow‐up in the analysis and the method of analysis was not described in Légaré 2012.
The methods, timing and duration of patient recruitment varied across studies. Recruitment in some trials was planned to capture winter and/or autumn months (Cals 2009; Francis 2009; Légaré 2012; Welschen 2004). In the long‐term follow‐up study, Cals 2013, of the original cluster‐RCT (Cals 2009), the end date of the follow‐up period was chosen to ensure a similar number of winter days in each period. Recruitment in the Little 2013 study occurred at the end of the season for respiratory tract infections in participating European countries (February and May). One trial included registered practice populations over an entire year (Butler 2012). The timing and duration of participant recruitment (e.g. during limited/winter months versus annual periods) may influence study outcomes and seasonal variation in the frequency and severity of ARIs may affect results.
The possibility of selection bias remains a possibility, although trial authors report that the risk of bias was minimal as baseline GP and patient characteristics were disclosed in all studies and no systematic differences between known group characteristics or case‐mix were observed. Altiner 2007 could not rule out that GPs, who were not monitored during the trial, may not have reported patients with acute cough who received an antibiotic. Participating GPs in Briel 2006 were considered highly motivated and several authors considered the possibility that GPs may have behaved differently while being monitored (Hawthorn effect) (Briel 2006; Francis 2009).
Intervention adherence was measured in only a few trials. Treatment fidelity was not measured in any of the included studies and sub‐optimal exposure or delivery of the intervention as planned may dilute the observed effect.
Effects of interventions
Primary outcome
1. Prescription of antibiotics
There were data from all 10 included studies on antibiotic prescribing decisions for acute respiratory infection. However, they could not all be combined into one meta‐analysis because of differences in adjusted effect estimates reported and outcome measurement time.
We extracted event and denominator data, and reported (or imputed) intra‐class correlation coefficients, to calculate the risk ratio (RR) adjusted for the effects of clustering (Analysis 1.1; Analysis 1.2) to allow presentation of outcome data within a common scale. This also allowed us to combine trials reporting short (index consultation to ≤ six weeks) and longer‐term (≥ 12 months) intervention effects on antibiotic prescribing. Eight studies reporting short‐term prescribing outcomes could be pooled in meta‐analysis: the RR compared to usual care was 0.61, 95% confidence interval (CI) 0.55 to 0.68; P value = < 0.001 (Figure 4). There was a trend towards a reduction in antibiotic prescribing being maintained in the longer term: RR compared with usual care 0.74, 95% CI 0.49 to 1.11; P value = 0.14 (Figure 5). However, the non‐significant results may be an artefact of the more conservative effect estimates using RR adjusted only for clustering.
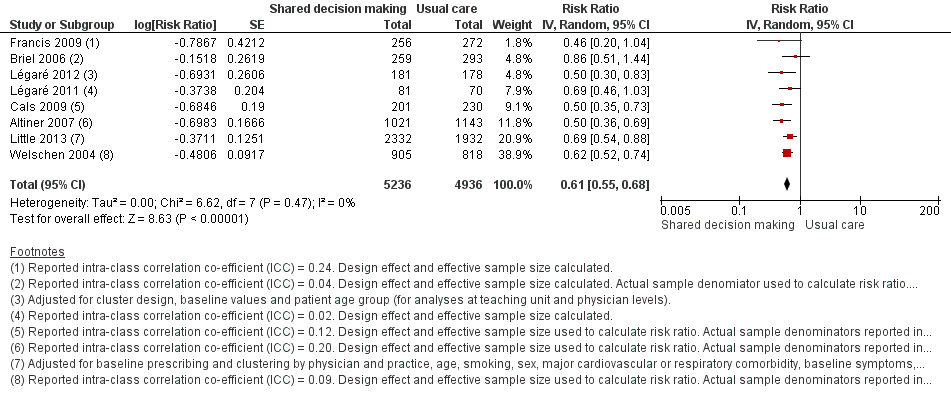
Forest plot of comparison: 1 Shared decision making versus usual care (control), outcome: 1.1 Antibiotics prescribed, dispensed or decision to use (short‐term, index consultation to ≤ 6 weeks).

Forest plot of comparison: 1 Shared decision making versus usual care (control), outcome: 1.2 Antibiotics prescribed or dispensed (longer‐term, ≥ 12 months).
We also conducted a sensitivity analysis by pooling the results of trials reporting similar adjusted effect estimates (see Analysis 1.3; Analysis 1.4; Analysis 1.5). Three studies reported antibiotic prescription as an odds ratio (OR) adjusted for clustering and other covariates, and we were able to meta‐analyse them: the pooled OR compared with usual care was 0.44, 95% CI 0.26 to 0.75; P value = 0.003 (Figure 6). Similarly a meta‐analysis of two studies reporting a RR adjusted for clustering yielded a pooled RR compared with usual care of 0.64, 95% CI 0.49 to 0.84; P value = 0.001 (Figure 7). A meta‐analysis of four studies reporting an adjusted risk difference (RD) yielded a pooled RD of ‐18.44%, 95% CI ‐27.24 to ‐9.65% compared with usual care (Figure 8). The results of the primary meta‐analysis (RR adjusted for clustering) are generally concordant with trials reporting comparable adjusted effect estimates, although not adjusting for covariates that may have differed slightly between randomised groups (which were adjusted for in the reports) results in some loss of precision and wider 95% CIs.
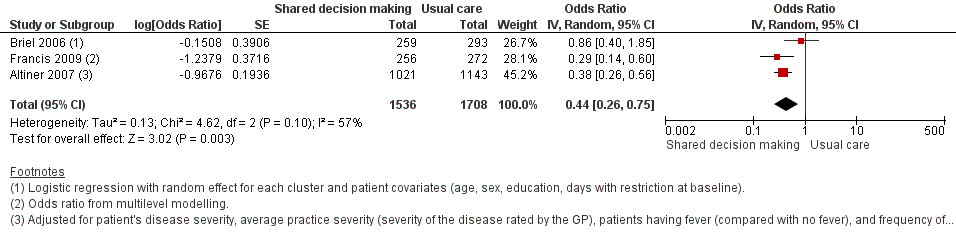
Forest plot of comparison: 1 Shared decision making versus usual care (control), outcome: 1.3 Antibiotic prescriptions (index consultation) (adjusted odds ratio).
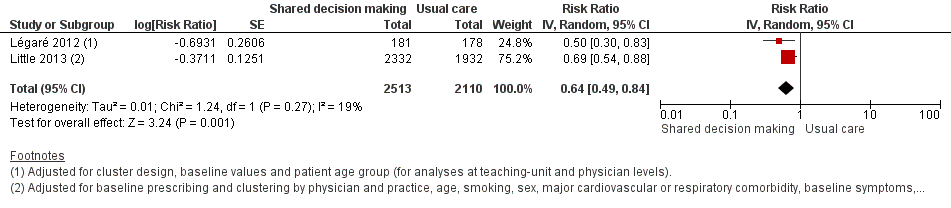
Forest plot of comparison: 1 Shared decision making versus usual care (control), outcome: 1.4 Antibiotic prescriptions (index consultation) (adjusted risk ratio).

Forest plot of comparison: 1 Shared decision making versus usual care (control), outcome: 1.5 Antibiotic prescriptions (index consultation or population rate per unit of time) (adjusted risk difference).
The absolute effect of the intervention for the outcome of antibiotics prescribed, dispensed, or decision to use, immediately after, or within six weeks, of the consultation was reduced from 47% to 29%.
Francis 2009 showed important reductions in antibiotics prescribed for children consulting for an ARI at the index consultation (intervention versus control: 19.5% versus 40.8%; adjusted OR 0.29; 95% CI 0.14 to 0.60. Francis 2009 was the only trial that also reported data on antibiotics taken (this was collected by telephone questionnaire). They reported the percentage of participants in each group that took antibiotics within the first two weeks (the data also include the antibiotics that were prescribed after the index consultation: 50 (19.5%) in the intervention group and 111 (40.8%) in the control group, with an adjusted OR of 0.35, 95% CI 0.18 to 0.66). A significant decrease in antibiotic prescriptions for acute cough was observed in Altiner 2007 at six weeks (adjusted OR 0.38, 95% CI 0.26 to 0.5; P value < 0.001) and 12 months (adjusted OR 0.55, 95% CI 0.38 to 0.80; P value = 0.002) post‐intervention. Conversely, Briel 2006 was the only trial that found no significant reduction in antibiotics dispensed within two weeks of the index consultation (full intervention versus limited intervention: 13.5% and 15.7%; adjusted OR 0.86, 95% CI 0.40 to 1.93). DECISION+2 led to fewer patients deciding to use antibiotics immediately after the consultation (immediate versus no or delayed antibiotic use) for ARIs compared with usual care (27.2% versus 52.2%; adjusted RR 0.5, 95% CI 0.3 to 0.7) (Légaré 2012). Little 2013 demonstrated that antibiotic prescribing for predominately acute lower respiratory tract infections (LRTIs) and upper respiratory tract infections (URTIs) was lower in the intervention group compared with controls (36.1% versus 45.3%; adjusted RR 0.69, 95% CI 0.54 to 0.87). Cals 2009 demonstrated a reduction in antibiotic prescribing for patients with suspected LRTI recruited during the winters of successive years (2005 to 2006 and 2006 to 2007) (intervention versus control: 27.4%, 95% CI 25.6% to 36.6% versus 53.5%; 95% CI 43.8 to 63.2; P value < 0.01). Butler 2012 measured a mean 4.2% (95% CI 0.6% to 7.7%; P value = 0.02) reduction (as a percentage of the mean in controls) in the total number of dispensed oral antibiotic items per 1000 registered patients for the year after the intervention practices were exposed to the STAR programme. A non‐significant reduction in the decision to immediately use antibiotics was also observed in the pilot trial by Légaré 2011 (‐16.0%; P value = 0.08). Welschen 2004 reported significantly reduced antibiotic prescribing rates for symptoms of ARIs (‐10.7%, 95% CI ‐20.3% to ‐1.0%). In a long‐term follow‐up of Cals 2009, enhanced communication skills training showed sustained reduction in antibiotic prescribing at 3.67 years mean follow‐up (intervention versus control: 26.3%, 95% CI 20.6% to 32.0 versus 39.1%, 95% CI 33.1% to 45.1%; corrected difference: ‐10.4%; P value = 0.02). See Table 2.
| Author | Outcome | Measurement time point | Intervention (n) | Control | Effect estimate | P value | Notes |
| Adjusted odds ratio (95% CI) | |||||||
| Francis (2009) | Antibiotics prescribed at the index consultation | 14 days | (30 practices) Patients = 50/256 (19.5%) | (31 practices) | 0.29 (0.14 to 0.60)a | NR | ICC = 0.24 |
| Altiner (2007) | Rate of antibiotic prescriptions (per acute cough and per GP) | 6 weeks | GPs = 42 | GPs = 44 | 0.38 (0.26 to 0.56)b | < 0.001 | ICC=0.20 |
| 12 months | GPs = 28 | GPs = 33 | 0.55 (0.38 to 0.80)b | 0.002 | |||
| Briel (2006) | Uptake of antibiotic prescriptions as reported by pharmacists < 2 weeks after the consultation | 14 days | GPs = 15 | GPs = 15 | 0.86 (0.40 to 1.93)c | NR | ICC = 0.04 Design effect = 1.6 |
| Adjusted risk ratio (95% CI) | |||||||
| Little (2013) | Antibiotic prescription | index consultation | Practices = 61 | Practices = 61 | 0.69 (0.54 to 0.87)d | < 0.0001 | — |
| Légaré (2012) | % patients who decided to use antibiotics immediately after the consultation | Index consultation | Practice units = 6 | Practice units = 6 | 0.50 (0.30 to 0.70)e | — | — |
| Adjusted risk difference (95% CI) | |||||||
| Légaré (2011) | % patients who decided to use antibiotics immediately after the consultation | Index consultation | Medicine groups = 2 | Medicine groups | ‐16 (‐31 to 1)f | 0.08 | — |
| Butler (2012) | Total no. dispensed oral antibiotic items per 1000 registered patients for the year after the intervention | 12‐month period | Practices = 34 Patients = 7053 | Practices = 34 Patients = 7050 | ‐4.2 (‐0.6 to ‐7.7) | 0.02 | — |
| Cals (2009) | Antibiotic prescribing at the index consultation | Index consultation | n/N = 55/201 % crude (95% CI)G 27.4 (25.6 to 36.6) | n/N = 123/230 % crude (95% CI)g 53.5 (43.8 to 63.2) | ‐26.1 (% crude) | < 0.01h | ICC = 0.12 |
| Cals (2013) | Proportion of episodes of respiratory tract infections during follow‐up for which a GP was seen and that antibiotics were prescribed for | Mean 3.67 years follow‐up | n = 178 % (95% CI) 26.3 (20.6 to 32.0) | n = 201 % (95% CI) 39.1 (33.1 to 45.1) | ‐10.4i | 0.02i | — |
| Welschen (2006) | % practice encounters for acute symptoms of the respiratory tract for which antibiotics were prescribed | Index consultation | Review groups = 6 | Review groups = 6 | –10.7 (–20.3 to –1.0)j | — | Practice = 0.17 Review group = 0.09 |
aTwo level (practice and patient) random intercept logistic regression models.
bAfter backward elimination, four explanatory variables remained in the model: patients' disease severity, measured on a four‐point scale (odds ratio 4.8, 95% CI 3.9 to 5.9 per step on scale, P value < 0.001), and average practice severity (severity of the disease rated by the GP) (odds ratio 0.14, 95% CI 0.06 to 0.33, P value < 0.001 per category step on the scale), patients having fever (odds ratio 1.80, 95% CI 1.35 to 2.39, P value < 0.001 compared with no fever) and frequency of fever in practice, as determined by the log odds (odds ratio 1.31, 95% CI 1.08 to 1.59, P value = 0.007 per category step on the scale).
cLogistic regression with random effects for each cluster and patient covariates (age, sex, education, days with restrictions at baseline).
dThe adjusted model adjusted for baseline prescribing and clustering by physician and practice, and additionally controlled for age, smoking, sex, major cardiovascular or respiratory comorbidity, baseline symptoms, crepitations, wheeze, pulse higher than 100 beats per minute, temperature higher than 37.8°C, respiratory rate, blood pressure, physician's rating of severity and duration of cough.
eAdjusted for cluster design, baseline values and patient age group (for analyses at teaching unit and physician levels).
fP value adjusted for baseline values and the study's cluster design.
gCalculated and inflated for clustering by using standard deviation inflated by variance inflation factor.
hCalculated from second order penalised quasi‐likelihood multilevel logistic regression model adjusted for variance at general practitioner and practice level (random intercept at practice and general practitioner level). Models included both interventions and interaction term of interventions.
iP values from multilevel linear regression model to account and correct for variation at the level of family physician, and to adjust for both interventions, RTI‐episodes treated with antibiotics during baseline period, chronic obstructive pulmonary disease comorbidity.
jIntervention effect in multi‐level analysis
CI: confidence interval
GP: general practitioner
NR: not reported
We graded the quality of evidence as moderate and low for antibiotic prescribing in the short term (less than six weeks) and long term (12 months or longer), respectively. See summary of findings Table for the main comparison.
Secondary outcomes
1. Number or rate of patient‐initiated re‐consultations for unresolved ARI
Six studies reported adjusted effect estimates that we could not combine in a meta‐analysis. We extracted data from four studies to calculate a RR adjusted for clustering, and pooled in meta‐analysis. The RR compared to usual care was 0.87, 95% CI 0.74 to 1.03; P value = 0.11 (Analysis 1.6; Figure 9).
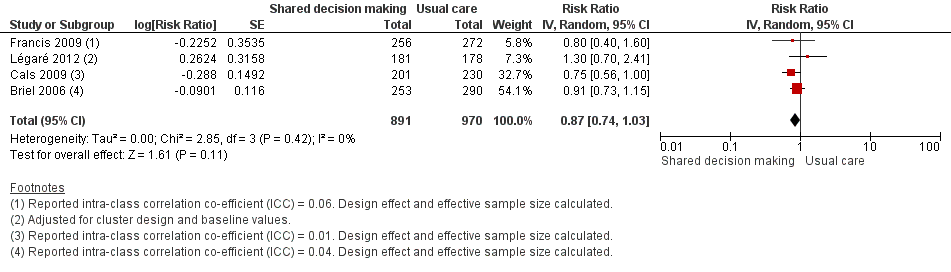
Forest plot of comparison: 1 Shared decision making versus usual care (control), outcome: 1.6 Number or rate of re‐consultations (risk ratio).
The proportion of re‐consultations for the same illness episode reported in Briel 2006 was 44.7% versus 49.3% (adjusted RR compared to controls 0.97, 95% CI 0.78 to 1.21). The between‐group consultation rates in Cals 2009 were 27.9% (95% CI 21.4 to 34.4) and 37.0% (95% CI 30.4 to 43.6); P value = 0.14. Légaré 2012 reported no differences between groups (22.7% versus 15.2%; absolute difference 7.5%; adjusted RR compared to controls 1.3, 95% CI 0.7 to 2.3). Francis 2009 also reported no difference in the odds of re‐consulting in primary care during the two weeks after the index consultation (12.9% versus 16.2%; adjusted OR 0.75 (0.41 to 1.38). Butler 2012 found no difference in median re‐consultation rates after an index consultation for respiratory tract infections per 1000 registered patients at seven days (‐0.65, 95% CI ‐1.69 to 0.55, P value = 0.446); 14 days (‐1.33, ‐2.12 to 0.74; P value = 0.411); or 31 days (‐2.32, 95% CI ‐4.76 to 1.95; P value = 0.503). Similarly, Little 2013 found the rates of new or worsening symptoms (including re‐consultation in less than four weeks or hospital admission) did not differ significantly between groups (adjusted RR compared to controls 1.33, 95% CI 0.99 to 1.74; P value = 0.055). See Table 3.
| Author | Outcome | Measurement time point | Intervention | Control | Effect estimate | P value | Notes |
| Briel (2006) | Re‐consultations | Within 14 days | n/N (%) 113/253 (44.7) | n/N (%) 143/290 (49.3) | Adjusted rate ratio (95% CI)a 0.97 (0.78 to 1.21) | NR | — |
| Butler (2013) | Re‐consultations after index consultation)b | Within 7 days Within 14 days Within 31 days | Median (IQR) 2.66 (1.88 to 4.25) 5.10 (4.70 to 7.92) 9.06 (7.53 to 12.62) | Median (IQR) 3.35 (2.16 to 4.31) 6.43 (4.04 to 7.84) 11.38 (7.39 to 14.05) | Median difference (95% CI)c ‐0.65 (‐1.69 to 0.55) ‐1.33 (‐2.12 to 0.74) ‐2.32 (‐4.76 to 1.95) | P value = 0.446d P value = 0.411d P value = 0.503d | — |
| Cals (2009) | Re‐consultations | Within 28 days | n/N = 56/201 % crude (95% CI)e 27.9 (21.4 to 34.4) | n/N = 85/230 % crude (95% CI)e 37.0 (30.4, 43.6) | Absolute difference 9.1 (% crude) | 0.14f | ICC = 0.01 |
| Francis (2009) | Re‐consultationg | Within 14 days | n/N (%) 33/256 (12.9) | n/N (%) 44/272 (16.2) | Adjusted odds ratio (95% CI) 0.75 (0.41 to 1.38) | NR | ICC = 0.06 |
| Légaré (2012) | Re‐consultation | Baseline (pre) | 21.6 (12.1 to 29.7) | 22.7 (10.3 to 27.3) | Adjusted risk ratio (95% CI)h 1.3 (0.7 to 2.3) Absolute difference = 7.5 | NR | — |
| Within 14 days (post) | 13.4 (9.9 to 15.9) | 15.2 (11.9 to 19.4) | |||||
| Little (2013) | New or worsening symptomsi | — | n/N (%) 451/2242 (20%) | n/N (%) 309/1879 (16%) | Adjusted risk ratio (95% CI)j 1.33 (0.99 to 1.74) | P value = 0.055 | — |
aPoisson regression with random effects for each cluster and patient covariates (age, sex, education, days with restrictions at baseline).
bCollected from the electronic records of a subsample of 37 general practices (20 intervention/17 control). 47 patients (10.9%) re‐consulted more than once within 28 days with pattern similar across groups.
cComputed with bootstrapping methods.
dFrom Mann‐Whitney U test.
eCalculated and inflated for clustering by using standard deviation inflated by variance inflation factor.
fCalculated from second order penalised quasi‐likelihood multilevel logistic regression model adjusted for variance at general practitioner and practice level (random intercept at practice and general practitioner level). Models included both interventions and interaction term of interventions.
gParental report that child attended a face‐to‐face consultation with a primary care clinician in their general practice, or with an out of hours provider, in the 2 weeks after registration.
hAdjusted for cluster design and baseline values.
iDefined as re‐consultation for new or worsening symptoms within 4 weeks, new signs or hospital admission.
jThe adjusted model adjusted for baseline prescribing and clustering by physician and practice, and additionally controlled for age, smoking, sex, major cardiovascular or respiratory comorbidity, baseline symptoms, crepitations, wheeze, pulse higher than 100 beats per minute, temperature higher than 37.8°C, respiratory rate, blood pressure, physician's rating of severity and duration of cough.
CI: confidence interval
ICC: intra‐class correlation co‐efficient
IQR: interquartile range
NR: not reported
We graded the quality of evidence as moderate. See summary of findings Table for the main comparison.
2. Incidence of colonisation with, or infection due to, antibiotic‐resistant organisms
No studies reported this outcome.
3. Incidence of hospital admission
Six trials reported serious adverse events (SAEs) requiring hospitalisation, although no significant differences between groups were observed. Butler 2012 reported a non‐significant difference in the proportion of hospital admissions for possible respiratory tract infections and complications relative to the control group (‐1.9%, 95% CI ‐13.2% to 8.2%; P value = 0.72). Briel 2006 reported that three patients were hospitalised (two patients in the full intervention group versus one in the limited intervention group). Six intervention and two usual care participants were hospitalised in Little 2013 (factorial analysis not reported). Francis 2009 reported seven hospitalisations (intervention = three, control = four). There were no occurrences of SAEs (death or admission to hospital) in Cals 2009. Cals 2013 reported five hospital admissions of 379 study participants: two patients receiving usual care (four exacerbations of chronic obstructive pulmonary disease (COPD) and one case of pneumonia), one randomised to C‐reactive protein testing, and two episodes (pneumonia) in the combined intervention group (factorial analysis data not reported). See Table 4.
| Author | Outcome | Measurement time point | Intervention | Control | Effect estimate | P value | Notes |
| Briel (2006) | Hospital admissions | < 28 days of study enrolment | n/N = 2/253 | n/N = 1/290 | NR | NR | — |
| Butler (2012) | Hospital admissionsa | Baseline Follow‐up | Mean 7.7 7.5 | Mean 8.7 8.0 | % reduction (intervention relative to controlsb (95% CI) ‐1.9 (‐13.2 to 8.2) | P value = 0.72 | — |
| Cals (2013) | Hospital admissions | Mean 3.67 year follow‐up | n/N 0/178 | n/N 5/201 | NR | NR | — |
| Francis (2009) | Hospital admissions (or observed in a paediatric assessment unit) | < 14 days | n/N 3/256 | n/N 4/272 | NR | NR | — |
| Little (2013) | Hospital admissionsc | < 4 weeks | n/N 6/1170 | n/N 2/870 | NR | — | — |
aAnnual number of hospital episodes for possible respiratory tract infections and complications of common infections per 1000 registered patients. A single admission occurred if patient admitted to hospital for a possible RTI or complication. If patient admitted more than once, and gap between admissions was 30 days or more, this was considered a separate complication episode.
bDifference between means in intervention group and control group as percentage of mean control group.
cFactorial analysis data not reported
NR: not reported
RTI: respiratory tract infection
SAEs: serious adverse events
4. Incidence of pneumonia
Two studies reported on the incidence of pneumonia. Briel 2006 reported one case of pneumonia in the control group, and Cals 2013 reported two cases of pneumonia in patients receiving a combined intervention (factorial analysis data not reported) and two cases of pneumonia in those receiving usual care. See Table 5.
| Author | Outcome | Measurement time point | Intervention | Control | Effect estimate | P value | Notes |
| Briel (2006) | Pneumonia | < 28 days | n/N = 0/253 | 1/290 | NR | NR | — |
| Cals (2013) | Pneumonia | Mean 3.67 year follow‐up | n/N = 0/178 | n/N = 1/201 | NR | NR | — |
NR: not reported
5. Incidence of acute otitis media complications
No studies reported on this outcome.
6. Mortality due to respiratory illness or similar
One study, Briel 2006, reported a fatal myocardial infarction following pneumonia in an elderly patient receiving a limited (control) intervention.
7. All‐cause mortality
No studies reported on this outcome.
8. Measures of patient and caregiver satisfaction
The results from two studies could be pooled, giving an OR compared to controls of 0.86, 95% CI 0.57 to 1.30; P value = 0.47 (Analysis 1.7; Figure 10).
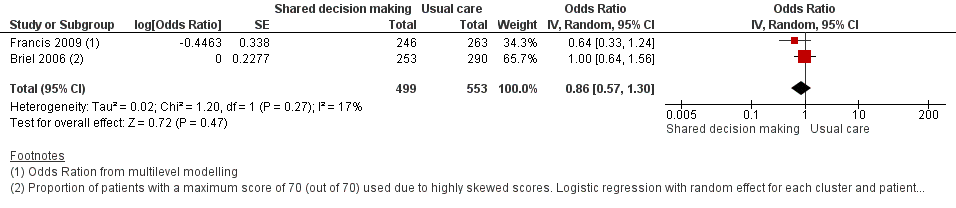
Forest plot of comparison: 1 Shared decision making versus usual care (control), outcome: 1.7 Patient satisfaction with the consultation.
There were no differences observed between intervention and control groups in studies that reported this outcome. Briel 2006 found no difference in scores for patient satisfaction (Patient Satisfaction Questionnaire; score 0 to 70) between intervention and control groups (median 68 out of 70; % patients with 70 out of 70: 47.8% versus 49.0%; adjusted OR 1.00; 95% CI 0.64 to 1.31). Cals 2009 reported no differences in patient satisfaction with the index consultation (% at least very satisfied: 78.7%, 95% CI 72.5 to 84.9 versus 74.4%, 95% CI 68.2 to 80.6; P value = 0.88). In Francis 2009, the proportion of parents that were reported to be satisfied or very satisfied with the consultation were similar between groups (90.2% versus 93.5%; adjusted OR 0.64, 95% CI 0.33 to 1.22). Patient satisfaction (one = very dissatisfied, five = very satisfied) was also high and no between‐group differences were observed in Welschen 2004 (adjusted mean difference (MD) ‐0.03, 95% CI ‐0.2 to 0.1). See Table 6.
| Author | Outcome | Measurement time point | Intervention | Control | Effect estimate | P value | Notes |
| Briel (2006) | Patient satisfaction (Patient Satisfaction Questionnaire)a | 7 and 14 days | 121/253 (47.8) | 142/290 (49.0) | Adjusted OR (95% CI)b 1.00 (0.64 to 1.31) | NR | — |
| Cals (2009) | Patient satisfaction (% at least 'very satisfied' on Likert scale)c | 28 days | n/N = 144/201 % (crude 95% CI)d 78.7 (72.5 to 84.9) | n/N = 151/230 % (crude 95% CI)d 74.4 (68.2 to 80.6) | 4.3 | P value = 0.88e | — |
| Francis (2009) | Parent satisfaction (Likert scale)f | 14 days | n/N (%) = 222/246 (90.2) | n/N (%) = 246/263 (93.5) | Adjusted OR (95% CI)g 0.6 (0.3 to 1.2) | NR | — |
| Welschen (2006) | Patient satisfaction (Likert scale)h | Index consultation | Patient satisfaction (%) Baseline (pre) = 4.3 (0.3) Follow‐up (post) = 4.3 (0.3) % change (SD) = 0 (0.4) | Patient satisfaction (%) Baseline (pre) = 4.2 (0.4) Follow‐up (post) = 4.2 (0.3) % change (SD): 0 (0.4) | Mean difference of changes (95% CI) 0 (–0.2 to 0.1) i | NR | — |
a% patients with a maximum score of 70 reported, as satisfaction scores (scale 14 to 70; median 68/70) were highly skewed.
bLogistic regression with random effects for each cluster and patient covariates (age, sex, education, days with restrictions at baseline).
c% at least 'very satisfied'.
dCalculated and inflated for clustering by using standard deviation inflated by variance inflation factor.
eCalculated from models adjusted for variance at general practitioner and practice level.
fTransformed into binary outcomes: 'very satisfied' and 'satisfied' versus 'neutral', 'dissatisfied' and 'very dissatisfied'.
gOdds ratio (95% CI) from multilevel modelling.
h1 = very dissatisfied to 5 = very satisfied.
iIntervention effect in multilevel analysis.
CI: confidence interval
OR: odds ratio
SD: standard deviation
We graded the quality of evidence as low. See summary of findings Table for the main comparison.
9. Measures of patient and caregiver satisfaction with the decision reached, decisional conflict and decisional regret
Decisional conflict
One study measured GPs' decisional conflict using the Decisional Conflict Scale (DCS; 1 = low decisional conflict, 5 = very high decisional conflict) and found no difference between the intervention group and controls (MD 3.4, adjusted RR 3.5, 95% CI 0.3 to 38.0) (Légaré 2012). For patients' decisional conflict scores, the MD was 1.7 and the adjusted RR 0.8, 95% CI 0.2 to 2.4. See Table 7.
| Author | Outcome | Measurement time point | Intervention | Control | Effect estimate | P value | Notes |
| Légaré (2012) | Decisional conflict (GPs)a | Immediately after consultation | Baseline: 4.5 (0 to 9.0) Follow‐up: 4.6 (0 to 6.1) | Baseline: 3.0 (0 to 5.9) Follow‐up:1.1 (0 to 2.4) | Adjusted RR 3.4 (0.3 to 38.0) | NR | — |
| Légaré (2012) | Decisional conflict (patients)a | Immediately after consultation | Baseline: 5.1 (0 to 13.5) Follow‐up: 4.6 (2.6 to 7.4) | Baseline: 4.2 (0 to 8.9) Follow‐up: 6.3 (0 to 12.8) | Adjusted RR: 0.8 (0.2 to 2.4) | NR | — |
| Légaré (2011) | Correlation of decisional conflict between GPs and patientsa | Immediately after consultation | Baseline: 0.14 Follow‐up: 0.24 | Baseline: ‐0.05 Follow‐up: 0.02 | Difference at follow‐up (95% CI) 0.26 (‐0.06 to 0.53) | 0.06 | — |
aProportion of participants who had a value of 2.5 or more on the Decision Conflict Scale (where 1 = low decisional conflict and 5 = very high decisional conflict).
bPresented as correlation of family physicians' and patient's DCS scores (Pearson's r).
CI: confidence interval
GP: general practitioner
NR: not reported
RR: risk ratio
Decision regret (patients)
Légaré 2012 observed a clinically insignificant effect between the intervention and control groups on a decision regret measure (0 = very low regret, 100 = very high regret) with a mean of 12.4 in the intervention group and 7.6 in the control group; adjusted MD 4.8, 95% CI 0.9 to 8.7. Légaré 2011 also reported no difference in the proportion of patients with decisional regret between the study groups (7% in the intervention group versus 9% in the control; adjusted MD ‐2, 95% CI ‐12 to 5). See Table 8.
| Author | Outcome | Measurement time point | Intervention | Control | Effect estimate | P value | Notes |
| Légaré (2012) | Decisional regret a | 2 weeks after consultation | Baseline: 10.5 ± 15.4 Follow‐up: 12.4 ± 19.1 | Baseline: 10.8 ± 20.8 Follow‐up: 7.6 ± 13.7 | Adjusted mean difference 4.8 (0.9 to 8.7) | — | — |
| Légaré (2011) | Patients (%) with decisional regret | 2 weeks after consultation | Baseline: 1 Follow‐up: 7 | Baseline: 1 Follow‐up: 9 | Difference at follow‐up (95% CI) ‐2 (‐12 to 5) | 0.91 | — |
a = Decisional Regret Scale used, where 0 = very low regret and 100 = very high regret
CI: confidence interval
10. Measures of extent of patient involvement in the decision making process
Patient enablement
Three studies reported on patient enablement. Cals 2009 found no difference between intervention and control group scores on the Patient Enablement Instrument (PEI; score 0 to 12) (mean (SD): 3.29 (2.52) versus 3.06 (2.54); P value = 0.70). Francis 2009 found no between‐group difference in a modified PEI measuring parent enablement (score 0 to 10; score greater or equal five: 40.2% versus 35.9%; adjusted OR 1.20, 95% CI 0.84 to 1.73). Briel 2006 found weak evidence for higher patient enablement on the PEI (median 8 out of 12; mean (SD) 8.49 (1.98) versus 8.15 (2.03); adjusted MD 0.35, 95% CI ‐0.05 to 0.75). See Table 9.
| Author | Outcome | Measurement time point | Intervention | Control | Effect estimate | P value | Notes |
| Briel (2006) | Patient enablement (Patient Enablement Instrument; scale 0 to 12) | 7 and 14 days | Mean (SD): 8.49 (1.98) | Mean (SD): 8.15 (2.03) | Adjusted coefficient (95% CI)a 0.35 (‐0.05 to 0.75) | NR | — |
| Cals (2009) | Patient enablement (Patient Enablement Instrument; max score is 12) | 28 days | Median (IQR) score: 3 (4) Mean (SD) score: 3.29 (2.52) | Median (IQR) score: 3 (4)d Mean (SD) score: 3.06 (2.54) | — | NR 0.70b | — |
| Francis (2009) | Parent enablement (Modified Patient Enablement Instrument, scale 1 to 10)c | 14 days | n/N (%): 99/246 (40.2) | n/N (%): 94/262 (35.9) | Adjusted OR (95% CI) 1.20 (0.84 to 1.73) | NR | — |
aLinear regression with random effects for each cluster and patient covariates (age, sex, education, days with restrictions at baseline).
bCalculated from models adjusted for variance at general practitioner and practice level.
cPresented results are % with parent enablement score of 5 or more (binary outcome).
dComparator is 'no skills training'.
CI: confidence interval
IQR: interquartile range
NR: not reported
OR: odds ratio
SD: standard deviation
11. Measures of treatment compliance or adherence to decision reached
Decision quality
Légaré 2012 found no difference between GPs on a measure of GPs' decision quality (1 = very low quality, 10 = very high quality) (MD ‐0.2, 95% CI ‐0.6 to 0.2). The results were similar to the earlier pilot cluster‐RCT, Légaré 2011 (MD ‐0.2, 95% CI ‐0.34 to 0.89; P value = 0.29). Similarly, there were no differences observed in patients' decision quality in Légaré 2012 (MD 0.0, 95% CI ‐0.4 to 0.4) and Légaré 2011 (MD 0.1, 95% CI ‐0.88 to 0.94; P value = 0.57). See Table 10 and Table 11.
| Author | Outcome | Measurement time point | Intervention | Control | Effect estimate | P value | Notes |
| Légaré (2012) | Quality of decision made (GPs) (0 to 10 Likert scale) | After consultation | Baseline: 8.7 ± 1.5 Follow‐up: 8.5 ± 1.6 | Baseline: 8.7 ± 1.5 Follow‐up: 8.5 ± 1.5 | Adjusted mean difference 0.0 (‐0.4 to 0.4) | NR | — |
| Légaré (2011) | Quality of decision made (GPs) (0 to 10 Likert scale) | After consultation | Baseline: 8.8 ± 1.1 Follow‐up: 8.7 ± 1.2 | Baseline: 8.3 ± 1.4 Follow‐up: 8.5 ± 1.3 | Difference at follow‐up (95% CI) 0.2 (‐0.34 to 0.89) | 0.29 | — |
CI: confidence interval
GP: general practitioner
NR: not reported
| Author | Outcome | Measurement time point | Intervention | Control | Effect estimate | P value | Notes |
| Légaré (2012) | Quality of decision made (patients) (0 to 10 Likert scale) a | After consultation | Baseline: 8.2 ± 1.1 Follow‐up: 8.2 ± 1.3 | Baseline: 8.2 ± 1.4 Follow‐up: 8.4 ± 1.0 | Adjusted mean difference 0.2 (‐0.6 to 0.2) | NR | — |
| Légaré (2011) | Quality of the decision made (patients) (0 to 10 Likert scale) a | After consultation | Baseline: 8.2 ± 2.1 Follow‐up: 8.7 ± 1.9 | Baseline: 8.4 ± 1.9 Follow‐up: 8.6 ± 1.9 | Difference at follow‐up (95% CI) 0.1 (‐0.88 to 0.94) | 0.57 | — |
aLikert scale where 0 = very low quality and 10 = very high quality.
CI: confidence interval
NR: not reported
Adherence to decision
The only trial to measure adherence to the decision reached found no difference between intervention and control groups (87.7% of patients versus 91.5%; absolute difference of 3.8, adjusted RR 1.0, 95% CI 0.9 to 1.0) (Légaré 2012).
Discussion
Summary of main results
Interventions aiming to promote shared decision making in primary care, as the focus or a core component of multi‐faceted interventions, significantly reduced antibiotic prescribing for acute respiratory infections by almost 40% compared with usual care in the short term. There was insufficient evidence for sustained reductions in antibiotic prescribing over the longer term. There were no significant differences between groups receiving the intervention or usual care in clinical complications such as re‐consultation for the same illness, or patient satisfaction with the consultation. There was also insufficient evidence to assess intervention effects on other clinically adverse or patient and/or caregiver shared decision process outcomes.
Overall completeness and applicability of evidence
A growing number of trials have examined the effect of interventions that aim to facilitate shared decision making, with all studies being conducted in the last 10 years (seven of 10 studies in the last five years), highlighting that shared decision making is a relatively new intervention.
All studies included acute upper or lower respiratory tract infection in children and/or adults consulting primary care or academic general practice. Trials were conducted in several high‐income European countries and Canada. Applicability of findings to low‐ and middle‐income countries and different cultural and healthcare settings is unknown.
We identified considerable heterogeneity in longer‐term prescribing outcomes meta‐analysed as risk ratio (see Analysis 1.2), and moderate to substantial heterogeneity in pooled results grouped under each reported effect estimate for the primary outcome (see Analysis 1.3; Analysis 1.4; Analysis 1.5). There was considerable diversity across included studies within each comparison in terms of the population (adults, children, or both), scale and composition of multi‐component interventions evaluated, timing of the intervention and follow‐up, outcome measures used and statistical techniques. The considerable heterogeneity observed in antibiotic prescribing rates over the longer term may be due to measurement differences in one study (Butler 2012) (all oral dispensed antibiotic items per 1000 registered patients for the year following exposure of practices to the intervention), or the low number of studies reporting longer‐term sustainability of intervention effects. Substantial (although non‐significant) heterogeneity apparent in studies reporting an adjusted odds ratio (OR) (see Analysis 1.3; I2 statistic = 57%; P value = 0.10) may have resulted from the inclusion of one study reporting a statistically non‐significant intervention effect (Briel 2006), where an unusually low antibiotic prescribing rate was noted (13.5% and 15.7% in the study groups) compared with other studies. Detecting an intervention effect may be difficult in a low prescribing setting. Some heterogeneity in pooled studies reporting an adjusted relative risk (Analysis 1.4; I2 statistic = 19%; P value = 0.27) may result from true clinical and/or methodological diversity with the non‐significant result being simply an artefact of only two studies being available for the comparison. Significant heterogeneity in four studies reporting adjusted risk differences (Analysis 1.5; I2 statistic = 37; P value = 0.19) is likely due to inherent multiplicity of clinical and methodological factors.
The effect size of the included studies varied considerably, although there was general consistency in the direction of effects. The risk of bias overall in the included studies was low. Interventions varied markedly in the theoretical basis, and the components, scope, mode of delivery and duration. It is not possible, therefore, to identify which intervention components, combinations or modes of delivery most effectively promote shared decisions. Interventions and training were principally targeted at GPs. However, competence in the use of shared decision making was only reported in some trials, with no studies assessing intervention fidelity. Objective patient or clinician measures of adoption of shared decision making (e.g. OPTION (Elwyn 2003)) were not included in any studies. The usefulness of interventions aimed primarily at patients to help facilitate their role in initiating and making shared decisions remains unknown.
Quality of the evidence
We graded the quality of the evidence as moderate or low for all outcomes. All cluster‐level randomised controlled trials (RCTs) used a method of sequence generation aimed at minimising chance between‐group imbalance. All study participants (clusters) were randomised after they were enrolled and prior to group allocation to minimise selection bias. Blinding was not possible because of the nature of the interventions. We considered only two studies to have substantial loss to follow‐up (Altiner 2007; Légaré 2012). Altiner 2007 did not conduct an intention‐to‐treat (ITT) analysis although they explored the effects of differential missing values in cluster‐level sensitivity analysis. An ITT analysis was not reported by Légaré 2012.
Pooled studies for the primary outcome, antibiotic prescribing, were limited by the diversity in adjusted effect estimates reported and resulted in a low number of studies in each presented comparison (see Analysis 1.3; Analysis 1.4; Analysis 1.5). This was surmounted by calculating a risk ratio (RR) (using the design effect to adjust for clustering) for meta‐analysis (see Analysis 1.1; Analysis 1.2; Analysis 1.6), which results in some loss of precision, although it is still robust (and more conservative at least). Similarly, meta‐analysis could not be performed for several clinically important secondary outcomes due to variance in effect estimates reported or measurement differences, which resulted in only a small number of trials being included for patient satisfaction (see Analysis 1.7). The low number of trials in addition to the presence of considerable heterogeneity in the longer‐term reduction in antibiotic prescribing suggests that the overall pooled results and meaningful exploration of heterogeneity was limited and should be interpreted with caution. See summary of findings Table for the main comparison.
Potential biases in the review process
Combining trials under a common effect estimate (RR) for antibiotic prescribing in the longer term (≥ 12 months) required us to impute intra‐class correlation coefficients for two studies (Butler 2012; Cals 2013), from similar studies, so that the design effect for adjustment of clustering effects could be calculated. The results for these outcomes should be interpreted with caution.
Agreements and disagreements with other studies or reviews
Other systematic reviews have assessed clinician‐ and/or patient‐oriented interventions to influence antibiotic prescribing for acute respiratory infections (ARIs) in primary care (Andrews 2012; Arnold 2005; Boonacker 2010; Ranji 2008; Thoolen 2013; van der Velden 2012; Vodicka 2013). Meaningful comparisons about the relative effectiveness of studies is limited by the diversity in study designs, interventions and outcome measures. Two reviews concluded that multiple component interventions that provided education to healthcare professionals and patients were most often effective in reducing antibiotic use for respiratory tract infections (Arnold 2005; van der Velden 2012). Multi‐faceted interventions and computer strategies aimed at healthcare professionals most effectively reduced antibiotic prescribing in children with upper respiratory tract infections (Boonacker 2010). Provision of patient information alone (Thoolen 2013), or in addition to physician education (van der Velden 2012), appears to offer only moderate or little additional benefit, respectively. However, reviews exclude many recent high quality intervention trials incorporating patient information materials and training explicitly aiming to facilitate shared decision making. Two reviews found that educational interventions directed at parents and/or caregivers were effective in modifying consulting behaviour and antibiotic use for children with ARIs, and may be more successful when they engage children (Andrews 2012; Vodicka 2013). Interventions were also more successful when they were delivered prior to the consultation and focused on specific symptoms (Andrews 2012). Several reviews concluded that a reduction in antibiotics was not at the expense of adverse clinical outcomes (Ranji 2008), or patient satisfaction (Andrews 2012; Ranji 2008; Thoolen 2013). Previous reviews have raised the importance of a patient‐centred approach to help patients adopt a more active role in decision making about antibiotics for ARIs (Thoolen 2013), and communication skills training for physicians has been highlighted as a promising intervention element (van der Velden 2012).
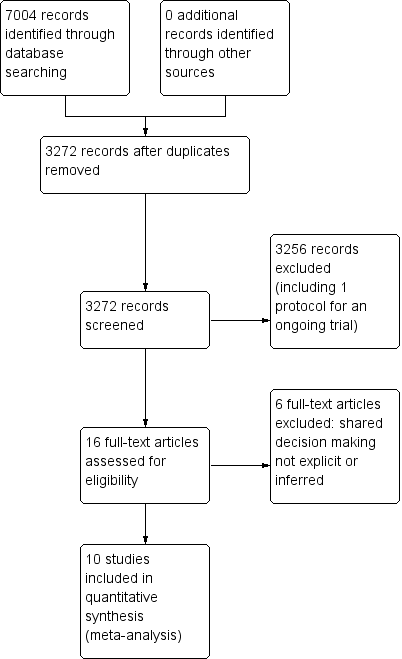
PRISMA study flow diagram.

'Risk of bias' summary: review authors' judgements about each risk of bias item for each included study.

'Risk of bias' graph: review authors' judgements about each risk of bias item presented as percentages across all included studies.

Forest plot of comparison: 1 Shared decision making versus usual care (control), outcome: 1.1 Antibiotics prescribed, dispensed or decision to use (short‐term, index consultation to ≤ 6 weeks).
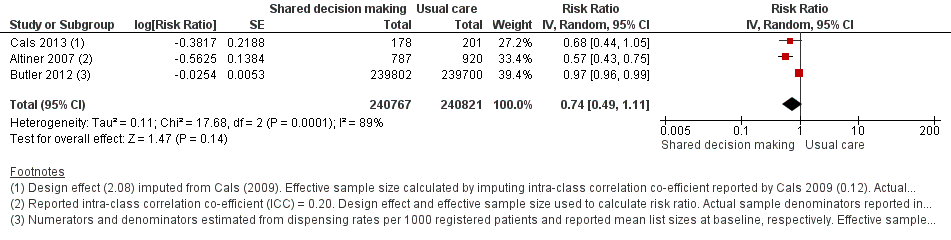
Forest plot of comparison: 1 Shared decision making versus usual care (control), outcome: 1.2 Antibiotics prescribed or dispensed (longer‐term, ≥ 12 months).

Forest plot of comparison: 1 Shared decision making versus usual care (control), outcome: 1.3 Antibiotic prescriptions (index consultation) (adjusted odds ratio).

Forest plot of comparison: 1 Shared decision making versus usual care (control), outcome: 1.4 Antibiotic prescriptions (index consultation) (adjusted risk ratio).
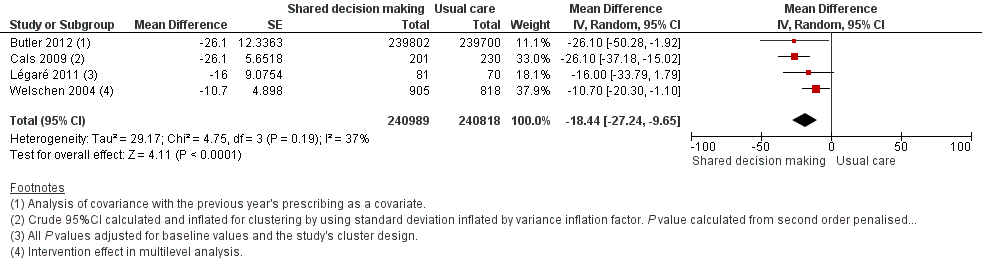
Forest plot of comparison: 1 Shared decision making versus usual care (control), outcome: 1.5 Antibiotic prescriptions (index consultation or population rate per unit of time) (adjusted risk difference).

Forest plot of comparison: 1 Shared decision making versus usual care (control), outcome: 1.6 Number or rate of re‐consultations (risk ratio).

Forest plot of comparison: 1 Shared decision making versus usual care (control), outcome: 1.7 Patient satisfaction with the consultation.
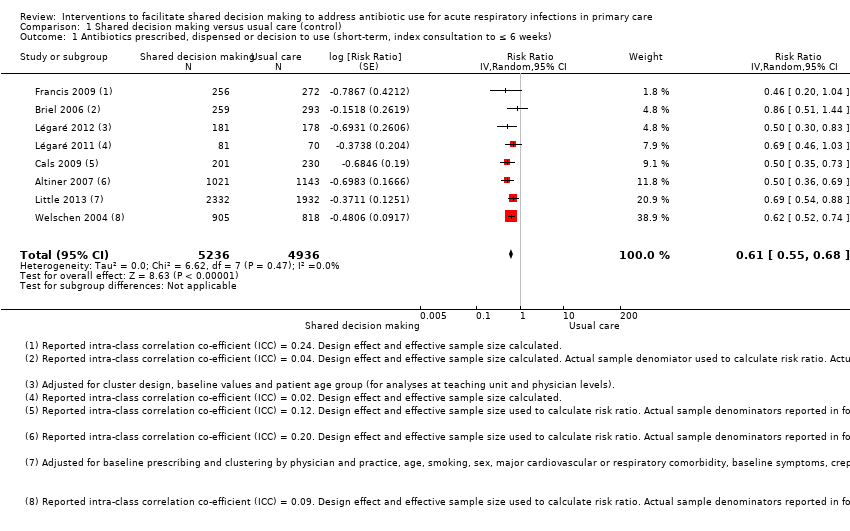
Comparison 1 Shared decision making versus usual care (control), Outcome 1 Antibiotics prescribed, dispensed or decision to use (short‐term, index consultation to ≤ 6 weeks).
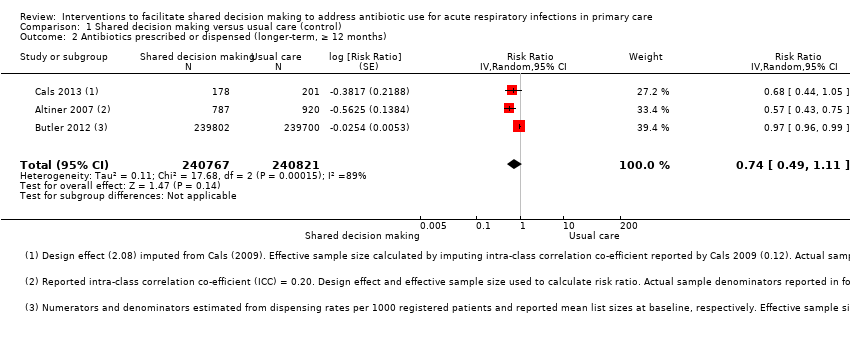
Comparison 1 Shared decision making versus usual care (control), Outcome 2 Antibiotics prescribed or dispensed (longer‐term, ≥ 12 months).
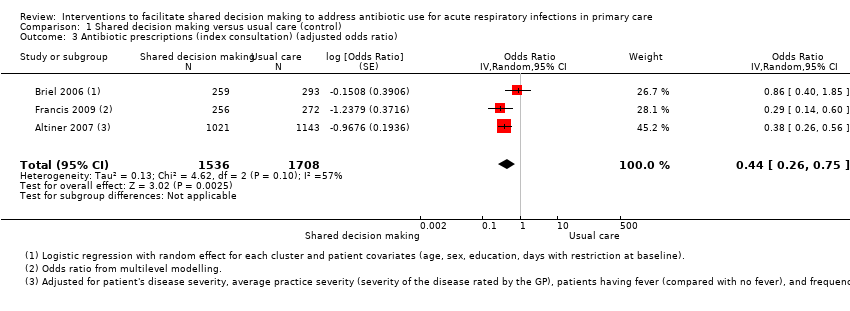
Comparison 1 Shared decision making versus usual care (control), Outcome 3 Antibiotic prescriptions (index consultation) (adjusted odds ratio).
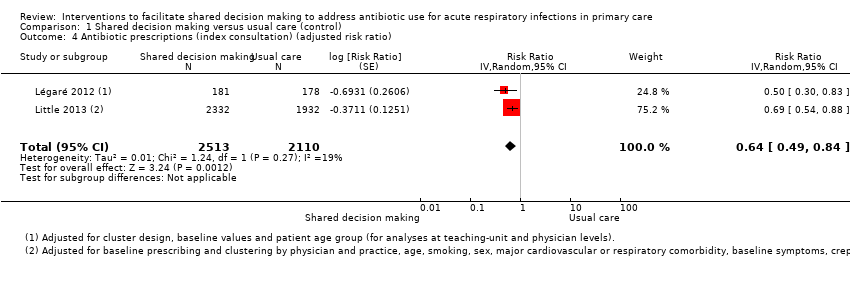
Comparison 1 Shared decision making versus usual care (control), Outcome 4 Antibiotic prescriptions (index consultation) (adjusted risk ratio).
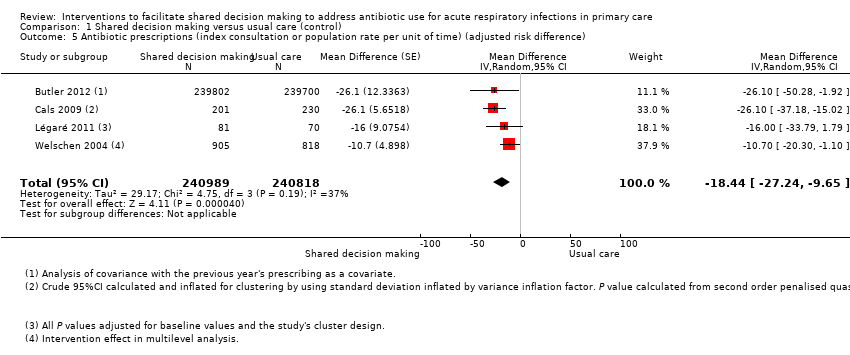
Comparison 1 Shared decision making versus usual care (control), Outcome 5 Antibiotic prescriptions (index consultation or population rate per unit of time) (adjusted risk difference).
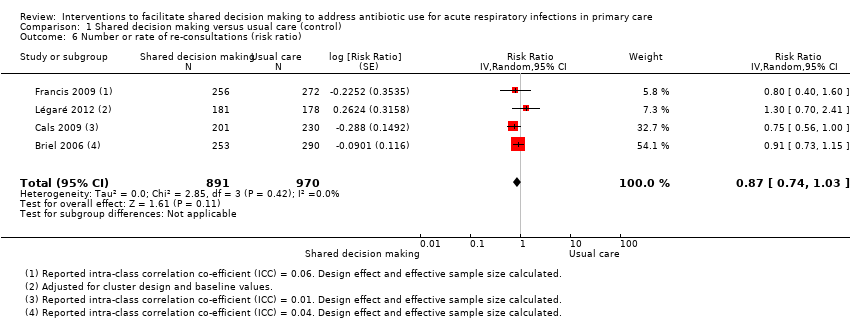
Comparison 1 Shared decision making versus usual care (control), Outcome 6 Number or rate of re‐consultations (risk ratio).

Comparison 1 Shared decision making versus usual care (control), Outcome 7 Patient satisfaction with the consultation.
| Shared decision making compared to usual care for acute respiratory infections in primary care | ||||||
| Patient or population: antibiotic use in acute respiratory infections | ||||||
| Outcomes | Anticipated absolute effects* (95% CI) | Relative effect | № of participants | Quality of the evidence | Comments | |
| Risk with usual care | Risk with Interventions to facilitate shared decision making | |||||
| Antibiotics prescribed or dispensed (6 weeks or less) | Moderate | RR 0.61 | 10172 | ⊕⊕⊕⊝ | ||
| 47 per 100 | 29 per 100 | |||||
| Antibiotics prescribed or dispensed (12 months or greater) | Moderate | RR 0.74 | 481588 | ⊕⊕⊝⊝ | ||
| 47 per 100 | 35 per 100 | |||||
| Patient initiated re‐consultations for the same illness episode | Moderate | RR 0.87 | 1861 | ⊕⊕⊕⊝ | ||
| 40 per 100 | 35 per 100 | |||||
| Patient satisfaction with the consultation | Moderate | OR 0.86 | 1052 | ⊕⊕⊝⊝ | ||
| 71 per 100 | 68 per 100 | |||||
| *The risk in the intervention group (and its 95% confidence interval) is based on the assumed risk in the comparison group and the relative effect of the intervention (and its 95% CI). | ||||||
| GRADE Working Group grades of evidence | ||||||
| 1 Downgraded one level because of risk of bias: participants in most studies were aware of whether they had received the intervention or not. 2 Downgraded one level because of imprecision: confidence interval includes reduction and possible increase in use of antibiotics. There was considerable heterogeneity in the rates of antibiotic prescribing during longer‐term follow‐up (12 months or greater). 3 Sample numbers in one trial, Butler 2012, were calculated from mean list size at baseline multiplied by the number of participating practices in each group (practice list sizes vary over time and no denominator data were available). 4 Downgraded one level due to imprecision: confidence interval includes both satisfaction and lack of satisfaction of patients with the consultation. | ||||||
| Author year | Brief name | Recipient | Why | What (materials) | What (procedures) | Who provided | How | Where | When and how much | Tailoring | Modification of intervention throughout trial | Strategies to improve or maintain intervention fidelity | Extent of intervention fidelity |
| Altiner 2007 | Complex GP peer‐led educational intervention | GPs and patients | Focused on communication within a consultation and the mutual discordance between patients' expectations and doctors' perceived patient expectations, empowering patients to raise the issue within the consultation. By 'informing' both sides in the consultation, it is hoped that doctors and patients would openly talk about the issue and thus reduce unnecessary antibiotic prescriptions | Peers used a semi‐structured dialogue script for outreach visits Patient materials (leaflet and poster) provided in waiting room primarily focused on the patients' role doctor‐patient 'antibiotic misunderstanding' and brief evidence‐based information on acute cough and antibiotics | GP peer‐led outreach visits. Peers were trained to explore GPs' 'opposite' motivational background to address their beliefs and attitudes. GPs were motivated to explore patient expectations and demands, to elicit anxieties and make antibiotic prescribing a subject in the consultation Patient materials were aimed at empowering patients to raise and clarify issues within the consultation | 5 practising GPs and teaching academics in the lead authors' department (2 female, 33 to 63 years of age); trained in 3 sessions for outreach visits | Face‐to‐face outreach visits to GPs | GP clinics during normal working hours | 1 outreach visit performed per GP (duration not specified) | Not described | Not described | Not described | 51/52 GPs received intervention |
| Briel 2006 | Brief training programme in patient‐centred communication | GPs | Focused on teaching GPs how to understand and modify patients' concepts and beliefs about the use of antibiotics for ARIs. GPs were introduced to a model (Prochaska 1992) for identifying patients' attitude and readiness for behaviour change | Evidence‐based guidelines for diagnosis and treatment of ARIs (updated, locally adapted and reviewed by local experts) distributed as a booklet [URL provided is no longer active] | GPs were trained in elements of active listening, to respond to emotional cues, and to tailor information given to patients. Physicians used a model were introduced to a model (Prochaska 1992) to identify patients' attitude and readiness for behaviour change | Not specified | Seminar in small groups (number not specified) and personal feedback by telephone prior to the start of the trial. Evidence‐based guidelines were distributed as a booklet | Not specified | Attendance at 1 x 6‐hour seminar and 1 x 2‐hour telephone call to give personal feedback prior to the trial start | Not described | Not described | Not described | Not described |
| Butler 2012 | Multifaceted flexible blended learning approach for clinicians | GPs and nurse practitioners | Blended learning experience to develop clinicians' sense of the importance about change and their confidence in their ability to achieve change based on Social Learning Theory Clinicians reflected on practice‐level antibiotic dispensing and resistance data, reflected on own clinical practice (context‐bound learning), and were trained in novel communication skills derived from principles of motivational interviewing | Summaries of research evidence and guidelines, web‐based modules using video‐rich material presenting novel communication skills, and a web‐based forum to share experiences and views (see for online component) | Intervention consist of 7 components: experiential learning, updated summaries of research evidence and guidelines; web‐based learning in novel communication skills; practising consulting skills in routine care; facilitator‐led practice‐based seminar on practice‐level data on antibiotic prescribing and resistance; reflections on own clinical practice, and a web‐based forum to share experiences and views | A facilitator conducted the face‐to‐face seminar | Intervention consisted of 7 parts (5 online modules, 1 face‐to‐face seminar and 1 facilitator‐led practice‐based seminar) | The face‐to‐face and facilitator‐led seminars were presented at the general practice | 7 components (5 online, 1 face‐to‐face and 1 facilitator‐led practice‐based seminar) A booster module (6 to 8 months after completion of initial training) reinforced these skills | Intervention was flexible so clinicians could access the online components and try out new skills with their patients at their convenience | Not described | Not described | 138/139 completed all online training and uploaded descriptions of consultations for the portfolio tasks; 129/139 attended the practice‐based seminars; 76/139 completed the optional booster session at 6 months; 11/139 entered new threads on the online forum with 81 posts and 1485 viewings of posts and threads |
| Cals 2009 | Enhanced communication skills training | GPs | Focused on information exchange based on the elicit‐provide‐elicit framework from counselling in behaviour change ‐ exploring patients' fears and expectations, patients' opinion on antibiotics and outlining the natural duration of cough in lower respiratory tract infections | Pre and post‐workshop transcripts of simulated patients | Brief context‐learning based workshop in small groups (5 to 8 GPs), preceded and followed by practice‐based consultations with simulated patients. GPs reflected on own transcripts of consultations with simulated patients, which were also peer‐reviewed by colleagues | Experienced moderator to lead seminars | Brief workshop (5 to 8 GPs), preceded and followed by practice‐based consultation with simulated patients | General practice | 1 x 2‐hour moderator‐led small groups workshop, preceded and followed by practice‐based consultation with simulated patients | Not described | Not described | Not described | 66% of patients recruited by GPs allocated to training in enhanced communication skills recalled their GP's use at least 3 of 4 specific communication skills compared with 19% in the no training group |
| Francis 2009 | Interactive booklet for parents and clinician training in its use | GPs and patients | Focused on specific communication skills, such as exploring parent's main concerns, asking about their expectations, and discussing prognosis, treatment options and reasons that should prompt re‐consultation | 8‐page booklet (now at ); online training in use of the booklet included videos to demonstrate use of the booklet within a consultation, as well as audio feeds, pictures and links to study materials [original URL no longer active] | Booklet given to parents to use in the consultation and as a take‐home resource (no further details provided) Online training on the use of the booklet was provided to GPs: describing the content and aims of the booklet, and encouraging use within the consultation to facilitate use of specific communication skills | N/A (online training) | Parents used the booklet face‐to‐face in the consultation with GPs and took it home; GP training in use of booklet was online | General practice; parents' homes | 1 x 40‐minute online training module | Not described | Not described | Online clinician training monitored through study website: whether a GP has logged on to the site, how much time spent on it and which pages were viewed | Stated that treatment fidelity was not measured so that assessors could remain blind to the study group |
| Légaré 2012 | Shared decision making training program (DECISION+2) | Family physicians (including teachers and residents) | A shared decision making training program that aimed to help physicians communicate to patients the probability of a bacterial ARI and the benefits and harms associated with the use of antibiotics | Online tutorial and workshop included videos, exercises and decision aids to help physicians communicate to their patients the probability of bacterial ARIs and benefits/harms of antibiotic use. Decision aids were available in the consultation rooms in all family practice teaching units | Online self tutorial comprising 5 modules 2‐hour online tutorial followed by a facilitator‐led on‐site interactive workshops aimed to help physicians review and integrate concepts acquired during online training | Trained facilitators | Online tutorial and face‐to‐face workshop | Family practice teaching units | 1 x 2‐hour online tutorial, followed by 1 x 2‐hour on‐site interactive workshop. Participants had 1 month to complete the programme | Not described | Not described | Not described | Of the 162 physicians, 103 completed both the online tutorial and workshop; 16 completed only the workshop; 15 only the tutorial; and 28 completed none of the training components |
| Légaré 2011 | Multiple‐component, continuing professional development program in shared decision making (DECISION+) | Family medicine groups (physicians and nurses) | Aimed to help family physicians communicate to patients the probability of bacterial ARI and benefits and harms of antibiotic use | Workshops included videos (simulated consultations of usual care and SDM) and exercises (facilitators and barriers to SDM). GPs trained in the use of 5 decision support tools using video examples and group exercises. A booklet summarising workshop content provided to participants. Postcard reminders sent | Interactive workshops and related material, reminders of expected behaviours and GP feedback on agreement between their decisional conflict and that of their patients | Trained facilitators | Face‐to‐face workshop | Family medicine groups | 3 x 3‐hour interactive workshops and related material, in addition to reminders of expected behaviours and GP feedback on agreement between their decisional conflict and that of their patients. DECISION+ conducted over 4 to 6 months | Not described | 4 pilot workshops held rather than 3 as the second workshop was redesigned and re‐piloted after feedback on its first testing | Not described | Not described |
| Little 2013 | Internet‐based training in enhanced communication skills | GPs | Rationale was that Internet‐based training can be more widely disseminated than face‐to‐face training. Training focused on eliciting patients' expectations and concerns, natural disease course, treatments, agreement on a management plan, summing up and guidance on when to re‐consult | Interactive booklet for use by GPs within consultations Training supported by video demonstrations of consultation techniques | Online modules and an interactive booklet for use within consultations. (Group practices also appointed a lead GP to organise a structured meeting on prescribing issues) | N/A (online modules) other than lead GP at each practice to organise a meeting (not specific to just this arm of the intervention though) | Online modules (and GP‐led structured practice‐based meeting) | General practice | Internet modules completed alone or in a group | Not described | Not described | Not described | 94/108 practices (87%) completed the communication training. Mean (SD) time spent on the website was 37 (29) minutes |
| Welschen 2004 | Group education meeting with consensus procedure and communication skills training | GPs/pharmacists and their assistants, and patients | GPs discussed evidence for antibiotic benefit/risk, and learned communication techniques to explore patients' expectations and concerns, inform about natural course of symptoms, self‐ medication and alarm symptoms. Patient education provided information on the self‐ limiting nature or ARIs, self‐medication and alarm symptoms requiring re‐consultation | Group consensus guidelines and patient waiting room materials (poster/leaflets) | Group education meeting with consensus procedure, with a summary, and guidelines mailed 1 month later to reinforce consensus reached; feedback on prescribing behaviour (post‐ and pre‐intervention insurance claims data) and practice‐level reporting of extent prescribing behaviours aligned with consensus reached; group education session for GP and pharmacists assistants (Dutch guidelines and skills training in patient education); waiting room education al material for patients | Jointly led by GP and pharmacist | Group education meeting for GPs with consensus procedure and communication skills training, Group education for GPs' and pharmacists' assistants, monitoring and feedback on prescribing behaviour, and patient education materials | Not described | 1 x group education meeting with consensus procedure; 1 x 2‐hour group education session for GP and pharmacists' assistants; monitoring and feedback of prescribing behaviour at 6 months post‐intervention | Not described | Not described | Not described | Not described |
| ARI: acute respiratory infection | |||||||||||||
| Author | Outcome | Measurement time point | Intervention (n) | Control | Effect estimate | P value | Notes |
| Adjusted odds ratio (95% CI) | |||||||
| Francis (2009) | Antibiotics prescribed at the index consultation | 14 days | (30 practices) Patients = 50/256 (19.5%) | (31 practices) | 0.29 (0.14 to 0.60)a | NR | ICC = 0.24 |
| Altiner (2007) | Rate of antibiotic prescriptions (per acute cough and per GP) | 6 weeks | GPs = 42 | GPs = 44 | 0.38 (0.26 to 0.56)b | < 0.001 | ICC=0.20 |
| 12 months | GPs = 28 | GPs = 33 | 0.55 (0.38 to 0.80)b | 0.002 | |||
| Briel (2006) | Uptake of antibiotic prescriptions as reported by pharmacists < 2 weeks after the consultation | 14 days | GPs = 15 | GPs = 15 | 0.86 (0.40 to 1.93)c | NR | ICC = 0.04 Design effect = 1.6 |
| Adjusted risk ratio (95% CI) | |||||||
| Little (2013) | Antibiotic prescription | index consultation | Practices = 61 | Practices = 61 | 0.69 (0.54 to 0.87)d | < 0.0001 | — |
| Légaré (2012) | % patients who decided to use antibiotics immediately after the consultation | Index consultation | Practice units = 6 | Practice units = 6 | 0.50 (0.30 to 0.70)e | — | — |
| Adjusted risk difference (95% CI) | |||||||
| Légaré (2011) | % patients who decided to use antibiotics immediately after the consultation | Index consultation | Medicine groups = 2 | Medicine groups | ‐16 (‐31 to 1)f | 0.08 | — |
| Butler (2012) | Total no. dispensed oral antibiotic items per 1000 registered patients for the year after the intervention | 12‐month period | Practices = 34 Patients = 7053 | Practices = 34 Patients = 7050 | ‐4.2 (‐0.6 to ‐7.7) | 0.02 | — |
| Cals (2009) | Antibiotic prescribing at the index consultation | Index consultation | n/N = 55/201 % crude (95% CI)G 27.4 (25.6 to 36.6) | n/N = 123/230 % crude (95% CI)g 53.5 (43.8 to 63.2) | ‐26.1 (% crude) | < 0.01h | ICC = 0.12 |
| Cals (2013) | Proportion of episodes of respiratory tract infections during follow‐up for which a GP was seen and that antibiotics were prescribed for | Mean 3.67 years follow‐up | n = 178 % (95% CI) 26.3 (20.6 to 32.0) | n = 201 % (95% CI) 39.1 (33.1 to 45.1) | ‐10.4i | 0.02i | — |
| Welschen (2006) | % practice encounters for acute symptoms of the respiratory tract for which antibiotics were prescribed | Index consultation | Review groups = 6 | Review groups = 6 | –10.7 (–20.3 to –1.0)j | — | Practice = 0.17 Review group = 0.09 |
| aTwo level (practice and patient) random intercept logistic regression models. CI: confidence interval | |||||||
| Author | Outcome | Measurement time point | Intervention | Control | Effect estimate | P value | Notes |
| Briel (2006) | Re‐consultations | Within 14 days | n/N (%) 113/253 (44.7) | n/N (%) 143/290 (49.3) | Adjusted rate ratio (95% CI)a 0.97 (0.78 to 1.21) | NR | — |
| Butler (2013) | Re‐consultations after index consultation)b | Within 7 days Within 14 days Within 31 days | Median (IQR) 2.66 (1.88 to 4.25) 5.10 (4.70 to 7.92) 9.06 (7.53 to 12.62) | Median (IQR) 3.35 (2.16 to 4.31) 6.43 (4.04 to 7.84) 11.38 (7.39 to 14.05) | Median difference (95% CI)c ‐0.65 (‐1.69 to 0.55) ‐1.33 (‐2.12 to 0.74) ‐2.32 (‐4.76 to 1.95) | P value = 0.446d P value = 0.411d P value = 0.503d | — |
| Cals (2009) | Re‐consultations | Within 28 days | n/N = 56/201 % crude (95% CI)e 27.9 (21.4 to 34.4) | n/N = 85/230 % crude (95% CI)e 37.0 (30.4, 43.6) | Absolute difference 9.1 (% crude) | 0.14f | ICC = 0.01 |
| Francis (2009) | Re‐consultationg | Within 14 days | n/N (%) 33/256 (12.9) | n/N (%) 44/272 (16.2) | Adjusted odds ratio (95% CI) 0.75 (0.41 to 1.38) | NR | ICC = 0.06 |
| Légaré (2012) | Re‐consultation | Baseline (pre) | 21.6 (12.1 to 29.7) | 22.7 (10.3 to 27.3) | Adjusted risk ratio (95% CI)h 1.3 (0.7 to 2.3) Absolute difference = 7.5 | NR | — |
| Within 14 days (post) | 13.4 (9.9 to 15.9) | 15.2 (11.9 to 19.4) | |||||
| Little (2013) | New or worsening symptomsi | — | n/N (%) 451/2242 (20%) | n/N (%) 309/1879 (16%) | Adjusted risk ratio (95% CI)j 1.33 (0.99 to 1.74) | P value = 0.055 | — |
| aPoisson regression with random effects for each cluster and patient covariates (age, sex, education, days with restrictions at baseline). CI: confidence interval ICC: intra‐class correlation co‐efficient | |||||||
| Author | Outcome | Measurement time point | Intervention | Control | Effect estimate | P value | Notes |
| Briel (2006) | Hospital admissions | < 28 days of study enrolment | n/N = 2/253 | n/N = 1/290 | NR | NR | — |
| Butler (2012) | Hospital admissionsa | Baseline Follow‐up | Mean 7.7 7.5 | Mean 8.7 8.0 | % reduction (intervention relative to controlsb (95% CI) ‐1.9 (‐13.2 to 8.2) | P value = 0.72 | — |
| Cals (2013) | Hospital admissions | Mean 3.67 year follow‐up | n/N 0/178 | n/N 5/201 | NR | NR | — |
| Francis (2009) | Hospital admissions (or observed in a paediatric assessment unit) | < 14 days | n/N 3/256 | n/N 4/272 | NR | NR | — |
| Little (2013) | Hospital admissionsc | < 4 weeks | n/N 6/1170 | n/N 2/870 | NR | — | — |
| aAnnual number of hospital episodes for possible respiratory tract infections and complications of common infections per 1000 registered patients. A single admission occurred if patient admitted to hospital for a possible RTI or complication. If patient admitted more than once, and gap between admissions was 30 days or more, this was considered a separate complication episode. bDifference between means in intervention group and control group as percentage of mean control group. cFactorial analysis data not reported NR: not reported | |||||||
| Author | Outcome | Measurement time point | Intervention | Control | Effect estimate | P value | Notes |
| Briel (2006) | Pneumonia | < 28 days | n/N = 0/253 | 1/290 | NR | NR | — |
| Cals (2013) | Pneumonia | Mean 3.67 year follow‐up | n/N = 0/178 | n/N = 1/201 | NR | NR | — |
| NR: not reported | |||||||
| Author | Outcome | Measurement time point | Intervention | Control | Effect estimate | P value | Notes |
| Briel (2006) | Patient satisfaction (Patient Satisfaction Questionnaire)a | 7 and 14 days | 121/253 (47.8) | 142/290 (49.0) | Adjusted OR (95% CI)b 1.00 (0.64 to 1.31) | NR | — |
| Cals (2009) | Patient satisfaction (% at least 'very satisfied' on Likert scale)c | 28 days | n/N = 144/201 % (crude 95% CI)d 78.7 (72.5 to 84.9) | n/N = 151/230 % (crude 95% CI)d 74.4 (68.2 to 80.6) | 4.3 | P value = 0.88e | — |
| Francis (2009) | Parent satisfaction (Likert scale)f | 14 days | n/N (%) = 222/246 (90.2) | n/N (%) = 246/263 (93.5) | Adjusted OR (95% CI)g 0.6 (0.3 to 1.2) | NR | — |
| Welschen (2006) | Patient satisfaction (Likert scale)h | Index consultation | Patient satisfaction (%) Baseline (pre) = 4.3 (0.3) Follow‐up (post) = 4.3 (0.3) % change (SD) = 0 (0.4) | Patient satisfaction (%) Baseline (pre) = 4.2 (0.4) Follow‐up (post) = 4.2 (0.3) % change (SD): 0 (0.4) | Mean difference of changes (95% CI) 0 (–0.2 to 0.1) i | NR | — |
| a% patients with a maximum score of 70 reported, as satisfaction scores (scale 14 to 70; median 68/70) were highly skewed. CI: confidence interval | |||||||
| Author | Outcome | Measurement time point | Intervention | Control | Effect estimate | P value | Notes |
| Légaré (2012) | Decisional conflict (GPs)a | Immediately after consultation | Baseline: 4.5 (0 to 9.0) Follow‐up: 4.6 (0 to 6.1) | Baseline: 3.0 (0 to 5.9) Follow‐up:1.1 (0 to 2.4) | Adjusted RR 3.4 (0.3 to 38.0) | NR | — |
| Légaré (2012) | Decisional conflict (patients)a | Immediately after consultation | Baseline: 5.1 (0 to 13.5) Follow‐up: 4.6 (2.6 to 7.4) | Baseline: 4.2 (0 to 8.9) Follow‐up: 6.3 (0 to 12.8) | Adjusted RR: 0.8 (0.2 to 2.4) | NR | — |
| Légaré (2011) | Correlation of decisional conflict between GPs and patientsa | Immediately after consultation | Baseline: 0.14 Follow‐up: 0.24 | Baseline: ‐0.05 Follow‐up: 0.02 | Difference at follow‐up (95% CI) 0.26 (‐0.06 to 0.53) | 0.06 | — |
| aProportion of participants who had a value of 2.5 or more on the Decision Conflict Scale (where 1 = low decisional conflict and 5 = very high decisional conflict). CI: confidence interval | |||||||
| Author | Outcome | Measurement time point | Intervention | Control | Effect estimate | P value | Notes |
| Légaré (2012) | Decisional regret a | 2 weeks after consultation | Baseline: 10.5 ± 15.4 Follow‐up: 12.4 ± 19.1 | Baseline: 10.8 ± 20.8 Follow‐up: 7.6 ± 13.7 | Adjusted mean difference 4.8 (0.9 to 8.7) | — | — |
| Légaré (2011) | Patients (%) with decisional regret | 2 weeks after consultation | Baseline: 1 Follow‐up: 7 | Baseline: 1 Follow‐up: 9 | Difference at follow‐up (95% CI) ‐2 (‐12 to 5) | 0.91 | — |
| a = Decisional Regret Scale used, where 0 = very low regret and 100 = very high regret CI: confidence interval | |||||||
| Author | Outcome | Measurement time point | Intervention | Control | Effect estimate | P value | Notes |
| Briel (2006) | Patient enablement (Patient Enablement Instrument; scale 0 to 12) | 7 and 14 days | Mean (SD): 8.49 (1.98) | Mean (SD): 8.15 (2.03) | Adjusted coefficient (95% CI)a 0.35 (‐0.05 to 0.75) | NR | — |
| Cals (2009) | Patient enablement (Patient Enablement Instrument; max score is 12) | 28 days | Median (IQR) score: 3 (4) Mean (SD) score: 3.29 (2.52) | Median (IQR) score: 3 (4)d Mean (SD) score: 3.06 (2.54) | — | NR 0.70b | — |
| Francis (2009) | Parent enablement (Modified Patient Enablement Instrument, scale 1 to 10)c | 14 days | n/N (%): 99/246 (40.2) | n/N (%): 94/262 (35.9) | Adjusted OR (95% CI) 1.20 (0.84 to 1.73) | NR | — |
| aLinear regression with random effects for each cluster and patient covariates (age, sex, education, days with restrictions at baseline). CI: confidence interval | |||||||
| Author | Outcome | Measurement time point | Intervention | Control | Effect estimate | P value | Notes |
| Légaré (2012) | Quality of decision made (GPs) (0 to 10 Likert scale) | After consultation | Baseline: 8.7 ± 1.5 Follow‐up: 8.5 ± 1.6 | Baseline: 8.7 ± 1.5 Follow‐up: 8.5 ± 1.5 | Adjusted mean difference 0.0 (‐0.4 to 0.4) | NR | — |
| Légaré (2011) | Quality of decision made (GPs) (0 to 10 Likert scale) | After consultation | Baseline: 8.8 ± 1.1 Follow‐up: 8.7 ± 1.2 | Baseline: 8.3 ± 1.4 Follow‐up: 8.5 ± 1.3 | Difference at follow‐up (95% CI) 0.2 (‐0.34 to 0.89) | 0.29 | — |
| CI: confidence interval | |||||||
| Author | Outcome | Measurement time point | Intervention | Control | Effect estimate | P value | Notes |
| Légaré (2012) | Quality of decision made (patients) (0 to 10 Likert scale) a | After consultation | Baseline: 8.2 ± 1.1 Follow‐up: 8.2 ± 1.3 | Baseline: 8.2 ± 1.4 Follow‐up: 8.4 ± 1.0 | Adjusted mean difference 0.2 (‐0.6 to 0.2) | NR | — |
| Légaré (2011) | Quality of the decision made (patients) (0 to 10 Likert scale) a | After consultation | Baseline: 8.2 ± 2.1 Follow‐up: 8.7 ± 1.9 | Baseline: 8.4 ± 1.9 Follow‐up: 8.6 ± 1.9 | Difference at follow‐up (95% CI) 0.1 (‐0.88 to 0.94) | 0.57 | — |
| aLikert scale where 0 = very low quality and 10 = very high quality. CI: confidence interval | |||||||
| Outcome or subgroup title | No. of studies | No. of participants | Statistical method | Effect size |
| 1 Antibiotics prescribed, dispensed or decision to use (short‐term, index consultation to ≤ 6 weeks) Show forest plot | 8 | 10172 | Risk Ratio (Random, 95% CI) | 0.61 [0.55, 0.68] |
| 2 Antibiotics prescribed or dispensed (longer‐term, ≥ 12 months) Show forest plot | 3 | 481588 | Risk Ratio (Random, 95% CI) | 0.74 [0.49, 1.11] |
| 3 Antibiotic prescriptions (index consultation) (adjusted odds ratio) Show forest plot | 3 | 3244 | Odds Ratio (Random, 95% CI) | 0.44 [0.26, 0.75] |
| 4 Antibiotic prescriptions (index consultation) (adjusted risk ratio) Show forest plot | 2 | 4623 | Risk Ratio (Random, 95% CI) | 0.64 [0.49, 0.84] |
| 5 Antibiotic prescriptions (index consultation or population rate per unit of time) (adjusted risk difference) Show forest plot | 4 | 481807 | Mean Difference (Random, 95% CI) | ‐18.44 [‐27.24, ‐9.65] |
| 6 Number or rate of re‐consultations (risk ratio) Show forest plot | 4 | 1861 | Risk Ratio (Random, 95% CI) | 0.87 [0.74, 1.03] |
| 7 Patient satisfaction with the consultation Show forest plot | 2 | 1052 | Odds Ratio (Random, 95% CI) | 0.86 [0.57, 1.30] |