Intervenciones con ejercicios y creencias de los pacientes para pacientes con artrosis de cadera o rodilla o de cadera y rodilla: una revisión de métodos mixtos
Información
- DOI:
- https://doi.org/10.1002/14651858.CD010842.pub2Copiar DOI

- Base de datos:
-
- Cochrane Database of Systematic Reviews
- Versión publicada:
-
- 17 abril 2018see what's new
- Tipo:
-
- Intervention
- Etapa:
-
- Review
- Grupo Editorial Cochrane:
-
Grupo Cochrane de Salud musculoesquelética
- Copyright:
-
- Copyright © 2018 The Cochrane Collaboration. Published by John Wiley & Sons, Ltd.
Cifras del artículo
Altmetric:
Citado por:
Autores
Contributions of authors
| Roles and responsibilities | |
| Draft the protocol | MH, KD, NW, SO |
| Develop a search strategy | CS, KD |
| Search for trials | CS, KD, RH |
| Obtain copies of trials | HH, KD, RH |
| Select which trials to include | KD, HH, MH, NW, RH |
| Extract data from trials | KD, HH, NW, MH, RH, RG |
| Enter data into RevMan | KD, MH, HH, RH, RG |
| Carry out the analysis | KD, HH, RG |
| Interpret the analysis | KD, HH, RG, MH, NW, SO, RH |
| Draft the final review | KD, HH, MH, SO, NW, RG |
| Update the review | KD, MH, NW, RH, RG |
| CERQual | KD, RH |
Sources of support
Internal sources
-
No sources of support supplied
External sources
-
Arthritis Research UK, UK.
Educational Grant, Number 20163
Declarations of interest
MH: no conflicting interests to declare.
KD: no conflicting interests to declare.
RH: no conflicting interests to declare.
RG: no conflicting interests to declare.
HH: no conflicting interests to declare.
NW: no conflicting interests to declare.
CS: no conflicting interests to declare.
SO: no conflicting interests to declare.
Acknowledgements
The authors thank Arthritis Research UK for their financial support of this work.
Version history
| Published | Title | Stage | Authors | Version |
| 2018 Apr 17 | Exercise interventions and patient beliefs for people with hip, knee or hip and knee osteoarthritis: a mixed methods review | Review | Michael Hurley, Kelly Dickson, Rachel Hallett, Robert Grant, Hanan Hauari, Nicola Walsh, Claire Stansfield, Sandy Oliver | |
| 2013 Dec 05 | Exercise interventions and patient beliefs for people with chronic hip and knee pain: a mixed methods review | Protocol | Michael Hurley, Kelly Dickson, Nicola Walsh, Hanan Hauari, Robert Grant, Jo Cumming, Sandy Oliver | |
Differences between protocol and review
The original protocol differed from the review with regard to the variables in the inclusion criteria. In the protocol, quantitative criteria were that studies must have measured pain, function, self‐efficacy or depression (major outcomes) with anxiety, quality of life and adverse effects of exercise listed as minor outcomes. In the review, it was stipulated that studies should either have measured pain or function and at least one psychosocial outcome (self‐efficacy, depression, anxiety or quality of life): therefore, pain and function were major outcomes in the review. Five trials used the 36‐item Short Form (SF‐36) measure of health‐related quality of life and the SF‐36 social function and mental health outcomes have been incorporated to reflect changes to quality of life. Insufficient information on adverse effects was provided in the studies to include it as a measure in the review.
Keywords
MeSH
Medical Subject Headings (MeSH) Keywords
- *Health Knowledge, Attitudes, Practice;
- Anxiety [rehabilitation];
- Arthralgia [*rehabilitation];
- Chronic Pain [psychology, rehabilitation];
- Depression [rehabilitation];
- Exercise Therapy [*psychology];
- Osteoarthritis, Hip [*psychology, *rehabilitation];
- Osteoarthritis, Knee [*psychology, *rehabilitation];
- Qualitative Research;
- Quality of Life;
- Randomized Controlled Trials as Topic;
- Self Efficacy;
- Social Participation;
- Symptom Assessment;
Medical Subject Headings Check Words
Humans; Middle Aged;
PICO

Complex reciprocal inter‐relationship between pain, physical and psychosocial function and exercise (Hurley 2003: permission for reproduction provided by the publishers, Wolters Kluwer).

Effect of erroneous health beliefs (Hurley 2003: permission for reproduction provided by the publishers, Wolters Kluwer).
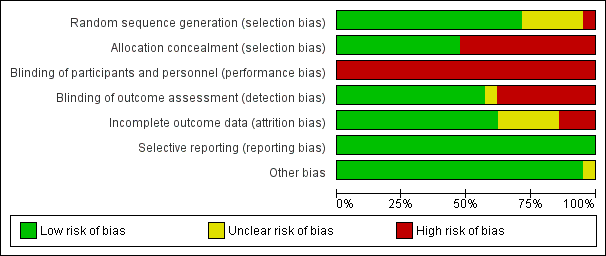
Risk of bias graph: review authors' judgements about each risk of bias item presented as percentages across all included studies.
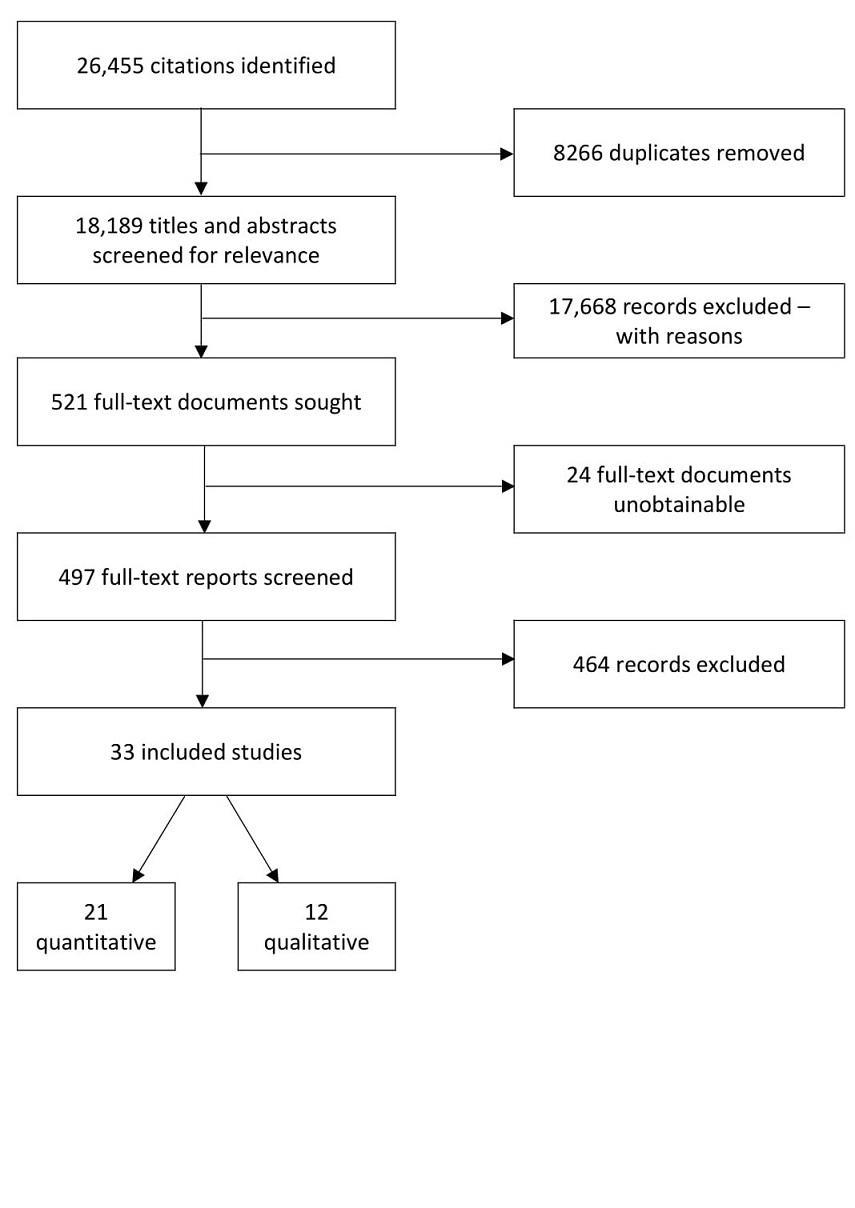
Flow chart of search and screening process.

Risk of bias summary: review authors' judgements about each risk of bias item for each included study.

Emergent themes from qualitative synthesis. OA: osteoarthritis.

Comparison 1 Exercise versus control, Outcome 1 Pain.

Comparison 1 Exercise versus control, Outcome 2 Physical function.

Comparison 1 Exercise versus control, Outcome 3 Self‐efficacy (SE).
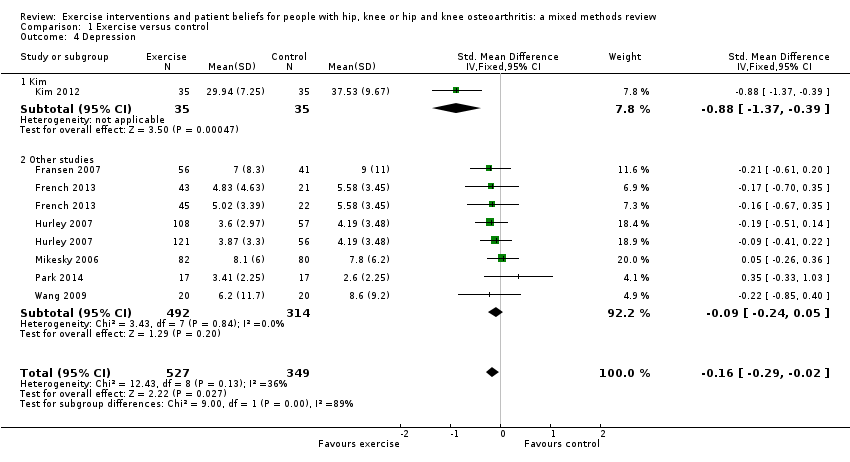
Comparison 1 Exercise versus control, Outcome 4 Depression.
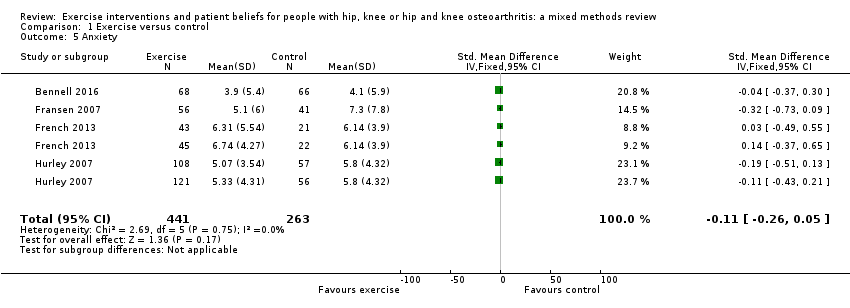
Comparison 1 Exercise versus control, Outcome 5 Anxiety.
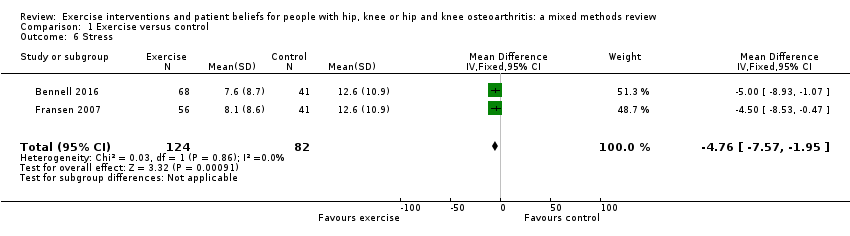
Comparison 1 Exercise versus control, Outcome 6 Stress.
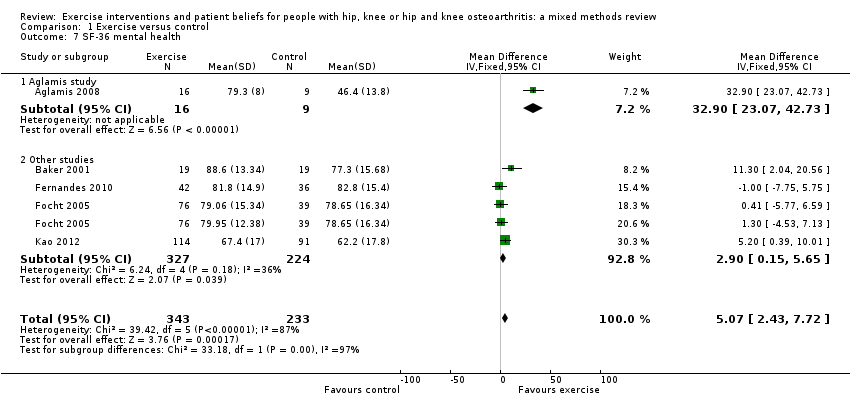
Comparison 1 Exercise versus control, Outcome 7 SF‐36 mental health.
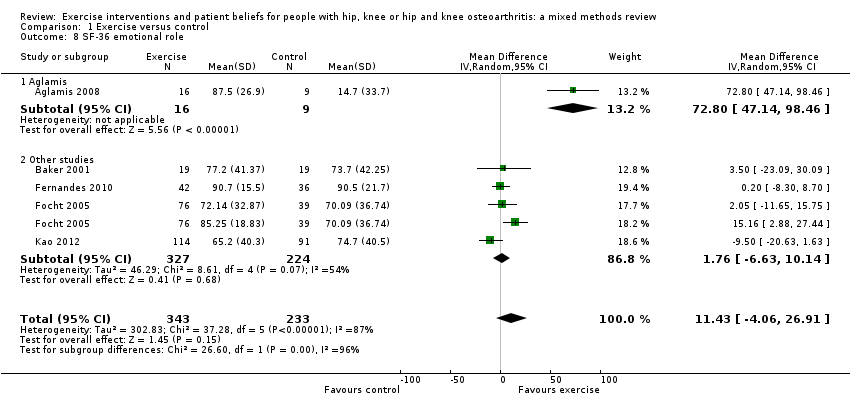
Comparison 1 Exercise versus control, Outcome 8 SF‐36 emotional role.

Comparison 1 Exercise versus control, Outcome 9 SF‐36 social function.

Comparison 1 Exercise versus control, Outcome 10 SF‐36 vitality.

Comparison 1 Exercise versus control, Outcome 11 Sleep.
| Physical and psychosocial outcomes in people with hip, knee or hip and knee osteoarthritis | ||||||
| Patient or population: people with chronic hip, knee or hip and knee osteoarthritis | ||||||
| Outcomes | Illustrative comparative risks* (95% CI) | Relative effect | No of Participants | Quality of the evidence | Comments | |
| Assumed risk | Corresponding risk | |||||
| Control | Exercise | |||||
| Pain. WOMAC normalised to 0‐20 pain scale based on largest study reporting the 0‐20 scale (Hurley 2007). Lower score indicated less pain. Mean duration of follow‐up: 45 weeks (range: 12 weeks to 30 months). | The mean WOMAC pain score was 6.5. | The mean pain in the intervention groups was 1.25 points lower (1.8 to 0.8 lower) | ‐ | 1058 (9 studies) | ⊕⊕⊕⊝ | 6% absolute pain reduction (95% CI ‐9% to ‐4%). 19% relative pain reduction (95% CI ‐27% to ‐11%). SMD ‐0.33 (95% CI ‐0.46 to ‐0.21). |
| Physical function. WOMAC function scales normalised to 0‐100. Lower score indicated improved physical function. Mean duration of follow‐up: 41 weeks (range: 9 weeks to 30 months). | The mean WOMAC function was 49.9. | The mean function in the intervention groups was 5.6 points lower (7.6 to 2.0 lower) | ‐ | 1599 | ⊕⊕⊕⊝ Moderate2 | 5.6% absolute function improvement (95% CI ‐7.6% to 2%). 11.2% relative function improvement (95% CI ‐15.2% to ‐4%). SMD ‐0.27 (95% CI ‐0.37 to ‐0.17). |
| Self‐efficacy. Self‐efficacy scores transformed to exercise beliefs score with score range from 17 to 85. Higher score indicated greater self‐efficacy. Mean duration of follow‐up: 35 weeks (range: 12 weeks to 18 months). | The mean self‐efficacy was 64.3. | The mean self‐efficacy in the intervention groups was 1.13 points higher (0.74 to 1.51 higher) | ‐ | 1138 | ⊕⊕⊝⊝ | 1.66% absolute increase in self‐efficacy (95% CI 1.08% to 2.20%). 1.76% relative increase (95% CI 1.14% to 2.23%). SMD 0.46 (95% CI 0.34 to 0.58). |
| Depression. Depression scores were transformed to the HADS depression scale with score range of 0‐21. Lower score indicated less depression. Mean duration of follow‐up: 35 weeks (range: 8 weeks to 30 months). | The mean depression was 3.5. | The mean depression in the intervention groups was 0.5 points lower (1.0 to 0.1 lower). | ‐ | 919 | ⊕⊕⊕⊝ | 2.4% absolute reduction in depression (95% CI ‐4.7% to ‐0.5%). The relative reduction was 14.3% (95% CI ‐2.8% to ‐28%). SMD ‐0.16 (95% CI‐0.29 to ‐0.02). |
| Anxiety. HADS scale of 0‐21. Lower score indicated lower anxiety levels. Mean duration of follow‐up: 24 weeks (range: 9 weeks to 12 months). | The mean anxiety was 5.8. | The mean anxiety in the intervention groups was 0.4 points lower (1.0 lower to 0.2 higher). | ‐ | 704 | ⊕⊕⊕⊝ | 2% absolute improvement in anxiety (95% CI ‐5% to 1%). The relative change was 6.9% (95% CI ‐17.2% to 3.4%). SMD ‐0.11 (95% CI ‐0.26 to 0.05). |
| SF‐36 social function. Domain of SF‐36 considered representative of quality of life: mental health domain largely covered by depression and anxiety above: scale of 0‐100. Higher score indicated improved social function. Mean duration of follow‐up: 36 weeks (range: 8 weeks to 18 months). | The mean social function was 73.6. | The mean SF‐36 social function in the intervention groups was 7.9 (4.1 to 11.6 higher). | ‐ | 576 | ⊕⊕⊝⊝ | 7.9% absolute improvement in social function (95% CI 4.1% to 11.6%). The relative improvement was 8.8% (95% CI 2.7% to 13.9%). |
| Adverse effects of treatment | ‐ | ‐ | ‐ | ‐ | ‐ | Studies did not provide information on adverse events. |
| *The basis for the assumed risk (e.g. the median control group risk across studies) is provided in footnotes. The corresponding risk (and its 95% confidence interval) is based on the assumed risk in the comparison group and the relative effect of the intervention (and its 95% CI). | ||||||
| GRADE Working Group grades of evidence | ||||||
| 1Pain downgraded one level due to high risk of bias for blinding of participants. 2Function downgraded one level due to high risk of bias for blinding of participants. 3Self‐efficacy downgraded two levels; one level due to moderate heterogeneity (I2 = 47%) probably due to different measures of self‐efficacy being used in each study, and one level due to high risk of blinding bias. 4Depression downgraded one level due to high risk of blinding bias. 5Anxiety downgraded one level due to high risk of blinding bias. | ||||||
| No | Study | Quality of evidence | |||||
| Dependabilityof findings | Credibilityof findings | ||||||
| Author | Low | Medium | High | Low | Medium | High | |
| 1 | ‐ | ‐ | ✔ | ‐ | ✔ | ‐ | |
| 2 | ‐ | ✔ | ‐ | ‐ | ✔ | ‐ | |
| 3 | ‐ | ‐ | ✔ | ‐ | ‐ | ✔ | |
| 4 | ‐ | ‐ | ✔ | ‐ | ‐ | ✔ | |
| 5 | ‐ | ‐ | ✔ | ‐ | ‐ | ✔ | |
| 6 | ‐ | ‐ | ✔ | ‐ | ✔ | ‐ | |
| 7 | ‐ | ✔ | ‐ | ‐ | ‐ | ✔ | |
| 8 | ‐ | ‐ | ✔ | ‐ | ✔ | ||
| 9 | ‐ | ‐ | ✔ | ‐ | ‐ | ✔ | |
| 10 | ‐ | ‐ | ✔ | ‐ | ‐ | ✔ | |
| 11 | ‐ | ‐ | ✔ | ‐ | ‐ | ✔ | |
| 12 | ‐ | ✔ | ‐ | ‐ | ‐ | ✔ | |
| Quality appraisal question | Answer options | |||
| Not at all/not stated | Few steps | Several steps | A thorough attempt | |
| 1. Were steps taken to increase rigour in sampling? | 0 studies | 1 study | 7 studies Fisken 2016; Hurley 2010; Larmer 2014b; Moody 2012; Morden 2011; Petursdottir 2010; Stone 2015 | 4 studies |
| 2. Were steps taken to increase rigour in data collection? | 0 studies | 0 studies | 7 studies Campbell 2001; Fisken 2016; Hinman 2016; Hurley 2010; Larmer 2014b; Moody 2012; Veenhof 2006 | 5 studies Hendry 2006; Morden 2011; Petursdottir 2010; Stone 2015; Thorstensson 2006 |
| 3. Were steps taken to increase rigour in data analysis? | 0 studies | 0 studies | 6 studies Campbell 2001; Fisken 2016; Hurley 2010; Larmer 2014b; Moody 2012; Stone 2015 | 6 studies Hendry 2006; Hinman 2016; Morden 2011; Petursdottir 2010; Thorstensson 2006; Veenhof 2006 |
| Quality appraisal question | No grounding | Limited grounding/support | Fairly well grounded | Well grounded/supported |
| 4. Were the findings of the study grounded in/supported by data? | 0 studies | 0 studies | 4 studies | 8 studies Hendry 2006; Hinman 2016; Hurley 2010; Larmer 2014b; Morden 2011; Petursdottir 2010; Stone 2015; Thorstensson 2006 |
| Quality appraisal question | Limited breadth and depth | Good/fair breadth, limited depth | Good/fair depth, limited breadth | Good/fair breadth and depth |
| 5. Breadth and depth of findings? | 0 studies | 3 studies | 3 studies | 6 studies Campbell 2001; Hendry 2006; Hinman 2016; Hurley 2010; Stone 2015; Thorstensson 2006 |
| Quality appraisal question | Not at all | A little | Somewhat | A lot |
| 6. To what extent did the study privilege the perspectives and experiences | 0 studies | 0 studies | 6 studies Fisken 2016; Hurley 2010; Moody 2012; Morden 2011; Thorstensson 2006; Veenhof 2006 | 6 studies Campbell 2001; Hendry 2006; Hinman 2016; Larmer 2014b; Petursdottir 2010; Stone 2015 |
| # | Review finding | Relevant papers | CERQual assessment of confidence in the evidence | Explanation of CERQual assessment |
| I. Symptoms | ||||
| Pain, muscle weakness, physical function: the experience of living with pain and its impact dominated people's narratives because it affected most areas of their daily life and became worse over time. Pain levels varied, and were described as episodic and unpredictable. | Campbell 2001; Hendry 2006; Hinman 2016; Hurley 2010; Morden 2011; Petursdottir 2010; Stone 2015 | High confidence | Low methodological limitations across all studies, with high coherence and high relevance. 3 countries and 4 geographical regions represented by 6 studies. | |
| Capacity to exercise: pain, joint stiffness, fatigue, comorbidity and people's perceptions of their physical fitness, both before and after exercise, restricted the type and amount of exercise people felt able to engage in. Additional efforts required to shower and change exacerbated the difficulties, and people also reported difficulties with fatigue after exercise sessions. | Campbell 2001; Hendry 2006; Hurley 2010; Moody 2012; Petursdottir 2010; Thorstensson 2006 | High confidence | Low methodological limitations for 5 of the 6 studies, high relevance for 5 of the 6 studies, and high coherence. 4 countries and 2 geographical regions represented. | |
| Impact of exercise on the effects of OA: some participants reported dramatic improvements in symptoms as a result of exercising, while some felt there was little or no benefit. Some people believed other treatment routes were more effective. However, for those who did benefit from exercise, function was improved and pain reduced allowing a return to more normal day‐to‐day activities that had been avoided. | Campbell 2001; Hendry 2006; Hinman 2016; Hurley 2010; Larmer 2014b; Moody 2012; Petursdottir 2010; Thorstensson 2006; Veenhof 2006 | High confidence | Findings applied to 9 studies, 8 having low methodological limitations and 6 having high relevance. Moderate coherence across the studies. 6 countries and 2 geographical regions represented. | |
| II Health beliefs and views on the management of OA | ||||
| Aetiology and prognosis of OA: people considered OA to be an inevitable result of placing stress on their joints, the ageing process or a hereditary condition, with limited hope of improvement. Expectations that the condition would worsen over time made it difficult to convince people of the scope for improvement through appropriate treatment. | Low confidence | 4 studies representing 2 countries from 2 different geographical regions. Methodological limitations low across all studies, relevance high in 3 of the 4 but medium coherence. | ||
| Non‐exercise management strategies: some people's understanding of how to manage their OA condition was limited to medication (analgesia) or surgery with little awareness of the role of exercise. Views on pain medication and surgery were mostly negative, with concerns of becoming addicted (to medication) and mixed views and hesitancy regarding surgery, with some people unsure it would work while others considered it a worthwhile option. There was a keenness to delay surgery as long as possible. | Low confidence | Low methodological limitations, but only 3 studies with medium‐to‐high relevance and medium coherence, all from the same country. | ||
| Advice and information from health professionals: participants described their experiences of receiving advice and information from health professionals. This was wide‐ranging in its usefulness and detail for people, and some formed negative beliefs due to limitations of the information they were provided with. | Campbell 2001; Hendry 2006; Hinman 2016; Hurley 2010; Petursdottir 2010; Thorstensson 2006 | Medium confidence | Low methodological limitations, high relevance in 5 of the 6 studies, 3 geographical regions represented by 4 countries. Medium coherence. | |
| Health beliefs and managing OA and exercise: attitudes towards exercise in OA were found to be closely linked to beliefs and perceptions regarding aetiology. Negative beliefs were widely held about the OA prognosis which in turn demotivated them from active management of the condition. Some were concerned about exacerbating the condition, and some felt they were too old for exercise to be of benefit. | Campbell 2001; Hendry 2006; Hinman 2016; Hurley 2010; Petursdottir 2010; Thorstensson 2006 | High confidence | Low methodological limitations across the 6 studies with high relevance for all except 1. Medium‐to‐high coherence. 4 countries and 2 geographical regions represented. | |
| Everyday activities (physical activity) versus structured exercise: this relates to whether people felt that general physical activities that took place in everyday life were sufficient to manage OA, or whether structured exercise sessions had additional benefits. Some people did not perceive a difference between the two, and did not see a need for structured exercise, while others felt normal daily activity was insufficient and needed to be supplemented with formal exercise. Some people worked to increase their general physical activity levels in the belief it would be helpful for their OA. | Hendry 2006; Moody 2012; Petursdottir 2010; Thorstensson 2006 | Low confidence | Low methodological limitations in 3 of only 4 studies, 2 regions and 4 countries represented, with high relevance but only medium coherence. | |
| III Psychological factors | ||||
| Impact of OA on people's sense of "self": the limitations of OA meant that activities that people had previously defined themselves by were now compromised. A new sense of self needed to be constructed to help overcome the negative psychological effects of this, taking on alternative social roles to ensure they maintained a sense of purpose and remained 'useful' despite incapacitation. Those who struggled to do so expressed negative emotions and the feeling of being a burden and frustrated with their limitations. | High confidence | 4 studies with low methodological limitations. Highly relevant data from 4 countries across 2 geographical regions. High coherence. | ||
| Individual disposition: high self‐efficacy and a positive outlook was seen as vital in ensuring people did not become defined by their OA. This involved the determination to find new ways to cope. Where self‐efficacy was low, there was an avoidance of physical activity because of the belief it would aggravate pain levels. | Low confidence | 2 studies, from 2 countries/regions with good methodological rigour and high relevance overall. However, medium coherence and lack of confidence in this review finding due to paucity of data. | ||
| Psychological benefits of exercise: people reported favourable psychological benefits of exercise. They also appreciated the peer support and social opportunities that accompanied group forms of exercise. | Fisken 2016; Hendry 2006; Hurley 2010; Larmer 2014b; Moody 2012; Morden 2011; Petursdottir 2010; Thorstensson 2006 | High confidence | 8 studies with overall low methodological limitations. Highly relevant data from 4 countries across 2 geographical regions. High coherence. | |
| Influence of programme supervisors: people who undertook supervised exercise programmes valued programme providers who understood their condition and encouraged and facilitated their engagement in exercise. | Campbell 2001; Hendry 2006; Hinman 2016; Hurley 2010; Larmer 2014b; Moody 2012; Petursdottir 2010; Thorstensson 2006; Veenhof 2006 | High confidence | 9 studies with overall low methodological limitations. Highly relevant data from 5 countries and 2 geographical regions. High coherence. | |
| IV Social and environmental factors | ||||
| Impact of OA on people's sense of "self": the limitations of OA meant that activities that people had previously defined themselves by were now compromised. A new sense of self needed to be constructed to help overcome the negative psychological effects of this, taking on alternative social roles to ensure they maintained a sense of purpose and remained 'useful' despite incapacitation. Those who struggled to do so expressed negative emotions and the feeling of being a burden and frustrated with their limitations. | High confidence | 4 studies with low methodological limitations. Highly relevant data from 4 countries across 2 geographical regions. High coherence. | ||
| Individual disposition: high self‐efficacy and a positive outlook was seen as vital in ensuring people did not become defined by their OA. This involved the determination to find new ways to cope. Where self‐efficacy was low, there was an avoidance of physical activity because of the belief it would aggravate pain levels. | Low confidence | 2 studies, from 2 countries/regions with good methodological rigour and high relevance overall. However, medium coherence and lack of confidence in this review finding due to paucity of data. | ||
| Psychological benefits of exercise: people reported favourable psychological benefits of exercise. They also appreciated the peer support and social opportunities that accompanied group forms of exercise. | Fisken 2016; Hendry 2006; Hurley 2010; Larmer 2014b; Moody 2012; Morden 2011; Petursdottir 2010; Thorstensson 2006 | High confidence | 8 studies with overall low methodological limitations. Highly relevant data from 4 countries across 2 geographical regions. High coherence. | |
| Influence of programme supervisors: people who undertook supervised exercise programmes valued programme providers who understood their condition and encouraged and facilitated their engagement in exercise. | Campbell 2001; Hendry 2006; Hinman 2016; Hurley 2010; Larmer 2014b; Moody 2012; Petursdottir 2010; Thorstensson 2006; Veenhof 2006 | High confidence | 9 studies with overall low methodological limitations. Highly relevant data from 5 countries and 2 geographical regions. High coherence. | |
| CERQual: Confidence in the Evidence from Reviews of Qualitative Research; OA: osteoarthritis. | ||||
| Integrative review | Implications for exercise programmes derived from the qualitative synthesis | Mean and 95% CI | ||||||||||||||
| Information/demonstrate improvement | Individually tailored interventions | Challenge beliefs | Practical support | |||||||||||||
| Trial (meta‐analysis comparison) | Recruitment | Intervention | 1 | 2 | 3 | 4 | 5 | 6 | 7 | 8 | 9 | Pain | Function | Self‐efficacy | Depression | Anxiety |
| Studies with a low risk of bias | ||||||||||||||||
| Local community. | 10 individual sessions of semi‐standardised exercises over 12 weeks plus exercises to perform 4 times a week at home. | √ | ‐ | √ | √ | ‐ | ‐ | ‐ | ‐ | √ | 0.21 ‐0.19 to 0.61 | 0.09 ‐0.31 to 0.49 | 0.05 ‐0.35 to 0.45 | ‐ | ‐ | |
| Community participants. | 10 treatments over 12 weeks of exercise or exercise and education. | √ | ‐ | √ | ‐ | ‐ | ‐ | ‐ | ‐ | √ | ‐0.33 ‐0.67 to 0.01 | ‐0.81 ‐1.17 to ‐0.46 | 0.61 0.26 to 0.96 | ‐ | ‐0.04 ‐0.37 to 0.30 | |
| Community through flyers, press releases and mailings via local physician practice. | Hatha yoga, once a week in a class + 4 shorter sessions a week at home. | ‐ | ‐ | √ | √ | ‐ | ‐ | ‐ | ‐ | √ | ‐0.86 ‐1.55 to ‐0.17 | ‐0.42 ‐1.08 to 0.24 | ‐ | ‐ | ‐ | |
| University hospital, local hospital, rehabilitation centre, general practitioners, and local newspaper advert. | 3 group‐based sessions and 1 individual physical therapy visit, 2 months after completing the group sessions. | √ | ‐ | √ | √ | ‐ | ‐ | √ | ‐ | ‐ | ‐0.30 ‐0.75 to 0.15 | ‐0.47 ‐0.92 to ‐0.02 | ‐ | ‐ | ||
| Local newspapers & social clubs, general practitioners and rheumatologists. | Tai Chi, twice a week, 12 weeks. | ‐ | ‐ | ‐ | √ | ‐ | ‐ | ‐ | ‐ | ‐ | ‐0.52 ‐0.93 to ‐0.11 | ‐0.66 ‐1.07 to ‐0.24 | ‐ | ‐0.21 ‐0.61 to 0.20 | ‐0.32 ‐0.73 to 0.09 | |
| General practitioners, rheumatologists, orthopaedic surgeons, and hospital consultants. | 6‐8 individual 30‐minute physiotherapy sessions over 8 weeks. Strength/resistance training and manual therapy + patient information. | √ | ‐ | √ | √ | ‐ | ‐ | ‐ | ‐ | ‐ | ‐0.43 ‐0.96 to 0.10 | ‐0.40 ‐0.83 to 0.03 | ‐ | ‐0.18 ‐0.61 to 0.24 | 0.04 ‐0.39 to 0.46 | |
| General practitioners, rheumatologists, orthopaedic surgeons, and hospital consultants. | 6‐8 individual 30‐minute physiotherapy sessions over 8 weeks. Strength/resistance training + patient information (no manual therapy). | √ | ‐ | √ | √ | ‐ | ‐ | ‐ | ‐ | ‐ | ‐0.55 ‐1.07 to ‐0.03 | ‐0.49 ‐0.92 to ‐0.07 | ‐ | ‐0.16 ‐0.58 to 0.26 | 0.15 ‐0.27 to 0.56 | |
| Inner‐city primary care practices. | Physiotherapist, twice a week, 6 weeks; individual exercise. | √ | ‐ | √ | √ | ‐ | ‐ | √ | ‐ | ‐ | ‐0.25 ‐0.56 to 0.07 | ‐0.15 ‐0.41 to 0.10 | 0.44 0.12 to 0.76 | ‐0.19 ‐0.50 to 0.13 | ‐0.19 ‐0.51 to 0.13 | |
| Inner‐city primary care practices. | Physiotherapist, twice a week, 6 weeks; group exercise. | √ | ‐ | √ | √ | ‐ | ‐ | √ | ‐ | ‐ | ‐0.13 ‐0.45 to 0.19 | 0.06 ‐0.19 to 0.19 | 0.42 0.09 to 0.75 | ‐0.09 ‐0.42 to 0.23 | ‐0.11 ‐0.43 to 0.21 | |
| Studies with a high risk of bias | ||||||||||||||||
| ‐ | ‐ | √ | ‐ | ‐ | √ | ‐ | ‐ | ‐ | ‐ | ‐ | ‐0.54 ‐1.37 to 0.30 | ‐0.64 ‐1.48 to 0.20 | ‐ | ‐ | ‐ | |
| ‐ | ‐ | ‐ | ‐ | √ | √ | ‐ | ‐ | ‐ | ‐ | ‐ | ‐0.56 ‐1.16 to 0.05 | ‐0.48 ‐1.08 to 0.12 | ‐ | ‐ | ‐ | |
| ‐ | ‐ | ‐ | ‐ | √ | √ | √ | ‐ | ‐ | ‐ | ‐ | ‐0.23 ‐0.62 to 0.16 | ‐0.17 ‐0.22 to 0.56 | 0.44* 0.05 to 0.83 | ‐ | ‐ | |
| ‐ | ‐ | ‐ | ‐ | √ | √ | √ | ‐ | ‐ | ‐ | ‐ | ‐0.05 ‐0.33 to 0.44 | ‐0.3 ‐0.42 to 0.36 | ‐ | ‐ | ‐ | |
| ‐ | ‐ | √ | ‐ | ‐ | √ | ‐ | ‐ | ‐ | ‐ | ‐ | ‐0.15 ‐0.55 to 0.24 | ‐ | 0.89* 0.47 to 1.30 | ‐ | ‐ | |
| ‐ | ‐ | √ | √ | ‐ | √ | ‐ | ‐ | ‐ | ‐ | ‐ | 0.54 0.26 to 0.82 | ‐ | ‐ | ‐ | ‐ | |
| ‐ | ‐ | √ | √ | √ | √ | ‐ | ‐ | ‐ | ‐ | ‐ | ‐0.13 ‐0.51 to 0.76 | ‐ | 0.36 ‐0.44 to 1.15 | ‐ | ‐ | |
| ‐ | ‐ | √ | √ | √ | √ | ‐ | ‐ | ‐ | ‐ | ‐ | ‐0.42 ‐1.10 to 0.27 | ‐ | ‐0.07 ‐0.89 to 0.74 | ‐ | ‐ | |
| ‐ | ‐ | √ | √ | ‐ | √ | ‐ | ‐ | ‐ | ‐ | √ | ‐0.60 ‐1.07 to 0.12 | ‐ | 1.04 0.05 to 1.54 | ‐0.88 ‐0.37 to 0.39 | ‐ | |
| ‐ | ‐ | ‐ | ‐ | ‐ | √ | ‐ | ‐ | ‐ | ‐ | √ | ‐0.56 ‐0.88 to ‐0.25 | 0.10 ‐0.21 to 0.41 | ‐ | 0.05 ‐0.26 to 0.36 | ‐ | |
| ‐ | ‐ | ‐ | ‐ | ‐ | ‐ | ‐ | ‐ | ‐ | ‐ | ‐ | ‐ | ‐ | ‐ | 0.35 ‐0.33 to 1.03 | ‐ | |
| ‐ | ‐ | ‐ | ‐ | ‐ | ‐ | ‐ | ‐ | ‐ | ‐ | ‐ | ‐0.04 ‐0.32 to 0.39 | ‐ | ‐ | ‐ | ‐ | |
| ‐ | ‐ | √ | √ | √ | √ | ‐ | ‐ | ‐ | ‐ | ‐ | ‐ | ‐0.22 ‐0.52 to 0.08 | ‐0.95* 0.04 to 1.87 | ‐ | ‐ | |
| ‐ | ‐ | √ | ‐ | ‐ | ‐ | ‐ | ‐ | ‐ | ‐ | ‐ | ‐0.40 ‐0.95 to 0.16 | ‐ | ‐0.16 ‐0.70 to 0.39 | ‐ | ‐ | |
| ‐ | ‐ | ‐ | ‐ | ‐ | √ | ‐ | ‐ | ‐ | ‐ | ‐ | ‐0.68 ‐1.32 to ‐0.04 | ‐0.17 ‐0.31 to ‐0.03 | 0.71 0.07 to 1.35 | ‐ | ‐ | |
| ‐ | ‐ | √ | ‐ | ‐ | ‐ | ‐ | ‐ | ‐ | ‐ | ‐ | ‐0.17 ‐0.53 to 0.19 | ‐ | 0.32 ‐0.04 to 0.69 | ‐ | ‐ | |
| CI: confidence interval. | ||||||||||||||||
| Outcome or subgroup title | No. of studies | No. of participants | Statistical method | Effect size |
| 1 Pain Show forest plot | 19 | 2144 | Std. Mean Difference (IV, Fixed, 95% CI) | ‐0.20 [‐0.28, ‐0.11] |
| 1.1 WOMAC pain | 9 | 1058 | Std. Mean Difference (IV, Fixed, 95% CI) | ‐0.33 [‐0.46, ‐0.21] |
| 1.2 Other pain outcomes | 10 | 1086 | Std. Mean Difference (IV, Fixed, 95% CI) | ‐0.07 [‐0.19, 0.05] |
| 2 Physical function Show forest plot | 13 | 1599 | Std. Mean Difference (IV, Fixed, 95% CI) | ‐0.27 [‐0.37, ‐0.17] |
| 3 Self‐efficacy (SE) Show forest plot | 11 | 1138 | Std. Mean Difference (IV, Fixed, 95% CI) | 0.46 [0.34, 0.58] |
| 3.1 Six‐minute walk SE | 1 | 115 | Std. Mean Difference (IV, Fixed, 95% CI) | 0.44 [0.05, 0.83] |
| 3.2 Lorig SE exercise scale | 2 | 168 | Std. Mean Difference (IV, Fixed, 95% CI) | 0.95 [0.63, 1.27] |
| 3.3 ExBeliefs SE | 1 | 338 | Std. Mean Difference (IV, Fixed, 95% CI) | 0.43 [0.20, 0.66] |
| 3.4 Arthritis SE scale | 1 | 54 | Std. Mean Difference (IV, Fixed, 95% CI) | 0.15 [‐0.42, 0.72] |
| 3.5 McAuley SE exercise scale | 1 | 21 | Std. Mean Difference (IV, Fixed, 95% CI) | 0.95 [0.04, 1.87] |
| 3.6 VAP SE | 1 | 52 | Std. Mean Difference (IV, Fixed, 95% CI) | ‐0.16 [‐0.70, 0.39] |
| 3.7 Arthritis SE scale ‐ pain | 1 | 120 | Std. Mean Difference (IV, Fixed, 95% CI) | 0.32 [‐0.04, 0.69] |
| 3.8 SE Score | 1 | 40 | Std. Mean Difference (IV, Fixed, 95% CI) | 0.71 [0.07, 1.35] |
| 3.9 ASES pain | 2 | 230 | Std. Mean Difference (IV, Fixed, 95% CI) | 0.37 [0.11, 0.63] |
| 4 Depression Show forest plot | 7 | 876 | Std. Mean Difference (IV, Fixed, 95% CI) | ‐0.16 [‐0.29, ‐0.02] |
| 4.1 Kim | 1 | 70 | Std. Mean Difference (IV, Fixed, 95% CI) | ‐0.88 [‐1.37, ‐0.39] |
| 4.2 Other studies | 6 | 806 | Std. Mean Difference (IV, Fixed, 95% CI) | ‐0.09 [‐0.24, 0.05] |
| 5 Anxiety Show forest plot | 4 | 704 | Std. Mean Difference (IV, Fixed, 95% CI) | ‐0.11 [‐0.26, 0.05] |
| 6 Stress Show forest plot | 2 | 206 | Mean Difference (IV, Fixed, 95% CI) | ‐4.76 [‐7.57, ‐1.95] |
| 7 SF‐36 mental health Show forest plot | 5 | 576 | Mean Difference (IV, Fixed, 95% CI) | 5.07 [2.43, 7.72] |
| 7.1 Aglamis study | 1 | 25 | Mean Difference (IV, Fixed, 95% CI) | 32.9 [23.07, 42.73] |
| 7.2 Other studies | 4 | 551 | Mean Difference (IV, Fixed, 95% CI) | 2.90 [0.15, 5.65] |
| 8 SF‐36 emotional role Show forest plot | 5 | 576 | Mean Difference (IV, Random, 95% CI) | 11.43 [‐4.06, 26.91] |
| 8.1 Aglamis | 1 | 25 | Mean Difference (IV, Random, 95% CI) | 72.8 [47.14, 98.46] |
| 8.2 Other studies | 4 | 551 | Mean Difference (IV, Random, 95% CI) | 1.76 [‐6.63, 10.14] |
| 9 SF‐36 social function Show forest plot | 1 | 25 | Mean Difference (IV, Fixed, 95% CI) | 58.30 [34.58, 82.02] |
| 9.1 Aglamis | 1 | 25 | Mean Difference (IV, Fixed, 95% CI) | 58.30 [34.58, 82.02] |
| 10 SF‐36 vitality Show forest plot | 5 | 1158 | Mean Difference (IV, Fixed, 95% CI) | 6.06 [3.57, 8.54] |
| 10.1 Aglamis | 1 | 25 | Mean Difference (IV, Fixed, 95% CI) | 51.9 [34.74, 69.06] |
| 10.2 Other studies | 4 | 582 | Mean Difference (IV, Fixed, 95% CI) | 3.90 [0.55, 7.25] |
| 10.3 Other studies | 4 | 551 | Mean Difference (IV, Fixed, 95% CI) | 6.58 [2.78, 10.38] |
| 11 Sleep Show forest plot | 1 | 36 | Mean Difference (IV, Fixed, 95% CI) | ‐1.10 [‐2.54, 0.34] |