Terapias anti‐IL5 para el asma
Información
- DOI:
- https://doi.org/10.1002/14651858.CD010834.pub3Copiar DOI

- Base de datos:
-
- Cochrane Database of Systematic Reviews
- Versión publicada:
-
- 21 septiembre 2017see what's new
- Tipo:
-
- Intervention
- Etapa:
-
- Review
- Grupo Editorial Cochrane:
-
Grupo Cochrane de Vías respiratorias
- Copyright:
-
- Copyright © 2017 The Cochrane Collaboration. Published by John Wiley & Sons, Ltd.
Cifras del artículo
Altmetric:
Citado por:
Autores
Contributions of authors
On the current version of this review, SM, HF and CP contributed to the rewriting of the Background and Methods sections. HF and CP independently selected trials for the review, HF and AW extracted the data, and HF entered the data into the RevMan 2014 file with cross‐checking by Christopher Cates, the Cochrane Airways Group statistician. HF, SM and AW wrote the Results section, and HF, CP and SM co‐authored the Discussion and Conclusions.
On the previous version (Powell 2015), SM, KD, NW and CP contributed to the writing of the protocol. NW and CP independently selected trials for the review, NW and LB extracted the data, and KD entered the data into the RevMan 2014 file with cross‐checking by SM. KD and SM wrote the Results section, and NW, LB, CP, KD and SM coauthored the Discussion and Conclusions.
Sources of support
Internal sources
-
The authors declare that no such funding was received for this systematic review, Other.
External sources
-
The authors declare that no such funding was received for this systematic review, Other.
Declarations of interest
HF: none known.
AW: none known.
CP: none known.
LB: none known.US Food & Drug Administration
SM: none known.
Acknowledgements
We would particularly like to acknowledge the excellent support and assistance from Emma Dennett, Liz Stovold and Emma Jackson of the Cochrane Airways Review Group, together with the greatly appreciated guidance from Chris Cates (Cochrane Airways Review Group Co‐ordinating Editor). The support provided by librarians Judith Scammel, Jane Appleton and Hilary Garrett at St George's University of London is also greatly appreciated. We thank Dr Anette Blümle and Dr Birgit Smith for their excellent support with translation.
Chris Cates was the Editor for this review and commented critically on the review.
The information provided by Prof. Peter Barnes regarding a study included in the previous version of this review (Leckie 2000) and the support provided by Birgit Smith, Jane Dennis, Laura Sansum and Anette Blümle with translation on non‐English trial reports is also very much appreciated.
The Background and Methods section of this review are based on a standard template used by Cochrane Airways.
We gratefully acknowledge the significant contribution on the previous version of this review Powell 2015 by Kerry Dwan (KD) and Nicola Walters (NW).
This project was supported by the National Institute for Health Research (NIHR), via Cochrane Infrastructure funding to the Cochrane Airways Group. The views and opinions expressed therein are those of the authors and do not necessarily reflect those of the Systematic Reviews Programme, NIHR, NHS, or the Department of Health.
Version history
| Published | Title | Stage | Authors | Version |
| 2022 Jul 12 | Anti‐IL‐5 therapies for asthma | Review | Hugo A Farne, Amanda Wilson, Stephen Milan, Emma Banchoff, Freda Yang, Colin VE Powell | |
| 2017 Sep 21 | Anti‐IL5 therapies for asthma | Review | Hugo A Farne, Amanda Wilson, Colin Powell, Lynne Bax, Stephen J Milan | |
| 2015 Jul 27 | Mepolizumab versus placebo for asthma | Review | Colin Powell, Stephen J Milan, Kerry Dwan, Lynne Bax, Nicola Walters | |
| 2013 Nov 15 | Mepolizumab versus placebo for asthma | Protocol | Colin Powell, Stephen J Milan, Kerry Dwan, Nicola Walters | |
Differences between protocol and review
We initially planned to use a fixed‐effect model for meta‐analysis, but we agreed with a peer reviewer who suggested that a random‐effects model was more appropriate in view of the substantial clinical heterogeneity between the trials.
The scope was broadened to encompass all anti‐IL‐5 therapies, that is, including reslizumab and benralizumab in addition to mepolizumab. Since the previous review, reslizumab has been licensed and benralizumab has entered phase 3 clinical trials with a licensing decision due from the US Food & Drug Administration and European Medicines Agency in 2017. These agents are all designed for the same patients and are therefore comparable.
Data from study arms on doses not deemed clinically relevant (e.g. 10 times more or less than the dose that has marketing approval) was excluded. Similarly studies where an additional intervention was the withdrawal of systemic corticosteroid were also excluded.
Outcomes were revised to focus on validated symptom scores (i.e. excluding non‐validated scores, as these cannot be readily compared across studies) and only a pre‐bronchodilator measure of lung function (as per American Thoracic Society/European Respiratory Society guidelines on standardising endpoints for clinical asthma trials). Subgroups were set as eosinophilic or otherwise, as these agents are primarily designed for eosinophilic asthma.
The original protocol stated that included trials should be a minimum of 16 weeks in duration; we have clarified that there should be a minimum of 16 weeks treatment.
Congenital heart disease had been listed as an exclusion criteria previously but this was removed as there was no reason why these conditions in particular should be excluded.
The number of studies identified was insufficient to conduct subgroup analyses or formally assess for reporting bias.
Keywords
MeSH
Medical Subject Headings (MeSH) Keywords
- Adrenal Cortex Hormones [administration & dosage];
- Anti‐Asthmatic Agents [*administration & dosage, adverse effects];
- Antibodies, Monoclonal, Humanized [*administration & dosage, adverse effects];
- Asthma [etiology, *therapy];
- Disease Progression;
- Injections, Intravenous;
- Injections, Subcutaneous;
- Interleukin‐5 [*antagonists & inhibitors];
- Quality of Life;
- Randomized Controlled Trials as Topic;
- Receptors, Interleukin‐5 [*antagonists & inhibitors];
Medical Subject Headings Check Words
Adolescent; Adult; Child; Humans;
PICO

Study flow diagram

Risk of bias graph: review authors' judgements about each risk of bias item presented as percentages across all included studies
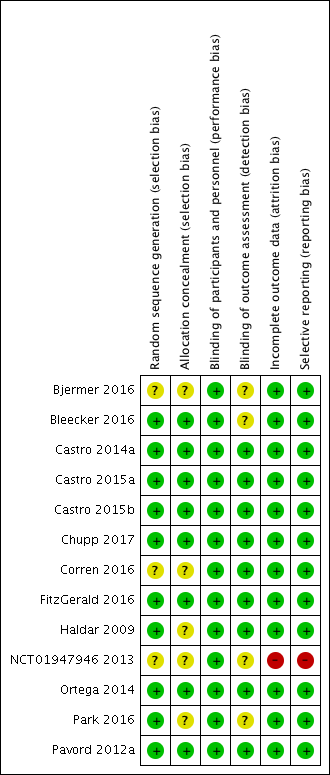
Risk of bias summary: review authors' judgements about each risk of bias item for each included study

Comparison 1 Mepolizumab (SC) versus placebo, Outcome 1 Rate of exacerbations requiring systemic corticosteroids.

Comparison 1 Mepolizumab (SC) versus placebo, Outcome 2 Rate of exacerbations requiring emergency department treatment or admission.
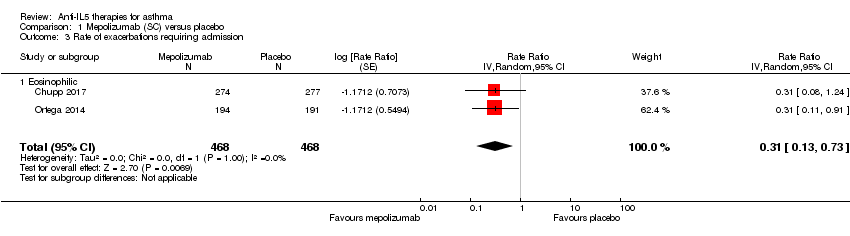
Comparison 1 Mepolizumab (SC) versus placebo, Outcome 3 Rate of exacerbations requiring admission.
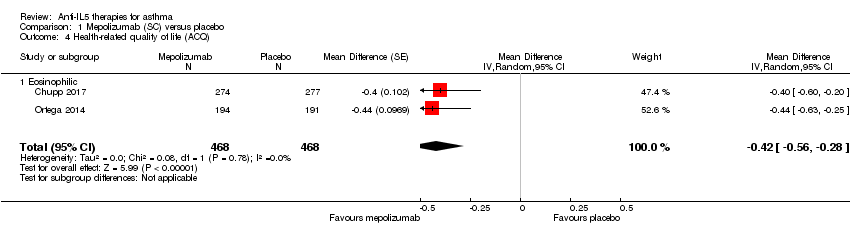
Comparison 1 Mepolizumab (SC) versus placebo, Outcome 4 Health‐related quality of life (ACQ).

Comparison 1 Mepolizumab (SC) versus placebo, Outcome 5 Health‐related quality of life (SGRQ).
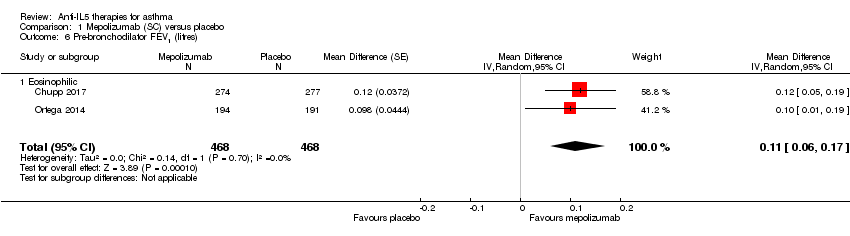
Comparison 1 Mepolizumab (SC) versus placebo, Outcome 6 Pre‐bronchodilator FEV1 (litres).
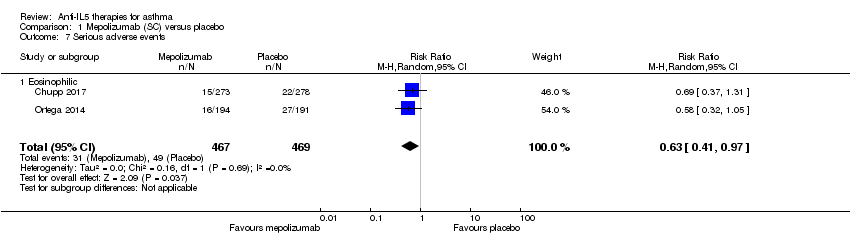
Comparison 1 Mepolizumab (SC) versus placebo, Outcome 7 Serious adverse events.
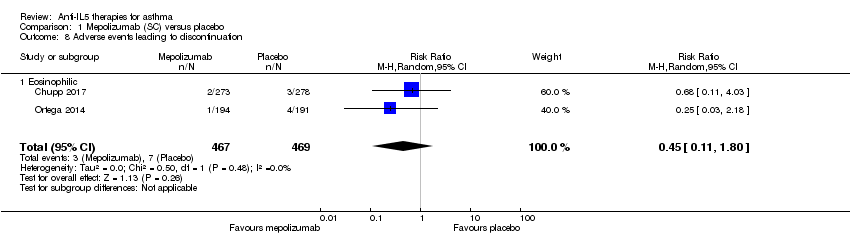
Comparison 1 Mepolizumab (SC) versus placebo, Outcome 8 Adverse events leading to discontinuation.

Comparison 2 Mepolizumab (IV) versus placebo, Outcome 1 Rate of clinically significant exacerbations.

Comparison 2 Mepolizumab (IV) versus placebo, Outcome 2 Rate of exacerbations requiring emergency department treatment or admission.

Comparison 2 Mepolizumab (IV) versus placebo, Outcome 3 Rate of exacerbations requiring admission.

Comparison 2 Mepolizumab (IV) versus placebo, Outcome 4 People with one or more exacerbations.

Comparison 2 Mepolizumab (IV) versus placebo, Outcome 5 Health‐related quality of life (AQLQ).

Comparison 2 Mepolizumab (IV) versus placebo, Outcome 6 Health‐related quality of life (ACQ).
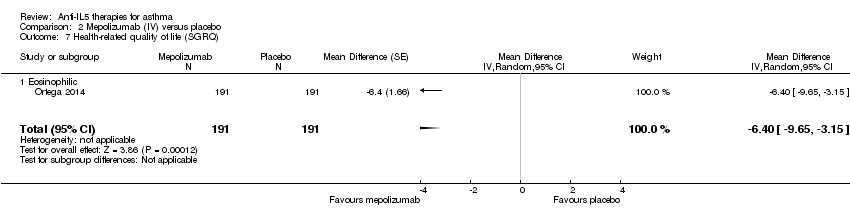
Comparison 2 Mepolizumab (IV) versus placebo, Outcome 7 Health‐related quality of life (SGRQ).

Comparison 2 Mepolizumab (IV) versus placebo, Outcome 8 Pre‐bronchodilator FEV1 (litres).

Comparison 2 Mepolizumab (IV) versus placebo, Outcome 9 Serious adverse events.

Comparison 2 Mepolizumab (IV) versus placebo, Outcome 10 Adverse events leading to discontinuation.
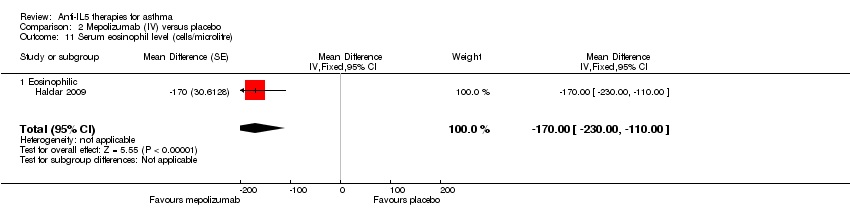
Comparison 2 Mepolizumab (IV) versus placebo, Outcome 11 Serum eosinophil level (cells/microlitre).

Comparison 3 Reslizumab (IV) versus placebo, Outcome 1 Rate of exacerbations requiring systemic corticosteroids.

Comparison 3 Reslizumab (IV) versus placebo, Outcome 2 Rate of exacerbations requiring emergency department treatment or admission.

Comparison 3 Reslizumab (IV) versus placebo, Outcome 3 Health‐related quality of life (AQLQ).
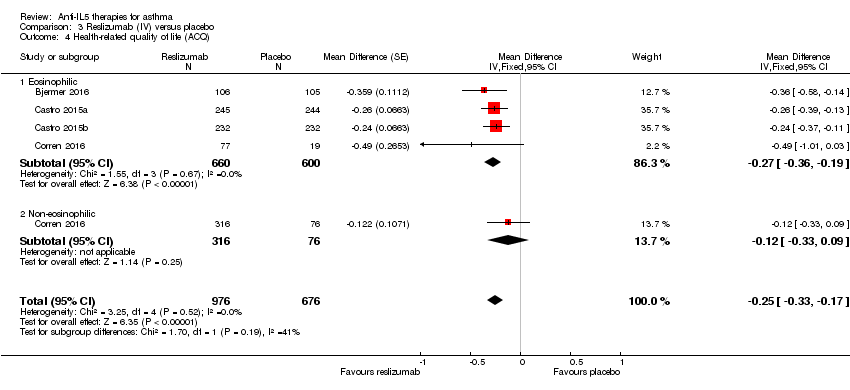
Comparison 3 Reslizumab (IV) versus placebo, Outcome 4 Health‐related quality of life (ACQ).

Comparison 3 Reslizumab (IV) versus placebo, Outcome 5 Pre‐bronchodilator FEV1 (litres).

Comparison 3 Reslizumab (IV) versus placebo, Outcome 6 Serious adverse events.
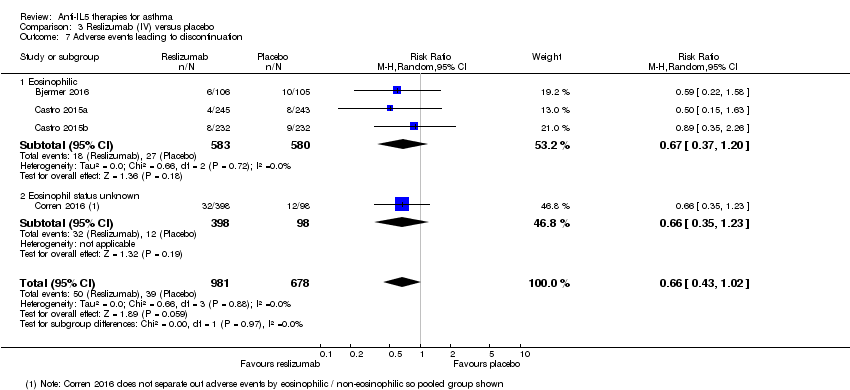
Comparison 3 Reslizumab (IV) versus placebo, Outcome 7 Adverse events leading to discontinuation.

Comparison 3 Reslizumab (IV) versus placebo, Outcome 8 Serum eosinophil level (cells/microlitre).

Comparison 4 Benralizumab (SC) versus placebo, Outcome 1 Rate of exacerbations requiring systemic corticosteroids.

Comparison 4 Benralizumab (SC) versus placebo, Outcome 2 Rate of exacerbations requiring emergency department treatment or admission.

Comparison 4 Benralizumab (SC) versus placebo, Outcome 3 Health‐related quality of life (AQLQ mean difference).

Comparison 4 Benralizumab (SC) versus placebo, Outcome 4 Health‐related quality of life (ACQ mean difference).

Comparison 4 Benralizumab (SC) versus placebo, Outcome 5 Pre‐bronchodilator FEV1 (litres).
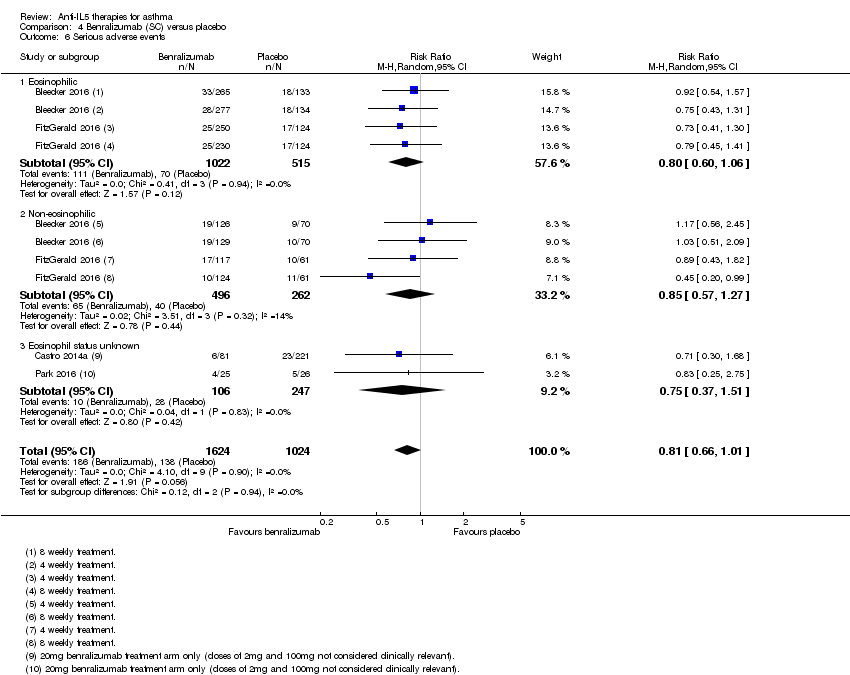
Comparison 4 Benralizumab (SC) versus placebo, Outcome 6 Serious adverse events.

Comparison 4 Benralizumab (SC) versus placebo, Outcome 7 Adverse events leading to discontinuation.

Comparison 4 Benralizumab (SC) versus placebo, Outcome 8 Serum eosinophil level (% change from baseline).
| Mepolizumab (SC) compared to placebo for asthma | ||||||
| Patient or population: people with asthma | ||||||
| Outcomes | Anticipated absolute effects* (95% CI) | Relative effect | № of participants | Quality of the evidence | Comments | |
| Risk with placebo | Risk with mepolizumab (SC) | |||||
| Rate of exacerbations requiring systemic corticosteroids | The mean rate in the placebo group was 1.48 events per participant per yeara | The mean rate in the intervention group was 0.81 fewer events per participant per year (95% CI 0.66 fewer to 0.94 fewer) | Rate ratio 0.45 (0.36 to 0.55) | 936 | ⊕⊕⊕⊕ | |
| Rate of exacerbations requiring emergency department treatment or admission | The mean rate in the placebo group was 0.15 events per patient per yearb | The mean rate in the intervention group was 0.10 fewer events per participant per year (95% CI 0.05 fewer to 0.12 fewer) | Rate ratio 0.36 (0.20 to 0.66) | 936 | ⊕⊕⊕⊕ | |
| Health‐related quality of life (ACQ) | The mean change in the placebo group ranged from −0.4 to −0.5 units | The mean in the intervention group was ‐0.42 units fewer (‐0.56 fewer to ‐0.28 fewer) | ‐ | 936 | ⊕⊕⊕⊝ | A change of ≥ 0.5 is considered the minimum clinically significant difference |
| Health‐related quality of life (SGRQ) | The mean change in the placebo group ranged from −7.9 to −9.0 units | The mean change in the intervention group was ‐7.4 units fewer (‐9.5 fewer to ‐5.29 fewer) | ‐ | 936 | ⊕⊕⊕⊕ | A change of ≥ 4 is considered the minimum clinically significant difference |
| Pre‐bronchodilator FEV1 (L) | The mean change in the placebo group ranged from 0.086 L (± 0.031 L) to 0.120 L (0.047 to 0.192 L) | The mean difference from placebo was a further 0.11 L (0.06 L to 0.17 L) | ‐ | 936 | ⊕⊕⊕⊕ | |
| Adverse events leading to discontinuation | 15 per 1000 | 7 per 1000 | Risk ratio 0.45 | 936 | ⊕⊕⊕⊝ | |
| *The risk in the intervention group (and its 95% confidence interval) is based on the assumed risk in the comparison group and the relative effect of the intervention (and its 95% CI). | ||||||
| GRADE Working Group grades of evidence | ||||||
| aRounded mean of the rate in the placebo group of the two studies: 1.21 and 1.74. | ||||||
| Mepolizumab (IV) compared to placebo for asthma | ||||||
| Patient or population: people with asthma | ||||||
| Outcomes | Anticipated absolute effects* (95% CI) | Relative effect | № of participants | Quality of the evidence | Comments | |
| Risk with placebo | Risk with mepolizumab (IV) | |||||
| Rate of clinically significant exacerbations | The mean rate in the placebo group was 2.51 events per participant per yeara | The mean rate in the intervention groups was 1.18 fewer events per participant per year (1.41 fewer to 0.90 fewer) | Rate ratio 0.53 | 751 | ⊕⊕⊕⊝ | |
| Rate of exacerbations requiring emergency department treatment or admission | The mean rate in the placebo group was 0.32 events per participant per yearb | The mean rate in the intervention groups was 0.15 fewer events per participant per year (0.22 fewer to 0.04 fewer) | Rate ratio 0.52 | 690 | ⊕⊕⊕⊝ | |
| Health‐related quality of life (AQLQ) | The mean change in the placebo group ranged from 0.18 to 0.71 units | MD 0.21 higher | ‐ | 677 | ⊕⊕⊕⊝ | A change of ≥ 0.5 is considered the minimum clinically significant difference |
| Health‐related quality of life (ACQ) | The mean change in the placebo group ranged from −0.59 to −0.50 units | MD ‐0.11 lower | ‐ | 369 | ⊕⊕⊕⊝ | A change of ≥ 0.5 is considered the minimum clinically significant difference |
| Pre‐bronchodilator FEV1 (L) | The mean change in the placebo group ranged from 0.060 L (± 0.038 L) to 0.086 L (± 0.031 L) | MD 0.08 L (0.02 L higher to 0.15 L higher) | ‐ | 690 | ⊕⊕⊕⊝ | |
| Adverse events leading to discontinuation | 26 per 1000 | 19 per 1000 | RR 0.72 | 751 | ⊕⊕⊕⊝ | |
| *The risk in the intervention group (and its 95% confidence interval) is based on the assumed risk in the comparison group and the relative effect of the intervention (and its 95% CI). | ||||||
| GRADE Working Group grades of evidence | ||||||
| aRounded mean of the rate in the placebo group of the three studies: 1.74, 2.40 and 3.4. | ||||||
| Reslizumab (IV) compared to placebo for asthma | ||||||
| Patient or population: people with asthma | ||||||
| Outcomes | Anticipated absolute effects* (95% CI) | Relative effect | № of participants | Quality of the evidence | Comments | |
| Risk with placebo | Risk with reslizumab (IV) | |||||
| Rate of exacerbations requiring systemic corticosteroids | The mean rate in the placebo group was 1.54 events per participant per year | The mean rate in the intervention groups was 0.93 fewer events per participant per year (1.09 fewer to 0.73 fewer) | Rate ratio 0.43 | 953 | ⊕⊕⊕⊕ | |
| Rate of exacerbations requiring emergency department treatment or admission | The mean rate in the placebo group was 0.12 events per participant per year | The mean rate in the intervention groups was 0.04 fewer events per participant per year (0.07 fewer to 0.02 more) | Rate ratio 0.67 | 953 | ⊕⊕⊕⊕ | |
| Health‐related quality of life (AQLQ) | The mean change in the placebo group ranged from 0.779 to 0.89 units | MD 0.28 higher | ‐ | 1164 | ⊕⊕⊕⊕ | A change of ≥ 0.5 is considered the minimum clinically significant difference |
| Health‐related quality of life (ACQ) | The mean change in the placebo group ranged from −0.368 to −0.80 units | MD ‐0.25 lower | ‐ | 1652 | ⊕⊕⊕⊕ | A change of ≥ 0.5 is considered the minimum clinically significant difference |
| Pre‐bronchodilator FEV1 (L) | The mean change in the placebo group ranged from 0.002 L (± 0.1216 L) to 0.215 (± 0.0484 L) | MD 0.11 L higher | ‐ | 1652 | ⊕⊕⊕⊕ | |
| Serious adverse events | 91 per 1000 | 72 per 1000 | RR 0.79 | 1656 | ⊕⊕⊕⊕ | |
| Adverse events leading to discontinuation | 58 per 1000 | 38 per 1000 | RR 0.66 | 1659 | ⊕⊕⊕⊕ | |
| *The risk in the intervention group (and its 95% confidence interval) is based on the assumed risk in the comparison group and the relative effect of the intervention (and its 95% CI). | ||||||
| GRADE Working Group grades of evidence | ||||||
| a The mean difference (0.28) is smaller than the minimum clinically significant difference (a reduction of 0.5 points). | ||||||
| Benralizumab (SC) compared to placebo for asthma | ||||||
| Patient or population: people with asthma | ||||||
| Outcomes | Anticipated absolute effects* (95% CI) | Relative effect | № of participants | Quality of the evidence | Comments | |
| Risk with placebo | Risk with benralizumab (SC) | |||||
| Rate of exacerbations requiring systemic corticosteroids | The mean rate in the placebo group was 0.98 events per participant per yeara | The mean rate in the intervention groups was 0.37 fewer events per participant per year (0.44 fewer to 0.29 fewer) | Rate ratio 0.62 | 2456 | ⊕⊕⊕⊕ | |
| Rate of exacerbations requiring emergency department treatment or admission | The mean rate in the placebo group was 0.11 events per participant per yearb | The mean rate in the intervention groups was 0.04 fewer events per participant per year (0.06 fewer to 0.002 fewer) | Rate ratio 0.68 | 1537 | ⊕⊕⊕⊝ | There is greater heterogeneity (I² = 43%) owing to inclusion of less severe participants in FitzGerald 2016 (a larger proportion who had only suffered one exacerbation the previous year, with correspondingly less potential for exacerbation) |
| Health‐related quality of life (AQLQ) | The mean change in the placebo group ranged from 0.98 to 1.31 units | MD 0.23 higher | ‐ | 1541 | ⊕⊕⊕⊕ | A change of ≥ 0.5 is considered the minimum clinically significant difference |
| Health‐related quality of life (ACQ) | The mean change in the placebo group ranged from −1.19 to −0.76 units | MD ‐0.20 lower | ‐ | 2359 | ⊕⊕⊕⊕ | A change of ≥ 0.5 is considered the minimum clinically significant difference |
| Pre‐bronchodilator FEV1 (L) | The mean change in the placebo group ranged from ‐0.01 L to 0.239 L | MD 0.10 L higher | ‐ | 2355 | ⊕⊕⊕⊕ | |
| Serious adverse events | 135 per 1000 | 109 per 1000 | RR 0.81 | 2648 | ⊕⊕⊕⊕ | |
| Adverse events leading to discontinuation | 9 per 1000 | 19 per 1000 | RR 2.15 | 2597 | ⊕⊕⊕⊕ | |
| *The risk in the intervention group (and its 95% confidence interval) is based on the assumed risk in the comparison group and the relative effect of the intervention (and its 95% CI). | ||||||
| GRADE Working Group grades of evidence | ||||||
| a Rounded mean of the rate in the placebo group of the eosinophilic and non‐eosinophilic arms (as applicable) or the three studies: 1.33, 1.21, 0.68, 0.49, 0.93, 1.21. | ||||||
| Study | Design, follow‐up (weeks) | Baseline asthma severity | Baseline treatment | Intervention (route) | Primary and secondary outcomes |
| Chupp 2017 (551) | RCT, double‐blind, placebo‐controlled (24) | Blood eosinophils ≥ 150 cells/μL at screening or ≥ 300 cells/μL in previous 12 months; and ≥ 2 exacerbations in previous 12 months; and FEV1 < 80% | High‐dose ICS for ≥ 12 months; + additional controller for ≥ 3 months; ± maintenance OCS | Mepolizumab 100 mg (SC) or placebo every 4 weeks for 24 weeks (last dose at 20 weeks) | ‐ SGRQ ‐ Mean change from baseline pre‐bronchodilator FEV1 ‐ Proportion of SGRQ total score responders at week 24 ‐ Mean change from baseline in ACQ‐5 |
| Haldar 2009 (61) | RCT, double‐blind, placebo‐controlled, parallel‐group (50) | ≥ 3% sputum eosinophils; and ≥ 2 exacerbations in previous 12 months | High‐dose ICS | Mepolizumab 75 (IV) or matched placebo (150 mL of 0.9% saline) at monthly intervals for 1 y | ‐ Severe exacerbations per person ‐ Change in AQLQ ‐ post‐bronchodilator FEV1 ‐ Airway hyperresponsiveness ‐ Blood/sputum eosinophil counts |
| Ortega 2014 (576) | RCT, double‐blind, double‐dummy, phase 3 (32) | Blood eosinophils ≥ 150 cells/μL at screening or ≥ 300 cells/μL in previous 12 months; and ≥ 2 exacerbations in previous 12 months; and FEV1 < 80% | High‐dose ICS for ≥ 12 months; + additional controller for ≥ 3 months; ± maintenance OCS | Mepolizumab 75 mg (IV) or 100 mg (SC) or placebo every 4 weeks for 32 weeks | ‐ Exacerbations per y ‐ Mean change from baseline pre‐bronchodilator FEV1 ‐ Mean change from baseline SGRQ total score |
| Pavord 2012a (621) | Multicentre, double‐blind, placebo‐controlled (52) | ≥ 3% sputum eosinophils or blood eosinophil ≥ 300 cells/μL; and ≥ 2 exacerbations in previous 12 months | High‐dose ICS (i.e. ≥ 880 μg/d FP or equivalent daily); + additional controller; ± maintenance OCS | Mepolizumab 75 mg, 250 mg or 750 mg (IV) or placebo every 4 weeks for 13 doses | ‐ Time to first clinically significant exacerbation ‐ Frequency of exacerbations requiring hospitalisation ‐ Time to first exacerbation requiring hospitalisation or ED visit ‐ Mean change from baseline pre‐bronchodilator FEV1 ‐ Mean change from baseline post‐bronchodilator FEV1 ‐ Mean change from baseline ACQ |
| Bjermer 2016 (315) | RCT, double‐blind, placebo‐controlled, parallel‐group, fixed‐dosage, multicentre phase 3 (16) | Blood eosinophils ≥ 400 cells/μL during 2‐4 weeks screening period; and ACQ‐7 score ≥ 1.5 | Medium‐dose ICS; maintenance OCS not allowed | Reslizumab 0.3 mg/kg or 3 mg/kg (IV) or placebo every 4 weeks for 4 doses | ‐ Pre‐bronchodilator FEV1, FVC, FEF25‐75 ‐ ACQ, ACQ‐6, ACQ‐5 ‐ ASUI ‐ AQLQ ‐ Rescue inhaler use ‐ Blood eosinophil levels |
| Castro 2015a (489) and Castro 2015b (464) | 2 x duplicate RCT double‐blind, placebo‐controlled, parallel‐group, multicentre, phase 3 (52) | Blood eosinophils ≥ 400 cells/μL during 2‐4 week screening period; and ACQ‐7 score ≥ 1.5 | Medium‐dose ICS (i.e. ≥ 440 μg/day FP or equivalent daily); ± additional controller or maintenance OCS | Reslizumab 3 mg/kg (IV) or matching placebo every 4 weeks for 13 doses (last dose week 48) | ‐ Annual frequency of exacerbations ‐ Change in FEV1 from baseline over 16 weeks ‐ ACQ‐7 score ‐ ASUI score ‐ Rescue use of SABA ‐ Blood eosinophil count ‐ AQLQ total score at weeks 16, 32 and 52 |
| Corren 2016 (496) | RCT double‐blind, placebo‐controlled, multicentre phase 3 (16) | ACQ‐7 score ≥ 1.5 (no selection based on blood eosinophils) | Medium‐dose ICS; maintenance OCS not allowed | Reslizumab 3 mg/kg (IV) or matching placebo every 4 weeks for 4 doses | ‐ Change in FEV1 from baseline ‐ ACQ‐7 score ‐ Rescue (SABA) use within previous 3 days ‐ FVC ‐ Blood eosinophils |
| Bleecker 2016 (1204) | RCT double‐blind, parallel‐group, placebo‐controlled multicentre (52) | ≥ 2 exacerbations in the previous 12 months; and ACQ‐6 score ≥ 1.5 at enrolment; and FEV1 < 80% (if 12‐17 years old, < 90%) | Adults (> 18 y) high‐dose (≥ 500 μg/d FP or equivalent) ICS/LABA for ≥ 12 months Children (12‐17 y) at least medium‐dose (≥ 250 μg/day FP or equivalent) ICS/LABA | Benralizumab 30 mg (SC) or placebo either every 4 weeks or every 4 weeks for the first 3 doses then every 8 weeks or placebo for 48 weeks | ‐ Annual exacerbation rate ‐ Pre‐bronchodilator FEV1 ‐ Total asthma symptom score ‐ Time to first exacerbation ‐ Annual rate of exacerbations requiring ED visit or hospital admission ‐ Post‐bronchodilator FEV1 ‐ ACQ‐6 ‐ AQLQ(S)+12 score |
| Castro 2014a (606) | RCT double‐blind, placebo‐controlled, multicentre dose‐ranging (52) | 2‐6 exacerbations in the previous 12 months; and ACQ‐6 score ≥ 1.5 at least twice during screening; and morning pre‐bronchodilator FEV1 40%‐90% | Medium‐ to high‐dose ICS in combination with LABA for ≥ 12 months | Benralizumab 2 mg, 20 mg or 100 mg (SC) or placebo every 4 weeks for the first 3 doses, then every 8 weeks (total 7 doses) | ‐ Annual exacerbation rate ‐ Change from baseline in FEV1 ‐ Mean ACQ‐6 score ‐ Overall symptom score ‐ Mean AQLQ score |
| FitzGerald 2016 (1306) | RCT, double‐blind, parallel‐group, placebo‐controlled multicentre (56) | ≥ 2 exacerbations in the previous 12 months; and ACQ‐6 score ≥ 1.5 at enrolment; and FEV1 < 80% | Medium‐ (≥ 250 μg/d FP or equivalent) to high‐dose (≥ 500 μg/d FP or equivalent) ICS/LABA for ≥ 12 months; high‐dose ICS/LABA for ≥ 3 months | Benralizumab 30 mg (SC) or placebo either every 4 weeks or every 4 weeks for the first 3 doses then every 8 weeks or placebo | ‐ Annual exacerbation rate for participants with blood eosinophils ≥ 300 cells/μL ‐ Pre‐bronchodilator FEV1 ‐ Total asthma symptom score ‐ Time to first exacerbation ‐ Annual rate of exacerbations requiring ED visit or hospital admission ‐ Post‐bronchodilator FEV1 ‐ ACQ‐6 ‐ AQLQ(S)+12 score |
| (13) | RCT double‐blind, parallel‐group, placebo‐controlled multicentre (48) | Uncontrolled asthma taking medium‐dose ICS plus LABA | Medium‐dose ICS (>250ug and ≤500ug fluticasone dry powder formulation equivalents total daily dose) and LABA for at least 3 month prior to first visit | Benralizumab 30 mg (SC) or placebo either every 4 weeks or every 4 weeks for the first 3 doses then every 8 weeks or placebo | Asthma exacerbations over 48‐week treatment period |
| Park 2016 (103) | RCT double‐blind, placebo‐controlled, dose‐ranging multicentre (52) | 2‐6 exacerbations in the previous 12 months; and ACQ‐6 score ≥ 1.5 at least twice during screening; and morning pre‐bronchodilator FEV1 40%‐90% | Medium‐ to high‐dose ICS in combination with LABA for ≥ 12 months | Benralizumab 2 mg, 20 mg or 100 mg (SC) or placebo every 4 weeks for the first 3 doses, then every 8 weeks (total 7 doses) | ‐ Annual exacerbation rate ‐ Lung function ‐ ACQ‐6 ‐ FeNO ‐ Blood eosinophil counts |
| ACQ: Asthma Control Questionnaire; AQLQ: Asthma Quality of Life Questionnaire; ASUI: Asthma Symptom Utility Index; BDP: beclomethasone dipropionate; b: day; ECP: eosinophil cationic protein; ED: emergency department; FEF25‐75 : forced expiratory flow at 25% to 75% of FVC; FeNO: exhaled fraction of nitric oxide; FEV1 : Forced expiratory volume in 1 second; FVC: forced vital capacity; FP; fluticasone propionate; ICS; inhaled corticosteroid; IV: intravenous; LABA: long‐acting beta2 agonistOCS; oral corticosteroid; PC20 : histamine provocative concentration causing a 20% drop in FEV1; PEFR: peak expiratory flow rate; RCT: randomised controlled trial; SABA: short‐acting beta2‐agonists; SC: subcutaneous; SGRQ: St George's Respiratory Questionnaire; y: year | |||||
| Outcome or subgroup title | No. of studies | No. of participants | Statistical method | Effect size |
| 1 Rate of exacerbations requiring systemic corticosteroids Show forest plot | 2 | 936 | Rate Ratio (Random, 95% CI) | 0.45 [0.36, 0.55] |
| 1.1 Eosinophilic | 2 | 936 | Rate Ratio (Random, 95% CI) | 0.45 [0.36, 0.55] |
| 2 Rate of exacerbations requiring emergency department treatment or admission Show forest plot | 2 | 936 | Rate Ratio (Random, 95% CI) | 0.36 [0.20, 0.66] |
| 2.1 Eosinophilic | 2 | 936 | Rate Ratio (Random, 95% CI) | 0.36 [0.20, 0.66] |
| 3 Rate of exacerbations requiring admission Show forest plot | 2 | 936 | Rate Ratio (Random, 95% CI) | 0.31 [0.13, 0.73] |
| 3.1 Eosinophilic | 2 | 936 | Rate Ratio (Random, 95% CI) | 0.31 [0.13, 0.73] |
| 4 Health‐related quality of life (ACQ) Show forest plot | 2 | 936 | Mean Difference (Random, 95% CI) | ‐0.42 [‐0.56, ‐0.28] |
| 4.1 Eosinophilic | 2 | 936 | Mean Difference (Random, 95% CI) | ‐0.42 [‐0.56, ‐0.28] |
| 5 Health‐related quality of life (SGRQ) Show forest plot | 2 | 936 | Mean Difference (Random, 95% CI) | ‐7.40 [‐9.50, ‐5.29] |
| 5.1 Eosinophilic | 2 | 936 | Mean Difference (Random, 95% CI) | ‐7.40 [‐9.50, ‐5.29] |
| 6 Pre‐bronchodilator FEV1 (litres) Show forest plot | 2 | 936 | Mean Difference (Random, 95% CI) | 0.11 [0.06, 0.17] |
| 6.1 Eosinophilic | 2 | 936 | Mean Difference (Random, 95% CI) | 0.11 [0.06, 0.17] |
| 7 Serious adverse events Show forest plot | 2 | 936 | Risk Ratio (M‐H, Random, 95% CI) | 0.63 [0.41, 0.97] |
| 7.1 Eosinophilic | 2 | 936 | Risk Ratio (M‐H, Random, 95% CI) | 0.63 [0.41, 0.97] |
| 8 Adverse events leading to discontinuation Show forest plot | 2 | 936 | Risk Ratio (M‐H, Random, 95% CI) | 0.45 [0.11, 1.80] |
| 8.1 Eosinophilic | 2 | 936 | Risk Ratio (M‐H, Random, 95% CI) | 0.45 [0.11, 1.80] |
| Outcome or subgroup title | No. of studies | No. of participants | Statistical method | Effect size |
| 1 Rate of clinically significant exacerbations Show forest plot | 3 | 751 | Rate Ratio (Random, 95% CI) | 0.53 [0.44, 0.64] |
| 1.1 Eosinophilic | 3 | 751 | Rate Ratio (Random, 95% CI) | 0.53 [0.44, 0.64] |
| 2 Rate of exacerbations requiring emergency department treatment or admission Show forest plot | 2 | 690 | Rate Ratio (Random, 95% CI) | 0.52 [0.31, 0.87] |
| 2.1 Eosinophilic | 2 | 690 | Rate Ratio (Random, 95% CI) | 0.52 [0.31, 0.87] |
| 3 Rate of exacerbations requiring admission Show forest plot | 2 | 690 | Rate Ratio (Random, 95% CI) | 0.61 [0.33, 1.13] |
| 3.1 Eosinophilic | 2 | 690 | Rate Ratio (Random, 95% CI) | 0.61 [0.33, 1.13] |
| 4 People with one or more exacerbations Show forest plot | 1 | 61 | Risk Ratio (M‐H, Random, 95% CI) | 0.82 [0.61, 1.09] |
| 4.1 Eosinophilic | 1 | 61 | Risk Ratio (M‐H, Random, 95% CI) | 0.82 [0.61, 1.09] |
| 5 Health‐related quality of life (AQLQ) Show forest plot | 2 | 369 | Mean Difference (Random, 95% CI) | 0.21 [‐0.06, 0.47] |
| 5.1 Eosinophilic | 2 | 369 | Mean Difference (Random, 95% CI) | 0.21 [‐0.06, 0.47] |
| 6 Health‐related quality of life (ACQ) Show forest plot | 2 | 369 | Mean Difference (Fixed, 95% CI) | ‐0.11 [‐0.32, 0.09] |
| 6.1 Eosinophilic | 2 | 369 | Mean Difference (Fixed, 95% CI) | ‐0.11 [‐0.32, 0.09] |
| 7 Health‐related quality of life (SGRQ) Show forest plot | 1 | 382 | Mean Difference (Random, 95% CI) | ‐6.4 [‐9.65, ‐3.15] |
| 7.1 Eosinophilic | 1 | 382 | Mean Difference (Random, 95% CI) | ‐6.4 [‐9.65, ‐3.15] |
| 8 Pre‐bronchodilator FEV1 (litres) Show forest plot | 2 | 690 | Mean Difference (Random, 95% CI) | 0.08 [0.02, 0.15] |
| 8.1 Eosinophilic | 2 | 690 | Mean Difference (Random, 95% CI) | 0.08 [0.02, 0.15] |
| 9 Serious adverse events Show forest plot | 3 | 751 | Risk Ratio (M‐H, Random, 95% CI) | 0.59 [0.37, 0.94] |
| 9.1 Eosinophilic | 3 | 751 | Risk Ratio (M‐H, Random, 95% CI) | 0.59 [0.37, 0.94] |
| 10 Adverse events leading to discontinuation Show forest plot | 3 | 751 | Risk Ratio (M‐H, Random, 95% CI) | 0.72 [0.18, 2.92] |
| 10.1 Eosinophilic | 3 | 751 | Risk Ratio (M‐H, Random, 95% CI) | 0.72 [0.18, 2.92] |
| 11 Serum eosinophil level (cells/microlitre) Show forest plot | 1 | Mean Difference (Fixed, 95% CI) | ‐170.0 [‐228.00, ‐110.00] | |
| 11.1 Eosinophilic | 1 | Mean Difference (Fixed, 95% CI) | ‐170.0 [‐228.00, ‐110.00] | |
| Outcome or subgroup title | No. of studies | No. of participants | Statistical method | Effect size |
| 1 Rate of exacerbations requiring systemic corticosteroids Show forest plot | 2 | 953 | Rate Ratio (Fixed, 95% CI) | 0.43 [0.33, 0.55] |
| 1.1 Eosinophilic | 2 | 953 | Rate Ratio (Fixed, 95% CI) | 0.43 [0.33, 0.55] |
| 2 Rate of exacerbations requiring emergency department treatment or admission Show forest plot | 2 | 953 | Rate Ratio (Fixed, 95% CI) | 0.67 [0.39, 1.17] |
| 2.1 Eosinophilic | 2 | 953 | Rate Ratio (Fixed, 95% CI) | 0.67 [0.39, 1.17] |
| 3 Health‐related quality of life (AQLQ) Show forest plot | 3 | 1164 | Mean Difference (Fixed, 95% CI) | 0.28 [0.17, 0.39] |
| 3.1 Eosinophilic | 3 | 1164 | Mean Difference (Fixed, 95% CI) | 0.28 [0.17, 0.39] |
| 4 Health‐related quality of life (ACQ) Show forest plot | 4 | 1652 | Mean Difference (Fixed, 95% CI) | ‐0.25 [‐0.33, ‐0.17] |
| 4.1 Eosinophilic | 4 | 1260 | Mean Difference (Fixed, 95% CI) | ‐0.27 [‐0.36, ‐0.19] |
| 4.2 Non‐eosinophilic | 1 | 392 | Mean Difference (Fixed, 95% CI) | ‐0.12 [‐0.33, 0.09] |
| 5 Pre‐bronchodilator FEV1 (litres) Show forest plot | 4 | 1652 | Mean Difference (Fixed, 95% CI) | 0.11 [0.07, 0.15] |
| 5.1 Eosinophilic | 4 | 1260 | Mean Difference (Fixed, 95% CI) | 0.12 [0.08, 0.16] |
| 5.2 Non‐eosinophilic | 1 | 392 | Mean Difference (Fixed, 95% CI) | 0.03 [‐0.07, 0.14] |
| 6 Serious adverse events Show forest plot | 4 | 1656 | Risk Ratio (M‐H, Random, 95% CI) | 0.79 [0.56, 1.12] |
| 6.1 Eosinophilic | 3 | 1160 | Risk Ratio (M‐H, Random, 95% CI) | 0.79 [0.51, 1.22] |
| 6.2 Eosinophil status unknown | 1 | 496 | Risk Ratio (M‐H, Random, 95% CI) | 0.98 [0.34, 2.88] |
| 7 Adverse events leading to discontinuation Show forest plot | 4 | 1659 | Risk Ratio (M‐H, Random, 95% CI) | 0.66 [0.43, 1.02] |
| 7.1 Eosinophilic | 3 | 1163 | Risk Ratio (M‐H, Random, 95% CI) | 0.67 [0.37, 1.20] |
| 7.2 Eosinophil status unknown | 1 | 496 | Risk Ratio (M‐H, Random, 95% CI) | 0.66 [0.35, 1.23] |
| 8 Serum eosinophil level (cells/microlitre) Show forest plot | 4 | 1656 | Mean Difference (Fixed, 95% CI) | ‐476.83 [‐499.32, ‐454.34] |
| 8.1 Eosinophilic | 4 | 1656 | Mean Difference (Fixed, 95% CI) | ‐476.83 [‐499.32, ‐454.34] |
| Outcome or subgroup title | No. of studies | No. of participants | Statistical method | Effect size |
| 1 Rate of exacerbations requiring systemic corticosteroids Show forest plot | 3 | 2456 | Rate Ratio (Fixed, 95% CI) | 0.62 [0.55, 0.70] |
| 1.1 Eosinophilic | 3 | 1698 | Rate Ratio (Fixed, 95% CI) | 0.59 [0.51, 0.68] |
| 1.2 Non‐eosinophilic | 2 | 758 | Rate Ratio (Fixed, 95% CI) | 0.69 [0.56, 0.85] |
| 2 Rate of exacerbations requiring emergency department treatment or admission Show forest plot | 2 | 1537 | Rate Ratio (Fixed, 95% CI) | 0.68 [0.47, 0.98] |
| 2.1 Eosinophilic | 2 | 1537 | Rate Ratio (Fixed, 95% CI) | 0.68 [0.47, 0.98] |
| 3 Health‐related quality of life (AQLQ mean difference) Show forest plot | 3 | 1541 | Mean Difference (Fixed, 95% CI) | 0.23 [0.11, 0.35] |
| 3.1 Eosinophilic | 3 | 1541 | Mean Difference (Fixed, 95% CI) | 0.23 [0.11, 0.35] |
| 4 Health‐related quality of life (ACQ mean difference) Show forest plot | 3 | 2359 | Mean Difference (Fixed, 95% CI) | ‐0.20 [‐0.29, ‐0.11] |
| 4.1 Eosinophilic | 3 | 1604 | Mean Difference (Fixed, 95% CI) | ‐0.23 [‐0.34, ‐0.12] |
| 4.2 Non‐eosinophilic | 2 | 755 | Mean Difference (Fixed, 95% CI) | ‐0.14 [‐0.30, 0.02] |
| 5 Pre‐bronchodilator FEV1 (litres) Show forest plot | 3 | 2355 | Mean Difference (Fixed, 95% CI) | 0.10 [0.05, 0.14] |
| 5.1 Eosinophilic | 3 | 1617 | Mean Difference (Fixed, 95% CI) | 0.13 [0.08, 0.19] |
| 5.2 Non‐eosinophilic | 2 | 738 | Mean Difference (Fixed, 95% CI) | 0.03 [‐0.03, 0.10] |
| 6 Serious adverse events Show forest plot | 4 | 2648 | Risk Ratio (M‐H, Random, 95% CI) | 0.81 [0.66, 1.01] |
| 6.1 Eosinophilic | 2 | 1537 | Risk Ratio (M‐H, Random, 95% CI) | 0.80 [0.60, 1.06] |
| 6.2 Non‐eosinophilic | 2 | 758 | Risk Ratio (M‐H, Random, 95% CI) | 0.85 [0.57, 1.27] |
| 6.3 Eosinophil status unknown | 2 | 353 | Risk Ratio (M‐H, Random, 95% CI) | 0.75 [0.37, 1.51] |
| 7 Adverse events leading to discontinuation Show forest plot | 3 | 2597 | Risk Ratio (M‐H, Random, 95% CI) | 2.15 [1.02, 4.57] |
| 7.1 Eosinophilic | 2 | 1537 | Risk Ratio (M‐H, Random, 95% CI) | 2.70 [0.86, 8.49] |
| 7.2 Non‐eosinophilic | 2 | 758 | Risk Ratio (M‐H, Random, 95% CI) | 1.81 [0.54, 6.05] |
| 7.3 Eosinophil status unknown | 1 | 302 | Risk Ratio (M‐H, Random, 95% CI) | 1.82 [0.31, 10.69] |
| 8 Serum eosinophil level (% change from baseline) Show forest plot | 2 | 2295 | Mean Difference (Fixed, 95% CI) | ‐104.74 [‐116.12, ‐93.35] |
| 8.1 Eosinophilic | 2 | 1537 | Mean Difference (Fixed, 95% CI) | ‐101.74 [‐113.27, ‐90.21] |
| 8.2 Non‐eosinophilic | 2 | 758 | Mean Difference (Fixed, 95% CI) | ‐216.81 [‐287.35, ‐146.28] |