Terapi anti‐IL5 untuk asma
Abstract
Background
This review is the first update of a previously published review in The Cochrane Library (Issue 7, 2015). Interleukin‐5 (IL‐5) is the main cytokine involved in the activation of eosinophils, which cause airway inflammation and are a classic feature of asthma. Monoclonal antibodies targeting IL‐5 or its receptor (IL‐5R) have been developed, with recent studies suggesting that they reduce asthma exacerbations, improve health‐related quality of life (HRQoL) and lung function. These are being incorporated into asthma guidelines.
Objectives
To compare the effects of therapies targeting IL‐5 signalling (anti‐IL‐5 or anti‐IL‐5Rα) with placebo on exacerbations, health‐related qualify of life (HRQoL) measures, and lung function in adults and children with chronic asthma, and specifically in those with eosinophilic asthma refractory to existing treatments.
Search methods
We searched the Cochrane Airways Trials Register, clinical trials registries, manufacturers' websites, and reference lists of included studies. The most recent search was March 2017.
Selection criteria
We included randomised controlled trials comparing mepolizumab, reslizumab and benralizumab versus placebo in adults and children with asthma.
Data collection and analysis
Two authors independently extracted data and analysed outcomes using a random‐effects model. We used standard methods expected by Cochrane.
Main results
Thirteen studies on 6000 participants met the inclusion criteria. Four used mepolizumab, four used reslizumab, and five used benralizumab. One study in benralizumab was terminated early due to sponsor decision and contributed no data. The studies were predominantly on people with severe eosinophilic asthma, which was similarly but variably defined. Eight included children over 12 years but these results were not reported separately. We deemed the risk of bias to be low, with all studies contributing data being of robust methodology. We considered the quality of the evidence for all comparisons to be high overall using the GRADE scheme, with the exception of intravenous mepolizumab because this is not currently a licensed delivery route.
All of the anti‐IL‐5 treatments assessed reduced rates of 'clinically significant' asthma exacerbation (defined by treatment with systemic corticosteroids for three days or more) by approximately half in participants with severe eosinophilic asthma on standard of care (at least medium‐dose inhaled corticosteroids (ICS)) with poorly controlled disease (either two or more exacerbations in the preceding year or Asthma Control Questionnaire (ACQ) 1.5 or more). Non‐eosinophilic participants treated with benralizumab also showed a significant reduction in exacerbation rates, but no data were available for non‐eosinophilic participants, and mepolizumab or reslizumab.
We saw modest improvements in validated HRQoL scores with all anti‐IL‐5 agents in severe eosinophilic asthma. However these did not exceed the minimum clinically important difference for ACQ and Asthma Quality of Life Questionnaire (AQLQ), with St. George's Respiratory Questionnaire (SGRQ) only assessed in two studies. The improvement in HRQoL scores in non‐eosinophilic participants treated with benralizumab, the only intervention for which data were available in this subset, was not statistically significant, but the test for subgroup difference was negative.
All anti‐IL‐5 treatments produced a small but statistically significant improvement in mean pre‐bronchodilator forced expiratory flow in one second (FEV1) of between 0.08 L and 0.11 L.
There were no excess serious adverse events with any anti‐IL‐5 treatment, and indeed a reduction in favour of mepolizumab that could be due to a beneficial effect on asthma‐related serious adverse events. There was no difference compared to placebo in adverse events leading to discontinuation with mepolizumab or reslizumab, but significantly more discontinued benralizumab than placebo, although the absolute numbers were small (36/1599 benralizumab versus 9/998 placebo).
Mepolizumab, reslizumab and benralizumab all markedly reduced blood eosinophils, but benralizumab resulted in almost complete depletion, whereas a small number remained with mepolizumab and reslizumab. The implications for efficacy and/or adverse events are unclear.
Authors' conclusions
Overall our study supports the use of anti‐IL‐5 treatments as an adjunct to standard of care in people with severe eosinophilic asthma and poor control. These treatments roughly halve the rate of asthma exacerbations in this population. There is limited evidence for improved HRQoL scores and lung function, which may not meet clinically detectable levels. There were no safety concerns regarding mepolizumab or reslizumab, and no excess serious adverse events with benralizumab, although there remains a question over adverse events significant enough to prompt discontinuation.
Further research is needed on biomarkers for assessing treatment response, optimal duration and long‐term effects of treatment, risk of relapse on withdrawal, non‐eosinophilic patients, children (particularly under 12 years), and comparing anti‐IL‐5 treatments to each other and, in people eligible for both, to anti‐immunoglobulin E. For benralizumab, future studies should closely monitor rates of adverse events prompting discontinuation.
PICO
Ringkasan bahasa mudah
Mepolizumab, reslizumab atau benralizumab untuk orang yang sudah mengambil sedutan steroid dan beta2 bertindak lama untuk asma mereka
Soalan ulasan
Penyelidik mempertimbangkan dalam ulasan ini sama ada mengambil ubat baru mepolizumab, reslizumab atau benralizumab sebagai tambahan kepada rawatan piawaian (misalnya sedutan steroids dan gabungan inhaler) adalah lebih baik daripada plasebo bagi orang yang menghidapi asma.
Latar belakang
Asma adalah satu keadaan radang paru‐paru yang bercirikan penyempitan saluran pernafasan, sesak nafas, dada yang ketat dan pengurangan kualiti hidup. Menjelang tahun 2025, mungkin terdapat sehingga 400 juta orang yang menghidap asma di seluruh dunia. Mepolizumab, reslizumab dan benralizumab adalah rawatan 'anti‐IL‐5' baru yang boleh membantu mengurangkan gejala asma.
Ciri‐ciri kajian
Tiga belas kajian membandingkan mepolizumab, reslizumab atau benralizumab dengan plasebo dalam 6000 orang dengan asma, kebanyakannya dengan penyakit yang teruk. Penyelidik merumuskan keputusan yang berkaitan dengan kejadian serangan asma yang memerlukan rawatan tambahan, kualiti hidup, ujian pernafasan, kesan pada "biomarker" darah, dan kesan sampingan.
Keputusan utama
Penyelidik mendapati bahawa pesakit yang mengalami asma yang teruk, yang mempunyai bilangan sel peradangan tertentu (eosinofil) dalam darah, mendapat manfaat daripada mengambil mepolizumab, reslizumab atau benralizumab melalui serangan asma yang berkurangan. Terdapat peningkatan kecil dalam kualiti hidup dan ujian pernafasan, tetapi ini mungkin terlalu kecil untuk dikesan oleh pesakit. Penyelidik bersetuju dengan garis panduan antarabangsa yang mengatakan bahawa rawatan ini boleh ditambah kepada rawatan piawai untuk orang yang mempunyai asma yang teruk. Namun demikian, penyelidik berpendapat bahwa kajian lanjutan adalah diperlukan untuk menjelaskan beberapa aspek, seperti cara untuk menilai tindak balas rawatan dan tempoh untuk memberi rawatan.
Kualiti bukti
Bukti yang dimasukkan dalam ulasan ini didapati daripada kajian yang direka dengan sangat baik. Penyelidik menganggap kajian ini berada pada risiko berat sebelah yang rendah dalam hal‐hal penting berikut: prosedur yang menentukan siapa yang menerima rawatan, proses pembutaan dan kejelasan butiran mengenai peserta yang tidak menyelesaikan kajian. Keseluruhan bukti itu adalah berkualiti tinggi hingga sederhana.
Authors' conclusions
Summary of findings
| Mepolizumab (SC) compared to placebo for asthma | ||||||
| Patient or population: people with asthma | ||||||
| Outcomes | Anticipated absolute effects* (95% CI) | Relative effect | № of participants | Quality of the evidence | Comments | |
| Risk with placebo | Risk with mepolizumab (SC) | |||||
| Rate of exacerbations requiring systemic corticosteroids | The mean rate in the placebo group was 1.48 events per participant per yeara | The mean rate in the intervention group was 0.81 fewer events per participant per year (95% CI 0.66 fewer to 0.94 fewer) | Rate ratio 0.45 (0.36 to 0.55) | 936 | ⊕⊕⊕⊕ | |
| Rate of exacerbations requiring emergency department treatment or admission | The mean rate in the placebo group was 0.15 events per patient per yearb | The mean rate in the intervention group was 0.10 fewer events per participant per year (95% CI 0.05 fewer to 0.12 fewer) | Rate ratio 0.36 (0.20 to 0.66) | 936 | ⊕⊕⊕⊕ | |
| Health‐related quality of life (ACQ) | The mean change in the placebo group ranged from −0.4 to −0.5 units | The mean in the intervention group was ‐0.42 units fewer (‐0.56 fewer to ‐0.28 fewer) | ‐ | 936 | ⊕⊕⊕⊝ | A change of ≥ 0.5 is considered the minimum clinically significant difference |
| Health‐related quality of life (SGRQ) | The mean change in the placebo group ranged from −7.9 to −9.0 units | The mean change in the intervention group was ‐7.4 units fewer (‐9.5 fewer to ‐5.29 fewer) | ‐ | 936 | ⊕⊕⊕⊕ | A change of ≥ 4 is considered the minimum clinically significant difference |
| Pre‐bronchodilator FEV1 (L) | The mean change in the placebo group ranged from 0.086 L (± 0.031 L) to 0.120 L (0.047 to 0.192 L) | The mean difference from placebo was a further 0.11 L (0.06 L to 0.17 L) | ‐ | 936 | ⊕⊕⊕⊕ | |
| Adverse events leading to discontinuation | 15 per 1000 | 7 per 1000 | Risk ratio 0.45 | 936 | ⊕⊕⊕⊝ | |
| *The risk in the intervention group (and its 95% confidence interval) is based on the assumed risk in the comparison group and the relative effect of the intervention (and its 95% CI). | ||||||
| GRADE Working Group grades of evidence | ||||||
| aRounded mean of the rate in the placebo group of the two studies: 1.21 and 1.74. | ||||||
| Mepolizumab (IV) compared to placebo for asthma | ||||||
| Patient or population: people with asthma | ||||||
| Outcomes | Anticipated absolute effects* (95% CI) | Relative effect | № of participants | Quality of the evidence | Comments | |
| Risk with placebo | Risk with mepolizumab (IV) | |||||
| Rate of clinically significant exacerbations | The mean rate in the placebo group was 2.51 events per participant per yeara | The mean rate in the intervention groups was 1.18 fewer events per participant per year (1.41 fewer to 0.90 fewer) | Rate ratio 0.53 | 751 | ⊕⊕⊕⊝ | |
| Rate of exacerbations requiring emergency department treatment or admission | The mean rate in the placebo group was 0.32 events per participant per yearb | The mean rate in the intervention groups was 0.15 fewer events per participant per year (0.22 fewer to 0.04 fewer) | Rate ratio 0.52 | 690 | ⊕⊕⊕⊝ | |
| Health‐related quality of life (AQLQ) | The mean change in the placebo group ranged from 0.18 to 0.71 units | MD 0.21 higher | ‐ | 677 | ⊕⊕⊕⊝ | A change of ≥ 0.5 is considered the minimum clinically significant difference |
| Health‐related quality of life (ACQ) | The mean change in the placebo group ranged from −0.59 to −0.50 units | MD ‐0.11 lower | ‐ | 369 | ⊕⊕⊕⊝ | A change of ≥ 0.5 is considered the minimum clinically significant difference |
| Pre‐bronchodilator FEV1 (L) | The mean change in the placebo group ranged from 0.060 L (± 0.038 L) to 0.086 L (± 0.031 L) | MD 0.08 L (0.02 L higher to 0.15 L higher) | ‐ | 690 | ⊕⊕⊕⊝ | |
| Adverse events leading to discontinuation | 26 per 1000 | 19 per 1000 | RR 0.72 | 751 | ⊕⊕⊕⊝ | |
| *The risk in the intervention group (and its 95% confidence interval) is based on the assumed risk in the comparison group and the relative effect of the intervention (and its 95% CI). | ||||||
| GRADE Working Group grades of evidence | ||||||
| aRounded mean of the rate in the placebo group of the three studies: 1.74, 2.40 and 3.4. | ||||||
| Reslizumab (IV) compared to placebo for asthma | ||||||
| Patient or population: people with asthma | ||||||
| Outcomes | Anticipated absolute effects* (95% CI) | Relative effect | № of participants | Quality of the evidence | Comments | |
| Risk with placebo | Risk with reslizumab (IV) | |||||
| Rate of exacerbations requiring systemic corticosteroids | The mean rate in the placebo group was 1.54 events per participant per year | The mean rate in the intervention groups was 0.93 fewer events per participant per year (1.09 fewer to 0.73 fewer) | Rate ratio 0.43 | 953 | ⊕⊕⊕⊕ | |
| Rate of exacerbations requiring emergency department treatment or admission | The mean rate in the placebo group was 0.12 events per participant per year | The mean rate in the intervention groups was 0.04 fewer events per participant per year (0.07 fewer to 0.02 more) | Rate ratio 0.67 | 953 | ⊕⊕⊕⊕ | |
| Health‐related quality of life (AQLQ) | The mean change in the placebo group ranged from 0.779 to 0.89 units | MD 0.28 higher | ‐ | 1164 | ⊕⊕⊕⊕ | A change of ≥ 0.5 is considered the minimum clinically significant difference |
| Health‐related quality of life (ACQ) | The mean change in the placebo group ranged from −0.368 to −0.80 units | MD ‐0.25 lower | ‐ | 1652 | ⊕⊕⊕⊕ | A change of ≥ 0.5 is considered the minimum clinically significant difference |
| Pre‐bronchodilator FEV1 (L) | The mean change in the placebo group ranged from 0.002 L (± 0.1216 L) to 0.215 (± 0.0484 L) | MD 0.11 L higher | ‐ | 1652 | ⊕⊕⊕⊕ | |
| Serious adverse events | 91 per 1000 | 72 per 1000 | RR 0.79 | 1656 | ⊕⊕⊕⊕ | |
| Adverse events leading to discontinuation | 58 per 1000 | 38 per 1000 | RR 0.66 | 1659 | ⊕⊕⊕⊕ | |
| *The risk in the intervention group (and its 95% confidence interval) is based on the assumed risk in the comparison group and the relative effect of the intervention (and its 95% CI). | ||||||
| GRADE Working Group grades of evidence | ||||||
| a The mean difference (0.28) is smaller than the minimum clinically significant difference (a reduction of 0.5 points). | ||||||
| Benralizumab (SC) compared to placebo for asthma | ||||||
| Patient or population: people with asthma | ||||||
| Outcomes | Anticipated absolute effects* (95% CI) | Relative effect | № of participants | Quality of the evidence | Comments | |
| Risk with placebo | Risk with benralizumab (SC) | |||||
| Rate of exacerbations requiring systemic corticosteroids | The mean rate in the placebo group was 0.98 events per participant per yeara | The mean rate in the intervention groups was 0.37 fewer events per participant per year (0.44 fewer to 0.29 fewer) | Rate ratio 0.62 | 2456 | ⊕⊕⊕⊕ | |
| Rate of exacerbations requiring emergency department treatment or admission | The mean rate in the placebo group was 0.11 events per participant per yearb | The mean rate in the intervention groups was 0.04 fewer events per participant per year (0.06 fewer to 0.002 fewer) | Rate ratio 0.68 | 1537 | ⊕⊕⊕⊝ | There is greater heterogeneity (I² = 43%) owing to inclusion of less severe participants in FitzGerald 2016 (a larger proportion who had only suffered one exacerbation the previous year, with correspondingly less potential for exacerbation) |
| Health‐related quality of life (AQLQ) | The mean change in the placebo group ranged from 0.98 to 1.31 units | MD 0.23 higher | ‐ | 1541 | ⊕⊕⊕⊕ | A change of ≥ 0.5 is considered the minimum clinically significant difference |
| Health‐related quality of life (ACQ) | The mean change in the placebo group ranged from −1.19 to −0.76 units | MD ‐0.20 lower | ‐ | 2359 | ⊕⊕⊕⊕ | A change of ≥ 0.5 is considered the minimum clinically significant difference |
| Pre‐bronchodilator FEV1 (L) | The mean change in the placebo group ranged from ‐0.01 L to 0.239 L | MD 0.10 L higher | ‐ | 2355 | ⊕⊕⊕⊕ | |
| Serious adverse events | 135 per 1000 | 109 per 1000 | RR 0.81 | 2648 | ⊕⊕⊕⊕ | |
| Adverse events leading to discontinuation | 9 per 1000 | 19 per 1000 | RR 2.15 | 2597 | ⊕⊕⊕⊕ | |
| *The risk in the intervention group (and its 95% confidence interval) is based on the assumed risk in the comparison group and the relative effect of the intervention (and its 95% CI). | ||||||
| GRADE Working Group grades of evidence | ||||||
| a Rounded mean of the rate in the placebo group of the eosinophilic and non‐eosinophilic arms (as applicable) or the three studies: 1.33, 1.21, 0.68, 0.49, 0.93, 1.21. | ||||||
Background
This review is the first update of a previously published review in The Cochrane Library (Issue 7, 2015), evaluating the effects of therapies targeting IL‐5 signalling (anti‐IL‐5 or anti‐IL‐5Rα) with placebo on asthma.
Description of the condition
Asthma is a chronic inflammatory condition affecting the airways in the lungs. It is defined by symptoms of breathlessness, chest tightness, wheeze, and cough. These symptoms are a consequence of variable airway hyperresponsiveness, with subsequent bronchoconstriction and airflow obstruction. These symptoms are variably and intermittently present in the natural course of the disease, with periods of acutely increased symptomatology called exacerbations.
A recent global estimate suggested 300 million people currently live with asthma, and predicted this to increase to 400 million by 2025 (WHO 2007). Asthma causes a significant degree of morbidity and mortality: every year in the UK alone there are an estimated 2.7 million GP consultations, 121,000 hospital attendances, 93,900 admissions, and over 1000 deaths (Mukherjee 2016). The annual cost in the UK has been estimated at GBP 1.1 billion. Current treatments, such as inhaled corticosteroids (ICS) and bronchodilators are well established, yet despite these almost half of people living with asthma experience an exacerbation each year (Price 2014).
Asthma is increasingly recognised as a heterogenous disease comprised of a number of different clinical phenotypes and molecular endotypes, although the precise definition of these remains a work in progress (Wenzel 2012). 'Atopic asthma' is generally considered the most common phenotype, representing roughly half of all asthmatics (Woodruff 2009). Atopic asthma is thought to be driven by an excess of 'type 2 inflammation': an elevated number of type 2 helper T (Th2) cells and the cytokines they secrete, interleukin 4 (IL‐4), IL‐5 and IL‐13. A separate pathophysiological mechanism, in which type 2 innate lymphoid cells (ILC2s) produce large amounts of IL‐5 and IL‐13 (and to a lesser degree, IL‐4), is hypothesised to be important in a subgroup of asthma sufferers with eosinophilia but no allergies (Brusselle 2013). This group are particularly important because they have severe disease that is largely resistant to ICS, and so have a high burden of disease.
The cytokines IL‐4, IL‐5 and IL‐13 produce many of the classic features of atopic asthma, for example, eosinophilia (IL‐5 controls the proliferation, survival and recruitment of eosinophils), raised immunoglobulin E (IgE) levels (the result of B cell class switching in response to IL‐4 and IL‐13), mucus hypersecretion and airway hyperresponsiveness (both a potential consequence of IL‐13) (Chung 2015). Treatments targeting so called 'type 2 cytokines' have subsequently been developed and investigated for their potential in asthma.
Description of the intervention
One of the core pathological features of asthma is eosinophilic infiltration of the bronchial mucosa and airways (Kay 2015). Pro‐inflammatory mediators secreted by eosinophils cause damage to the epithelium, initiating vasodilatation, smooth muscle contraction and increased mucous secretion, which in turn is associated with increased airway hyperresponsiveness, asthma symptoms and airway narrowing (Liu 2013). Thus increased eosinophil counts, for example following reduction in the dose of maintenance ICS, are associated with increased symptoms and asthma exacerbations (Jatakanon 2000).
The proliferation, maturation, activation, recruitment and survival of eosinophils is under the control of IL‐5 (Lopez 1986), with the IL‐5 receptor being selectively expressed on eosinophils and basophils. Elevated levels of IL‐5 mRNA are seen in the bronchial biopsies of people with asthma and correlate with disease severity (Humbert 1997). IL‐5 signalling is therefore an attractive target in asthma, and has yielded three monoclonal antibodies: mepolizumab (trade name Nucala; GlaxoSmithKline), reslizumab (trade names Cinqair or Cinqaero; Teva) and benralizumab (MedImmune/AstraZeneca). Mepolizumab and reslizumab both target IL‐5, whereas benralizumab binds the alpha chain of the IL‐5 receptor (IL‐5Rα), found on eosinophils and basophils.
How the intervention might work
Mepolizumab and reslizumab bind IL‐5 and interfere with its ligation to the IL‐5 receptor on eosinophils and basophils. Both have been shown to reduce serum eosinophils (Wang 2009).
Benralizumab binds IL‐5Rα to inhibit its activation. In addition it appears to induce eosinophil and basophil apoptosis (Kolbeck 2010). Benralizumab has also been shown to be effective in reducing serum eosinophil counts (Busse 2010).
Mepolizumab and reslizumab have marketing licenses for use in people with 'eosinophilic' asthma (variably defined) and it is logical that these drugs would be most effective in this subgroup of patients. Anti‐IL‐5 therapies might also theoretically be effective in patients with more relaxed definitions of eosinophilia, or in those defined as 'non‐eosinophilic' based on their serum eosinophil count but who may have an isolated elevation of eosinophils in the airways (i.e. sputum eosinophilia), or whose eosinophils may be suppressed due to ICS treatment, or both.
Why it is important to do this review
As anti‐IL‐5 therapies become incorporated into national and international guidelines (e.g. the Global Initiatve for Asthma (GINA)'s 2017 guidelines, GINA 2017) and clinical practice, it is important that the evidence is reviewed and made available in the Cochrane Library. The first Cochrane Review focused on mepolizumab, at the time the only anti‐IL‐5 agent licensed (Powell 2015).
Since then reslizumab has been approved by the US Food & Drug Administration and European Medicines Agency. With phase 3 clinical trials of benralizumab recently being reported as having met their primary endpoints, it seems likely that benralizumab will also be approved soon. These anti‐IL‐5 agents are likely to compete directly with each other and so the scope of this review has been broadened to consider all anti‐IL‐5 therapies. They are compared to each other rather than pooled as there are potentially important differences in dose, route of administration (subcutaneous versus intravenous), and in the case of benralizumab, a significant difference in the mechanism of action that uniquely induces eosinophil and basophil apoptosis ‐ which could improve efficacy, but equally increase the incidence of adverse events.
Objectives
To compare the effects of therapies targeting IL‐5 signalling (anti IL‐5 or anti‐IL‐5Rα) with placebo on exacerbations, health‐related quality of life (HRQoL) measures, and lung function in adults and children with chronic asthma, and specifically in those with eosinophilic asthma refractory to existing treatments.
Methods
Criteria for considering studies for this review
Types of studies
We included randomised controlled trials (RCTs). We included studies reported as full text, those published as abstracts only and unpublished data.
Types of participants
We included both adults and children with a diagnosis of asthma. We focused on collating data from people who had been reported as having eosinophilic asthma to analyse these individuals as a subgroup. We examined individual articles in order to determine how this group should be defined.
Individuals with respiratory comorbidities such as cystic fibrosis were excluded, as were current smokers.
Types of interventions
We included trials comparing anti‐IL‐5 therapy with placebo, in addition to current standard of care for asthma (ICS, with or without a second controller such as a long‐acting beta2 agonist (LABA), provided the treatment period was 16 weeks or longer.
In the case of dose‐ranging studies, we included data only for participants on doses likely to be used clinically, that is, 75 mg intravenous (IV) or 100 mg subcutaneous (SC) injections of mepolizumab, 3 mg/kg IV reslizumab, 20 to 30 mg SC benralizumab. For mepolizumab SC and reslizumab IV, these are the licensed doses. For benralizumab, we took the 30 mg dose used in the two phase 3 studies (Bleecker 2016; FitzGerald 2016), which is likely to be the licensed dose, and included the 20 mg dose in the three previous phase 2a dose‐ranging studies (Castro 2015a; Castro 2015b; Park 2016).
Studies that initiated a reduction in standard asthma management (e.g. corticosteroids) as part of the protocol were excluded, as this is unlikely to reflect clinical practice in the majority of cases.
We planned to include the following co‐interventions provided they were not part of the randomised treatment: leukotriene antagonists (LTRA), inhaled bronchodilators (including LABA), inhaled (ICS) and oral corticosteroids (OCS), oral aminophylline and macrolide antibiotics.
Types of outcome measures
We referred to the joint American Thoracic Society (ATS) and European Respiratory Society (ERS) statement on standardising endpoints for asthma clinical trials to identify appropriate outcome measures (Reddel 2009). These recommend that clinical trials should assess outcomes relevant to both goals of asthma management: current control of asthma symptoms, and reduced risk of exacerbations and other adverse outcomes (e.g. accelerated lung function decline, treatment side effects). Moreover the authors note that these aspects are often discordant, thus endpoints assessing each need to be considered.
Exacerbations are responsible for most of the morbidity, mortality and healthcare costs related to asthma, and therefore considered the primary outcome measure. The ATS/ERS statement defines severe exacerbations as including either use of systemic corticosteroids for at least three days, or emergency department treatment or admission requiring systemic corticosteroids (definitions in terms of changes from baseline in lung function, symptoms, or short‐acting β2 agonist use are not validated).
Lung function, specifically low pre‐bronchodilator forced expiratory flow in one second (FEV1) (the most commonly reported lung function measure in clinical trials), is a strong independent predictor of asthma exacerbations (Osborne 2007), and is objective and reproducible. However lung function and symptoms correlate poorly over time in individual patients, so it is recommended that both are monitored. There is no gold standard score for assessing asthma symptoms, with several validated and regularly used including the Asthma Control Questionnaire (ACQ) (Juniper 1999), Asthma Control Test (ACT) (Nathan 2004), Asthma Quality of Life Questionnaire (AQLQ) (Juniper 1992), and the St George's Respiratory Questionnaire (SGRQ) (Jones 1991). We considered any one of these an adequate measure of symptoms and health‐related quality of life (HRQoL).
Identifying potential patient safety issues are a priority in the evaluation of new drugs. We consider the decision to discontinue study medication because of an adverse event to be a useful clinical marker of severity with real‐world applicability, and have included this alongside serious adverse events, which would likely outweigh any potential benefits of the intervention.
Anti‐IL‐5 treatments should result in a reduction in eosinophils. Moreover as discussed earlier, increased eosinophil counts are associated with symptoms and exacerbations (Jatakanon 2000). We have therefore included eosinophil counts in the peripheral blood, a measure that is readily available in hospitals and clinics, as a secondary outcome.
Primary outcomes
-
'Clinically significant' asthma exacerbation, as defined by treatment with a course (three days or more) of systemic corticosteroids (with or without hospital admission)
Secondary outcomes
-
Asthma exacerbation requiring hospital admission
-
HRQoL (as measured by a validated questionnaire e.g. ACQ, AQLQ, SGRQ)
-
Measures of lung function (e.g. FEV1)
-
Serious adverse events
-
'Clinically significant' adverse events, as defined by those that prompted discontinuation of the intervention and withdrawal from the study
-
Eosinophil counts in peripheral blood
Reporting one or more of the outcomes listed here in the trial was not an inclusion criterion for the review.
Search methods for identification of studies
Electronic searches
We identified trials from the Cochrane Airways Trials Register, which is maintained by the Information Specialist for the Group. The Cochrane Airways Trials Register contains studies identified from several sources:
-
monthly searches of the Cochrane Central Register of Controlled Trials (CENTRAL), through the Cochrane Register of Studies Online (crso.cochrane.org);
-
weekly searches of MEDLINE Ovid SP 1946 to date;
-
weekly searches of Embase Ovid SP 1974 to date;
-
Monthly searches of PsycINFO Ovid SP;
-
Monthly searches of CINAHL EBSCO (Cumulative Index to Nursing and Allied Health Literature);
-
Monthly searches of AMED EBSCO (Allied and Complementary Medicine);
-
handsearches of the proceedings of major respiratory conferences.
Studies contained in the Trials Register are identified through search strategies based on the scope of Cochrane Airways. Details of these strategies, as well as a list of handsearched conference proceedings are in Appendix 1. See Appendix 2 for search terms used to identify studies for this review.
We also conducted a search of ClinicalTrials.gov (www.clinicaltrials.gov) and the World Health Organization (WHO) trials portal (www.who.int/ictrp/en).
We searched all databases from their inception to the present and imposed no restriction on language of publication. The search was first conducted in November 2013 and was updated in November 2014 and March 2017.
Searching other resources
We checked the bibliographies of all primary studies and review articles for additional references. We searched relevant manufacturers' websites for trial information (clinical trials registers on the GlaxoSmithKline (manufacturer of mepolizumab) and AstraZeneca (benralizumab) websites; the Teva (reslizumab) website does not have a clinical trials register).
We searched for errata and retractions relevant to the included studies published in full text on PubMed (www.ncbi.nlm.nih.gov/pubmed) and planned to report the date this was done within the review if this was an issue.
Data collection and analysis
Selection of studies
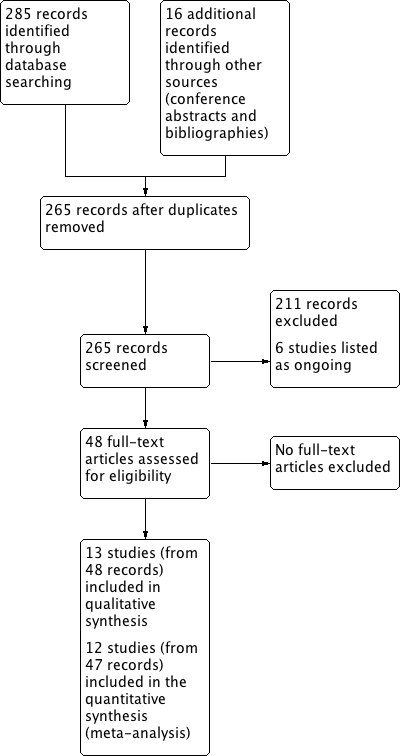
Two review authors (HF, CP) independently screened titles and abstracts of all the potential studies identified in the search and coded them as 'retrieve' (eligible or potentially eligible/unclear) or 'do not retrieve'. We retrieved the full‐text study reports/publications, and two review authors (HF, CP) independently screened the full text and identified studies for inclusion, identifying and recording reasons for excluding the ineligible studies. We planned to resolve any disagreement through discussion or, if required, by consulting a third review author (SJM); however, this was not necessary. We identified and excluded duplicates and collated multiple reports of the same study so that each study rather than each report was the unit of interest in the review. We recorded the selection process in sufficient detail to complete a PRISMA flow diagram (Moher 2009) (Figure 1) and a 'Characteristics of excluded studies' table.
Study flow diagram
Data extraction and management
We used a data collection form to record study characteristics and outcome data that had been piloted on at least one study in the review. Two review authors (HF, AW) extracted the following study characteristics from included studies.
-
Methods: study design, total duration of study, details of any run‐in period, number of study centres and location, study setting, withdrawals and date of study
-
Participants: number, mean age, age range, gender, severity of condition, diagnostic criteria, baseline lung function, smoking history, inclusion criteria and exclusion criteria
-
Interventions: intervention, comparator, concomitant medications and excluded medications
-
Outcomes: primary and secondary outcomes specified and collected, and time points reported
-
Notes: funding for trial and notable conflicts of interest of trial authors
Two review authors (HF, AW) independently extracted outcome data from included studies. We noted in the 'Characteristics of included studies' table if outcome data were not reported in a usable way. We planned to resolve disagreements by consensus or by involving a third author (CP), but this was not necessary. One review author (HF) transferred data into Review Manager 5 (RevMan 5) (RevMan 2014). We double‐checked that data were entered correctly by comparing the data presented in the systematic review with the study reports. The data extracted were additionally checked by the Cochrane Airways' statistician. A second review author (SJM) spot‐checked study characteristics for accuracy against the trial report.
Assessment of risk of bias in included studies
Two review authors (HF, AW) independently assessed risk of bias for each study using the criteria outlined in the Cochrane Handbook for Systematic Reviews of Interventions (Higgins 2011). We planned to resolve any disagreements by discussion or by involving another review author (SJM), but this was not necessary. We assessed the risk of bias according to the domains:
-
random sequence generation;
-
allocation concealment;
-
blinding of participants and personnel;
-
blinding of outcome assessment;
-
incomplete outcome data;
-
selective outcome reporting;
-
other bias.
We graded each potential source of bias as high, low or unclear, and provided a quotation from the study report together with a justification for this judgement in the 'Risk of bias' table. We summarised the risk of bias judgements across different studies for each of the domains listed. We considered blinding separately for different key outcomes where necessary (e.g. for an unblinded outcome assessment, risk of bias for all‐cause mortality may be very different than that for a patient‐reported pain scale). Where information on risk of bias related to unpublished data or correspondence with a trialist, we noted this in the 'Risk of bias' table.
When considering treatment effects, we took into account the risk of bias for the studies that contributed to that outcome.
We conducted the review according to this published protocol and have reported any deviations from it in the 'Differences between protocol and review' section of the systematic review.
Measures of treatment effect
We analysed dichotomous data as rate ratios and risk ratios, and continuous data as mean differences or standardised mean differences, which are presented with 95% confidence intervals. We entered data presented on a scale with a consistent direction of effect.
We have undertaken meta‐analyses only where this was meaningful (i.e. if the treatments, participants and underlying clinical question were sufficiently similar for pooling to make sense).
Where multiple trial arms were reported in a single trial (Bjermer 2016; Castro 2014a; Park 2016; Pavord 2012a), we only included the arms with doses likely to be used clinically, that is, 75 mg intravenous (IV) or 100 mg subcutaneous (SC) injections of mepolizumab, 3 mg/kg IV reslizumab, 20 to 30 mg SC benralizumab. We considered four‐weekly and eight‐weekly dosing schedules to be equally clinically valid and therefore pooled these data (Bleecker 2016; FitzGerald 2016). Mepolizumab can be administered by different routes (IV or SC); for the purpose of this review we considered these separately.
In future updates of this review, we will narratively describe skewed data reported as medians and interquartile ranges. Where multiple trial arms are reported in a single trial, we will include only the relevant arms. If two comparisons (e.g. drug A versus placebo and drug B versus placebo) are combined in the same meta‐analysis, we will halve the control group to avoid double‐counting.
Unit of analysis issues
We did not identify any cross‐over studies or cluster‐randomised trials for inclusion in this version of the review. If cross‐over trials are identified in the future, we will seek data from a paired analysis from the trial report or authors in order to appropriately include data in the review using the inverse variance method. If we identify cluster‐randomised trials in the future, then analyses will be at the level of the individual while allowing for the clustering in the data by using the intracluster correlation coefficient. If this is not reported in the trial, then we will impute it from similar studies.
Dealing with missing data
We contacted investigators in order to verify key study characteristics and obtain missing numerical outcome data where possible (e.g. when a study was identified as an abstract only). If this was not possible and the missing data were thought to introduce serious bias, we planned to explore the impact of including such studies in the overall assessment of results by a sensitivity analysis.
Assessment of heterogeneity
Statistical heterogeneity between studies was assessed visually by inspection of the forest plots and using the Chi2 test (a P value less than 0.10 was considered significant due to the low power of the test). We also calculated the I² statistic (Higgins 2003); this describes the percentage of the variability in effect estimates that is due to heterogeneity rather than sampling error (chance). Values of I² range from 0% to 100%, with 0% representing no heterogeneity and 100% representing considerable heterogeneity.
For this review, we defined heterogeneity as reported using the I² statistic as follows.
-
0% to 40%: heterogeneity might not be important.
-
30% to 60%: may represent moderate heterogeneity.
-
50% to 90%: may represent substantial heterogeneity.
-
75% to 100%: considerable heterogeneity.
Assessment of reporting biases
If we are able to pool more than 10 trials for future versions, we will create and examine a funnel plot to explore possible small study biases and publication bias.
Data synthesis
In view of the considerable clinical heterogeneity between the included studies, we used a random‐effects model.
Data on outcomes were combined at 6 months and 12 months. Where data for other time points were reported, these were also described.
Subgroup analysis and investigation of heterogeneity
Provided sufficient studies were included, we planned to carry out subgroup analyses according to:
-
eosinophilic individuals versus non‐eosinophilic individuals (as eosinophilia may be a prescribing requirement e.g. NICE 2017); and
-
age (0 to 5 years, 6 to 16 years, 17 years and older).
Using the outcomes:
-
'clinically significant' asthma exacerbations;
-
HRQoL (as measured by a validated questionnaire); and
-
measures of lung function (e.g. FEV1).
We used the formal test for subgroup interactions in RevMan 2014.
Sensitivity analysis
We planned to carry out the following sensitivity analyses if sufficient studies were included:
-
excluding studies with an overall high risk of bias;
-
excluding cross‐over trials and cluster‐randomised trials.
'Summary of findings' table
We created 'Summary of findings' tables using the following outcomes.
-
Asthma exacerbations
-
HRQoL (as measured by a validated questionnaire)
-
Measures of lung function (e.g. FEV1)
-
Adverse events
We used the five GRADE considerations (study limitations, consistency of effect, imprecision, indirectness and publication bias) to assess the quality of the body of evidence as it related to the studies that contributed data to the meta‐analyses for the prespecified outcomes. We used methods and recommendations described in Section 8.5 (Higgins 2011) and Chapter 12 (Schünemann 2011) of the Cochrane Handbook for Systematic Reviews of Interventions using GRADEpro GDT software (GRADEpro GDT 2015). We have justified all decisions to downgrade or upgrade the quality of studies using footnotes, and we have made comments to aid the reader's understanding of the review where necessary.
Results
Description of studies
Results of the search
We identified 301 records in our literature searches (Figure 1):
-
159 in database searches for the original mepolizumab review (last search April 2015)
-
126 in updated database searches for this review (in August 2016 and March 2017)
-
13 relevant studies reported in conference abstracts and two in study bibliographies in September 2016, and
-
A further study in April 2017 (identified on reviewing the ongoing studies and finding one had completed and published).
After removing duplicates, 265 records remained.
Thirteen (13) studies met our inclusion criteria ('Characteristics of included studies' table), and six others were included in the ongoing studies category ('Characteristics of ongoing studies' table). The thirteen studies included had 48 records:
-
The four included studies comparing mepolizumab versus placebo had 16 records: two for Chupp 2017, four for Haldar 2009, eleven for Ortega 2014 and six for Pavord 2012a.
-
The four included studies comparing reslizumab versus placebo had 16 records: five for Castro 2015a; three for Castro 2015b; four for Bjermer 2016, and three for Corren 2016.
-
The five included studies for benralizumab versus placebo had 16 records: three for Bleecker 2016; six for Castro 2014a; three for FitzGerald 2016; three for Park 2016, and one for NCT01947946 2013.
The remaining 211 records were excluded for various reasons ('Characteristics of excluded studies' table). In particular, Nair 2009 and Bel 2014 were excluded as the dose of prednisolone was reduced four weeks after the first dose of mepolizumab.
Included studies
Table 1 compares the design, numbers, interventions and participant groups in the included trials.
| Study | Design, follow‐up (weeks) | Baseline asthma severity | Baseline treatment | Intervention (route) | Primary and secondary outcomes |
| Chupp 2017 (551) | RCT, double‐blind, placebo‐controlled (24) | Blood eosinophils ≥ 150 cells/μL at screening or ≥ 300 cells/μL in previous 12 months; and ≥ 2 exacerbations in previous 12 months; and FEV1 < 80% | High‐dose ICS for ≥ 12 months; + additional controller for ≥ 3 months; ± maintenance OCS | Mepolizumab 100 mg (SC) or placebo every 4 weeks for 24 weeks (last dose at 20 weeks) | ‐ SGRQ ‐ Mean change from baseline pre‐bronchodilator FEV1 ‐ Proportion of SGRQ total score responders at week 24 ‐ Mean change from baseline in ACQ‐5 |
| Haldar 2009 (61) | RCT, double‐blind, placebo‐controlled, parallel‐group (50) | ≥ 3% sputum eosinophils; and ≥ 2 exacerbations in previous 12 months | High‐dose ICS | Mepolizumab 75 (IV) or matched placebo (150 mL of 0.9% saline) at monthly intervals for 1 y | ‐ Severe exacerbations per person ‐ Change in AQLQ ‐ post‐bronchodilator FEV1 ‐ Airway hyperresponsiveness ‐ Blood/sputum eosinophil counts |
| Ortega 2014 (576) | RCT, double‐blind, double‐dummy, phase 3 (32) | Blood eosinophils ≥ 150 cells/μL at screening or ≥ 300 cells/μL in previous 12 months; and ≥ 2 exacerbations in previous 12 months; and FEV1 < 80% | High‐dose ICS for ≥ 12 months; + additional controller for ≥ 3 months; ± maintenance OCS | Mepolizumab 75 mg (IV) or 100 mg (SC) or placebo every 4 weeks for 32 weeks | ‐ Exacerbations per y ‐ Mean change from baseline pre‐bronchodilator FEV1 ‐ Mean change from baseline SGRQ total score |
| Pavord 2012a (621) | Multicentre, double‐blind, placebo‐controlled (52) | ≥ 3% sputum eosinophils or blood eosinophil ≥ 300 cells/μL; and ≥ 2 exacerbations in previous 12 months | High‐dose ICS (i.e. ≥ 880 μg/d FP or equivalent daily); + additional controller; ± maintenance OCS | Mepolizumab 75 mg, 250 mg or 750 mg (IV) or placebo every 4 weeks for 13 doses | ‐ Time to first clinically significant exacerbation ‐ Frequency of exacerbations requiring hospitalisation ‐ Time to first exacerbation requiring hospitalisation or ED visit ‐ Mean change from baseline pre‐bronchodilator FEV1 ‐ Mean change from baseline post‐bronchodilator FEV1 ‐ Mean change from baseline ACQ |
| Bjermer 2016 (315) | RCT, double‐blind, placebo‐controlled, parallel‐group, fixed‐dosage, multicentre phase 3 (16) | Blood eosinophils ≥ 400 cells/μL during 2‐4 weeks screening period; and ACQ‐7 score ≥ 1.5 | Medium‐dose ICS; maintenance OCS not allowed | Reslizumab 0.3 mg/kg or 3 mg/kg (IV) or placebo every 4 weeks for 4 doses | ‐ Pre‐bronchodilator FEV1, FVC, FEF25‐75 ‐ ACQ, ACQ‐6, ACQ‐5 ‐ ASUI ‐ AQLQ ‐ Rescue inhaler use ‐ Blood eosinophil levels |
| Castro 2015a (489) and Castro 2015b (464) | 2 x duplicate RCT double‐blind, placebo‐controlled, parallel‐group, multicentre, phase 3 (52) | Blood eosinophils ≥ 400 cells/μL during 2‐4 week screening period; and ACQ‐7 score ≥ 1.5 | Medium‐dose ICS (i.e. ≥ 440 μg/day FP or equivalent daily); ± additional controller or maintenance OCS | Reslizumab 3 mg/kg (IV) or matching placebo every 4 weeks for 13 doses (last dose week 48) | ‐ Annual frequency of exacerbations ‐ Change in FEV1 from baseline over 16 weeks ‐ ACQ‐7 score ‐ ASUI score ‐ Rescue use of SABA ‐ Blood eosinophil count ‐ AQLQ total score at weeks 16, 32 and 52 |
| Corren 2016 (496) | RCT double‐blind, placebo‐controlled, multicentre phase 3 (16) | ACQ‐7 score ≥ 1.5 (no selection based on blood eosinophils) | Medium‐dose ICS; maintenance OCS not allowed | Reslizumab 3 mg/kg (IV) or matching placebo every 4 weeks for 4 doses | ‐ Change in FEV1 from baseline ‐ ACQ‐7 score ‐ Rescue (SABA) use within previous 3 days ‐ FVC ‐ Blood eosinophils |
| Bleecker 2016 (1204) | RCT double‐blind, parallel‐group, placebo‐controlled multicentre (52) | ≥ 2 exacerbations in the previous 12 months; and ACQ‐6 score ≥ 1.5 at enrolment; and FEV1 < 80% (if 12‐17 years old, < 90%) | Adults (> 18 y) high‐dose (≥ 500 μg/d FP or equivalent) ICS/LABA for ≥ 12 months Children (12‐17 y) at least medium‐dose (≥ 250 μg/day FP or equivalent) ICS/LABA | Benralizumab 30 mg (SC) or placebo either every 4 weeks or every 4 weeks for the first 3 doses then every 8 weeks or placebo for 48 weeks | ‐ Annual exacerbation rate ‐ Pre‐bronchodilator FEV1 ‐ Total asthma symptom score ‐ Time to first exacerbation ‐ Annual rate of exacerbations requiring ED visit or hospital admission ‐ Post‐bronchodilator FEV1 ‐ ACQ‐6 ‐ AQLQ(S)+12 score |
| Castro 2014a (606) | RCT double‐blind, placebo‐controlled, multicentre dose‐ranging (52) | 2‐6 exacerbations in the previous 12 months; and ACQ‐6 score ≥ 1.5 at least twice during screening; and morning pre‐bronchodilator FEV1 40%‐90% | Medium‐ to high‐dose ICS in combination with LABA for ≥ 12 months | Benralizumab 2 mg, 20 mg or 100 mg (SC) or placebo every 4 weeks for the first 3 doses, then every 8 weeks (total 7 doses) | ‐ Annual exacerbation rate ‐ Change from baseline in FEV1 ‐ Mean ACQ‐6 score ‐ Overall symptom score ‐ Mean AQLQ score |
| FitzGerald 2016 (1306) | RCT, double‐blind, parallel‐group, placebo‐controlled multicentre (56) | ≥ 2 exacerbations in the previous 12 months; and ACQ‐6 score ≥ 1.5 at enrolment; and FEV1 < 80% | Medium‐ (≥ 250 μg/d FP or equivalent) to high‐dose (≥ 500 μg/d FP or equivalent) ICS/LABA for ≥ 12 months; high‐dose ICS/LABA for ≥ 3 months | Benralizumab 30 mg (SC) or placebo either every 4 weeks or every 4 weeks for the first 3 doses then every 8 weeks or placebo | ‐ Annual exacerbation rate for participants with blood eosinophils ≥ 300 cells/μL ‐ Pre‐bronchodilator FEV1 ‐ Total asthma symptom score ‐ Time to first exacerbation ‐ Annual rate of exacerbations requiring ED visit or hospital admission ‐ Post‐bronchodilator FEV1 ‐ ACQ‐6 ‐ AQLQ(S)+12 score |
| (13) | RCT double‐blind, parallel‐group, placebo‐controlled multicentre (48) | Uncontrolled asthma taking medium‐dose ICS plus LABA | Medium‐dose ICS (>250ug and ≤500ug fluticasone dry powder formulation equivalents total daily dose) and LABA for at least 3 month prior to first visit | Benralizumab 30 mg (SC) or placebo either every 4 weeks or every 4 weeks for the first 3 doses then every 8 weeks or placebo | Asthma exacerbations over 48‐week treatment period |
| Park 2016 (103) | RCT double‐blind, placebo‐controlled, dose‐ranging multicentre (52) | 2‐6 exacerbations in the previous 12 months; and ACQ‐6 score ≥ 1.5 at least twice during screening; and morning pre‐bronchodilator FEV1 40%‐90% | Medium‐ to high‐dose ICS in combination with LABA for ≥ 12 months | Benralizumab 2 mg, 20 mg or 100 mg (SC) or placebo every 4 weeks for the first 3 doses, then every 8 weeks (total 7 doses) | ‐ Annual exacerbation rate ‐ Lung function ‐ ACQ‐6 ‐ FeNO ‐ Blood eosinophil counts |
ACQ: Asthma Control Questionnaire; AQLQ: Asthma Quality of Life Questionnaire; ASUI: Asthma Symptom Utility Index; BDP: beclomethasone dipropionate; b: day; ECP: eosinophil cationic protein; ED: emergency department; FEF25‐75 : forced expiratory flow at 25% to 75% of FVC; FeNO: exhaled fraction of nitric oxide; FEV1 : Forced expiratory volume in 1 second; FVC: forced vital capacity; FP; fluticasone propionate; ICS; inhaled corticosteroid; IV: intravenous; LABA: long‐acting beta2 agonistOCS; oral corticosteroid; PC20 : histamine provocative concentration causing a 20% drop in FEV1; PEFR: peak expiratory flow rate; RCT: randomised controlled trial; SABA: short‐acting beta2‐agonists; SC: subcutaneous; SGRQ: St George's Respiratory Questionnaire; y: year
Mepolizumab
We included four studies comparing mepolizumab versus placebo ('Characteristics of included studies' table), involving 1809 total participants distributed as follows: Chupp 2017 n = 551; Haldar 2009 n = 61; Ortega 2014 n = 576, and Pavord 2012a n = 621. Mepolizumab was administered intravenously (IV) in Haldar 2009 (at a dose of 750 mg) and Pavord 2012a (at doses of 75 mg, 250 mg and 750 mg), subcutaneously (SC) in Chupp 2017, and via both routes (75 mg IV or 100 mg SC) in Ortega 2014 over a range of treatment periods. For Pavord 2012a, we only included the arm dosed at 75 mg, as this is considered comparable to the 100 mg SC dose that is licensed (according to manufacturer's evidence submission to the UK's National Institute for Health and Care Excellence in November 2015).
The studies only included participants with severe eosinophilic asthma. In all four studies severe disease was defined as requiring high‐dose ICS and a second controller medication plus a history of at least two exacerbations in the preceding 12 months. In addition Chupp 2017 and Ortega 2014 required that participants had impaired lung function despite treatment with an FEV1 of less than 80%. Eosinophilia was defined as a serum eosinophil count of 150 cells or more per μL at screening or 300 cells or more per μL at some time during the previous year (Chupp 2017; Ortega 2014), or either a sputum eosinophil count of 3% or more (Haldar 2009) and/or a blood eosinophil count of 300 cells or more per μL (Pavord 2012a). The blood eosinophil thresholds used in Chupp 2017 and Ortega 2014 were identified as those that best predicted response to mepolizumab in a secondary analysis of previous studies (Ortega 2014; Pavord 2012a).
Reslizumab
Four studies comparing reslizumab versus placebo were included ('Characteristics of included studies' table), involving 1764 total participants distributed as follows: Bjermer 2016 n = 315, Castro 2015a n = 489; Castro 2015b n = 464; and Corren 2016 n = 496. Reslizumab was administered intravenously in all four studies over a range of treatment periods at a dose of 3.0 mg/kg, with an additional arm at a dose of 0.3 mg/kg in Bjermer 2016, which was not included as it is 10 times lower than the licensed dose of 3.0 mg/kg.
All the participants had moderate to severe asthma, defined as requiring medium‐dose ICS. In addition they had inadequate symptom control, with an ACQ of 1.5 or more. In addition Castro 2015a and Castro 2015b required a history of at least one exacerbation in the preceding 12 months. Three studies of reslizumab (Bjermer 2016; Castro 2015a; Castro 2015b) required that participants had a blood eosinophil count of 400 cells or more per μL, which has been shown to be predictive of a sputum eosinophil count of 3% or more in studies of participants with paired blood and sputum samples (Farooqui 2009; Van Veen 2009). Corren 2016 included participants with a range of eosinophil counts.
Benralizumab
We included five studies comparing benralizumab versus placebo ('Characteristics of included studies' table), involving 3232 total participants distributed as follows: Bleecker 2016 n = 1204; Castro 2014a n = 606; FitzGerald 2016 n = 1306, NCT01947946 2013 n = 13 and Park 2016 n = 103. The benralizumab was administered subcutaneously in all studies, with dosage varying from 2 mg to 100 mg every four or eight weeks over a range of treatment periods. We only included participants dosed with 20 mg or 30 mg benralizumab in the analysis, as the other doses are unlikely to be licensed and therefore used clinically. NCT01947946 2013 was terminated due to sponsor decision after randomising 13 participants and contributes no data to the review.
The severity of asthma among participants varied from moderate to severe, defined as a requirement for maintenance therapy with medium‐ or high‐dose ICS plus LABA. Participants also had poor asthma control, determined by a history of at least two exacerbations in the previous 12 months and an ACQ of 1.5 or above in the studies contributing data. All five benralizumab trials included participants regardless of eosinophilia, but results were stratified by blood eosinophil count using a threshold of 300 cells or more per μL.
Excluded studies
We excluded 187 studies from the review (from 211 references). Of these: 117 (61%) because anti‐IL‐5 therapy had not been included in the study; 32 (17%) were not randomised placebo‐controlled studies; 14 (8%) had a treatment period of less than 16 weeks; 11 (6%) were conducted on participants without a diagnosis of asthma; 9 (5%) were an aggregation of trials, and 4 (2%) because the focus was on steroid reduction. (See 'Characteristics of excluded studies' table).
Risk of bias in included studies
Details of our 'Risk of bias' assessments are available in the 'Characteristics of included studies' table, and a summary of our assessment can be seen in Figure 2 and Figure 3.
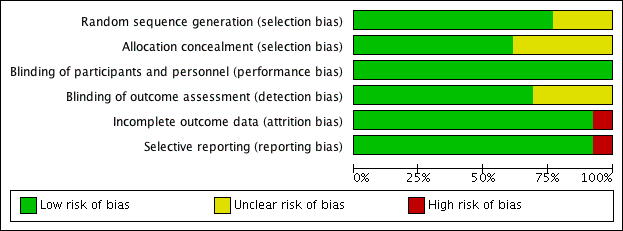
Risk of bias graph: review authors' judgements about each risk of bias item presented as percentages across all included studies

Risk of bias summary: review authors' judgements about each risk of bias item for each included study
Allocation
We deemed the majority of studies to be at low risk of bias for both random sequence generation and allocation concealment. Three studies (Bjermer 2016; Corren 2016; NCT01947946 2013) presented no details on either random sequence generation or allocation concealment, whereas a further two (Haldar 2009; Park 2016) presented no details on allocation concealment only (Figure 3).
Blinding
We determined that all 13 studies were at low risk of performance bias, and nine were at low risk of detection bias; the risk of detection bias was unclear for four studies (Bjermer 2016; Bleecker 2016; NCT01947946 2013; Park 2016) (Figure 3).
Incomplete outcome data
We considered all 12 studies contributing data to be at low risk of attrition bias (Figure 3). One study, in which no participant completed the trial, was deemed to be at high risk (NCT01947946 2013).
Selective reporting
We considered the risk of reporting bias to be low in 12 studies (Figure 3) and high in the terminated study (NCT01947946 2013).
Other potential sources of bias
We did not note any other potential sources of bias.
Effects of interventions
See: Summary of findings for the main comparison Mepolizumab subcutaneous (SC) compared to placebo for asthma; Summary of findings 2 Mepolizumab intravenous (IV) compared to placebo for asthma; Summary of findings 3 Reslizumab intravenous (IV) compared to placebo for asthma; Summary of findings 4 Benralizumab subcutaneous (SC) compared to placebo for asthma
Mepolizumab (SC) versus placebo
The data for this comparison come from two studies, Chupp 2017 and Ortega 2014, with a combined 936 participants with severe eosinophilic asthma. In both studies this was defined as a serum eosinophil count of 300 cells or more per μL in the preceding 12 months or 150 cells or more per μL at screening. Our confidence in the results below is high, as both studies were large with a robust methodology.
Primary Outcomes
'Clinically significant' asthma exacerbation (as defined by treatment with a course of systemic corticosteroids, with or without hospital attendance or admission)
The meta‐analysis produced a statistically significant effect favouring mepolizumab, versus placebo, from the two studies contributing data to this outcome Chupp 2017; Ortega 2014 (rate ratio 0.45, 95% confidence interval (CI) 0.36 to 0.55; participants = 936; studies = 2) (Analysis 1.1).
Secondary outcomes
Exacerbations requiring emergency department treatment or admission
The rate of exacerbations requiring emergency department treatment or admission from the two studies (Chupp 2017; Ortega 2014) contributing to this outcome was significantly lower in the mepolizumab condition (rate ratio 0.36, 95% CI 0.20 to 0.66; participants = 936; studies = 2) (Analysis 1.2); and the rate of exacerbations requiring admission in the same two studies similarly favoured mepolizumab versus placebo (rate ratio 0.31, 95% CI 0.13 to 0.73; participants = 936; studies = 2) (Analysis 1.3).
HRQoL (as measured by a validated questionnaire e.g. ACQ, AQLQ, SGRQ)
Two studies (Chupp 2017; Ortega 2014) contributed HRQoL data measured by the ACQ instrument, indicating a statistically significant effect in favour of mepolizumab versus placebo (mean difference (MD) ‐0.42, 95% CI ‐0.56 to ‐0.28; participants = 936; studies = 2) (Analysis 1.4), but this did not meet the minimum clinically important difference (MCID) of 0.5 points in the ACQ. However there was a statistically and clinically significant improvement in the SGRQ in these studies (MD ‐7.40, 95% CI ‐9.50 to ‐5.29; participants = 936; studies = 2) (Analysis 1.5); the MCID is ‐4 points for the SGRQ). The SGRQ is a 50‐item questionnaire with questions covering three domains: symptoms, activity, and impacts (psycho‐social). The ACQ has between five and seven items (there are three variations) focused on asthma symptoms and airflow limitation (the seven‐item ACQ includes short‐acting bronchodilator use for symptom relief and FEV1). Thus the intervention may have had broader effects on activity and psycho‐social aspects that were not captured by the ACQ.
In a responder analysis, Chupp 2017 found 59% of participants experienced an improvement greater than the MCID of 0.5 points in the ACQ, versus 42% of participants on placebo (P = 0.0014), and 73% had an improvement of greater than the MCID of 4 points in the SGRQ, versus 55% in the placebo arm (P < 0.0001).
Measures of lung function (e.g. FEV1)
We observed a statistically significant increase of 110 mL in pre‐bronchodilator FEV1 in the mepolizumab condition of the aggregated studies (Chupp 2017; Ortega 2014) (MD 0.11 L, 95% CI 0.06 to 0.17; participants = 936; studies = 2) (Analysis 1.6). This is a relatively modest increase; although there is no universally accepted MCID for FEV1 in asthma, variability within a single testing session can be up to 0.12 L (data from a mixed pool of respiratory patients, Enright 2004).
Serious adverse events
Overall there were statistically fewer serious adverse events in the mepolizumab condition when we combined data from Chupp 2017 and Ortega 2014 (risk ratio 0.63, 95% CI 0.41 to 0.97; participants = 936; studies = 2) (Analysis 1.7). This may be due to a reduction in asthma‐related serious adverse events (e.g. exacerbations requiring hospitalisation, which were significantly reduced), although neither study achieved statistical significance alone and therefore this was not commented on by the investigators. It is also possible that the inclusion of asthma‐related serious adverse effects, which were reduced, could mask a relatively smaller increase in non‐asthma‐related serious adverse effects; in future it would be useful for this to be separated.
'Clinically significant' adverse events (defined as those prompting participants to stop the intervention)
There was no significant statistical difference between the two conditions with respect to this outcome (risk ratio 0.45, 95% CI 0.11 to 1.80; participants = 936; studies = 2; I² = 0%) (Analysis 1.8).
Serum eosinophil counts
Insufficient data were available to analyse this outcome. However Ortega 2014 reported a decrease in serum eosinophil counts by week 4, with a maximal drop of 86% by week 12 that was maintained during the study.
Mepolizumab (IV) versus placebo
The data for this comparison come from three studies (Haldar 2009; Ortega 2014; Pavord 2012a) with a combined 751 participants, all with severe eosinophilic asthma; there were no subgroups with non‐eosinophilic participants. Our confidence in the results is moderate, as IV delivery is not currently a licenced delivery route for mepolizumab, and although the results for exacerbations mirror those with mepolizumab SC, those for HRQoL measures do not.
Primary Outcomes
'Clinically significant' asthma exacerbation (as defined by treatment with a course of systemic corticosteroids, with or without hospital attendance or admission)
The rate of 'clinically significant' exacerbations was significantly lower in the mepolizumab condition (rate ratio 0.53, 95% CI 0.44 to 0.64; participants = 751; studies = 3 (Haldar 2009; Ortega 2014; Pavord 2012a)) (Analysis 2.1).
Secondary outcomes
Exacerbations requiring emergency department treatment or admission
The rate of exacerbations requiring emergency department treatment or admission was significantly lower in the mepolizumab condition (rate ratio 0.52, 95% CI 0.31 to 0.87; participants = 690; studies = 2 (Ortega 2014; Pavord 2012a)) (Analysis 2.2). The rate of exacerbations requiring admission favoured the intervention group but this did not reach statistical significance (rate ratio 0.61, 95% CI 0.33 to 1.13; participants = 690; studies = 2 (Ortega 2014; Pavord 2012a)) (Analysis 2.3).
These findings are consistent with results from a smaller trial (participants = 61; Haldar 2009), which reported three admissions for asthma exacerbations in the mepolizumab group (n = 29) compared to 11 in the placebo group (n = 32; P = 0.07). However there was no significant difference between mepolizumab versus placebo in terms of people experiencing one or more exacerbations in this smaller trial (Haldar 2009; risk ratio 0.82, 95% CI 0.61 to 1.09; participants = 61; studies = 1) (Analysis 2.4).
HRQoL (as measured by a validated questionnaire e.g. ACQ, AQLQ, SGRQ)
There was no significant difference between mepolizumab and placebo for HRQoL when measured using the AQLQ instrument (MD 0.21, 95% CI ‐0.06 to 0.47; participants = 369; studies = 2 (Haldar 2009; Pavord 2012a)) (Analysis 2.5). Similarly there was no statistically reliable difference between the two conditions when measuring HRQoL using the ACQ in these studies (MD ‐0.11, 95% CI ‐0.32 to 0.09; participants = 369; studies = 2) (Analysis 2.6). However, we observed a statistically significant benefit favouring mepolizumab in HRQoL using the SGRQ in a single study (MD ‐6.40, 95% CI ‐9.65 to ‐3.15; participants = 382; studies = 1 (Ortega 2014)) (Analysis 2.7). These results conflict with those with mepolizumab SC, but in those cases where statistical significance was not reached, the trend was in favour of mepolizumab and so it may be that the effect is relatively small and this outcome is therefore underpowered.
Measures of lung function (e.g. FEV1)
We observed a statistically significant benefit favouring mepolizumab in pre‐bronchodilator FEV1 (litres) (MD 0.08, 95% CI 0.02 to 0.15; participants = 690; studies = 2 (Ortega 2014; Pavord 2012a)) (Analysis 2.8). This increase is comparable, but slightly smaller, than that for mepolizumab SC and, at an individual participant level, would be considered within the normal range of variability at a single session (Enright 2004).
Serious adverse events
Significantly fewer serious adverse events occurred in the mepolizumab condition (risk ratio 0.59, 95% CI 0.37 to 0.94; participants = 751; studies = 3 (Haldar 2009; Ortega 2014; Pavord 2012a); I² = 27%) (Analysis 2.9). As with mepolizumab SC, this may be due to a reduction in asthma‐related serious adverse events but as the individual studies did not report a clear effect, there is no comment by the investigators.
'Clinically significant' adverse events (defined as those prompting discontinuation)
For this outcome there was no significant difference between mepolizumab versus placebo (risk ratio 0.72, 95% CI 0.18 to 2.92; participants = 751; studies = 3 (Haldar 2009; Ortega 2014; Pavord 2012a); I² = 24%) (Analysis 2.10).
Serum eosinophil counts
We included a single small study (Haldar 2009) in the analysis as it was the only one to report serum eosinophil counts. This reported a significant benefit favouring mepolizumab (MD ‐170.00, 95% CI ‐230.00 to ‐110.00; participants = 61; studies = 1 (Haldar 2009)) (Analysis 2.11).
Ortega 2014 also reported a decrease in serum eosinophil counts by week 4, with a maximal drop of 83% by week 12 that was maintained during the study, but did not provide absolute counts that could be included.
Reslizumab (IV) versus placebo
The data for this comparison come from four studies (Bjermer 2016; Castro 2015a; Castro 2015b; Corren 2016) with a combined 1652 participants. One of these studies included participants with non‐eosinophilic asthma (Corren 2016). Our confidence in the results as applied to eosinophilic participants is high, as the studies were large and had a robust methodology. Where data were available for non‐eosinophilic participants we have compared the effect estimate with that for eosinophilic participants using the test for subgroup difference.
Primary Outcomes
'Clinically significant' asthma exacerbation (as defined by treatment with a course of systemic corticosteroids, with or without hospital attendance or admission)
There were significantly fewer 'clinically significant' asthma exacerbations in the reslizumab condition (rate ratio 0.43, 95% CI 0.33 to 0.55; participants = 953; studies = 2 (Castro 2015a; Castro 2015b)) (Analysis 3.1). This only included eosinophilic participants; there were no data for non‐eosinophilic participants.
Secondary outcomes
Exacerbations requiring emergency department treatment or admission
There was no significant difference between reslizumab versus placebo on this outcome (rate ratio 0.67, 95% CI 0.39 to 1.17; participants = 953; studies = 2 (Castro 2015a; Castro 2015b)) (Analysis 3.2). This only included eosinophilic participants; there were no data for non‐eosinophilic participants.
HRQoL (as measured by a validated questionnaire e.g. ACQ, AQLQ, SGRQ)
Participants in the reslizumab condition experienced a significantly better HRQoL measured by the AQLQ instrument (MD 0.28, 95% CI 0.17 to 0.39; participants = 1164; studies = 3 (Bjermer 2016; Castro 2015a; Castro 2015b)) (Analysis 3.3), although this failed to meet the MCID of 0.5 points or more. This only included eosinophilic participants; there were no data for non‐eosinophilic participants.
We found the same effect when using the ACQ (MD ‐0.25, 95% CI ‐0.33 to ‐0.17; participants = 1652; studies = 4 (Bjermer 2016; Castro 2015a; Castro 2015b; Corren 2016)) (Analysis 3.4), again, lower than the MCID of ‐0.5 points or more. In this analysis data were available (in only one study, Corren 2016) from non‐eosinophilic participants and for that particular group there was no significant difference between reslizumab versus placebo on this outcome. However, the formal test for subgroup difference was not significant (P = 0.19, I² = 41.1%).
Measures of lung function (e.g. FEV1)
We noted a clear, statistically significant increase in pre‐bronchodilator FEV1 with reslizumab treatment (MD 0.11 L, 95% CI 0.07 to 0.15; participants = 1652; studies = 4 (Bjermer 2016; Castro 2015a; Castro 2015b; Corren 2016)) (Analysis 3.5). For this outcome data from non‐eosinophilic participants were available (again in only one study, Corren 2016) and for that subgroup we observed no significant difference between reslizumab versus placebo. As in the ACQ data, there was a significant benefit only in eosinophilic participants. However, as before, the formal test for subgroup differences was not significant (P = 0.13, I² = 56.3%). Again it is worth noting that the absolute difference of 0.11 L is relatively modest, although there is no consensus around a MCID in FEV1 in asthma.
Serious adverse events
There was no significant difference in the number of serious adverse events occurring in the two conditions (risk ratio 0.79, 95% CI 0.56 to 1.12; participants = 1656; studies = 4 (Bjermer 2016; Castro 2015a; Castro 2015b; Corren 2016); I² = 0%) (Analysis 3.6).
There was a reduction favouring the treatment group with the pooled mepolizumab trials, which may have been due to a reduction in asthma‐related serious adverse events (the pooled studies showed significantly fewer asthma exacerbations requiring hospital admission, which would qualify as a serious adverse event). However there was no significant difference in the rate of hospitalisations due to asthma exacerbations in studies of reslizumab, which may explain the discrepancy in serious adverse events compared to mepolizumab.
'Clinically significant' adverse events (defined as those prompting discontinuation)
There was no significant difference between reslizumab versus placebo on this outcome (risk ratio 0.66, 95% CI 0.43 to 1.02; participants = 1659; studies = 4 (Bjermer 2016; Castro 2015a; Castro 2015b; Corren 2016); I² = 0%) (Analysis 3.7).
Serum eosinophil counts
The serum eosinophil counts were significantly reduced in the reslizumab condition (MD ‐476.83, 95% CI ‐499.32 to ‐454.34; participants = 1656; studies = 4 (Bjermer 2016; Castro 2015a; Castro 2015b; Corren 2016)) (Analysis 3.8). This only included eosinophilic participants; note that a reduction in eosinophils amongst participants whose eosinophil counts are within the normal range to start with is not necessarily desirable or achievable.
Benralizumab (SC) versus placebo
The data for this comparison come from four studies (Bleecker 2016; Castro 2014a; FitzGerald 2016; Park 2016) with a combined 2648 participants. All four studies included participants with an eosinophilic and non‐eosinophilic phenotype, with more complete data presented for eosinophilic participants. In addition two studies had additional treatment arms for four‐weekly and eight‐weekly dosing regimens (Bleecker 2016; FitzGerald 2016), which we have shown separately in the meta‐analyses with the placebo group split across them (and adjusted accordingly). Our confidence in the results is high, as the studies were large and had a robust methodology. However limited data were available on non‐eosinophilic subgroups, and these were variably consistent with the findings in eosinophilic subgroups.
Primary Outcomes
'Clinically significant' asthma exacerbation (as defined by treatment with a course of systemic corticosteroids, with or without hospital attendance or admission)
Significantly fewer 'clinically significant' asthma exacerbations occurred in the benralizumab condition (rate ratio 0.62, 95% CI 0.55 to 0.70; participants = 2456; studies = 3 (Bleecker 2016; Castro 2014a; FitzGerald 2016)) (Analysis 4.1). We observed this effect in both eosinophilic and non‐eosinophilic participants, with a slightly larger effect for the eosinophilic subgroup (eosinophilic: rate ratio 0.59, 95% CI 0.51 to 0.68 versus non‐eosinophilic: rate ratio 0.69, 95% CI 0.56 to 0.85) but the test for subgroup difference was non‐significant (P = 0.22, I² = 33.9%).
Secondary outcomes
Exacerbations requiring emergency department treatment or admission
There were significantly fewer exacerbations requiring emergency department treatment or admission for participants in the benralizumab condition (rate ratio 0.68, 95% CI 0.47 to 0.98; participants = 1537; studies = 2 (Bleecker 2016; FitzGerald 2016)) (Analysis 4.2). This only included eosinophilic participants; there were no data for non‐eosinophilic participants. However there was a considerable degree of heterogeneity (I² = 43%), despite the Bleecker 2016 and FitzGerald 2016 studies having the same design. Both studies noted heterogeneity in the exacerbation history of their participants, FitzGerald 2016 specifically commenting that participants recruited in Eastern Europe and South America had fewer exacerbations in the year before study entry than those recruited elsewhere. These would therefore have less scope for a reduction in exacerbation. FitzGerald 2016 noted that participants who had had three or more exacerbations in the previous year had the greatest effects of benralizumab treatment, at rates comparable to the Bleecker 2016 study.
HRQoL (as measured by a validated questionnaire e.g. ACQ, AQLQ, SGRQ)
HRQoL (AQLQ mean difference) was significantly better in the benralizumab condition (MD 0.23, 95% CI 0.11 to 0.35; participants = 1541; studies = 3 (Bleecker 2016; Castro 2014a; FitzGerald 2016)) (Analysis 4.3); on this particular outcome data were available only from eosinophilic participants. However a similar significant advantage in favour of benralizumab was also observed with both eosinophilic and non‐eosinophilic participants when measuring HRQoL with the ACQ instrument (MD ‐0.20, 95% CI ‐0.29 to ‐0.11; participants = 2359; studies = 3 (Bleecker 2016; Castro 2014a; FitzGerald 2016)) (Analysis 4.4). When taking the non‐eosinophilic subgroup only this fell short of statistical significance (MD ‐0.14, 95% CI ‐0.30 to 0.02), although the test for subgroup difference was non‐significant (P = 0.36, I² = 0%). Neither difference reached the MCID of 0.5 points or more on either the AQLQ or ACQ scale.
Measures of lung function (e.g. FEV1)
Pre‐bronchodilator FEV1 was significantly superior in the benralizumab condition (MD 0.10, 95% CI 0.05 to 0.14; participants = 2355; studies = 3 (Bleecker 2016; Castro 2014a; FitzGerald 2016)) (Analysis 4.5). However on closer inspection it was apparent that only eosinophilic participants had experienced this benefit, with a significant test for subgroup difference between eosinophilic and non‐eosinophilic participants (P = 0.02, I² = 82.0%). This improvement of 0.10 L is of a similar magnitude to that seen with mepolizumab and reslizumab, and is relatively modest.
Serious adverse events
There was no significant difference in the number of serious adverse events occurring in the two conditions (risk ratio 0.81, 95% CI 0.66 to 1.01; participants = 2648; studies = 4 (Bleecker 2016; Castro 2014a; FitzGerald 2016; Park 2016); I² = 0%)( Analysis 4.6), based on eosinophilic and non‐eosinophilic participants (including a subgroup of participants whose eosinophil status was not defined).
This is slightly surprising given that the pooled analysis for mepolizumab showed a reduction in serious adverse events compared to placebo, which may have been due to a reduction in asthma‐related serious adverse events such as exacerbations requiring admission, which was also seen with benralizumab (significantly fewer exacerbations requiring admission or emergency department treatment). However the size of the effect on asthma exacerbations requiring admission or emergency department treatment was smaller with benralizumab (rate ratio 0.68, 95% CI 0.47 to 0.98) than mepolizumab (rate ratio 0.36, 95% CI 0.20 to 0.66 for mepolizumab SC; rate ratio 0.52, 95% CI 0.31 to 0.87 for mepolizumab IV). The dilution of this by including other adverse events may have been sufficient to make it non‐significant. Indeed examining the rate ratios suggests that this is the case both for mepolizumab, where the 95% CIs are nearer to 1 than it is for the asthma exacerbation outcomes, and benralizumab, where the upper CI is 1.01. Equally it is possible that benralizumab results in relatively greater numbers of non‐asthma‐related serious adverse events than mepolizumab (or reslizumab), given its different mechanism of action. It will be important in future to distinguish asthma‐related from non‐asthma‐related serious adverse events and, if licensed, to monitor real‐world data.
'Clinically significant' adverse events (defined as those prompting discontinuation)
There were significantly fewer 'clinically significant' adverse events in the placebo condition (risk ratio 2.15, 95% CI 1.02 to 4.57; participants = 2597; studies = 3 (Bleecker 2016; Castro 2014a; FitzGerald 2016); I² = 0%) (Analysis 4.7), based on eosinophilic and non‐eosinophilic participants (including a subgroup of participants whose eosinophil status was not defined). The individual studies did not find a statistically significant effect and thus there was no comment by the investigators. However benralizumab has a different mechanism of action resulting in a much larger reduction in eosinophils, which could result in an increase in adverse events. This is an area for further research.
Serum eosinophil levels (% change from baseline)
The serum eosinophil levels were significantly reduced in the benralizumab condition (MD ‐104.74, 95% CI ‐116.12 to ‐93.35; participants = 2295; studies = 2 (Bleecker 2016; FitzGerald 2016)) (Analysis 4.8). This included both eosinophilic and non‐eosinophilic participants. This is shown as a percentage change rather than absolute number, which was not available. There was also a marked reduction in serum eosinophils in Castro 2014a, with mean values of 46 to 56 cells per μL in participants with 300 or more cells per μL at baseline, and in Park 2016, to around 0 cells per μL from a mean of 564 to 824 cells per μL (these data were shown graphically and could not be extracted for inclusion in the meta‐analysis).
Discussion
Summary of main results
Thirteen studies met the inclusion criteria for this systematic review (Bjermer 2016; Bleecker 2016; Castro 2014a; Castro 2015a; Castro 2015b; Chupp 2017; Corren 2016; FitzGerald 2016; Haldar 2009; NCT01947946 2013; Ortega 2014; Park 2016; Pavord 2012a). Five studies included adult participants only (Castro 2014a; Corren 2016; Haldar 2009; NCT01947946 2013; Park 2016) while the remaining eight (Bjermer 2016; Bleecker 2016; Castro 2015a; Castro 2015b; Chupp 2017; FitzGerald 2016; Pavord 2012a; Ortega 2014) included participants aged 12 years and over. Results in adolescents were not reported separately and thus we could not perform a subgroup analysis on this population.
The results suggest that treatments targeting IL‐5 or the IL‐5 receptor reduce 'clinically significant' asthma exacerbation rates by approximately half in participants with severe eosinophilic asthma already on standard of care therapy with a history of poor control ('clinically significant' exacerbations defined as episodes requiring at least three days' treatment with systemic corticosteroids; standard of care defined as at least medium‐dose ICS; poor control defined as either two or more exacerbations in the preceding 12 months or an ACQ score of 1.5 or more). The effect size was largest with reslizumab and mepolizumab SC, although the study design and populations studied differed across trials and no head‐to‐head trials were performed. In addition, treatment with mepolizumab SC and benralizumab significantly reduced rates of exacerbations requiring emergency department attendance or hospital admission, with mepolizumab IV and reslizumab also showing a non‐significant trend towards this. Non‐eosinophilic participants experienced a significant, albeit smaller, reduction in asthma exacerbation rates when treated with benralizumab (with the test for subgroup difference non‐significant); no data were available for mepolizumab or reslizumab treatment in participants with non‐eosinophilic asthma. Whether this finding will be replicated with mepolizumab and reslizumab is uncertain.
Mepolizumab SC, reslizumab and benralizumab all produced modest improvements in validated HRQoL scores (e.g. ACQ, AQLQ) in severe eosinophilic asthma. However these did not exceed the MCID for ACQ and AQLQ. Improvements in the SGRQ did reach the MCID but came from only two studies (Chupp 2017; Ortega 2014). This may be due to differences between the different tools used. The SGRQ is a longer (50‐item) questionnaire with three domains (symptoms, activity, and psychosocial impact); the ACQ is much shorter (five to seven items) and focuses on asthma symptoms and airflow limitation; however the AQLQ is more like the SGRQ, with 32 items in four domains (symptoms, activity, emotional function, environmental stimuli). It is therefore not entirely clear why there were differences between the SGRQ and the AQLQ in particular, although an analysis of the results by question domain might be illuminating in that regard.
We saw no improvement in HRQoL scores in those treated with mepolizumab IV or non‐eosinophilic participants treated with benralizumab (data not available for mepolizumab or reslizumab), although in both cases there was a non‐significant trend in this direction. The effect size was largest with mepolizumab, although again the study designs and populations enrolled differed with no head‐to‐head studies to assess this.
All anti‐IL‐5 interventions produced a small but statistically significant improvement in mean pre‐bronchodilator FEV1 of between 0.08 L and 0.11 L. There is no agreed definition of a MCID in FEV1 in asthma, but the reproducibility of FEV1 values in a single session in participants with a range of respiratory conditions is up to 0.12 L (Enright 2004) suggesting that the increase with anti‐IL‐5 is modest.
Treatment with mepolizumab (SC and IV) and reslizumab appeared to be safe, although there remain safety concerns over benralizumab. Pooling the results of the clinical trials of mepolizumab (SC and IV), but not benralizumab or reslizumab, showed a small but statistically significant reduction in severe adverse events in favour of the active treatment group. This may well be attributable to the impact of the study drug on asthma‐related adverse events, particularly those leading to hospital admission that would be classed as serious adverse events (although the split of asthma‐ and non‐asthma‐related adverse events was not provided). When considering adverse events prompting participants to discontinue the study drug, there was a small but significant increase with benralizumab compared to placebo, which was not the case for mepolizumab (SC or IV) or reslizumab. This may be due to the different mechanism of action of benralizumab; further research is needed.
There were marked reductions in blood eosinophil levels with all anti‐IL‐5 treatments. Benralizumab resulted in almost complete depletion of eosinophils from the peripheral circulation, in both eosinophilic and non‐eosinophilic participants, unlike mepolizumab and reslizumab where a small number of residual eosinophils remained. This is attributed to a difference in its mechanism of action (anti‐IL‐5 receptor rather than anti‐IL‐5). It is unclear whether this translates into greater clinical efficacy or greater risk of adverse events (e.g. parasitic or helminth infections) or both.
Overall our study supports the use of anti‐IL‐5 treatments as an adjunct to standard of care (at least medium‐dose ICS) in people with severe eosinophilic asthma and a history of poor control (either two or more exacerbations in the preceding 12 months or an ACQ score of 1.5 or more).
Overall completeness and applicability of evidence
A reduction in asthma exacerbations is considered to be one of the key goals of asthma management (GINA 2017). Asthma exacerbations are of major clinical significance as they are the primary cause of morbidity and mortality in asthma, and drive increased healthcare utilisation and cost (Zeiger 2016). This is particularly the case for those with severe asthma, who continue to suffer from frequent exacerbations despite existing treatment options and therefore have a high unmet need (Custovic 2013).
We found evidence of a reduction in the rate of clinically significant exacerbations in adults with severe eosinophilic asthma with poor control given anti‐IL‐5 treatment, with low heterogeneity between studies. Secondary outcomes included safety data showing that anti‐IL‐5 treatments are well tolerated.
Whilst statistically significant improvements in symptoms (as assessed by validated HRQoL scores) and lung function (FEV1) were evident with anti‐IL‐5 interventions, these changes were modest and likely to be below levels that would be clinically detected by patients. There were also large reductions in blood eosinophil levels, but a relationship between these and symptoms is not established and thus this may also be of limited direct relevance to patients.
The included studies did not directly compare the different anti‐IL‐5 treatments, however, the effect sizes versus placebo were similar. Pragmatically, mepolizumab is given subcutaneously every four weeks, reslizumab is given by intravenous infusion necessitating a healthcare setting, whereas benralizumab can be given subcutaneously every eight weeks. Thus there are practical advantages to benralizumab treatment.
Given the mechanism of action of anti‐IL‐5 agents, the studies were predominantly conducted in participants with severe eosinophilic asthma and poor control. None extended beyond a year. It is therefore not possible to draw any conclusions about those with milder or better‐controlled (e.g. ACQ less than 1.5 with no exacerbations) disease, non‐eosinophilic asthma, nor about the long‐term effects of treatment. Eosinophilic and severe asthma were variably defined. Most studies considered blood eosinophil counts, although others used sputum eosinophil counts which are not readily available in most hospitals or clinics (Haldar 2009; Pavord 2012a). The thresholds used to determine eosinophilia in blood counts varied, with the mepolizumab studies considering 150 cells or more per μL at screening or 300 cells or more per μL in the previous year, benralizumab studies using a cut‐off of 300 or more cells per μL and reslizumab 400 cells or more per μL. All the included studies defined severe asthma as a requirement to be on stable treatment with at least medium‐dose ICS, but most specified high‐dose ICS, often with additional controller medication(s). In addition all studies restricted participants to those with uncontrolled asthma. This was either defined in terms of exacerbation history (usually at least two in the previous 12 months; e.g. the studies of mepolizumab), ACQ score (1.5 or more; e.g. the studies of reslizumab), or both (e.g. the studies of benralizumab). Given this heterogeneity, it is unclear exactly how best to select patients for anti‐IL‐5 treatment, although current evidence suggests that a measure of eosinophilia, treatment with at least medium‐dose ICS, and a history of poor control, defined as either two or more exacerbations in the last 12 months or an ACQ score of 1.5 or more, are necessary.
The evidence on mepolizumab IV is of limited applicability as it is currently only available subcutaneously.
In summary, anti‐IL‐5 agents represent a new treatment option for severe eosinophilic asthma with poor control, a patient population with a high, unmet need.
Quality of the evidence
Using the GRADE system, we considered the quality of the evidence for all comparisons to be high overall, with the exception of mepolizumab IV, which is not currently a licensed delivery route (so we would regard this as indirect evidence). We are aware of the limitations in some of the studies and have detailed them in the Results section, Figure 2 and Figure 3. We did not formally assess publication bias through the construction of a funnel plot due to the small number of included studies. However, our search strategy was thorough, including searching conference abstracts and ongoing studies, in order to identify unpublished studies.
Potential biases in the review process
This review and update was based on a published protocol (Powell 2013). We acknowledge the potential for publication bias in this review, as it is possible that we failed to identify unpublished trials that may have provided positive or negative outcomes, which in turn could have altered the treatment benefits. However, to the best of our knowledge, we identified a significant number of trials meeting our inclusion criteria through comprehensive and systematic database searches. We tried to address any study selection bias by having two review authors who independently evaluated all the identified studies. We also ensured that the assessment of each trial was consistently in line with the inclusion criteria.
Agreements and disagreements with other studies or reviews
This review is an update on a previous Cochrane Review of mepolizumab in asthma (Powell 2015), which noted one previous review with similar findings (Liu 2013). Since then, several reviews have been published on the topic:
-
Wang 2016, which considered all anti‐IL‐5 treatments, but also included studies with a treatment duration of less than 16 weeks and those with concomitant oral steroid reduction, and which did not include Chupp 2017;
-
Cabon 2017, which also assessed all anti‐IL‐5 treatments and included studies with a treatment duration of less than 16 weeks or concomitant oral steroid reduction. However fewer studies were included as the search was up to September 2015;
-
Yancey 2017, which only included studies of mepolizumab in asthma;
-
Li 2017, which only included studies of reslizumab in asthma;
Our findings are consistent with these reviews, despite the application of more rigorous inclusion criteria (in terms of treatment duration and allowed concomitant treatments, that is, standard of care rather than oral steroid reduction) and inclusion of an additional recent trial (Chupp 2017). All the reviews highlight the need for further research in this area.

Study flow diagram

Risk of bias graph: review authors' judgements about each risk of bias item presented as percentages across all included studies
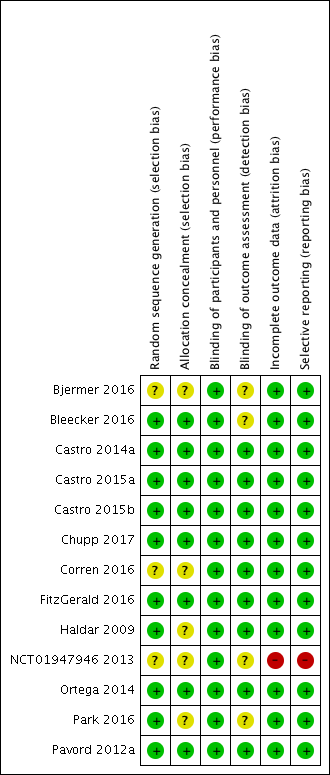
Risk of bias summary: review authors' judgements about each risk of bias item for each included study

Comparison 1 Mepolizumab (SC) versus placebo, Outcome 1 Rate of exacerbations requiring systemic corticosteroids.

Comparison 1 Mepolizumab (SC) versus placebo, Outcome 2 Rate of exacerbations requiring emergency department treatment or admission.
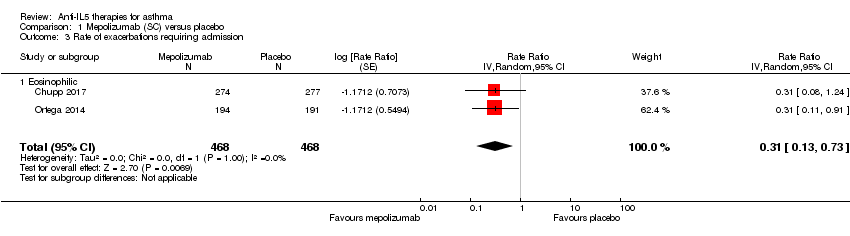
Comparison 1 Mepolizumab (SC) versus placebo, Outcome 3 Rate of exacerbations requiring admission.
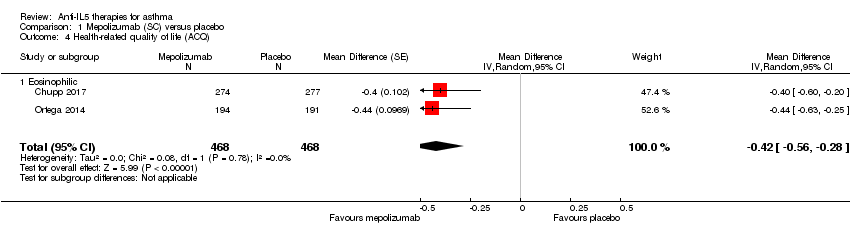
Comparison 1 Mepolizumab (SC) versus placebo, Outcome 4 Health‐related quality of life (ACQ).

Comparison 1 Mepolizumab (SC) versus placebo, Outcome 5 Health‐related quality of life (SGRQ).
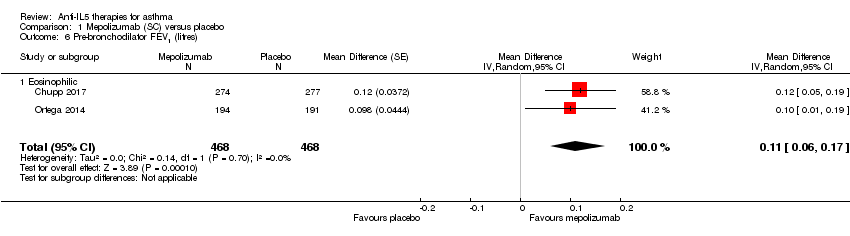
Comparison 1 Mepolizumab (SC) versus placebo, Outcome 6 Pre‐bronchodilator FEV1 (litres).
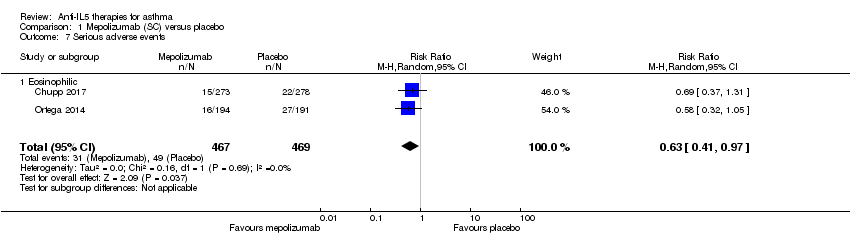
Comparison 1 Mepolizumab (SC) versus placebo, Outcome 7 Serious adverse events.
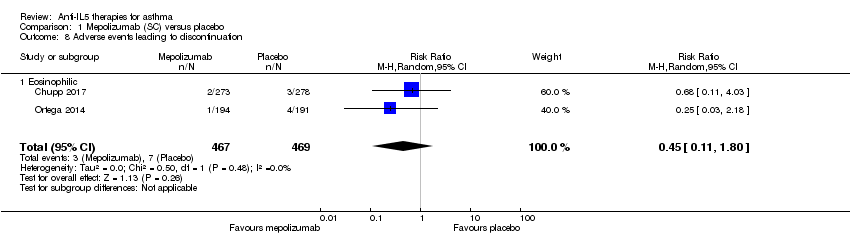
Comparison 1 Mepolizumab (SC) versus placebo, Outcome 8 Adverse events leading to discontinuation.

Comparison 2 Mepolizumab (IV) versus placebo, Outcome 1 Rate of clinically significant exacerbations.

Comparison 2 Mepolizumab (IV) versus placebo, Outcome 2 Rate of exacerbations requiring emergency department treatment or admission.

Comparison 2 Mepolizumab (IV) versus placebo, Outcome 3 Rate of exacerbations requiring admission.

Comparison 2 Mepolizumab (IV) versus placebo, Outcome 4 People with one or more exacerbations.

Comparison 2 Mepolizumab (IV) versus placebo, Outcome 5 Health‐related quality of life (AQLQ).

Comparison 2 Mepolizumab (IV) versus placebo, Outcome 6 Health‐related quality of life (ACQ).
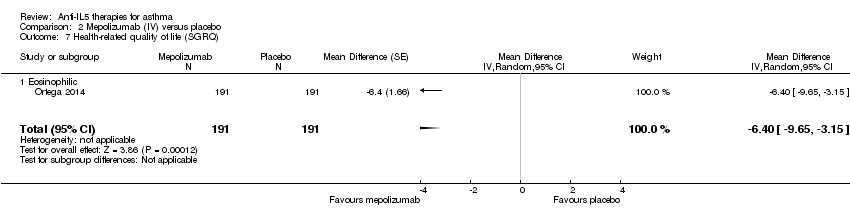
Comparison 2 Mepolizumab (IV) versus placebo, Outcome 7 Health‐related quality of life (SGRQ).

Comparison 2 Mepolizumab (IV) versus placebo, Outcome 8 Pre‐bronchodilator FEV1 (litres).

Comparison 2 Mepolizumab (IV) versus placebo, Outcome 9 Serious adverse events.

Comparison 2 Mepolizumab (IV) versus placebo, Outcome 10 Adverse events leading to discontinuation.
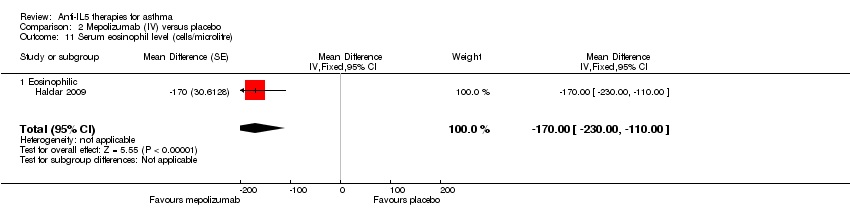
Comparison 2 Mepolizumab (IV) versus placebo, Outcome 11 Serum eosinophil level (cells/microlitre).

Comparison 3 Reslizumab (IV) versus placebo, Outcome 1 Rate of exacerbations requiring systemic corticosteroids.

Comparison 3 Reslizumab (IV) versus placebo, Outcome 2 Rate of exacerbations requiring emergency department treatment or admission.

Comparison 3 Reslizumab (IV) versus placebo, Outcome 3 Health‐related quality of life (AQLQ).
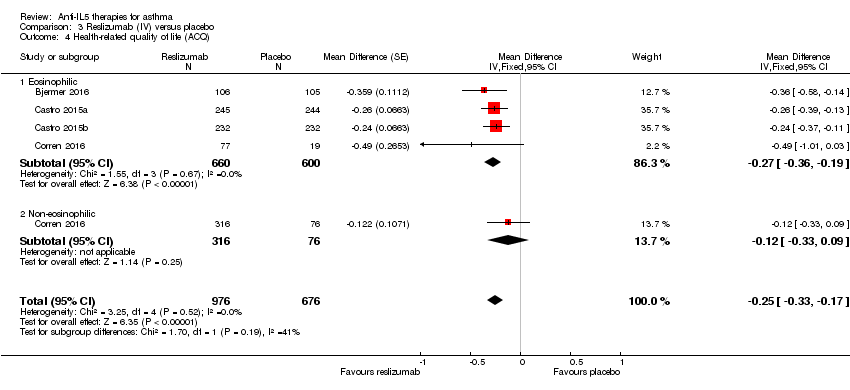
Comparison 3 Reslizumab (IV) versus placebo, Outcome 4 Health‐related quality of life (ACQ).

Comparison 3 Reslizumab (IV) versus placebo, Outcome 5 Pre‐bronchodilator FEV1 (litres).

Comparison 3 Reslizumab (IV) versus placebo, Outcome 6 Serious adverse events.
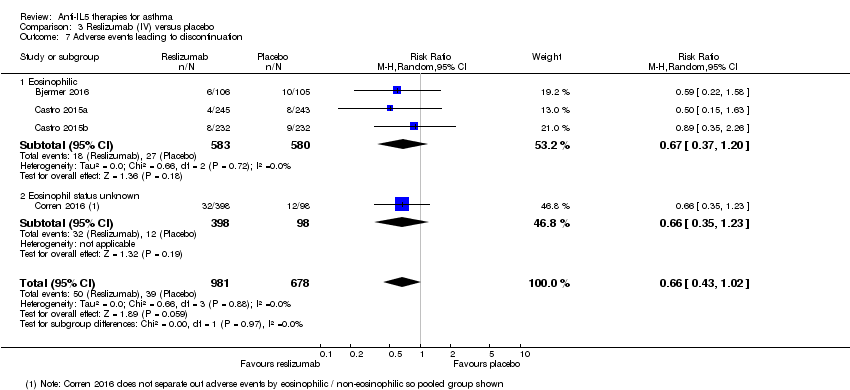
Comparison 3 Reslizumab (IV) versus placebo, Outcome 7 Adverse events leading to discontinuation.

Comparison 3 Reslizumab (IV) versus placebo, Outcome 8 Serum eosinophil level (cells/microlitre).

Comparison 4 Benralizumab (SC) versus placebo, Outcome 1 Rate of exacerbations requiring systemic corticosteroids.

Comparison 4 Benralizumab (SC) versus placebo, Outcome 2 Rate of exacerbations requiring emergency department treatment or admission.

Comparison 4 Benralizumab (SC) versus placebo, Outcome 3 Health‐related quality of life (AQLQ mean difference).

Comparison 4 Benralizumab (SC) versus placebo, Outcome 4 Health‐related quality of life (ACQ mean difference).

Comparison 4 Benralizumab (SC) versus placebo, Outcome 5 Pre‐bronchodilator FEV1 (litres).
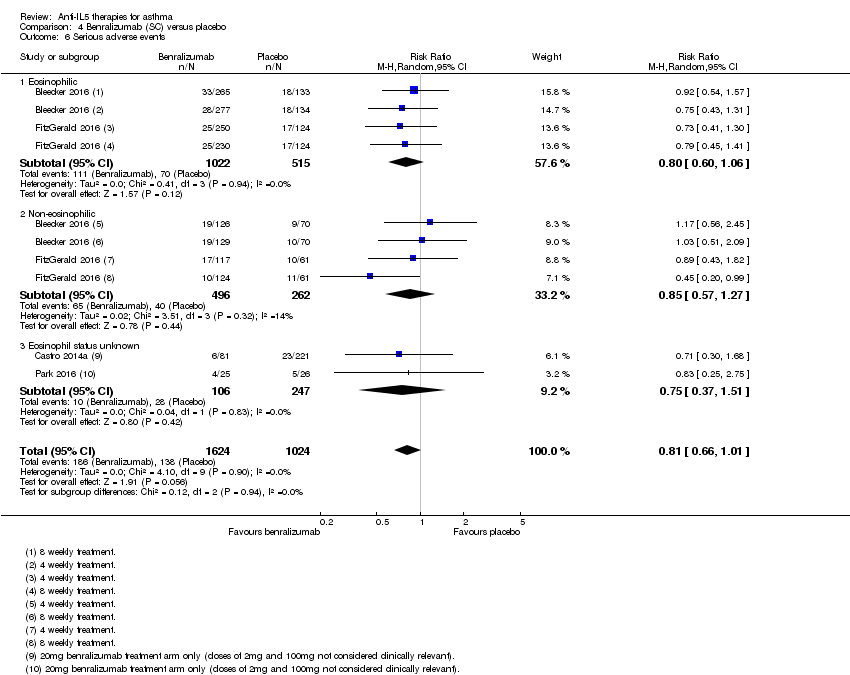
Comparison 4 Benralizumab (SC) versus placebo, Outcome 6 Serious adverse events.

Comparison 4 Benralizumab (SC) versus placebo, Outcome 7 Adverse events leading to discontinuation.

Comparison 4 Benralizumab (SC) versus placebo, Outcome 8 Serum eosinophil level (% change from baseline).
| Mepolizumab (SC) compared to placebo for asthma | ||||||
| Patient or population: people with asthma | ||||||
| Outcomes | Anticipated absolute effects* (95% CI) | Relative effect | № of participants | Quality of the evidence | Comments | |
| Risk with placebo | Risk with mepolizumab (SC) | |||||
| Rate of exacerbations requiring systemic corticosteroids | The mean rate in the placebo group was 1.48 events per participant per yeara | The mean rate in the intervention group was 0.81 fewer events per participant per year (95% CI 0.66 fewer to 0.94 fewer) | Rate ratio 0.45 (0.36 to 0.55) | 936 | ⊕⊕⊕⊕ | |
| Rate of exacerbations requiring emergency department treatment or admission | The mean rate in the placebo group was 0.15 events per patient per yearb | The mean rate in the intervention group was 0.10 fewer events per participant per year (95% CI 0.05 fewer to 0.12 fewer) | Rate ratio 0.36 (0.20 to 0.66) | 936 | ⊕⊕⊕⊕ | |
| Health‐related quality of life (ACQ) | The mean change in the placebo group ranged from −0.4 to −0.5 units | The mean in the intervention group was ‐0.42 units fewer (‐0.56 fewer to ‐0.28 fewer) | ‐ | 936 | ⊕⊕⊕⊝ | A change of ≥ 0.5 is considered the minimum clinically significant difference |
| Health‐related quality of life (SGRQ) | The mean change in the placebo group ranged from −7.9 to −9.0 units | The mean change in the intervention group was ‐7.4 units fewer (‐9.5 fewer to ‐5.29 fewer) | ‐ | 936 | ⊕⊕⊕⊕ | A change of ≥ 4 is considered the minimum clinically significant difference |
| Pre‐bronchodilator FEV1 (L) | The mean change in the placebo group ranged from 0.086 L (± 0.031 L) to 0.120 L (0.047 to 0.192 L) | The mean difference from placebo was a further 0.11 L (0.06 L to 0.17 L) | ‐ | 936 | ⊕⊕⊕⊕ | |
| Adverse events leading to discontinuation | 15 per 1000 | 7 per 1000 | Risk ratio 0.45 | 936 | ⊕⊕⊕⊝ | |
| *The risk in the intervention group (and its 95% confidence interval) is based on the assumed risk in the comparison group and the relative effect of the intervention (and its 95% CI). | ||||||
| GRADE Working Group grades of evidence | ||||||
| aRounded mean of the rate in the placebo group of the two studies: 1.21 and 1.74. | ||||||
| Mepolizumab (IV) compared to placebo for asthma | ||||||
| Patient or population: people with asthma | ||||||
| Outcomes | Anticipated absolute effects* (95% CI) | Relative effect | № of participants | Quality of the evidence | Comments | |
| Risk with placebo | Risk with mepolizumab (IV) | |||||
| Rate of clinically significant exacerbations | The mean rate in the placebo group was 2.51 events per participant per yeara | The mean rate in the intervention groups was 1.18 fewer events per participant per year (1.41 fewer to 0.90 fewer) | Rate ratio 0.53 | 751 | ⊕⊕⊕⊝ | |
| Rate of exacerbations requiring emergency department treatment or admission | The mean rate in the placebo group was 0.32 events per participant per yearb | The mean rate in the intervention groups was 0.15 fewer events per participant per year (0.22 fewer to 0.04 fewer) | Rate ratio 0.52 | 690 | ⊕⊕⊕⊝ | |
| Health‐related quality of life (AQLQ) | The mean change in the placebo group ranged from 0.18 to 0.71 units | MD 0.21 higher | ‐ | 677 | ⊕⊕⊕⊝ | A change of ≥ 0.5 is considered the minimum clinically significant difference |
| Health‐related quality of life (ACQ) | The mean change in the placebo group ranged from −0.59 to −0.50 units | MD ‐0.11 lower | ‐ | 369 | ⊕⊕⊕⊝ | A change of ≥ 0.5 is considered the minimum clinically significant difference |
| Pre‐bronchodilator FEV1 (L) | The mean change in the placebo group ranged from 0.060 L (± 0.038 L) to 0.086 L (± 0.031 L) | MD 0.08 L (0.02 L higher to 0.15 L higher) | ‐ | 690 | ⊕⊕⊕⊝ | |
| Adverse events leading to discontinuation | 26 per 1000 | 19 per 1000 | RR 0.72 | 751 | ⊕⊕⊕⊝ | |
| *The risk in the intervention group (and its 95% confidence interval) is based on the assumed risk in the comparison group and the relative effect of the intervention (and its 95% CI). | ||||||
| GRADE Working Group grades of evidence | ||||||
| aRounded mean of the rate in the placebo group of the three studies: 1.74, 2.40 and 3.4. | ||||||
| Reslizumab (IV) compared to placebo for asthma | ||||||
| Patient or population: people with asthma | ||||||
| Outcomes | Anticipated absolute effects* (95% CI) | Relative effect | № of participants | Quality of the evidence | Comments | |
| Risk with placebo | Risk with reslizumab (IV) | |||||
| Rate of exacerbations requiring systemic corticosteroids | The mean rate in the placebo group was 1.54 events per participant per year | The mean rate in the intervention groups was 0.93 fewer events per participant per year (1.09 fewer to 0.73 fewer) | Rate ratio 0.43 | 953 | ⊕⊕⊕⊕ | |
| Rate of exacerbations requiring emergency department treatment or admission | The mean rate in the placebo group was 0.12 events per participant per year | The mean rate in the intervention groups was 0.04 fewer events per participant per year (0.07 fewer to 0.02 more) | Rate ratio 0.67 | 953 | ⊕⊕⊕⊕ | |
| Health‐related quality of life (AQLQ) | The mean change in the placebo group ranged from 0.779 to 0.89 units | MD 0.28 higher | ‐ | 1164 | ⊕⊕⊕⊕ | A change of ≥ 0.5 is considered the minimum clinically significant difference |
| Health‐related quality of life (ACQ) | The mean change in the placebo group ranged from −0.368 to −0.80 units | MD ‐0.25 lower | ‐ | 1652 | ⊕⊕⊕⊕ | A change of ≥ 0.5 is considered the minimum clinically significant difference |
| Pre‐bronchodilator FEV1 (L) | The mean change in the placebo group ranged from 0.002 L (± 0.1216 L) to 0.215 (± 0.0484 L) | MD 0.11 L higher | ‐ | 1652 | ⊕⊕⊕⊕ | |
| Serious adverse events | 91 per 1000 | 72 per 1000 | RR 0.79 | 1656 | ⊕⊕⊕⊕ | |
| Adverse events leading to discontinuation | 58 per 1000 | 38 per 1000 | RR 0.66 | 1659 | ⊕⊕⊕⊕ | |
| *The risk in the intervention group (and its 95% confidence interval) is based on the assumed risk in the comparison group and the relative effect of the intervention (and its 95% CI). | ||||||
| GRADE Working Group grades of evidence | ||||||
| a The mean difference (0.28) is smaller than the minimum clinically significant difference (a reduction of 0.5 points). | ||||||
| Benralizumab (SC) compared to placebo for asthma | ||||||
| Patient or population: people with asthma | ||||||
| Outcomes | Anticipated absolute effects* (95% CI) | Relative effect | № of participants | Quality of the evidence | Comments | |
| Risk with placebo | Risk with benralizumab (SC) | |||||
| Rate of exacerbations requiring systemic corticosteroids | The mean rate in the placebo group was 0.98 events per participant per yeara | The mean rate in the intervention groups was 0.37 fewer events per participant per year (0.44 fewer to 0.29 fewer) | Rate ratio 0.62 | 2456 | ⊕⊕⊕⊕ | |
| Rate of exacerbations requiring emergency department treatment or admission | The mean rate in the placebo group was 0.11 events per participant per yearb | The mean rate in the intervention groups was 0.04 fewer events per participant per year (0.06 fewer to 0.002 fewer) | Rate ratio 0.68 | 1537 | ⊕⊕⊕⊝ | There is greater heterogeneity (I² = 43%) owing to inclusion of less severe participants in FitzGerald 2016 (a larger proportion who had only suffered one exacerbation the previous year, with correspondingly less potential for exacerbation) |
| Health‐related quality of life (AQLQ) | The mean change in the placebo group ranged from 0.98 to 1.31 units | MD 0.23 higher | ‐ | 1541 | ⊕⊕⊕⊕ | A change of ≥ 0.5 is considered the minimum clinically significant difference |
| Health‐related quality of life (ACQ) | The mean change in the placebo group ranged from −1.19 to −0.76 units | MD ‐0.20 lower | ‐ | 2359 | ⊕⊕⊕⊕ | A change of ≥ 0.5 is considered the minimum clinically significant difference |
| Pre‐bronchodilator FEV1 (L) | The mean change in the placebo group ranged from ‐0.01 L to 0.239 L | MD 0.10 L higher | ‐ | 2355 | ⊕⊕⊕⊕ | |
| Serious adverse events | 135 per 1000 | 109 per 1000 | RR 0.81 | 2648 | ⊕⊕⊕⊕ | |
| Adverse events leading to discontinuation | 9 per 1000 | 19 per 1000 | RR 2.15 | 2597 | ⊕⊕⊕⊕ | |
| *The risk in the intervention group (and its 95% confidence interval) is based on the assumed risk in the comparison group and the relative effect of the intervention (and its 95% CI). | ||||||
| GRADE Working Group grades of evidence | ||||||
| a Rounded mean of the rate in the placebo group of the eosinophilic and non‐eosinophilic arms (as applicable) or the three studies: 1.33, 1.21, 0.68, 0.49, 0.93, 1.21. | ||||||
| Study | Design, follow‐up (weeks) | Baseline asthma severity | Baseline treatment | Intervention (route) | Primary and secondary outcomes |
| Chupp 2017 (551) | RCT, double‐blind, placebo‐controlled (24) | Blood eosinophils ≥ 150 cells/μL at screening or ≥ 300 cells/μL in previous 12 months; and ≥ 2 exacerbations in previous 12 months; and FEV1 < 80% | High‐dose ICS for ≥ 12 months; + additional controller for ≥ 3 months; ± maintenance OCS | Mepolizumab 100 mg (SC) or placebo every 4 weeks for 24 weeks (last dose at 20 weeks) | ‐ SGRQ ‐ Mean change from baseline pre‐bronchodilator FEV1 ‐ Proportion of SGRQ total score responders at week 24 ‐ Mean change from baseline in ACQ‐5 |
| Haldar 2009 (61) | RCT, double‐blind, placebo‐controlled, parallel‐group (50) | ≥ 3% sputum eosinophils; and ≥ 2 exacerbations in previous 12 months | High‐dose ICS | Mepolizumab 75 (IV) or matched placebo (150 mL of 0.9% saline) at monthly intervals for 1 y | ‐ Severe exacerbations per person ‐ Change in AQLQ ‐ post‐bronchodilator FEV1 ‐ Airway hyperresponsiveness ‐ Blood/sputum eosinophil counts |
| Ortega 2014 (576) | RCT, double‐blind, double‐dummy, phase 3 (32) | Blood eosinophils ≥ 150 cells/μL at screening or ≥ 300 cells/μL in previous 12 months; and ≥ 2 exacerbations in previous 12 months; and FEV1 < 80% | High‐dose ICS for ≥ 12 months; + additional controller for ≥ 3 months; ± maintenance OCS | Mepolizumab 75 mg (IV) or 100 mg (SC) or placebo every 4 weeks for 32 weeks | ‐ Exacerbations per y ‐ Mean change from baseline pre‐bronchodilator FEV1 ‐ Mean change from baseline SGRQ total score |
| Pavord 2012a (621) | Multicentre, double‐blind, placebo‐controlled (52) | ≥ 3% sputum eosinophils or blood eosinophil ≥ 300 cells/μL; and ≥ 2 exacerbations in previous 12 months | High‐dose ICS (i.e. ≥ 880 μg/d FP or equivalent daily); + additional controller; ± maintenance OCS | Mepolizumab 75 mg, 250 mg or 750 mg (IV) or placebo every 4 weeks for 13 doses | ‐ Time to first clinically significant exacerbation ‐ Frequency of exacerbations requiring hospitalisation ‐ Time to first exacerbation requiring hospitalisation or ED visit ‐ Mean change from baseline pre‐bronchodilator FEV1 ‐ Mean change from baseline post‐bronchodilator FEV1 ‐ Mean change from baseline ACQ |
| Bjermer 2016 (315) | RCT, double‐blind, placebo‐controlled, parallel‐group, fixed‐dosage, multicentre phase 3 (16) | Blood eosinophils ≥ 400 cells/μL during 2‐4 weeks screening period; and ACQ‐7 score ≥ 1.5 | Medium‐dose ICS; maintenance OCS not allowed | Reslizumab 0.3 mg/kg or 3 mg/kg (IV) or placebo every 4 weeks for 4 doses | ‐ Pre‐bronchodilator FEV1, FVC, FEF25‐75 ‐ ACQ, ACQ‐6, ACQ‐5 ‐ ASUI ‐ AQLQ ‐ Rescue inhaler use ‐ Blood eosinophil levels |
| Castro 2015a (489) and Castro 2015b (464) | 2 x duplicate RCT double‐blind, placebo‐controlled, parallel‐group, multicentre, phase 3 (52) | Blood eosinophils ≥ 400 cells/μL during 2‐4 week screening period; and ACQ‐7 score ≥ 1.5 | Medium‐dose ICS (i.e. ≥ 440 μg/day FP or equivalent daily); ± additional controller or maintenance OCS | Reslizumab 3 mg/kg (IV) or matching placebo every 4 weeks for 13 doses (last dose week 48) | ‐ Annual frequency of exacerbations ‐ Change in FEV1 from baseline over 16 weeks ‐ ACQ‐7 score ‐ ASUI score ‐ Rescue use of SABA ‐ Blood eosinophil count ‐ AQLQ total score at weeks 16, 32 and 52 |
| Corren 2016 (496) | RCT double‐blind, placebo‐controlled, multicentre phase 3 (16) | ACQ‐7 score ≥ 1.5 (no selection based on blood eosinophils) | Medium‐dose ICS; maintenance OCS not allowed | Reslizumab 3 mg/kg (IV) or matching placebo every 4 weeks for 4 doses | ‐ Change in FEV1 from baseline ‐ ACQ‐7 score ‐ Rescue (SABA) use within previous 3 days ‐ FVC ‐ Blood eosinophils |
| Bleecker 2016 (1204) | RCT double‐blind, parallel‐group, placebo‐controlled multicentre (52) | ≥ 2 exacerbations in the previous 12 months; and ACQ‐6 score ≥ 1.5 at enrolment; and FEV1 < 80% (if 12‐17 years old, < 90%) | Adults (> 18 y) high‐dose (≥ 500 μg/d FP or equivalent) ICS/LABA for ≥ 12 months Children (12‐17 y) at least medium‐dose (≥ 250 μg/day FP or equivalent) ICS/LABA | Benralizumab 30 mg (SC) or placebo either every 4 weeks or every 4 weeks for the first 3 doses then every 8 weeks or placebo for 48 weeks | ‐ Annual exacerbation rate ‐ Pre‐bronchodilator FEV1 ‐ Total asthma symptom score ‐ Time to first exacerbation ‐ Annual rate of exacerbations requiring ED visit or hospital admission ‐ Post‐bronchodilator FEV1 ‐ ACQ‐6 ‐ AQLQ(S)+12 score |
| Castro 2014a (606) | RCT double‐blind, placebo‐controlled, multicentre dose‐ranging (52) | 2‐6 exacerbations in the previous 12 months; and ACQ‐6 score ≥ 1.5 at least twice during screening; and morning pre‐bronchodilator FEV1 40%‐90% | Medium‐ to high‐dose ICS in combination with LABA for ≥ 12 months | Benralizumab 2 mg, 20 mg or 100 mg (SC) or placebo every 4 weeks for the first 3 doses, then every 8 weeks (total 7 doses) | ‐ Annual exacerbation rate ‐ Change from baseline in FEV1 ‐ Mean ACQ‐6 score ‐ Overall symptom score ‐ Mean AQLQ score |
| FitzGerald 2016 (1306) | RCT, double‐blind, parallel‐group, placebo‐controlled multicentre (56) | ≥ 2 exacerbations in the previous 12 months; and ACQ‐6 score ≥ 1.5 at enrolment; and FEV1 < 80% | Medium‐ (≥ 250 μg/d FP or equivalent) to high‐dose (≥ 500 μg/d FP or equivalent) ICS/LABA for ≥ 12 months; high‐dose ICS/LABA for ≥ 3 months | Benralizumab 30 mg (SC) or placebo either every 4 weeks or every 4 weeks for the first 3 doses then every 8 weeks or placebo | ‐ Annual exacerbation rate for participants with blood eosinophils ≥ 300 cells/μL ‐ Pre‐bronchodilator FEV1 ‐ Total asthma symptom score ‐ Time to first exacerbation ‐ Annual rate of exacerbations requiring ED visit or hospital admission ‐ Post‐bronchodilator FEV1 ‐ ACQ‐6 ‐ AQLQ(S)+12 score |
| (13) | RCT double‐blind, parallel‐group, placebo‐controlled multicentre (48) | Uncontrolled asthma taking medium‐dose ICS plus LABA | Medium‐dose ICS (>250ug and ≤500ug fluticasone dry powder formulation equivalents total daily dose) and LABA for at least 3 month prior to first visit | Benralizumab 30 mg (SC) or placebo either every 4 weeks or every 4 weeks for the first 3 doses then every 8 weeks or placebo | Asthma exacerbations over 48‐week treatment period |
| Park 2016 (103) | RCT double‐blind, placebo‐controlled, dose‐ranging multicentre (52) | 2‐6 exacerbations in the previous 12 months; and ACQ‐6 score ≥ 1.5 at least twice during screening; and morning pre‐bronchodilator FEV1 40%‐90% | Medium‐ to high‐dose ICS in combination with LABA for ≥ 12 months | Benralizumab 2 mg, 20 mg or 100 mg (SC) or placebo every 4 weeks for the first 3 doses, then every 8 weeks (total 7 doses) | ‐ Annual exacerbation rate ‐ Lung function ‐ ACQ‐6 ‐ FeNO ‐ Blood eosinophil counts |
| ACQ: Asthma Control Questionnaire; AQLQ: Asthma Quality of Life Questionnaire; ASUI: Asthma Symptom Utility Index; BDP: beclomethasone dipropionate; b: day; ECP: eosinophil cationic protein; ED: emergency department; FEF25‐75 : forced expiratory flow at 25% to 75% of FVC; FeNO: exhaled fraction of nitric oxide; FEV1 : Forced expiratory volume in 1 second; FVC: forced vital capacity; FP; fluticasone propionate; ICS; inhaled corticosteroid; IV: intravenous; LABA: long‐acting beta2 agonistOCS; oral corticosteroid; PC20 : histamine provocative concentration causing a 20% drop in FEV1; PEFR: peak expiratory flow rate; RCT: randomised controlled trial; SABA: short‐acting beta2‐agonists; SC: subcutaneous; SGRQ: St George's Respiratory Questionnaire; y: year | |||||
| Outcome or subgroup title | No. of studies | No. of participants | Statistical method | Effect size |
| 1 Rate of exacerbations requiring systemic corticosteroids Show forest plot | 2 | 936 | Rate Ratio (Random, 95% CI) | 0.45 [0.36, 0.55] |
| 1.1 Eosinophilic | 2 | 936 | Rate Ratio (Random, 95% CI) | 0.45 [0.36, 0.55] |
| 2 Rate of exacerbations requiring emergency department treatment or admission Show forest plot | 2 | 936 | Rate Ratio (Random, 95% CI) | 0.36 [0.20, 0.66] |
| 2.1 Eosinophilic | 2 | 936 | Rate Ratio (Random, 95% CI) | 0.36 [0.20, 0.66] |
| 3 Rate of exacerbations requiring admission Show forest plot | 2 | 936 | Rate Ratio (Random, 95% CI) | 0.31 [0.13, 0.73] |
| 3.1 Eosinophilic | 2 | 936 | Rate Ratio (Random, 95% CI) | 0.31 [0.13, 0.73] |
| 4 Health‐related quality of life (ACQ) Show forest plot | 2 | 936 | Mean Difference (Random, 95% CI) | ‐0.42 [‐0.56, ‐0.28] |
| 4.1 Eosinophilic | 2 | 936 | Mean Difference (Random, 95% CI) | ‐0.42 [‐0.56, ‐0.28] |
| 5 Health‐related quality of life (SGRQ) Show forest plot | 2 | 936 | Mean Difference (Random, 95% CI) | ‐7.40 [‐9.50, ‐5.29] |
| 5.1 Eosinophilic | 2 | 936 | Mean Difference (Random, 95% CI) | ‐7.40 [‐9.50, ‐5.29] |
| 6 Pre‐bronchodilator FEV1 (litres) Show forest plot | 2 | 936 | Mean Difference (Random, 95% CI) | 0.11 [0.06, 0.17] |
| 6.1 Eosinophilic | 2 | 936 | Mean Difference (Random, 95% CI) | 0.11 [0.06, 0.17] |
| 7 Serious adverse events Show forest plot | 2 | 936 | Risk Ratio (M‐H, Random, 95% CI) | 0.63 [0.41, 0.97] |
| 7.1 Eosinophilic | 2 | 936 | Risk Ratio (M‐H, Random, 95% CI) | 0.63 [0.41, 0.97] |
| 8 Adverse events leading to discontinuation Show forest plot | 2 | 936 | Risk Ratio (M‐H, Random, 95% CI) | 0.45 [0.11, 1.80] |
| 8.1 Eosinophilic | 2 | 936 | Risk Ratio (M‐H, Random, 95% CI) | 0.45 [0.11, 1.80] |
| Outcome or subgroup title | No. of studies | No. of participants | Statistical method | Effect size |
| 1 Rate of clinically significant exacerbations Show forest plot | 3 | 751 | Rate Ratio (Random, 95% CI) | 0.53 [0.44, 0.64] |
| 1.1 Eosinophilic | 3 | 751 | Rate Ratio (Random, 95% CI) | 0.53 [0.44, 0.64] |
| 2 Rate of exacerbations requiring emergency department treatment or admission Show forest plot | 2 | 690 | Rate Ratio (Random, 95% CI) | 0.52 [0.31, 0.87] |
| 2.1 Eosinophilic | 2 | 690 | Rate Ratio (Random, 95% CI) | 0.52 [0.31, 0.87] |
| 3 Rate of exacerbations requiring admission Show forest plot | 2 | 690 | Rate Ratio (Random, 95% CI) | 0.61 [0.33, 1.13] |
| 3.1 Eosinophilic | 2 | 690 | Rate Ratio (Random, 95% CI) | 0.61 [0.33, 1.13] |
| 4 People with one or more exacerbations Show forest plot | 1 | 61 | Risk Ratio (M‐H, Random, 95% CI) | 0.82 [0.61, 1.09] |
| 4.1 Eosinophilic | 1 | 61 | Risk Ratio (M‐H, Random, 95% CI) | 0.82 [0.61, 1.09] |
| 5 Health‐related quality of life (AQLQ) Show forest plot | 2 | 369 | Mean Difference (Random, 95% CI) | 0.21 [‐0.06, 0.47] |
| 5.1 Eosinophilic | 2 | 369 | Mean Difference (Random, 95% CI) | 0.21 [‐0.06, 0.47] |
| 6 Health‐related quality of life (ACQ) Show forest plot | 2 | 369 | Mean Difference (Fixed, 95% CI) | ‐0.11 [‐0.32, 0.09] |
| 6.1 Eosinophilic | 2 | 369 | Mean Difference (Fixed, 95% CI) | ‐0.11 [‐0.32, 0.09] |
| 7 Health‐related quality of life (SGRQ) Show forest plot | 1 | 382 | Mean Difference (Random, 95% CI) | ‐6.4 [‐9.65, ‐3.15] |
| 7.1 Eosinophilic | 1 | 382 | Mean Difference (Random, 95% CI) | ‐6.4 [‐9.65, ‐3.15] |
| 8 Pre‐bronchodilator FEV1 (litres) Show forest plot | 2 | 690 | Mean Difference (Random, 95% CI) | 0.08 [0.02, 0.15] |
| 8.1 Eosinophilic | 2 | 690 | Mean Difference (Random, 95% CI) | 0.08 [0.02, 0.15] |
| 9 Serious adverse events Show forest plot | 3 | 751 | Risk Ratio (M‐H, Random, 95% CI) | 0.59 [0.37, 0.94] |
| 9.1 Eosinophilic | 3 | 751 | Risk Ratio (M‐H, Random, 95% CI) | 0.59 [0.37, 0.94] |
| 10 Adverse events leading to discontinuation Show forest plot | 3 | 751 | Risk Ratio (M‐H, Random, 95% CI) | 0.72 [0.18, 2.92] |
| 10.1 Eosinophilic | 3 | 751 | Risk Ratio (M‐H, Random, 95% CI) | 0.72 [0.18, 2.92] |
| 11 Serum eosinophil level (cells/microlitre) Show forest plot | 1 | Mean Difference (Fixed, 95% CI) | ‐170.0 [‐228.00, ‐110.00] | |
| 11.1 Eosinophilic | 1 | Mean Difference (Fixed, 95% CI) | ‐170.0 [‐228.00, ‐110.00] | |
| Outcome or subgroup title | No. of studies | No. of participants | Statistical method | Effect size |
| 1 Rate of exacerbations requiring systemic corticosteroids Show forest plot | 2 | 953 | Rate Ratio (Fixed, 95% CI) | 0.43 [0.33, 0.55] |
| 1.1 Eosinophilic | 2 | 953 | Rate Ratio (Fixed, 95% CI) | 0.43 [0.33, 0.55] |
| 2 Rate of exacerbations requiring emergency department treatment or admission Show forest plot | 2 | 953 | Rate Ratio (Fixed, 95% CI) | 0.67 [0.39, 1.17] |
| 2.1 Eosinophilic | 2 | 953 | Rate Ratio (Fixed, 95% CI) | 0.67 [0.39, 1.17] |
| 3 Health‐related quality of life (AQLQ) Show forest plot | 3 | 1164 | Mean Difference (Fixed, 95% CI) | 0.28 [0.17, 0.39] |
| 3.1 Eosinophilic | 3 | 1164 | Mean Difference (Fixed, 95% CI) | 0.28 [0.17, 0.39] |
| 4 Health‐related quality of life (ACQ) Show forest plot | 4 | 1652 | Mean Difference (Fixed, 95% CI) | ‐0.25 [‐0.33, ‐0.17] |
| 4.1 Eosinophilic | 4 | 1260 | Mean Difference (Fixed, 95% CI) | ‐0.27 [‐0.36, ‐0.19] |
| 4.2 Non‐eosinophilic | 1 | 392 | Mean Difference (Fixed, 95% CI) | ‐0.12 [‐0.33, 0.09] |
| 5 Pre‐bronchodilator FEV1 (litres) Show forest plot | 4 | 1652 | Mean Difference (Fixed, 95% CI) | 0.11 [0.07, 0.15] |
| 5.1 Eosinophilic | 4 | 1260 | Mean Difference (Fixed, 95% CI) | 0.12 [0.08, 0.16] |
| 5.2 Non‐eosinophilic | 1 | 392 | Mean Difference (Fixed, 95% CI) | 0.03 [‐0.07, 0.14] |
| 6 Serious adverse events Show forest plot | 4 | 1656 | Risk Ratio (M‐H, Random, 95% CI) | 0.79 [0.56, 1.12] |
| 6.1 Eosinophilic | 3 | 1160 | Risk Ratio (M‐H, Random, 95% CI) | 0.79 [0.51, 1.22] |
| 6.2 Eosinophil status unknown | 1 | 496 | Risk Ratio (M‐H, Random, 95% CI) | 0.98 [0.34, 2.88] |
| 7 Adverse events leading to discontinuation Show forest plot | 4 | 1659 | Risk Ratio (M‐H, Random, 95% CI) | 0.66 [0.43, 1.02] |
| 7.1 Eosinophilic | 3 | 1163 | Risk Ratio (M‐H, Random, 95% CI) | 0.67 [0.37, 1.20] |
| 7.2 Eosinophil status unknown | 1 | 496 | Risk Ratio (M‐H, Random, 95% CI) | 0.66 [0.35, 1.23] |
| 8 Serum eosinophil level (cells/microlitre) Show forest plot | 4 | 1656 | Mean Difference (Fixed, 95% CI) | ‐476.83 [‐499.32, ‐454.34] |
| 8.1 Eosinophilic | 4 | 1656 | Mean Difference (Fixed, 95% CI) | ‐476.83 [‐499.32, ‐454.34] |
| Outcome or subgroup title | No. of studies | No. of participants | Statistical method | Effect size |
| 1 Rate of exacerbations requiring systemic corticosteroids Show forest plot | 3 | 2456 | Rate Ratio (Fixed, 95% CI) | 0.62 [0.55, 0.70] |
| 1.1 Eosinophilic | 3 | 1698 | Rate Ratio (Fixed, 95% CI) | 0.59 [0.51, 0.68] |
| 1.2 Non‐eosinophilic | 2 | 758 | Rate Ratio (Fixed, 95% CI) | 0.69 [0.56, 0.85] |
| 2 Rate of exacerbations requiring emergency department treatment or admission Show forest plot | 2 | 1537 | Rate Ratio (Fixed, 95% CI) | 0.68 [0.47, 0.98] |
| 2.1 Eosinophilic | 2 | 1537 | Rate Ratio (Fixed, 95% CI) | 0.68 [0.47, 0.98] |
| 3 Health‐related quality of life (AQLQ mean difference) Show forest plot | 3 | 1541 | Mean Difference (Fixed, 95% CI) | 0.23 [0.11, 0.35] |
| 3.1 Eosinophilic | 3 | 1541 | Mean Difference (Fixed, 95% CI) | 0.23 [0.11, 0.35] |
| 4 Health‐related quality of life (ACQ mean difference) Show forest plot | 3 | 2359 | Mean Difference (Fixed, 95% CI) | ‐0.20 [‐0.29, ‐0.11] |
| 4.1 Eosinophilic | 3 | 1604 | Mean Difference (Fixed, 95% CI) | ‐0.23 [‐0.34, ‐0.12] |
| 4.2 Non‐eosinophilic | 2 | 755 | Mean Difference (Fixed, 95% CI) | ‐0.14 [‐0.30, 0.02] |
| 5 Pre‐bronchodilator FEV1 (litres) Show forest plot | 3 | 2355 | Mean Difference (Fixed, 95% CI) | 0.10 [0.05, 0.14] |
| 5.1 Eosinophilic | 3 | 1617 | Mean Difference (Fixed, 95% CI) | 0.13 [0.08, 0.19] |
| 5.2 Non‐eosinophilic | 2 | 738 | Mean Difference (Fixed, 95% CI) | 0.03 [‐0.03, 0.10] |
| 6 Serious adverse events Show forest plot | 4 | 2648 | Risk Ratio (M‐H, Random, 95% CI) | 0.81 [0.66, 1.01] |
| 6.1 Eosinophilic | 2 | 1537 | Risk Ratio (M‐H, Random, 95% CI) | 0.80 [0.60, 1.06] |
| 6.2 Non‐eosinophilic | 2 | 758 | Risk Ratio (M‐H, Random, 95% CI) | 0.85 [0.57, 1.27] |
| 6.3 Eosinophil status unknown | 2 | 353 | Risk Ratio (M‐H, Random, 95% CI) | 0.75 [0.37, 1.51] |
| 7 Adverse events leading to discontinuation Show forest plot | 3 | 2597 | Risk Ratio (M‐H, Random, 95% CI) | 2.15 [1.02, 4.57] |
| 7.1 Eosinophilic | 2 | 1537 | Risk Ratio (M‐H, Random, 95% CI) | 2.70 [0.86, 8.49] |
| 7.2 Non‐eosinophilic | 2 | 758 | Risk Ratio (M‐H, Random, 95% CI) | 1.81 [0.54, 6.05] |
| 7.3 Eosinophil status unknown | 1 | 302 | Risk Ratio (M‐H, Random, 95% CI) | 1.82 [0.31, 10.69] |
| 8 Serum eosinophil level (% change from baseline) Show forest plot | 2 | 2295 | Mean Difference (Fixed, 95% CI) | ‐104.74 [‐116.12, ‐93.35] |
| 8.1 Eosinophilic | 2 | 1537 | Mean Difference (Fixed, 95% CI) | ‐101.74 [‐113.27, ‐90.21] |
| 8.2 Non‐eosinophilic | 2 | 758 | Mean Difference (Fixed, 95% CI) | ‐216.81 [‐287.35, ‐146.28] |