تاثیر بورتزومیب (bortezomib) در درمان مالتیپل میلوما
Referencias
منابع مطالعات واردشده در این مرور
منابع مطالعات خارجشده از این مرور
منابع مطالعات در انتظار ارزیابی
منابع مطالعات در حال انجام
منابع اضافی
Characteristics of studies
Characteristics of included studies [ordered by study ID]
| Methods |
| |
| Participants |
| |
| Interventions |
| |
| Outcomes |
| |
| Notes |
| |
| Risk of bias | ||
| Bias | Authors' judgement | Support for judgement |
| Random sequence generation (selection bias) | Unclear risk | Study design described as 'randomised' in title however randomisation methods not reported. |
| Allocation concealment (selection bias) | Unclear risk | Not reported. |
| Blinding of participants and personnel (performance bias) | High risk | Open‐label study. |
| Blinding of outcome assessment (detection bias) for OS | Low risk | Low risk of bias for OS. |
| Blinding of outcome assessment (detection bias) | Unclear risk | Objective outcomes measured (e.g. response rate and progression according to IMWG guidelines, number of patients alive). Independent blinded outcomes assessment not reported. |
| Incomplete outcome data (attrition bias) | Low risk | Patient status reported at median follow‐up of 7.5 months. |
| Selective reporting (reporting bias) | High risk | Key eligibility criteria not reported. Baseline characteristics per arm not reported. Selected adverse events reported only. |
| Other bias | Unclear risk | Not reported. |
| Methods |
| |
| Participants |
| |
| Interventions |
| |
| Outcomes |
| |
| Notes |
| |
| Risk of bias | ||
| Bias | Authors' judgement | Support for judgement |
| Random sequence generation (selection bias) | Low risk | Study design described as 'randomised'. |
| Allocation concealment (selection bias) | Unclear risk | Not specified. Central randomisation probably performed. |
| Blinding of participants and personnel (performance bias) | High risk | Open‐label study. |
| Blinding of outcome assessment (detection bias) for OS | Low risk | Low risk of bias for OS. |
| Blinding of outcome assessment (detection bias) | Low risk | Objective endpoints measured (e.g. response rate and progression by the European Group for Blood and Bone Marrow Transplant (EBMT) criteria, overall survival). Response data based on central laboratory analysis. |
| Incomplete outcome data (attrition bias) | Low risk | Data for the final analyses of the time to disease progression and the response were censored. Full details of censoring reported. |
| Selective reporting (reporting bias) | Low risk | Benefits and harms reported. |
| Other bias | Unclear risk | Not reported. |
| Methods |
| |
| Participants |
| |
| Interventions |
| |
| Outcomes |
| |
| Notes |
| |
| Risk of bias | ||
| Bias | Authors' judgement | Support for judgement |
| Random sequence generation (selection bias) | Low risk | Study design described as 'randomised'. |
| Allocation concealment (selection bias) | Low risk | Randomisation envelopes at each centre selected based on stage of disease and front‐line chemo‐therapeutic regimen. Type of envelope used e.g. opaque and who had access to the envelopes not adequately reported. |
| Blinding of participants and personnel (performance bias) | High risk | Open‐label study. |
| Blinding of outcome assessment (detection bias) for OS | Low risk | Low risk of bias for OS. |
| Blinding of outcome assessment (detection bias) | Low risk | Objective endpoints measured (e.g. response rate and progression by the European Group for Blood and Bone Marrow Transplant (EBMT) criteria, overall survival). Response data assessed by independent review committee of 3 myeloma experts independent of trial. |
| Incomplete outcome data (attrition bias) | Low risk | Patient status at > 5‐year median follow‐up reported. |
| Selective reporting (reporting bias) | Low risk | Benefits and harms reported. |
| Other bias | Unclear risk | Not reported. |
| Methods |
| |
| Participants |
| |
| Interventions |
| |
| Outcomes |
| |
| Notes |
| |
| Risk of bias | ||
| Bias | Authors' judgement | Support for judgement |
| Random sequence generation (selection bias) | Low risk | Study design described as 'randomised'. |
| Allocation concealment (selection bias) | Low risk | Patients were 'centrally randomised'. |
| Blinding of participants and personnel (performance bias) | High risk | Open‐label study. |
| Blinding of outcome assessment (detection bias) for OS | Low risk | Low risk of bias for OS. |
| Blinding of outcome assessment (detection bias) | Low risk | Objective endpoints measured (e.g. response rate according to the European Group for Blood and Bone Marrow Transplant (EBMT) criteria, overall survival). Response data and toxicity monitored by an external contract research organisation and centrally reviewed by the principal investigators. |
| Incomplete outcome data (attrition bias) | Low risk | Acceptable rates of withdrawal during induction therapy reported. |
| Selective reporting (reporting bias) | Unclear risk | Benefits and harms reported, however selected adverse events reported only. |
| Other bias | Unclear risk | Not reported. |
| Methods |
| |
| Participants |
| |
| Interventions |
| |
| Outcomes |
| |
| Notes |
| |
| Risk of bias | ||
| Bias | Authors' judgement | Support for judgement |
| Random sequence generation (selection bias) | Low risk | Study design described as 'randomised'. |
| Allocation concealment (selection bias) | Unclear risk | Not known. Central randomisation probably performed. |
| Blinding of participants and personnel (performance bias) | High risk | Open‐label study. |
| Blinding of outcome assessment (detection bias) for OS | Low risk | Low risk of bias for OS. |
| Blinding of outcome assessment (detection bias) | Unclear risk | Objective endpoints measured (e.g. response rate according to the European Group for Blood and Bone Marrow Transplant (EBMT) criteria, overall survival). Not known if blinded/independent outcomes assessment conducted. |
| Incomplete outcome data (attrition bias) | Unclear risk | Not clear if any patients lost to follow‐up, withdrawn etc (abstract only). |
| Selective reporting (reporting bias) | Unclear risk | Not clear (abstract only). Benefits and harms reported. |
| Other bias | Unclear risk | Not reported. |
| Methods |
| |
| Participants |
| |
| Interventions |
| |
| Outcomes |
| |
| Notes |
| |
| Risk of bias | ||
| Bias | Authors' judgement | Support for judgement |
| Random sequence generation (selection bias) | Low risk | Study design described as 'randomised'. |
| Allocation concealment (selection bias) | Unclear risk | Not reported. Multi‐centre trial, therefore probably centrally randomised. |
| Blinding of participants and personnel (performance bias) | High risk | Open‐label study. |
| Blinding of outcome assessment (detection bias) for OS | Low risk | Low risk of bias for OS. |
| Blinding of outcome assessment (detection bias) | Unclear risk | Objective endpoints measured (e.g. response rate and progression according to International Uniform Response Criteria, overall survival) however independent blinded outcomes assessment not reported. |
| Incomplete outcome data (attrition bias) | Low risk | Detailed flow chart accounting for all patients. Acceptable rates of withdrawal/lost to follow‐up. |
| Selective reporting (reporting bias) | Low risk | Benefits and harms reported. |
| Other bias | Unclear risk | Not reported. |
| Methods |
| |
| Participants |
| |
| Interventions |
| |
| Outcomes |
| |
| Notes |
| |
| Risk of bias | ||
| Bias | Authors' judgement | Support for judgement |
| Random sequence generation (selection bias) | Low risk | Study design described as 'randomised'. |
| Allocation concealment (selection bias) | Low risk | Patients were randomised via 'web‐based system' at central coordinating centre. |
| Blinding of participants and personnel (performance bias) | High risk | Open‐label study. |
| Blinding of outcome assessment (detection bias) for OS | Low risk | Low risk of bias for OS. |
| Blinding of outcome assessment (detection bias) | Low risk | Objective endpoints measured (e.g. response rate and progression according to the European Group for Blood and Bone Marrow Transplant (EBMT) criteria, overall survival). Responses monitored by external contract research organisation and centrally reassessed by central coordinating team. |
| Incomplete outcome data (attrition bias) | Low risk | Detailed flow chart accounting for all patients. Acceptable rates of withdrawal/lost to follow‐up. |
| Selective reporting (reporting bias) | Low risk | Benefits and harms reported. |
| Other bias | Unclear risk | Not reported. |
| Methods |
| |
| Participants |
| |
| Interventions |
| |
| Outcomes |
| |
| Notes |
| |
| Risk of bias | ||
| Bias | Authors' judgement | Support for judgement |
| Random sequence generation (selection bias) | Low risk | Study design described as 'randomised'. |
| Allocation concealment (selection bias) | Low risk | Patients were randomised via 'web‐based' system. |
| Blinding of participants and personnel (performance bias) | High risk | Open‐label study. |
| Blinding of outcome assessment (detection bias) for OS | Low risk | Low risk of bias for OS. |
| Blinding of outcome assessment (detection bias) | Unclear risk | Objective endpoints measured (e.g. response rate and progression according to modified European Group for Blood and Bone Marrow Transplant (EBMT) criteria, overall survival), however, independent/blinded outcomes assessment not reported. |
| Incomplete outcome data (attrition bias) | Low risk | Detailed flow chart accounting for all patients included. |
| Selective reporting (reporting bias) | Low risk | Benefits and harms reported. |
| Other bias | Unclear risk | None reported. |
| Methods |
| |
| Participants |
| |
| Interventions |
| |
| Outcomes |
| |
| Notes |
| |
| Risk of bias | ||
| Bias | Authors' judgement | Support for judgement |
| Random sequence generation (selection bias) | Low risk | Study design described as 'randomised'. |
| Allocation concealment (selection bias) | Low risk | Patients were 'centrally randomly assigned'. |
| Blinding of participants and personnel (performance bias) | High risk | Open‐label study. |
| Blinding of outcome assessment (detection bias) for OS | Low risk | Low risk of bias for OS. |
| Blinding of outcome assessment (detection bias) | Low risk | Objective endpoints measured (e.g. response rate and progression according to modified European Group for Blood and Bone Marrow Transplant (EBMT) criteria, overall survival). Responses confirmed by independent review committee. |
| Incomplete outcome data (attrition bias) | Low risk | Detailed flow chart accounting for all patients included. Acceptable rates of withdrawal. |
| Selective reporting (reporting bias) | Low risk | Benefits and harms reported. |
| Other bias | Unclear risk | None reported. |
| Methods |
| |
| Participants |
| |
| Interventions |
| |
| Outcomes |
| |
| Notes |
| |
| Risk of bias | ||
| Bias | Authors' judgement | Support for judgement |
| Random sequence generation (selection bias) | Low risk | Study design described as 'randomised'. |
| Allocation concealment (selection bias) | Low risk | Patients were 'centrally randomised'. |
| Blinding of participants and personnel (performance bias) | High risk | Open‐label study. |
| Blinding of outcome assessment (detection bias) for OS | Low risk | Low risk of bias for OS. |
| Blinding of outcome assessment (detection bias) | Low risk | Objective endpoints measured (e.g. response rate and progression according to International Myeloma Working Group Uniform Criteria, overall survival). Laboratory samples to evaluate response data were centrally evaluated. |
| Incomplete outcome data (attrition bias) | Low risk | Detailed flow chart accounting for all patients included. Acceptable rates of withdrawal. |
| Selective reporting (reporting bias) | Low risk | Benefits and harms reported. |
| Other bias | Unclear risk | None reported. |
| Methods |
| |
| Participants |
| |
| Interventions |
| |
| Outcomes |
| |
| Notes |
| |
| Risk of bias | ||
| Bias | Authors' judgement | Support for judgement |
| Random sequence generation (selection bias) | Low risk | Study design described as 'randomised'. |
| Allocation concealment (selection bias) | Unclear risk | Not specified. |
| Blinding of participants and personnel (performance bias) | High risk | Open‐label study. |
| Blinding of outcome assessment (detection bias) for OS | Low risk | Low risk of bias for OS. |
| Blinding of outcome assessment (detection bias) | Low risk | Objective endpoints measured (e.g. response rate, overall survival). |
| Incomplete outcome data (attrition bias) | Low risk | 2 patients withdrew early (from group 1 and group 3). No lost to follow‐up patients reported. |
| Selective reporting (reporting bias) | Low risk | Benefits and harms reported. |
| Other bias | Unclear risk | None reported. |
| Methods |
| |
| Participants |
| |
| Interventions |
| |
| Outcomes |
| |
| Notes |
| |
| Risk of bias | ||
| Bias | Authors' judgement | Support for judgement |
| Random sequence generation (selection bias) | Low risk | Study design described as 'randomised'. |
| Allocation concealment (selection bias) | Unclear risk | Not specified. Central randomisation most probably performed. |
| Blinding of participants and personnel (performance bias) | High risk | Open‐label study. |
| Blinding of outcome assessment (detection bias) for OS | Low risk | Low risk of bias for OS. |
| Blinding of outcome assessment (detection bias) | Unclear risk | Objective endpoints measured (e.g. response rate and progression according to European Group for Blood and Bone Marrow Transplant (EBMT) criteria, overall survival). Independent outcomes assessment not reported. |
| Incomplete outcome data (attrition bias) | Low risk | Flow chart with all randomised patients accounted for. Low rate of lost to follow‐up. All patients included in intention‐to‐treat Analysis. |
| Selective reporting (reporting bias) | Low risk | Benefits and harms reported. |
| Other bias | Unclear risk | None reported. |
| Methods |
| |
| Participants |
| |
| Interventions |
| |
| Outcomes |
| |
| Notes |
| |
| Risk of bias | ||
| Bias | Authors' judgement | Support for judgement |
| Random sequence generation (selection bias) | Low risk | Study design described as 'randomised', employing a 'computer‐generated randomisation schedule' based on 'permuted blocks'. |
| Allocation concealment (selection bias) | Low risk | Central randomisation using an 'interactive voice response system' (IVRS). |
| Blinding of participants and personnel (performance bias) | High risk | Open‐label study. |
| Blinding of outcome assessment (detection bias) for OS | Low risk | Low risk of bias for OS. |
| Blinding of outcome assessment (detection bias) | Low risk | Objective endpoints measured (e.g. response rate and progression by European Group for Blood and Bone Marrow Transplant (EBMT) criteria, overall survival). Response data based on central laboratory analysis and blinded response evaluation. |
| Incomplete outcome data (attrition bias) | Low risk | Detailed flow chart with all randomised patients accounted for. No lost to follow‐up patients reported. |
| Selective reporting (reporting bias) | Low risk | Benefits and harms reported. |
| Other bias | Unclear risk | None reported. |
| Methods |
| |
| Participants |
| |
| Interventions |
| |
| Outcomes |
| |
| Notes |
| |
| Risk of bias | ||
| Bias | Authors' judgement | Support for judgement |
| Random sequence generation (selection bias) | Low risk | Study design described as 'randomised'. |
| Allocation concealment (selection bias) | Low risk | Central computer randomisation performed. |
| Blinding of participants and personnel (performance bias) | High risk | Open‐label study. |
| Blinding of outcome assessment (detection bias) for OS | Low risk | Low risk of bias for OS. |
| Blinding of outcome assessment (detection bias) | Low risk | Objective endpoints measured (e.g. response rate and progression according to European Group for Blood and Bone Marrow Transplant (EBMT) criteria, overall survival). Independent outcomes assessment not reported but data monitored by independent contract research organization. |
| Incomplete outcome data (attrition bias) | Low risk | Clear flow chart with all randomised patients accounted for. No lost to follow‐up reported. All patients included in intention‐to‐treat analysis. |
| Selective reporting (reporting bias) | Unclear risk | Benefits and harms reported however selected adverse events reported (peripheral neuropathy and neuropathic pain) only. 2 secondary malignancies reported (1 on treatment arm; 1 on control arm). |
| Other bias | Unclear risk | None reported. |
| Methods |
| |
| Participants |
| |
| Interventions |
| |
| Outcomes |
| |
| Notes |
| |
| Risk of bias | ||
| Bias | Authors' judgement | Support for judgement |
| Random sequence generation (selection bias) | Low risk | Study design described as 'randomised'. |
| Allocation concealment (selection bias) | Low risk | Central web‐based randomisation performed. |
| Blinding of participants and personnel (performance bias) | High risk | Open‐label study. |
| Blinding of outcome assessment (detection bias) for OS | Low risk | Low risk of bias for OS. |
| Blinding of outcome assessment (detection bias) | Unclear risk | Objective endpoints measured (e.g. response rate and progression according to International Myeloma Working Group (IMWG) guidelines, overall survival). Independent outcomes assessment not reported. |
| Incomplete outcome data (attrition bias) | Low risk | Detailed flow chart for randomised patients included. Acceptable rates of withdrawal, no lost to follow‐up patients reported. All patients included in intention‐to‐treat analysis. |
| Selective reporting (reporting bias) | Low risk | Benefits and harms reported. |
| Other bias | Unclear risk | None reported. |
| Methods |
| |
| Participants |
| |
| Interventions |
| |
| Outcomes |
| |
| Notes |
| |
| Risk of bias | ||
| Bias | Authors' judgement | Support for judgement |
| Random sequence generation (selection bias) | Low risk | Study design described as 'randomised'. |
| Allocation concealment (selection bias) | Unclear risk | Not specified. Central randomisation most probably performed. |
| Blinding of participants and personnel (performance bias) | High risk | Open‐label study. |
| Blinding of outcome assessment (detection bias) for OS | Low risk | Low risk of bias for OS. |
| Blinding of outcome assessment (detection bias) | Low risk | Objective endpoints measured (e.g. e.g. response rate and progression according to European Group for Blood and Bone Marrow Transplant (EBMT) criteria, overall survival). Response data based on central laboratory analysis of blood and urine samples. |
| Incomplete outcome data (attrition bias) | Low risk | Detailed flow chart. Low numbers lost to follow‐up/excluded from analysis. |
| Selective reporting (reporting bias) | Low risk | Benefits and harms reported. |
| Other bias | Unclear risk | None reported. |
IV: intravenous
SC: subcutaneous
Characteristics of excluded studies [ordered by study ID]
| Study | Reason for exclusion |
| Described as a 'retrospective randomised' study. Small study of 46 patients randomised according to date of hospitalisation. | |
| Same dose of bortezomib on same days on both arms (PAD regimen = 28 day cycle and VCD regimen = 21‐day cycle). | |
| Same dose/schedule of bortezomib on each arm. | |
| Same dose/schedule of bortezomib on each arm. | |
| Same dose/schedule of bortezomib on each arm. | |
| Same dose/schedule of bortezomib on each arm. |
PAD:
VCD:
Characteristics of studies awaiting assessment [ordered by study ID]
| Methods | Design: Randomised, open‐label, phase II trial. Overall sample size: N = 150 patients. |
| Participants | Patients with newly diagnosed multiple myeloma who have completed stem cell transplant. |
| Interventions | Arm A (bortezomib). Patients receive bortezomib subcutaneously (SC) on days 1 and 15 of courses 1 to 12 and day 1 of courses 13 to 24. Arm B (bortezomib, cyclophosphamide, dexamethasone). Patients receive bortezomib SC as in Arm A, cyclophosphamide orally on days 1 and 15 of courses 1 to12 and day 1 of courses 13 to 24, and dexamethasone orally on days 1 and 15 of courses 1 to 12 and day 1 of courses 13 to 24. Arm C (bortezomib, lenalidomide). Patients receive bortezomib SC as in Arm A and lenalidomide orally on days 1 to 28. |
| Outcomes | Primary: Proportion of patients with stringent complete response. Secondary: Survival time, progression‐free survival, adverse events. |
| Notes | Sponsor: Mayo Clinic, US. This study is not eligible for inclusion (same dose/schedule of bortezomib on each arm). To be verified post‐publication for addition to next update of this review. |
| Methods | Design: Randomised, open‐label, phase II trial. Overall sample size: N = 106 patients. |
| Participants | Patients with multiple myeloma who have received high‐dose chemotherapy and autologous stem cell transplantation. |
| Interventions | Experimental arm: Bortezomib 1.6 mg/m² bolus injection on Days 1, 8, 15 and 22 every 5 weeks for 4 cycles. Control arm: Observation only. |
| Outcomes | Primary: Change From baseline in Bone Mineral Density (BMD). Secondary: Progression‐free survival, bone markers, skeletal events, appearance of new bone lesions, Karnosfsky performance status, overall survival. |
| Notes | Sponsor: Janssen‐Cilag International NV. BMD data published by abstract only (European Haematology Association (EHA) Congress, June 2014). To consider eligibility of study for inclusion in future update of review if progression‐free survival and/or overall survival data are published. |
Characteristics of ongoing studies [ordered by study ID]
| Trial name or title | CLARION Study |
| Methods |
|
| Participants | Transplant‐ineligible patients with multiple myeloma. |
| Interventions | Carfilzomib, Melphalan, and Prednisone (CMP) versus Bortezomib, Melphalan, and Prednisone (VMP). |
| Outcomes |
|
| Starting date | 2013 |
| Contact information | Onyx Pharmaceuticals |
| Notes | Study in recruitment phase. November 2017 (final data collection date for primary outcome measure). Last update on Clinicaltrials.gov April 2015. |
| Trial name or title | CR006127 Study |
| Methods |
|
| Participants | Patients with multiple myeloma aged 61 to 75. |
| Interventions | Bortezomib 1.6 mg/m2 IV on days 1, 8, 15 and 22 of 35‐day cycle for 4 cycles as consolidation therapy versus observation. |
| Outcomes |
|
| Starting date | 2006 |
| Contact information | Janssen‐Cilag G.m.b.H |
| Notes | May 2013 (final data collection date for primary outcome measure). Last update on Clinicaltrials.gov March 2015. Contact with company confirmed study not yet published. |
| Trial name or title | CR006124 Study |
| Methods |
|
| Participants | Patients with multiple myeloma aged less than 60 years. |
| Interventions | Bortezomib 1.6 mg/m2 IV on days 1, 8, 15 and 22 of 35‐day cycle for 4 cycles as consolidation therapy versus observation. |
| Outcomes |
|
| Starting date | 2006 |
| Contact information | Janssen‐Cilag G.m.b.H |
| Notes | May 2013 (final data collection date for primary outcome measure). Last update on Clinicaltrials.gov March 2015. Contact with company confirmed study not yet published. |
| Trial name or title | ECOG E1A11 Study |
| Methods |
|
| Participants | Patients with newly diagnosed symptomatic multiple myeloma. |
| Interventions | Bortezomib, Lenalidomide and Dexamethasone (VRd) versus Carfilzomib, Lenalidomide, Dexamethasone (CRd) followed by limited or indefinite Lenalidomide maintenance. |
| Outcomes |
|
| Starting date | 2013 |
| Contact information | Dr SK Kumar, Eastern Cooperative Oncology Group (ECOG) |
| Notes | May 2016 (final data collection date for primary outcome measure). Last update on Clinicaltrials.gov September 2014. |
| Trial name or title | ENDEAVOR Study |
| Methods |
|
| Participants | Patients with relapsed multiple myeloma |
| Interventions | Carfilzomib and Dexamethasone versus Bortezomib and Dexamethasone |
| Outcomes | Primary: Progression‐free survival |
| Starting date | 2012 |
| Contact information | Onyx Pharmaceuticals |
| Notes | January 2016 (final data collection date for primary outcome measure). Last update on Clinicaltrials.gov March 2015. |
| Trial name or title | PRO# 1307 Study |
| Methods |
|
| Participants | Patients with multiple myeloma 65 years or older. |
| Interventions | Autologous Stem Cell Transplantation with high‐dose Melphalan versus high‐dose Melphalan and Bortezomib. |
| Outcomes |
|
| Starting date | 2010 |
| Contact information | Dr M Donato, John Theurer Cancer Center, Hackensack University Medical Center, New Jersey, US. |
| Notes | Study open to recruitment. November 2014 (final data collection date for primary outcome measure). Last update on Clinicaltrials.gov Aug 2014. |
| Trial name or title | HOVON 95 Study |
| Methods |
|
| Participants | Patients with newly diagnosed multiple myeloma. |
| Interventions | Bortezomib, Melphalan, Prednisone (VMP) With high‐dose Melphalan followed by Bortezomib, Lenalidomide, Dexamethasone (VRD) Consolidation and Lenalidomide Maintenance. |
| Outcomes |
|
| Starting date | 2011 |
| Contact information | Prof. P Sonneveld, Stichting Hemato‐Oncologie voor Volwassenen Nederland |
| Notes | April 2021 (final data collection date for primary outcome measure). Last update on Clinicaltrials.gov March 2015. |
| Trial name or title | 2081‐113 Study |
| Methods |
|
| Participants | Patients with previously untreated multiple myeloma without an intent for immediate autologous stem cell transplant. |
| Interventions | Lenalidomide and low dose dexamethasone (LLD) versus bortezomib, lenalidomide and low dose dexamethasone (BLLD) as induction therapy. |
| Outcomes | Progression‐free survival. |
| Starting date | 2009 |
| Contact information | Dr N Chaudri, King Faisal Specialist Hospital & Reseach Center, Riyadh, Saudi Arabia |
| Notes | January 2013 (Final data collection date for primary outcome measure). Recruitment status unknown; last update on Clinicaltrials.gov Feb 2012. |
| Trial name or title | CR018796 Study |
| Methods |
Overall sample size: N = 80 patients. |
| Participants | Patients with multiple myeloma in first or second relapse. |
| Interventions |
|
| Outcomes |
|
| Starting date | 2013 |
| Contact information | Janssen‐Cilag International NV |
| Notes | January 2016 (final data collection date for primary outcome measure). Last update on Clinicaltrials.gov April 2015. |
| Trial name or title | Subcutaneous bortezomib maintenance Study |
| Methods |
|
| Participants | Patients with relapsed and refractory multiple myeloma after salvage with bortezomib‐based therapy. |
| Interventions |
|
| Outcomes |
|
| Starting date | 2013 |
| Contact information | Stichting Hemato‐Oncologie voor Volwassenen Nederland. |
| Notes | Study open to recruitment. November 2016 (final data collection date for primary outcome measure). Last update on Clinicaltrials.gov March 2015. |
| Trial name or title | SWOG‐S0777 Study |
| Methods |
|
| Participants | Previously untreated multiple myeloma without intent for immediate Autologous Stem Cell Transplant. |
| Interventions | Lenalidomide and Low Dose Dexamethasone (LLD) versus Bortezomib, Lenalidomide and Low Dose Dexamethasone (BLLD) as induction therapy. |
| Outcomes |
|
| Starting date | 2008 |
| Contact information | Dr BG Durie, Southwest Oncology Group (SWOG). |
| Notes | Follow‐up continuing. Last update on Clinicaltrials.gov September 2014. |
| Trial name or title | CR018751 Study |
| Methods |
|
| Participants | Patients with multiple myeloma after receiving Bortezomib, Cyclophosphamide, Dexamethasone (VCD) Induction and Autologous Stem Cell Transplant. |
| Interventions | Bortezomib Consolidation (With Thalidomide and Prednisolone) versus Thalidomide and Prednisolone Alone. |
| Outcomes |
|
| Starting date | 2012 |
| Contact information | Janssen Scientific Affairs, LLC |
| Notes | October 2015 (Final data collection date for primary outcome measure). Last update on Clinicaltrials.gov March 2015. |
| Trial name or title | DSMM XIV Study |
| Methods |
|
| Participants | Patients with newly diagnosed multiple myeloma. |
| Interventions | Lenalidomide, Adriamycin, Dexamethasone (RAD) versus Lenalidomide, Bortezomib, Dexamethasone (VRD) as induction therapy followed by response‐adapted consolidation and lenalidomide maintenance. |
| Outcomes |
|
| Starting date | 2012 |
| Contact information | Dr Stefan Knop, Wuerzburg University Hospital. |
| Notes | Study still recruiting. Last update on Clinicaltrials.gov September 2012. |
Data and analyses
| Outcome or subgroup title | No. of studies | No. of participants | Statistical method | Effect size |
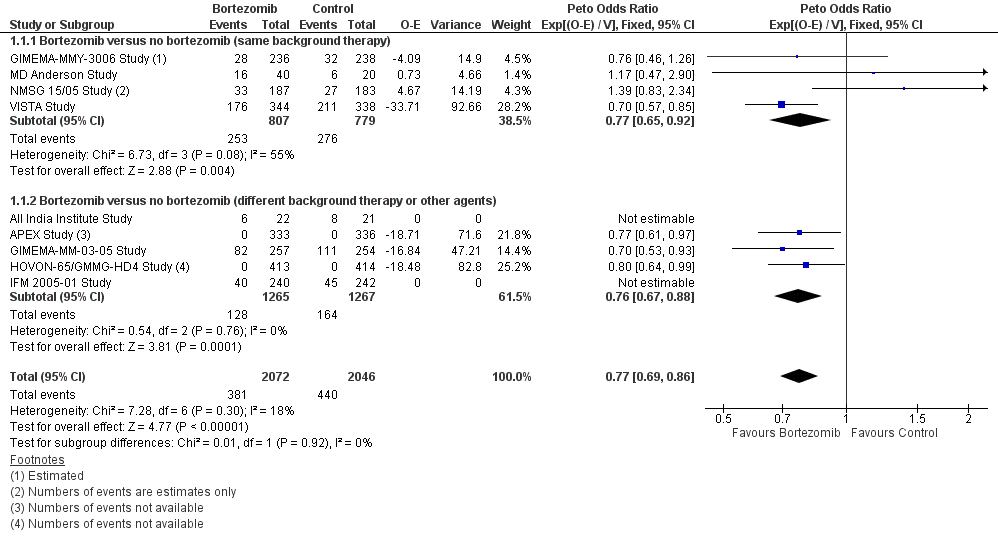
| 1 Overall Survival Show forest plot | 9 | 4118 | Peto Odds Ratio (95% CI) | 0.77 [0.69, 0.86] |
| Analysis 1.1 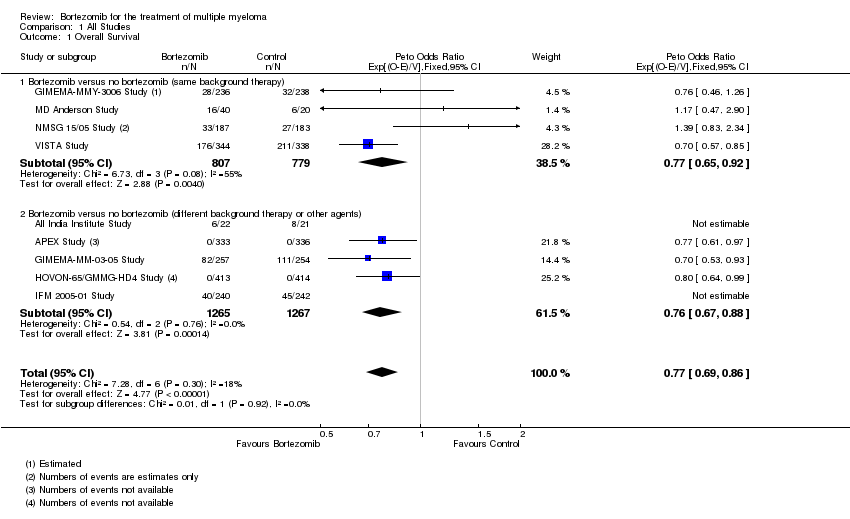 Comparison 1 All Studies, Outcome 1 Overall Survival. | ||||
| 1.1 Bortezomib versus no bortezomib (same background therapy) | 4 | 1586 | Peto Odds Ratio (95% CI) | 0.77 [0.65, 0.92] |
| 1.2 Bortezomib versus no bortezomib (different background therapy or other agents) | 5 | 2532 | Peto Odds Ratio (95% CI) | 0.76 [0.67, 0.88] |
| 2 Progression‐Free Survival Show forest plot | 9 | 4344 | Peto Odds Ratio (95% CI) | 0.67 [0.61, 0.72] |
| Analysis 1.2  Comparison 1 All Studies, Outcome 2 Progression‐Free Survival. | ||||
| 2.1 Bortezomib versus no bortezomib (same background therapy) | 5 | 1855 | Peto Odds Ratio (95% CI) | 0.65 [0.57, 0.74] |
| 2.2 Bortezomib versus no bortezomib (different background therapy or other agents) | 4 | 2489 | Peto Odds Ratio (95% CI) | 0.67 [0.61, 0.75] |
| 3 Complete Response Rate Show forest plot | 12 | 4630 | Odds Ratio (M‐H, Fixed, 95% CI) | 2.35 [2.02, 2.73] |
| Analysis 1.3  Comparison 1 All Studies, Outcome 3 Complete Response Rate. | ||||
| 3.1 Bortezomib versus no bortezomib (same background therapy) | 6 | 2064 | Odds Ratio (M‐H, Fixed, 95% CI) | 2.63 [2.13, 3.24] |
| 3.2 Bortezomib versus no bortezomib (different background therapy or other agents) | 6 | 2566 | Odds Ratio (M‐H, Fixed, 95% CI) | 2.08 [1.67, 2.58] |
| 4 Overall Response Rate Show forest plot | 12 | 4630 | Odds Ratio (M‐H, Fixed, 95% CI) | 2.62 [2.25, 3.05] |
| Analysis 1.4 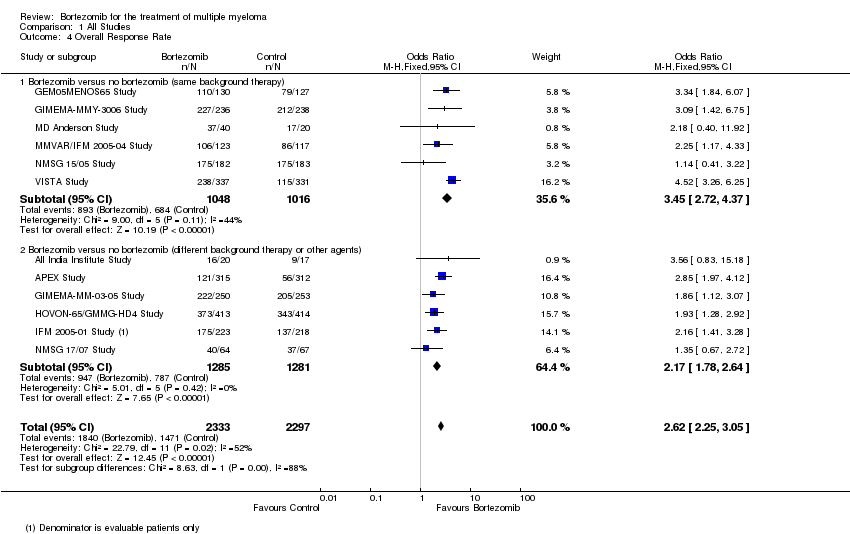 Comparison 1 All Studies, Outcome 4 Overall Response Rate. | ||||
| 4.1 Bortezomib versus no bortezomib (same background therapy) | 6 | 2064 | Odds Ratio (M‐H, Fixed, 95% CI) | 3.45 [2.72, 4.37] |
| 4.2 Bortezomib versus no bortezomib (different background therapy or other agents) | 6 | 2566 | Odds Ratio (M‐H, Fixed, 95% CI) | 2.17 [1.78, 2.64] |
| 5 Treatment‐related death Show forest plot | 5 | 2389 | Odds Ratio (M‐H, Fixed, 95% CI) | 0.76 [0.43, 1.34] |
| Analysis 1.5  Comparison 1 All Studies, Outcome 5 Treatment‐related death. | ||||
| 5.1 Bortezomib versus no bortezomib (same background therapy) | 2 | 737 | Odds Ratio (M‐H, Fixed, 95% CI) | 0.81 [0.30, 2.16] |
| 5.2 Bortezomib versus no bortezomib (different background therapy or other agents) | 3 | 1652 | Odds Ratio (M‐H, Fixed, 95% CI) | 0.73 [0.36, 1.48] |
| 6 Adverse Events: Thrombocytopenia Show forest plot | 8 | 3791 | Odds Ratio (M‐H, Fixed, 95% CI) | 2.05 [1.70, 2.48] |
| Analysis 1.6  Comparison 1 All Studies, Outcome 6 Adverse Events: Thrombocytopenia. | ||||
| 6.1 Bortezomib versus no bortezomib (same background therapy) | 3 | 1196 | Odds Ratio (M‐H, Fixed, 95% CI) | 1.51 [1.13, 2.00] |
| 6.2 Bortezomib versus no bortezomib (different background therapy or other agents) | 5 | 2595 | Odds Ratio (M‐H, Fixed, 95% CI) | 2.60 [2.01, 3.35] |
| 7 Adverse Events: Neutropenia Show forest plot | 8 | 3791 | Odds Ratio (M‐H, Fixed, 95% CI) | 1.33 [1.10, 1.60] |
| Analysis 1.7  Comparison 1 All Studies, Outcome 7 Adverse Events: Neutropenia. | ||||
| 7.1 Bortezomib versus no bortezomib (same background therapy) | 3 | 1196 | Odds Ratio (M‐H, Fixed, 95% CI) | 0.95 [0.73, 1.24] |
| 7.2 Bortezomib versus no bortezomib (different background therapy or other agents) | 5 | 2595 | Odds Ratio (M‐H, Fixed, 95% CI) | 1.85 [1.41, 2.41] |
| 8 Adverse Events: Anaemia Show forest plot | 6 | 3404 | Odds Ratio (M‐H, Fixed, 95% CI) | 0.80 [0.65, 1.00] |
| Analysis 1.8  Comparison 1 All Studies, Outcome 8 Adverse Events: Anaemia. | ||||
| 8.1 Bortezomib versus no bortezomib (same background therapy) | 2 | 939 | Odds Ratio (M‐H, Fixed, 95% CI) | 0.67 [0.48, 0.94] |
| 8.2 Bortezomib versus no bortezomib (different background therapy or other agents) | 4 | 2465 | Odds Ratio (M‐H, Fixed, 95% CI) | 0.92 [0.69, 1.21] |
| 9 Adverse Events: Nausea/Vomiting Show forest plot | 8 | 3788 | Odds Ratio (M‐H, Fixed, 95% CI) | 2.37 [1.64, 3.42] |
| Analysis 1.9  Comparison 1 All Studies, Outcome 9 Adverse Events: Nausea/Vomiting. | ||||
| 9.1 Bortezomib versus no bortezomib (same background therapy) | 4 | 1670 | Odds Ratio (M‐H, Fixed, 95% CI) | 4.55 [1.99, 10.42] |
| 9.2 Bortezomib versus no bortezomib (different background therapy or other agents) | 4 | 2118 | Odds Ratio (M‐H, Fixed, 95% CI) | 1.93 [1.28, 2.93] |
| 10 Adverse Events: Diarrhoea Show forest plot | 8 | 3788 | Odds Ratio (M‐H, Fixed, 95% CI) | 2.44 [1.74, 3.43] |
| Analysis 1.10 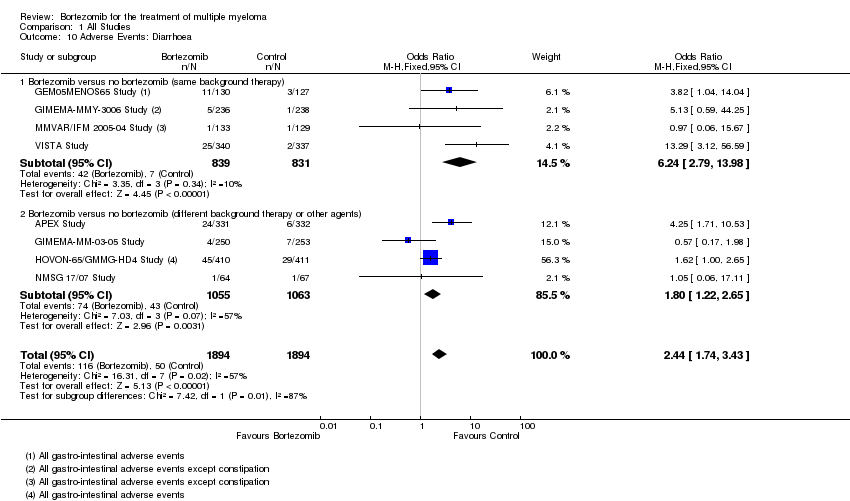 Comparison 1 All Studies, Outcome 10 Adverse Events: Diarrhoea. | ||||
| 10.1 Bortezomib versus no bortezomib (same background therapy) | 4 | 1670 | Odds Ratio (M‐H, Fixed, 95% CI) | 6.24 [2.79, 13.98] |
| 10.2 Bortezomib versus no bortezomib (different background therapy or other agents) | 4 | 2118 | Odds Ratio (M‐H, Fixed, 95% CI) | 1.80 [1.22, 2.65] |
| 11 Adverse Events: Constipation Show forest plot | 8 | 3788 | Odds Ratio (M‐H, Fixed, 95% CI) | 1.59 [1.14, 2.22] |
| Analysis 1.11  Comparison 1 All Studies, Outcome 11 Adverse Events: Constipation. | ||||
| 11.1 Bortezomib versus no bortezomib (same background therapy) | 4 | 1670 | Odds Ratio (M‐H, Fixed, 95% CI) | 1.88 [1.04, 3.41] |
| 11.2 Bortezomib versus no bortezomib (different background therapy or other agents) | 4 | 2118 | Odds Ratio (M‐H, Fixed, 95% CI) | 1.47 [0.98, 2.20] |
| 12 Adverse Events: Peripheral Neuropathy Show forest plot | 10 | 4636 | Odds Ratio (M‐H, Fixed, 95% CI) | 3.71 [2.92, 4.70] |
| Analysis 1.12  Comparison 1 All Studies, Outcome 12 Adverse Events: Peripheral Neuropathy. | ||||
| 12.1 Bortezomib versus no bortezomib (same background therapy) | 5 | 2040 | Odds Ratio (M‐H, Fixed, 95% CI) | 5.10 [3.37, 7.72] |
| 12.2 Bortezomib versus no bortezomib (different background therapy or other agents) | 5 | 2596 | Odds Ratio (M‐H, Fixed, 95% CI) | 3.09 [2.30, 4.14] |
| 13 Adverse Events: Infections (All) Show forest plot | 9 | 4266 | Odds Ratio (M‐H, Fixed, 95% CI) | 1.51 [1.27, 1.79] |
| Analysis 1.13  Comparison 1 All Studies, Outcome 13 Adverse Events: Infections (All). | ||||
| 13.1 Bortezomib versus no bortezomib (same background therapy) | 4 | 1670 | Odds Ratio (M‐H, Fixed, 95% CI) | 1.37 [0.97, 1.93] |
| 13.2 Bortezomib versus no bortezomib (different background therapy or other agents) | 5 | 2596 | Odds Ratio (M‐H, Fixed, 95% CI) | 1.55 [1.27, 1.90] |
| 14 Adverse Events: Herpes Zoster infection Show forest plot | 4 | 1733 | Odds Ratio (M‐H, Fixed, 95% CI) | 1.83 [0.91, 3.67] |
| Analysis 1.14  Comparison 1 All Studies, Outcome 14 Adverse Events: Herpes Zoster infection. | ||||
| 14.1 Bortezomib versus no bortezomib (same background therapy) | 2 | 939 | Odds Ratio (M‐H, Fixed, 95% CI) | 1.93 [0.74, 5.03] |
| 14.2 Bortezomib versus no bortezomib (different background therapy or other agents) | 2 | 794 | Odds Ratio (M‐H, Fixed, 95% CI) | 1.71 [0.62, 4.74] |
| 15 Adverse Events: Cardiac Disorders Show forest plot | 5 | 2191 | Odds Ratio (M‐H, Fixed, 95% CI) | 1.74 [1.17, 2.58] |
| Analysis 1.15  Comparison 1 All Studies, Outcome 15 Adverse Events: Cardiac Disorders. | ||||
| 15.1 Bortezomib versus no bortezomib (same background therapy) | 2 | 736 | Odds Ratio (M‐H, Fixed, 95% CI) | 1.17 [0.39, 3.52] |
| 15.2 Bortezomib versus no bortezomib (different background therapy or other agents) | 3 | 1455 | Odds Ratio (M‐H, Fixed, 95% CI) | 1.84 [1.21, 2.81] |
| 16 Adverse Events: Fatigue Show forest plot | 5 | 2926 | Odds Ratio (M‐H, Fixed, 95% CI) | 1.96 [1.35, 2.84] |
| Analysis 1.16 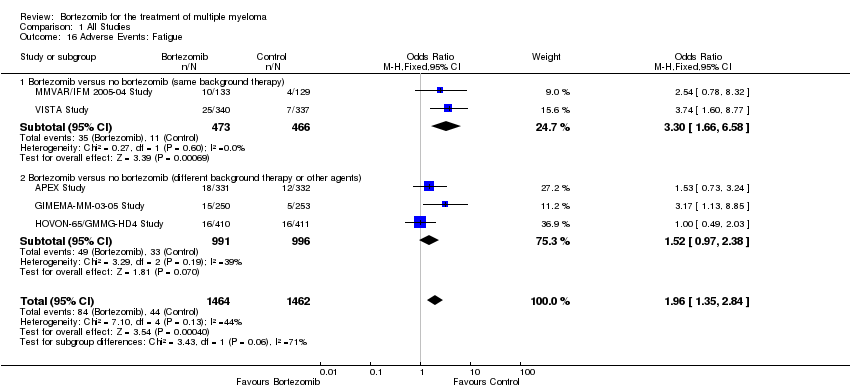 Comparison 1 All Studies, Outcome 16 Adverse Events: Fatigue. | ||||
| 16.1 Bortezomib versus no bortezomib (same background therapy) | 2 | 939 | Odds Ratio (M‐H, Fixed, 95% CI) | 3.30 [1.66, 6.58] |
| 16.2 Bortezomib versus no bortezomib (different background therapy or other agents) | 3 | 1987 | Odds Ratio (M‐H, Fixed, 95% CI) | 1.52 [0.97, 2.38] |
| Outcome or subgroup title | No. of studies | No. of participants | Statistical method | Effect size |
| 1 Overall Survival Show forest plot | 8 | 4075 | Peto Odds Ratio (95% CI) | 0.77 [0.70, 0.86] |
| Analysis 2.1  Comparison 2 Subgroup Analyses ‐ Disease Setting, Outcome 1 Overall Survival. | ||||
| 1.1 Relapsed / Refactory | 1 | 669 | Peto Odds Ratio (95% CI) | 0.77 [0.61, 0.97] |
| 1.2 Transplant Eligible | 5 | 2213 | Peto Odds Ratio (95% CI) | 0.86 [0.73, 1.02] |
| 1.3 Transplant Ineligible | 2 | 1193 | Peto Odds Ratio (95% CI) | 0.70 [0.59, 0.82] |
| 2 Progression Free Survival Show forest plot | 11 | 4344 | Peto Odds Ratio (95% CI) | 0.67 [0.61, 0.72] |
| Analysis 2.2  Comparison 2 Subgroup Analyses ‐ Disease Setting, Outcome 2 Progression Free Survival. | ||||
| 2.1 Relapsed / Refactory | 3 | 938 | Peto Odds Ratio (95% CI) | 0.57 [0.48, 0.68] |
| 2.2 Transplant Eligible | 6 | 2213 | Peto Odds Ratio (95% CI) | 0.76 [0.68, 0.85] |
| 2.3 Transplant Ineligible | 2 | 1193 | Peto Odds Ratio (95% CI) | 0.57 [0.49, 0.67] |
| 3 Complete Response Rate Show forest plot | 11 | 4593 | Odds Ratio (M‐H, Fixed, 95% CI) | 2.38 [2.05, 2.77] |
| Analysis 2.3 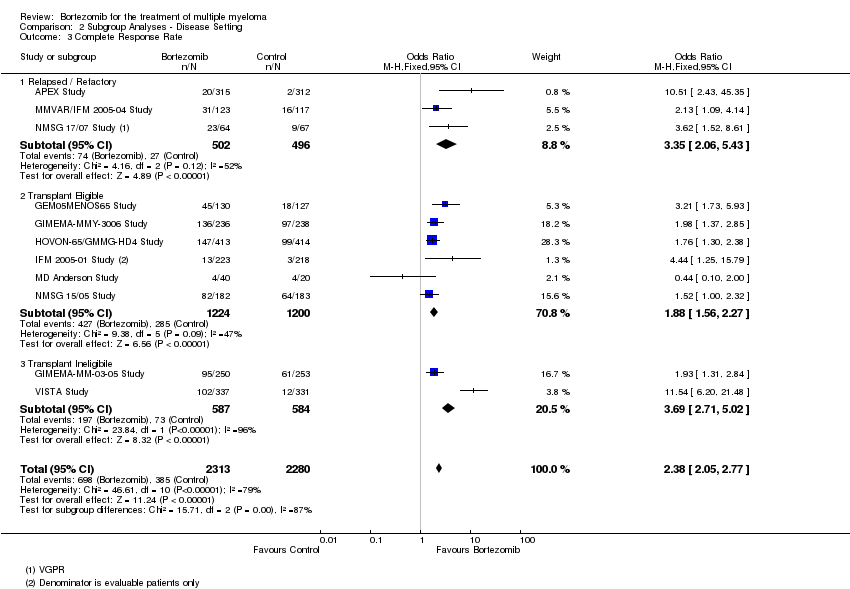 Comparison 2 Subgroup Analyses ‐ Disease Setting, Outcome 3 Complete Response Rate. | ||||
| 3.1 Relapsed / Refactory | 3 | 998 | Odds Ratio (M‐H, Fixed, 95% CI) | 3.35 [2.06, 5.43] |
| 3.2 Transplant Eligible | 6 | 2424 | Odds Ratio (M‐H, Fixed, 95% CI) | 1.88 [1.56, 2.27] |
| 3.3 Transplant Ineligibile | 2 | 1171 | Odds Ratio (M‐H, Fixed, 95% CI) | 3.69 [2.71, 5.02] |
| 4 Overall Response Rate Show forest plot | 11 | 4593 | Odds Ratio (M‐H, Fixed, 95% CI) | 2.61 [2.24, 3.05] |
| Analysis 2.4  Comparison 2 Subgroup Analyses ‐ Disease Setting, Outcome 4 Overall Response Rate. | ||||
| 4.1 Relapsed / Refactory | 3 | 998 | Odds Ratio (M‐H, Fixed, 95% CI) | 2.39 [1.79, 3.20] |
| 4.2 Transplant Eligible | 6 | 2424 | Odds Ratio (M‐H, Fixed, 95% CI) | 2.24 [1.76, 2.85] |
| 4.3 Transplant Ineligibile | 2 | 1171 | Odds Ratio (M‐H, Fixed, 95% CI) | 3.45 [2.63, 4.53] |
| Outcome or subgroup title | No. of studies | No. of participants | Statistical method | Effect size |
| 1 Overall Survival Show forest plot | 5 | Peto Odds Ratio (95% CI) | Subtotals only | |
| Analysis 3.1  Comparison 3 Subgroup Analyses ‐ Therapy Setting, Outcome 1 Overall Survival. | ||||
| 1.1 Induction | 3 | 1783 | Peto Odds Ratio (95% CI) | 0.81 [0.67, 0.96] |
| 1.2 Consolidation | 2 | 844 | Peto Odds Ratio (95% CI) | 1.02 [0.71, 1.47] |
| 1.3 Maintenance | 2 | 1338 | Peto Odds Ratio (95% CI) | 0.76 [0.64, 0.91] |
| 2 Progression Free Survival Show forest plot | 5 | Peto Odds Ratio (95% CI) | Subtotals only | |
| Analysis 3.2 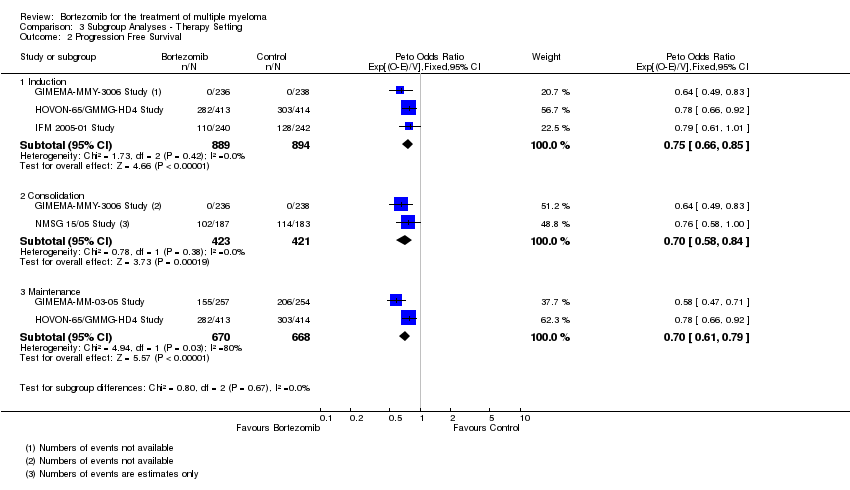 Comparison 3 Subgroup Analyses ‐ Therapy Setting, Outcome 2 Progression Free Survival. | ||||
| 2.1 Induction | 3 | 1783 | Peto Odds Ratio (95% CI) | 0.75 [0.66, 0.85] |
| 2.2 Consolidation | 2 | 844 | Peto Odds Ratio (95% CI) | 0.70 [0.58, 0.84] |
| 2.3 Maintenance | 2 | 1338 | Peto Odds Ratio (95% CI) | 0.70 [0.61, 0.79] |
| 3 Complete Response Rate Show forest plot | 6 | Odds Ratio (M‐H, Fixed, 95% CI) | Subtotals only | |
| Analysis 3.3  Comparison 3 Subgroup Analyses ‐ Therapy Setting, Outcome 3 Complete Response Rate. | ||||
| 3.1 Induction | 4 | 1999 | Odds Ratio (M‐H, Fixed, 95% CI) | 2.04 [1.65, 2.53] |
| 3.2 Consolidation | 2 | 839 | Odds Ratio (M‐H, Fixed, 95% CI) | 1.77 [1.34, 2.33] |
| 3.3 Maintenance | 2 | 1330 | Odds Ratio (M‐H, Fixed, 95% CI) | 1.82 [1.44, 2.31] |
| 4 Overall Response Rate Show forest plot | 6 | Odds Ratio (M‐H, Fixed, 95% CI) | Subtotals only | |
| Analysis 3.4 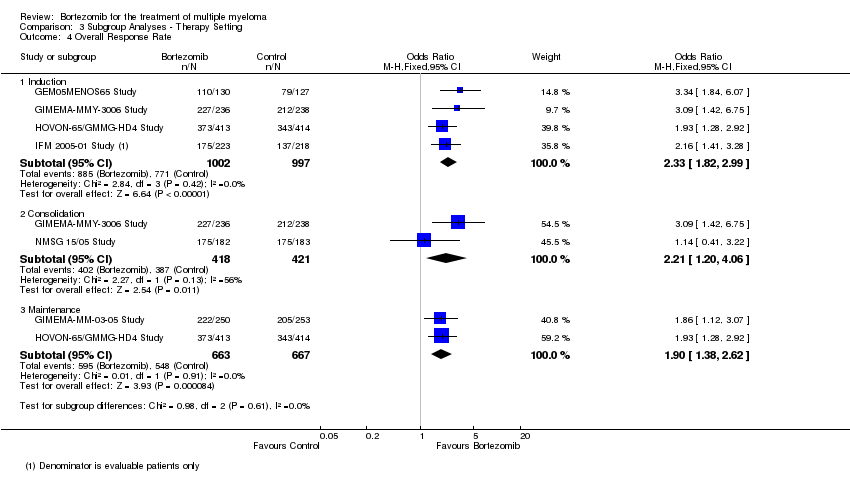 Comparison 3 Subgroup Analyses ‐ Therapy Setting, Outcome 4 Overall Response Rate. | ||||
| 4.1 Induction | 4 | 1999 | Odds Ratio (M‐H, Fixed, 95% CI) | 2.33 [1.82, 2.99] |
| 4.2 Consolidation | 2 | 839 | Odds Ratio (M‐H, Fixed, 95% CI) | 2.21 [1.20, 4.06] |
| 4.3 Maintenance | 2 | 1330 | Odds Ratio (M‐H, Fixed, 95% CI) | 1.90 [1.38, 2.62] |

Study flow diagram.

'Risk of bias' graph: review authors' judgements about each risk of bias item presented as percentages across all included studies.

'Risk of bias' summary: review authors' judgements about each risk of bias item for each included study.
Forest plot of comparison: 3 All studies, outcome: 3.1 Overall Survival.
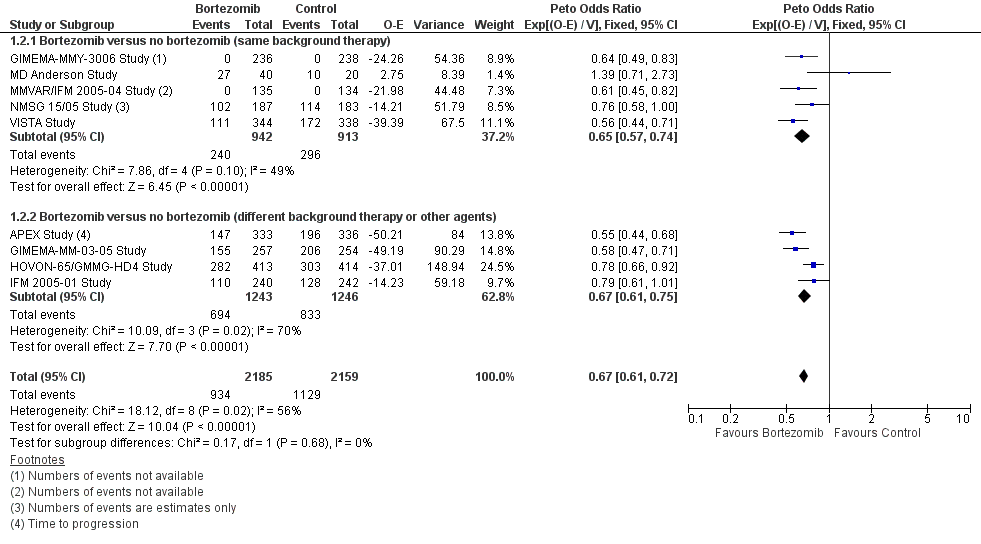
Forest plot of comparison: 3 All studies, outcome: 3.2 Progression Free Survival.
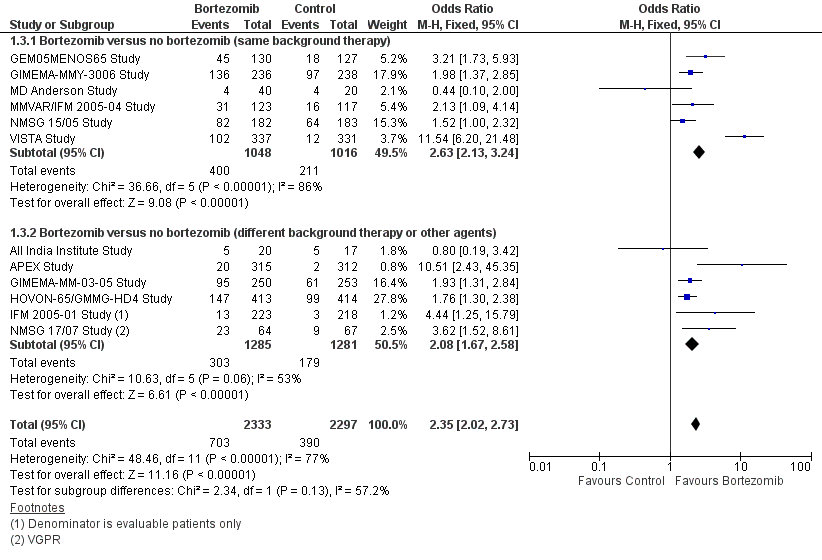
Forest plot of comparison: 3 All studies, outcome: 3.3 Complete Response Rate.
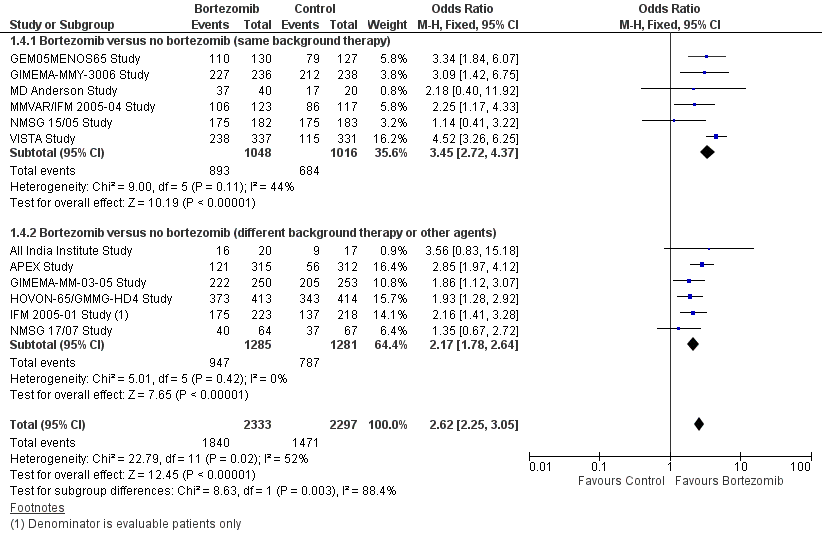
Forest plot of comparison: 3 All studies, outcome: 3.4 Overall Response Rate.

Comparison 1 All Studies, Outcome 1 Overall Survival.

Comparison 1 All Studies, Outcome 2 Progression‐Free Survival.

Comparison 1 All Studies, Outcome 3 Complete Response Rate.

Comparison 1 All Studies, Outcome 4 Overall Response Rate.
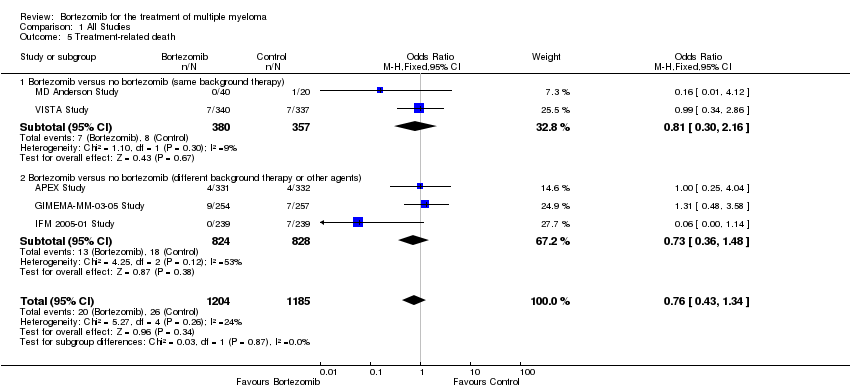
Comparison 1 All Studies, Outcome 5 Treatment‐related death.
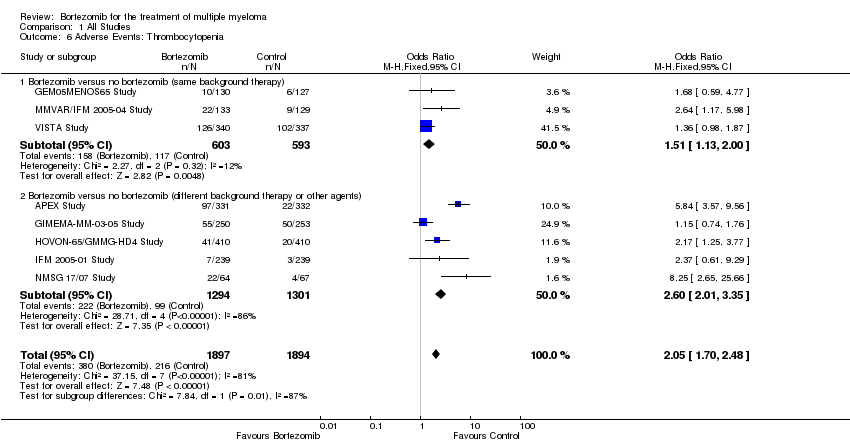
Comparison 1 All Studies, Outcome 6 Adverse Events: Thrombocytopenia.
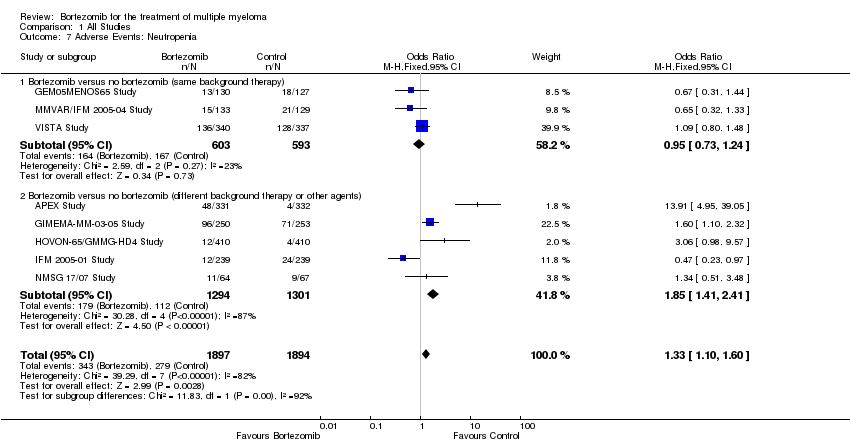
Comparison 1 All Studies, Outcome 7 Adverse Events: Neutropenia.
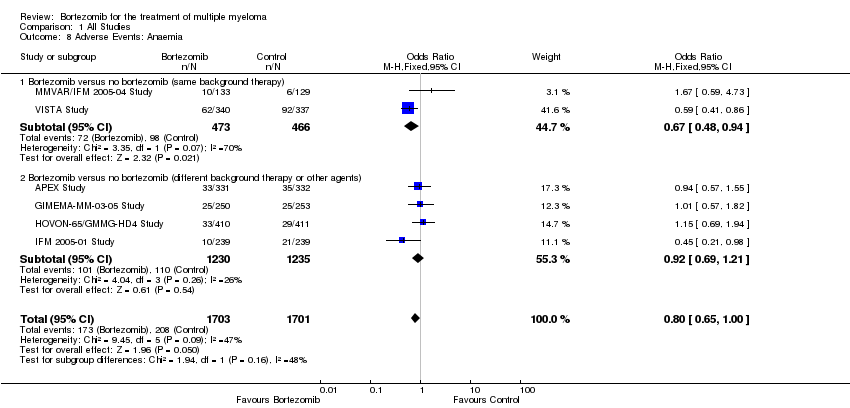
Comparison 1 All Studies, Outcome 8 Adverse Events: Anaemia.

Comparison 1 All Studies, Outcome 9 Adverse Events: Nausea/Vomiting.

Comparison 1 All Studies, Outcome 10 Adverse Events: Diarrhoea.

Comparison 1 All Studies, Outcome 11 Adverse Events: Constipation.
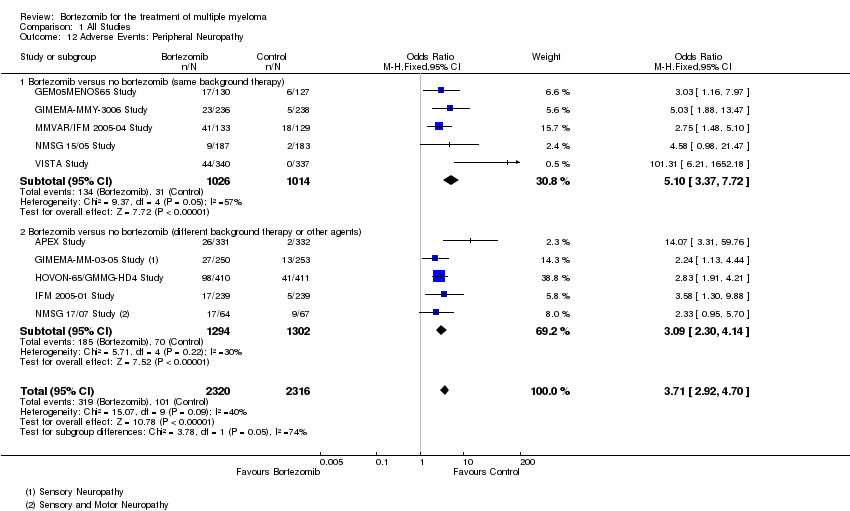
Comparison 1 All Studies, Outcome 12 Adverse Events: Peripheral Neuropathy.
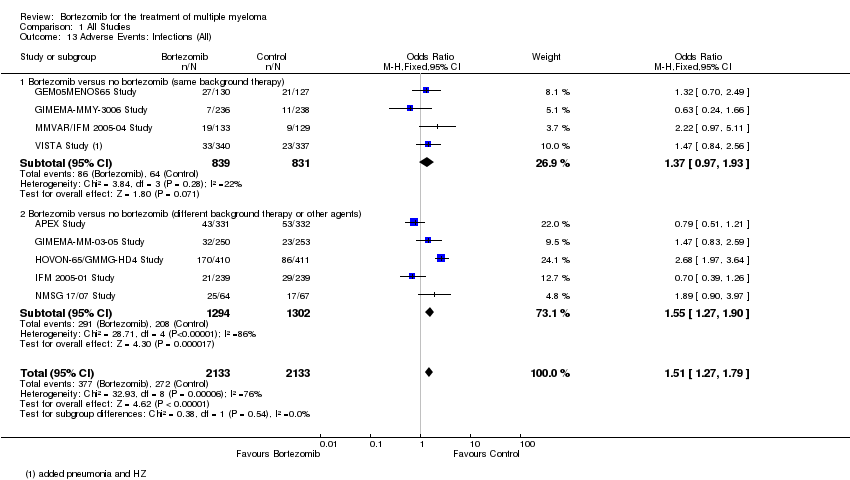
Comparison 1 All Studies, Outcome 13 Adverse Events: Infections (All).

Comparison 1 All Studies, Outcome 14 Adverse Events: Herpes Zoster infection.
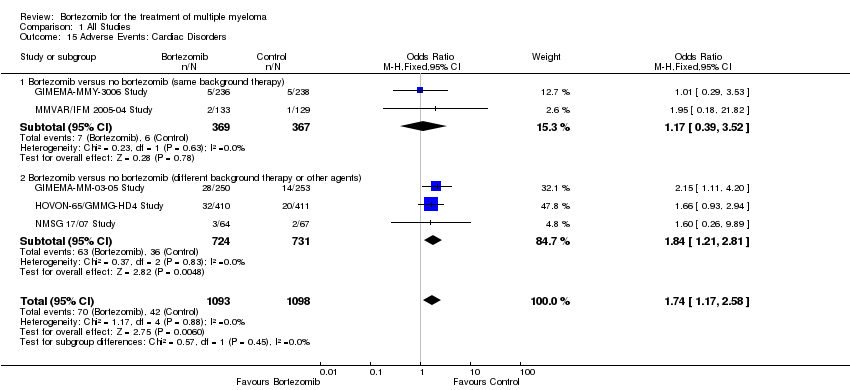
Comparison 1 All Studies, Outcome 15 Adverse Events: Cardiac Disorders.

Comparison 1 All Studies, Outcome 16 Adverse Events: Fatigue.

Comparison 2 Subgroup Analyses ‐ Disease Setting, Outcome 1 Overall Survival.

Comparison 2 Subgroup Analyses ‐ Disease Setting, Outcome 2 Progression Free Survival.

Comparison 2 Subgroup Analyses ‐ Disease Setting, Outcome 3 Complete Response Rate.

Comparison 2 Subgroup Analyses ‐ Disease Setting, Outcome 4 Overall Response Rate.

Comparison 3 Subgroup Analyses ‐ Therapy Setting, Outcome 1 Overall Survival.

Comparison 3 Subgroup Analyses ‐ Therapy Setting, Outcome 2 Progression Free Survival.
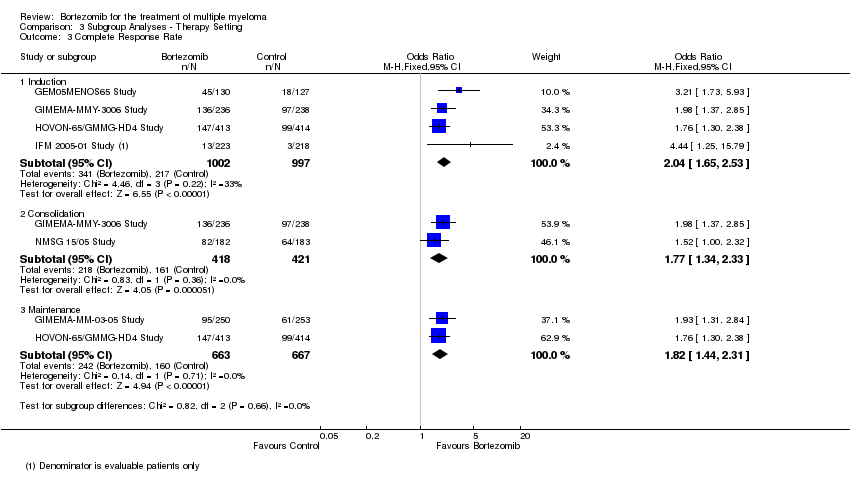
Comparison 3 Subgroup Analyses ‐ Therapy Setting, Outcome 3 Complete Response Rate.

Comparison 3 Subgroup Analyses ‐ Therapy Setting, Outcome 4 Overall Response Rate.
| Bortezomib versus no bortezomib | ||||||
| Patient or population: All patients with a diagnosis of multiple myeloma | ||||||
| Outcomes | Anticipated absolute effects* (95% CI) | Relative effect | № of participants | Quality of the evidence | Comments | |
| Risk without bortezomib | Risk with bortezomib | |||||
| Overall Survival | Study population | Peto Odds Ratio 0.77 | 4118 | ⨁⨁⨁⨁ | ||
| 215 per 1000 | 166 per 1000 | |||||
| Overall Survival ‐ Bortezomib versus no bortezomib (same background therapy) Follow‐up 36 to 60 months | Study population | Peto Odds Ratio 0.77 | 1586 | ⨁⨁⨁◯ | ||
| 354 per 1000 | 273 per 1000 | |||||
| Overall Survival ‐ Bortezomib versus no bortezomib (different background therapy or other agents) Follow‐up 7.5 to 67 months | Study population | Peto Odds Ratio 0.76 | 2532 | ⨁⨁⨁⨁ | ||
| 129 per 1000 | 98 per 1000 | |||||
| Progression‐Free Survival | Study population | Peto Odds Ratio 0.67 | 4344 | ⨁⨁◯◯ | ||
| 523 per 1000 | 350 per 1000 | |||||
| Progression‐Free Survival ‐ Bortezomib versus no bortezomib (same background therapy) Follow‐up 30 to 60 months | Study population | Peto Odds Ratio 0.65 | 1855 | ⨁⨁⨁◯ | ||
| 324 per 1000 | 211 per 1000 | |||||
| Progression‐Free Survival ‐ Bortezomib versus no bortezomib (different background therapy or other agents) Follow‐up 22 to 67 months | Study population | Peto Odds Ratio 0.67 | 2489 | ⨁⨁◯◯ | ||
| 669 per 1000 | 448 per 1000 | |||||
| Treatment‐related death | Study population | OR 0.76 | 2389 | ⨁⨁◯◯ | ||
| 22 per 1000 | 17 per 1000 | |||||
| Moderate | ||||||
| 27 per 1000 | 21 per 1000 | |||||
| Treatment‐related death ‐ Bortezomib versus no bortezomib (same background therapy) | Study population | OR 0.81 | 737 | ⨁⨁◯◯ | ||
| 22 per 1000 | 18 per 1000 | |||||
| Moderate | ||||||
| 35 per 1000 | 29 per 1000 | |||||
| Treatment‐related death ‐ Bortezomib versus no bortezomib (different background therapy or other agents) | Study population | OR 0.73 | 1652 | ⨁◯◯◯ | ||
| 22 per 1000 | 16 per 1000 | |||||
| Moderate | ||||||
| 27 per 1000 | 20 per 1000 | |||||
| Health‐related quality of life | see comment | see comment | see comment | 717 (4 RCTs) | see comment | Each trial used the same validated quality of life instrument (European Organization for Research and Treatment of Cancer (EORTC) Quality of Life Questionnaire (QLQ‐C30), whereas the time points of administration of the questionnaire varied between the four trials. |
| Adverse Events: Thrombocytopenia | Study population | OR 2.05 | 3791 | ⨁⨁◯◯ | ||
| 114 per 1000 | 209 per 1000 | |||||
| Moderate | ||||||
| 48 per 1000 | 94 per 1000 | |||||
| Adverse Events: Thrombocytopenia ‐ Bortezomib versus no bortezomib (same background therapy) | Study population | OR 1.51 | 1196 | ⨁⨁⨁⨁ | ||
| 197 per 1000 | 271 per 1000 | |||||
| Moderate | ||||||
| 47 per 1000 | 70 per 1000 | |||||
| Adverse Events: Thrombocytopenia ‐ Bortezomib versus no bortezomib (different background therapy or other agents) | Study population | OR 2.60 | 2595 | ⨁⨁◯◯ | ||
| 76 per 1000 | 176 per 1000 | |||||
| Moderate | ||||||
| 49 per 1000 | 118 per 1000 | |||||
| Adverse Events: Diarrhoea | Study population | OR 2.44 | 3788 | ⨁⨁◯◯ | ||
| 26 per 1000 | 62 per 1000 | |||||
| Moderate | ||||||
| 17 per 1000 | 39 per 1000 | |||||
| Adverse Events: Diarrhoea ‐ Bortezomib versus no bortezomib (same background therapy) | Study population | OR 6.24 | 1670 | ⨁⨁⨁◯ | ||
| 8 per 1000 | 50 per 1000 | |||||
| Moderate | ||||||
| 7 per 1000 | 41 per 1000 | |||||
| Adverse Events: Diarrhoea ‐ Bortezomib versus no bortezomib (different background therapy or other agents) | Study population | OR 1.80 | 2118 | ⨁⨁⨁◯ | ||
| 40 per 1000 | 71 per 1000 | |||||
| Moderate | ||||||
| 23 per 1000 | 40 per 1000 | |||||
| Adverse Events: Peripheral Neuropathy | Study population | OR 3.71 | 4636 | ⨁⨁⨁◯ | ||
| 44 per 1000 | 145 per 1000 | |||||
| Moderate | ||||||
| 80 per 1000 | 244 per 1000 | |||||
| Adverse Events: Peripheral Neuropathy ‐ Bortezomib versus no bortezomib (same background therapy) | Study population | OR 5.10 | 2040 | ⨁⨁◯◯ | ||
| 31 per 1000 | 139 per 1000 | |||||
| Moderate | ||||||
| 139 per 1000 | 453 per 1000 | |||||
| Adverse Events: Peripheral Neuropathy ‐ Bortezomib versus no bortezomib (different background therapy or other agents) | Study population | OR 3.09 | 2596 | ⨁⨁⨁⨁ | ||
| 54 per 1000 | 149 per 1000 | |||||
| Moderate | ||||||
| 21 per 1000 | 62 per 1000 | |||||
| Adverse Events: Infections (All) | Study population | OR 1.51 | 4266 | ⨁⨁⨁◯ | ||
| 128 per 1000 | 181 per 1000 | |||||
| Moderate | ||||||
| 254 per 1000 | 339 per 1000 | |||||
| Adverse Events: Infections (All) ‐ Bortezomib versus no bortezomib (same background therapy) | Study population | OR 1.37 | 1670 | ⨁⨁⨁⨁ | ||
| 77 per 1000 | 103 per 1000 | |||||
| Moderate | ||||||
| 57 per 1000 | 77 per 1000 | |||||
| Adverse Events: Infections (All) ‐ Bortezomib versus no bortezomib (different background therapy or other agents) | Study population | OR 1.55 | 2596 | ⨁⨁◯◯ | ||
| 160 per 1000 | 228 per 1000 | |||||
| Moderate | ||||||
| 209 per 1000 | 291 per 1000 | |||||
| Adverse Events: Cardiac Disorders | Study population | OR 1.74 | 2191 | ⨁⨁⨁⨁ | ||
| 38 per 1000 | 65 per 1000 | |||||
| Moderate | ||||||
| 30 per 1000 | 51 per 1000 | |||||
| Adverse Events: Cardiac Disorders ‐ Bortezomib versus no bortezomib (same background therapy) | Study population | OR 1.17 | 736 | ⨁⨁⨁◯ | ||
| 16 per 1000 | 19 per 1000 | |||||
| Moderate | ||||||
| 14 per 1000 | 17 per 1000 | |||||
| Adverse Events: Cardiac Disorders ‐ Bortezomib versus no bortezomib (different background therapy or other agents) | Study population | OR 1.84 | 1455 | ⨁⨁⨁⨁ | ||
| 49 per 1000 | 87 per 1000 | |||||
| Moderate | ||||||
| 49 per 1000 | 86 per 1000 | |||||
| *The risk in the intervention group (and its 95% confidence interval) is based on the assumed risk in the comparison group and the relative effect of the intervention (and its 95% CI). | ||||||
| GRADE Working Group grades of evidence | ||||||
| 1 Downgraded one level due to heterogeneity 55% 2 Downgraded one level because TTP was analysed instead of PFS in one trial. 3 Downgraded one level due to heterogeneity 56%. 4 Downgraded one level due to heterogeneity 70% . 5 Downgraded one level due to low number of events, wide CI. 6 Downgraded two levels due to very low number of events, very wide CI. 7 Downgraded one level due to heterogeneity 53%. 8 Downgraded one level due to heterogeneity 81%. 9 Downgraded one level due to heterogeneity 86%. 10 Downgraded one level due to heterogeneity 57%. 11 Downgraded one level due to heterogeneity 76%. | ||||||
| Outcome or subgroup title | No. of studies | No. of participants | Statistical method | Effect size |
| 1 Overall Survival Show forest plot | 9 | 4118 | Peto Odds Ratio (95% CI) | 0.77 [0.69, 0.86] |
| 1.1 Bortezomib versus no bortezomib (same background therapy) | 4 | 1586 | Peto Odds Ratio (95% CI) | 0.77 [0.65, 0.92] |
| 1.2 Bortezomib versus no bortezomib (different background therapy or other agents) | 5 | 2532 | Peto Odds Ratio (95% CI) | 0.76 [0.67, 0.88] |
| 2 Progression‐Free Survival Show forest plot | 9 | 4344 | Peto Odds Ratio (95% CI) | 0.67 [0.61, 0.72] |
| 2.1 Bortezomib versus no bortezomib (same background therapy) | 5 | 1855 | Peto Odds Ratio (95% CI) | 0.65 [0.57, 0.74] |
| 2.2 Bortezomib versus no bortezomib (different background therapy or other agents) | 4 | 2489 | Peto Odds Ratio (95% CI) | 0.67 [0.61, 0.75] |
| 3 Complete Response Rate Show forest plot | 12 | 4630 | Odds Ratio (M‐H, Fixed, 95% CI) | 2.35 [2.02, 2.73] |
| 3.1 Bortezomib versus no bortezomib (same background therapy) | 6 | 2064 | Odds Ratio (M‐H, Fixed, 95% CI) | 2.63 [2.13, 3.24] |
| 3.2 Bortezomib versus no bortezomib (different background therapy or other agents) | 6 | 2566 | Odds Ratio (M‐H, Fixed, 95% CI) | 2.08 [1.67, 2.58] |
| 4 Overall Response Rate Show forest plot | 12 | 4630 | Odds Ratio (M‐H, Fixed, 95% CI) | 2.62 [2.25, 3.05] |
| 4.1 Bortezomib versus no bortezomib (same background therapy) | 6 | 2064 | Odds Ratio (M‐H, Fixed, 95% CI) | 3.45 [2.72, 4.37] |
| 4.2 Bortezomib versus no bortezomib (different background therapy or other agents) | 6 | 2566 | Odds Ratio (M‐H, Fixed, 95% CI) | 2.17 [1.78, 2.64] |
| 5 Treatment‐related death Show forest plot | 5 | 2389 | Odds Ratio (M‐H, Fixed, 95% CI) | 0.76 [0.43, 1.34] |
| 5.1 Bortezomib versus no bortezomib (same background therapy) | 2 | 737 | Odds Ratio (M‐H, Fixed, 95% CI) | 0.81 [0.30, 2.16] |
| 5.2 Bortezomib versus no bortezomib (different background therapy or other agents) | 3 | 1652 | Odds Ratio (M‐H, Fixed, 95% CI) | 0.73 [0.36, 1.48] |
| 6 Adverse Events: Thrombocytopenia Show forest plot | 8 | 3791 | Odds Ratio (M‐H, Fixed, 95% CI) | 2.05 [1.70, 2.48] |
| 6.1 Bortezomib versus no bortezomib (same background therapy) | 3 | 1196 | Odds Ratio (M‐H, Fixed, 95% CI) | 1.51 [1.13, 2.00] |
| 6.2 Bortezomib versus no bortezomib (different background therapy or other agents) | 5 | 2595 | Odds Ratio (M‐H, Fixed, 95% CI) | 2.60 [2.01, 3.35] |
| 7 Adverse Events: Neutropenia Show forest plot | 8 | 3791 | Odds Ratio (M‐H, Fixed, 95% CI) | 1.33 [1.10, 1.60] |
| 7.1 Bortezomib versus no bortezomib (same background therapy) | 3 | 1196 | Odds Ratio (M‐H, Fixed, 95% CI) | 0.95 [0.73, 1.24] |
| 7.2 Bortezomib versus no bortezomib (different background therapy or other agents) | 5 | 2595 | Odds Ratio (M‐H, Fixed, 95% CI) | 1.85 [1.41, 2.41] |
| 8 Adverse Events: Anaemia Show forest plot | 6 | 3404 | Odds Ratio (M‐H, Fixed, 95% CI) | 0.80 [0.65, 1.00] |
| 8.1 Bortezomib versus no bortezomib (same background therapy) | 2 | 939 | Odds Ratio (M‐H, Fixed, 95% CI) | 0.67 [0.48, 0.94] |
| 8.2 Bortezomib versus no bortezomib (different background therapy or other agents) | 4 | 2465 | Odds Ratio (M‐H, Fixed, 95% CI) | 0.92 [0.69, 1.21] |
| 9 Adverse Events: Nausea/Vomiting Show forest plot | 8 | 3788 | Odds Ratio (M‐H, Fixed, 95% CI) | 2.37 [1.64, 3.42] |
| 9.1 Bortezomib versus no bortezomib (same background therapy) | 4 | 1670 | Odds Ratio (M‐H, Fixed, 95% CI) | 4.55 [1.99, 10.42] |
| 9.2 Bortezomib versus no bortezomib (different background therapy or other agents) | 4 | 2118 | Odds Ratio (M‐H, Fixed, 95% CI) | 1.93 [1.28, 2.93] |
| 10 Adverse Events: Diarrhoea Show forest plot | 8 | 3788 | Odds Ratio (M‐H, Fixed, 95% CI) | 2.44 [1.74, 3.43] |
| 10.1 Bortezomib versus no bortezomib (same background therapy) | 4 | 1670 | Odds Ratio (M‐H, Fixed, 95% CI) | 6.24 [2.79, 13.98] |
| 10.2 Bortezomib versus no bortezomib (different background therapy or other agents) | 4 | 2118 | Odds Ratio (M‐H, Fixed, 95% CI) | 1.80 [1.22, 2.65] |
| 11 Adverse Events: Constipation Show forest plot | 8 | 3788 | Odds Ratio (M‐H, Fixed, 95% CI) | 1.59 [1.14, 2.22] |
| 11.1 Bortezomib versus no bortezomib (same background therapy) | 4 | 1670 | Odds Ratio (M‐H, Fixed, 95% CI) | 1.88 [1.04, 3.41] |
| 11.2 Bortezomib versus no bortezomib (different background therapy or other agents) | 4 | 2118 | Odds Ratio (M‐H, Fixed, 95% CI) | 1.47 [0.98, 2.20] |
| 12 Adverse Events: Peripheral Neuropathy Show forest plot | 10 | 4636 | Odds Ratio (M‐H, Fixed, 95% CI) | 3.71 [2.92, 4.70] |
| 12.1 Bortezomib versus no bortezomib (same background therapy) | 5 | 2040 | Odds Ratio (M‐H, Fixed, 95% CI) | 5.10 [3.37, 7.72] |
| 12.2 Bortezomib versus no bortezomib (different background therapy or other agents) | 5 | 2596 | Odds Ratio (M‐H, Fixed, 95% CI) | 3.09 [2.30, 4.14] |
| 13 Adverse Events: Infections (All) Show forest plot | 9 | 4266 | Odds Ratio (M‐H, Fixed, 95% CI) | 1.51 [1.27, 1.79] |
| 13.1 Bortezomib versus no bortezomib (same background therapy) | 4 | 1670 | Odds Ratio (M‐H, Fixed, 95% CI) | 1.37 [0.97, 1.93] |
| 13.2 Bortezomib versus no bortezomib (different background therapy or other agents) | 5 | 2596 | Odds Ratio (M‐H, Fixed, 95% CI) | 1.55 [1.27, 1.90] |
| 14 Adverse Events: Herpes Zoster infection Show forest plot | 4 | 1733 | Odds Ratio (M‐H, Fixed, 95% CI) | 1.83 [0.91, 3.67] |
| 14.1 Bortezomib versus no bortezomib (same background therapy) | 2 | 939 | Odds Ratio (M‐H, Fixed, 95% CI) | 1.93 [0.74, 5.03] |
| 14.2 Bortezomib versus no bortezomib (different background therapy or other agents) | 2 | 794 | Odds Ratio (M‐H, Fixed, 95% CI) | 1.71 [0.62, 4.74] |
| 15 Adverse Events: Cardiac Disorders Show forest plot | 5 | 2191 | Odds Ratio (M‐H, Fixed, 95% CI) | 1.74 [1.17, 2.58] |
| 15.1 Bortezomib versus no bortezomib (same background therapy) | 2 | 736 | Odds Ratio (M‐H, Fixed, 95% CI) | 1.17 [0.39, 3.52] |
| 15.2 Bortezomib versus no bortezomib (different background therapy or other agents) | 3 | 1455 | Odds Ratio (M‐H, Fixed, 95% CI) | 1.84 [1.21, 2.81] |
| 16 Adverse Events: Fatigue Show forest plot | 5 | 2926 | Odds Ratio (M‐H, Fixed, 95% CI) | 1.96 [1.35, 2.84] |
| 16.1 Bortezomib versus no bortezomib (same background therapy) | 2 | 939 | Odds Ratio (M‐H, Fixed, 95% CI) | 3.30 [1.66, 6.58] |
| 16.2 Bortezomib versus no bortezomib (different background therapy or other agents) | 3 | 1987 | Odds Ratio (M‐H, Fixed, 95% CI) | 1.52 [0.97, 2.38] |
| Outcome or subgroup title | No. of studies | No. of participants | Statistical method | Effect size |
| 1 Overall Survival Show forest plot | 8 | 4075 | Peto Odds Ratio (95% CI) | 0.77 [0.70, 0.86] |
| 1.1 Relapsed / Refactory | 1 | 669 | Peto Odds Ratio (95% CI) | 0.77 [0.61, 0.97] |
| 1.2 Transplant Eligible | 5 | 2213 | Peto Odds Ratio (95% CI) | 0.86 [0.73, 1.02] |
| 1.3 Transplant Ineligible | 2 | 1193 | Peto Odds Ratio (95% CI) | 0.70 [0.59, 0.82] |
| 2 Progression Free Survival Show forest plot | 11 | 4344 | Peto Odds Ratio (95% CI) | 0.67 [0.61, 0.72] |
| 2.1 Relapsed / Refactory | 3 | 938 | Peto Odds Ratio (95% CI) | 0.57 [0.48, 0.68] |
| 2.2 Transplant Eligible | 6 | 2213 | Peto Odds Ratio (95% CI) | 0.76 [0.68, 0.85] |
| 2.3 Transplant Ineligible | 2 | 1193 | Peto Odds Ratio (95% CI) | 0.57 [0.49, 0.67] |
| 3 Complete Response Rate Show forest plot | 11 | 4593 | Odds Ratio (M‐H, Fixed, 95% CI) | 2.38 [2.05, 2.77] |
| 3.1 Relapsed / Refactory | 3 | 998 | Odds Ratio (M‐H, Fixed, 95% CI) | 3.35 [2.06, 5.43] |
| 3.2 Transplant Eligible | 6 | 2424 | Odds Ratio (M‐H, Fixed, 95% CI) | 1.88 [1.56, 2.27] |
| 3.3 Transplant Ineligibile | 2 | 1171 | Odds Ratio (M‐H, Fixed, 95% CI) | 3.69 [2.71, 5.02] |
| 4 Overall Response Rate Show forest plot | 11 | 4593 | Odds Ratio (M‐H, Fixed, 95% CI) | 2.61 [2.24, 3.05] |
| 4.1 Relapsed / Refactory | 3 | 998 | Odds Ratio (M‐H, Fixed, 95% CI) | 2.39 [1.79, 3.20] |
| 4.2 Transplant Eligible | 6 | 2424 | Odds Ratio (M‐H, Fixed, 95% CI) | 2.24 [1.76, 2.85] |
| 4.3 Transplant Ineligibile | 2 | 1171 | Odds Ratio (M‐H, Fixed, 95% CI) | 3.45 [2.63, 4.53] |
| Outcome or subgroup title | No. of studies | No. of participants | Statistical method | Effect size |
| 1 Overall Survival Show forest plot | 5 | Peto Odds Ratio (95% CI) | Subtotals only | |
| 1.1 Induction | 3 | 1783 | Peto Odds Ratio (95% CI) | 0.81 [0.67, 0.96] |
| 1.2 Consolidation | 2 | 844 | Peto Odds Ratio (95% CI) | 1.02 [0.71, 1.47] |
| 1.3 Maintenance | 2 | 1338 | Peto Odds Ratio (95% CI) | 0.76 [0.64, 0.91] |
| 2 Progression Free Survival Show forest plot | 5 | Peto Odds Ratio (95% CI) | Subtotals only | |
| 2.1 Induction | 3 | 1783 | Peto Odds Ratio (95% CI) | 0.75 [0.66, 0.85] |
| 2.2 Consolidation | 2 | 844 | Peto Odds Ratio (95% CI) | 0.70 [0.58, 0.84] |
| 2.3 Maintenance | 2 | 1338 | Peto Odds Ratio (95% CI) | 0.70 [0.61, 0.79] |
| 3 Complete Response Rate Show forest plot | 6 | Odds Ratio (M‐H, Fixed, 95% CI) | Subtotals only | |
| 3.1 Induction | 4 | 1999 | Odds Ratio (M‐H, Fixed, 95% CI) | 2.04 [1.65, 2.53] |
| 3.2 Consolidation | 2 | 839 | Odds Ratio (M‐H, Fixed, 95% CI) | 1.77 [1.34, 2.33] |
| 3.3 Maintenance | 2 | 1330 | Odds Ratio (M‐H, Fixed, 95% CI) | 1.82 [1.44, 2.31] |
| 4 Overall Response Rate Show forest plot | 6 | Odds Ratio (M‐H, Fixed, 95% CI) | Subtotals only | |
| 4.1 Induction | 4 | 1999 | Odds Ratio (M‐H, Fixed, 95% CI) | 2.33 [1.82, 2.99] |
| 4.2 Consolidation | 2 | 839 | Odds Ratio (M‐H, Fixed, 95% CI) | 2.21 [1.20, 4.06] |
| 4.3 Maintenance | 2 | 1330 | Odds Ratio (M‐H, Fixed, 95% CI) | 1.90 [1.38, 2.62] |