Intervenciones psicosociales grupales para mejorar el bienestar psicológico de adultos que conviven con el VIH
Información
- DOI:
- https://doi.org/10.1002/14651858.CD010806.pub2Copiar DOI

- Base de datos:
-
- Cochrane Database of Systematic Reviews
- Versión publicada:
-
- 14 marzo 2017see what's new
- Tipo:
-
- Intervention
- Etapa:
-
- Review
- Grupo Editorial Cochrane:
-
Grupo Cochrane de Enfermedades infecciosas
- Clasificada:
-
- Actualizada
All studies incorporated from most recent search
All eligible published studies found in the last search (14 Mar, 2016) were includedEvaluada: 2 April 2019
- Actualizada
- Copyright:
-
- Copyright © 2017 The Authors. Cochrane Database of Systematic Reviews published by John Wiley & Sons, Ltd. on behalf of The Cochrane Collaboration.
- This is an open access article under the terms of the Creative Commons Attribution‐Non‐Commercial Licence, which permits use, distribution and reproduction in any medium, provided the original work is properly cited and is not used for commercial purposes.
Cifras del artículo
Altmetric:
Citado por:
Autores
Contributions of authors
Ingrid van der Heijden worked on developing and testing a gender‐specific coping intervention for people living with HIV in South Africa which prompted the importance of doing a review on what works to improve the lives of people living with HIV. As first author, Ingrid van der Heijden was responsible for the overall leadership in this review and received Cochrane‐based training and support to lead the review. She was responsible for reviewing abstracts and full papers, and extracting and collating data for the review, assessing risk of bias, and interpreting findings, and putting the review together.
Professor Naeemah Abrahams works in HIV‐related stigma research and post‐rape and HIV and mental health services in South Africa and helped with reviewing abstracts and full papers, and extracting and collating data for the review, assessing risk of bias, and interpreting findings.
David Sinclair is a UK qualified general practitioner (GP), and has worked within primary healthcare in the UK, Kenya, and North and South Sudan. Over the past seven years he has worked as an author and editor with the CIDG, and served as a temporary advisor to the World Health Organization’s Technical Guidelines Development Groups on Malaria Treatment, nutritional care for people with TB and HIV, and screening for active tuberculosis. David's contribution to this review proved invaluable for statistical analysis, interpretation of results, and guidance for Cochrane‐style edits and outputs.
Sources of support
Internal sources
-
Gender and Health Unit, Medical Research Council, South Africa.
-
Liverpool School of Tropical Medicine, UK.
External sources
-
Department for International Development, UK.
Grant: 5242
Declarations of interest
All review authors have no present or past affiliations in any organization or entity with an interest in the review that might lead to real or perceived conflict of interest.
All review authors have not been involved in any trials included in the review or in authoring a systematic review included in the Background.
All review authors do not know of any financial or commercial sources that may have or be perceived to have an interest in the outcome of the review.
All review authors will report any secondary conflicts of interest that may concern, for example, the inclusion or exclusion of trials, assessment of validity of included trials, or interpretation of results to the editors of the CIDG and they and the review authors will jointly decide on the management of such conflicts whether the conflicts of interest warrant being disclosed in the review (Higgins 2008; Higgins 2011).
Acknowledgements
We are grateful to Anne‐Marie Stephani and Paul Garner of the Cochrane Infectious Diseases Group (CIDG), and Elizabeth Pienaar and Tamara Kredo of Cochrane South Africa for their valuable encouragement and help with this review.
David Sinclair is supported by the Effective Health Care Research Consortium. This Consortium and the editorial base of the Cochrane Infectious Diseases Group is funded by UK aid from the UK Government for the benefit of low‐ and middle‐income countries (Grant: 5242). The views expressed in this publication do not necessarily reflect UK government policy.
Version history
| Published | Title | Stage | Authors | Version |
| 2017 Mar 14 | Psychosocial group interventions to improve psychological well‐being in adults living with HIV | Review | Ingrid van der Heijden, Naeemah Abrahams, David Sinclair | |
| 2013 Nov 13 | Psychosocial group interventions for improving quality of life in adults living with HIV | Protocol | Ingrid van der Heijden, Naeemah Abrahams | |
Differences between protocol and review
We excluded behavioural outcomes.
We only included the outcomes for meta‐analysis if the trials measured them for at least three months post‐intervention.
We changed the overall outcome of effectiveness to 'psychological well‐being' instead of 'Quality of Life' (QOL) as QOL was too broad.
Keywords
MeSH
Medical Subject Headings (MeSH) Keywords
Medical Subject Headings Check Words
Adult; Female; Humans; Male;
PICO

Conceptual framework
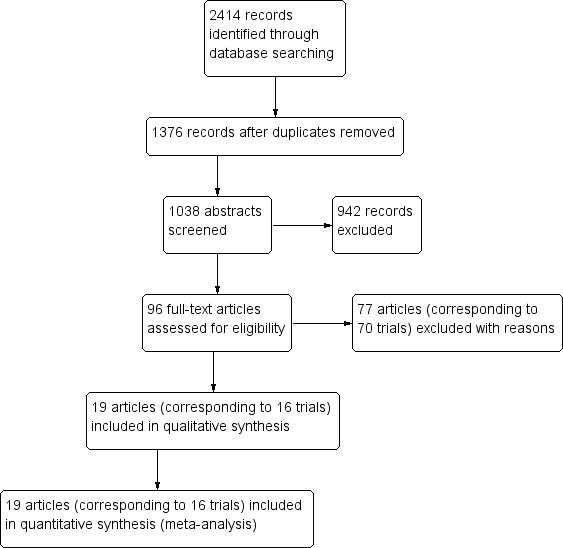
Study flow diagram
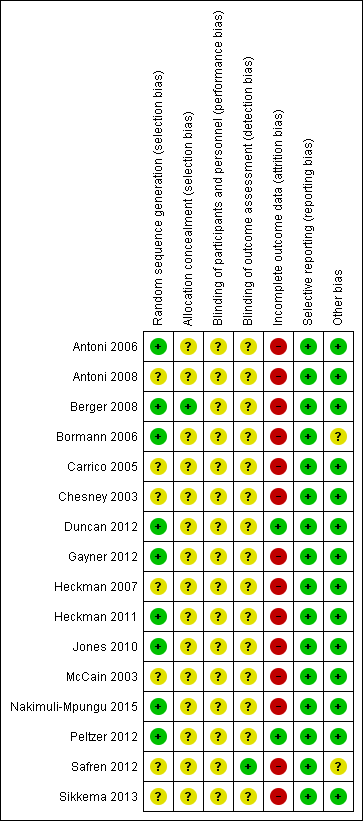
'Risk of bias' summary: review authors' judgements about each 'Risk of bias' item for each included trial

'Risk of bias' graph: review authors' judgements about each 'Risk of bias' item presented as percentages across all included trials

Comparison 1 Group therapy (CBT) versus control, Outcome 1 Depression scores.

Comparison 1 Group therapy (CBT) versus control, Outcome 2 Depression scores at longest follow‐up; subgrouped by depression score used.

Comparison 1 Group therapy (CBT) versus control, Outcome 3 Depression scores (trials with mean scores in the range of depression at baseline).

Comparison 1 Group therapy (CBT) versus control, Outcome 4 Depression scores at longest follow‐up; subgrouped by control.
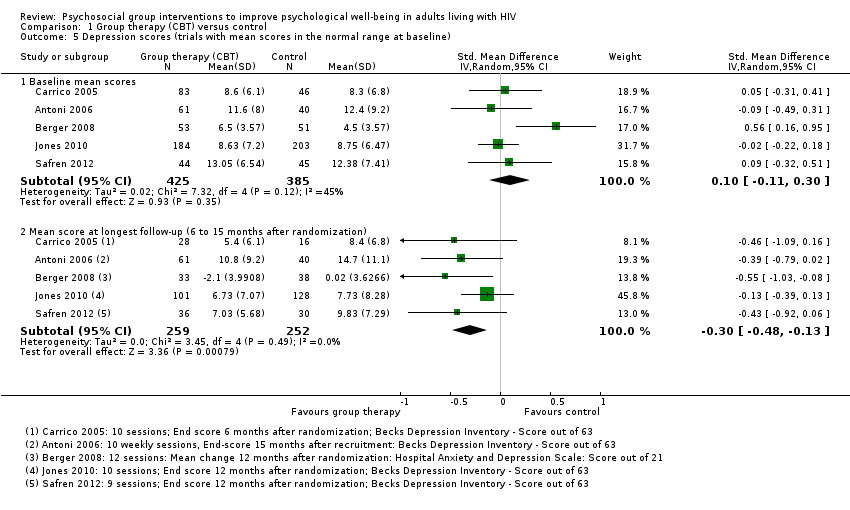
Comparison 1 Group therapy (CBT) versus control, Outcome 5 Depression scores (trials with mean scores in the normal range at baseline).

Comparison 1 Group therapy (CBT) versus control, Outcome 6 Depression scores at longest follow‐up; subgrouped by primary focus of intervention.
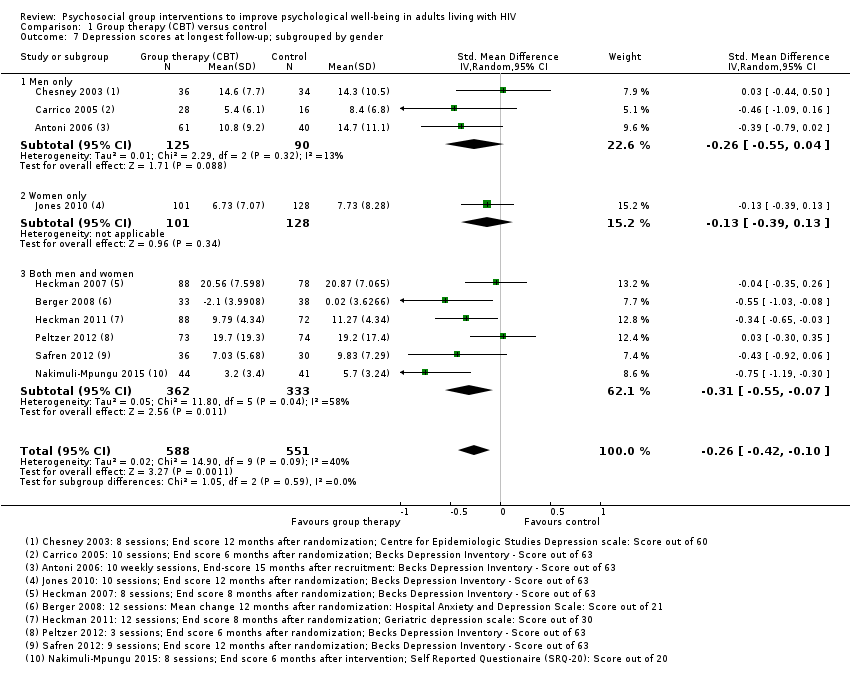
Comparison 1 Group therapy (CBT) versus control, Outcome 7 Depression scores at longest follow‐up; subgrouped by gender.

Comparison 1 Group therapy (CBT) versus control, Outcome 8 Anxiety scores.

Comparison 1 Group therapy (CBT) versus control, Outcome 9 Anxiety scores: at longest follow‐up; subgrouped by anxiety scale used.

Comparison 1 Group therapy (CBT) versus control, Outcome 10 Anxiety scores: at longest follow‐up; subgrouped by control.

Comparison 1 Group therapy (CBT) versus control, Outcome 11 Stress scores.

Comparison 1 Group therapy (CBT) versus control, Outcome 12 Stress scores at longest follow‐up; subgrouped by stress score used.

Comparison 1 Group therapy (CBT) versus control, Outcome 13 Stress scores at longest follow‐up; subgrouped by control.

Comparison 1 Group therapy (CBT) versus control, Outcome 14 Coping scores.

Comparison 1 Group therapy (CBT) versus control, Outcome 15 Coping scores at longest follow‐up; subgrouped by coping score used.

Comparison 1 Group therapy (CBT) versus control, Outcome 16 Coping scores at longest follow‐up; subgrouped by control.

Comparison 2 Group therapy (mindfulness) versus control, Outcome 1 Depression scores.

Comparison 2 Group therapy (mindfulness) versus control, Outcome 2 Anxiety scores.

Comparison 2 Group therapy (mindfulness) versus control, Outcome 3 Stress scores.
| Group therapy (cognitive behavioural therapy (CBT)) versus control for improving psychological well‐being in adults living with HIV | |||||
| Patient or population: adults living with HIV | |||||
| Outcomes | Illustrative comparative risks (95% CI)* | Number of participants (trials) | Certainty of the evidence (GRADE) | Comments | |
| Assumed risk | Corresponding risk | ||||
| Control | Group therapy (CBT) | ||||
| Depression score | The mean scores in the control groups at the end of follow‐up ranged from normal to moderately depressed | The mean score in the intervention groups was: | 1139 | ⊕⊕⊝⊝ due to indirectness and risk of bias | There may be a small benefit which lasts for up to 15 months |
| Anxiety score Follow‐up: 6 to 15 months | The mean scores in the control groups at the end of follow‐up ranged from normal to clinically anxious | The mean score in the intervention groups was: | 471 | ⊕⊕⊝⊝ due to indirectness and risk of bias | There may be little or no effect on mean anxiety scores |
| Stress score Follow‐up: 6 to 15 months | The mean score in the control groups at the end of follow‐up were variable | The mean score in the intervention groups was | 507 | ⊕⊕⊝⊝ due to indirectness and risk of bias | There may be little or no effect on mean stress scores |
| Coping score Follow‐up: 6 to 15 months | The mean score in the control groups at the end of follow‐up were variable | The mean score in the intervention groups was | 697 | ⊕⊕⊝⊝ due to indirectness and risk of bias | There may be little or no effect on mean coping scores |
| Studies used a variety of different scales to measure depression, anxiety and stress. Consequently, trials were pooled using a standardized mean difference. Examples of how large this effect would be on standardized measurement scales are given in the review main text and abstract. | |||||
| GRADE Working Group grades of evidence | |||||
| 1Downgraded by 1 for serious risk of bias: most of the trials did not adequately described a method of allocation concealment, and so trials are at unclear or high risk of selection bias. Loss of follow‐up was generally more than 20% and attrition bias may be present. | |||||
| Group therapy (mindfulness) compared to control for improving psychological well‐being in adults living with HIV | |||||
| Patient or population: adults living with HIV | |||||
| Outcomes | Illustrative comparative risks* (95% CI) | Number of participants | Certainty of the evidence | Comments | |
| Assumed risk | Corresponding risk | ||||
| Control | Group therapy (Mindfulness) | ||||
| Depression score Follow‐up: 4 to 6 months | The mean scores in the control groups at the end of follow‐up were in the range of normal to mild depression | The mean score in the intervention groups was | 233 | ⊕⊝⊝⊝ due to risk of bias, indirectness, and imprecision | We don't know if there is a benefit on depression scores |
| Anxiety score Follow‐up: 4 to 6 months | The mean scores in the control group at the end of follow‐up were in the range of normal to mild anxiety | The mean score in the intervention groups was | 162 | ⊕⊝⊝⊝ due to risk of bias, indirectness, and imprecision | We don't know if there is an effect on mean anxiety scores |
| Stress score Follow‐up: 4 to 6 months | The mean scores in the control group at the end of follow‐up were in the range of mild stress | The mean score in the intervention groups was | 137 | ⊕⊝⊝⊝ due to risk of bias, indirectness, and imprecision | We don't know if there is an effect on mean stress scores |
| Coping score Follow‐up: no coping was measured by mindfulness intervention trials | — | — | 0 (0 trials) | — | — |
| Studies used a variety of different scales to measure depression, anxiety and stress. Consequently, trials were pooled using a standardized mean difference. Examples of how large this effect would be on standardized measurement scales are given in the review main text and abstract. | |||||
| GRADE Working Group grades of evidence | |||||
| 1Downgraded by 1 for serious risk of bias: none of the trials adequately described a method of allocation concealment, and so trials are at unclear or high risk of selection bias. Loss of follow‐up was generally more than 20% and attrition bias may be present. | |||||
| Trial | Country | Age (years) | On antiretroviral therapy (ART) | General population or subgroup | Mood disorders | |
| Inclusion criteria | Exclusion criteria | |||||
| USA | 18 to 65 | Yes | Homosexual men | None stated | Current psychosis or panic disorder | |
| USA | 18 to 60 | Not stated | Women with evidence of CIN1 | None stated | Current major psychiatric illness | |
| Switzerland | 18 to 65 | Yes | General population | None stated | Current major psychiatric disorder | |
| USA | Not stated | No (recruited largely during the era prior to highly active antiretroviral therapy (HAART; 1992 to 1997) | Homosexual men | None stated | Current major psychiatric illness | |
| USA | > 18 | Not stated | Minority women | None stated | Untreated major psychiatric illness | |
| USA | > 18 | Yes | General population | None stated | Significant psychiatric illness | |
| USA | 18 to 65 | Yes | Prior intravenous drug users | Current depressive mood disorder | Untreated or unstable major mental illness | |
| USA | Not stated | Not stated | Rural population | No inclusion or exclusion criteria related to psychological functioning were employed | No inclusion or exclusion criteria related to psychological functioning were employed | |
| USA | > 50 | Not stated | Individuals over the age of 50 | BDI‐II score is minimum 10 | Exclude severe depression or cognitive impairment | |
| USA | Not stated | Not stated | History of child sexual abuse | Not stated | Not stated | |
| South Africa | > 18 | Yes | Individuals with ART adherence problem/new antiretroviral (ARV) medication users (6 to 24 months of ARV use) | Not stated | Not stated | |
| USA | 21 to 60 | No | Homosexual men | Reported depressed mood 10 or higher on CES‐D scale | Major depressive disorder or other psychotic disorders | |
| USA | 18 to 65 | Not stated | Adult men and women (50% homosexual) | Not stated | Cognitive impairment of active psychosis | |
| USA | Not specified | Yes | Adult men and women who reported | Reporting a level of side effect‐related bother for the previous 30 days at or above eight (corresponding to the 40th percentile in another sample) on the side effect and symptom distress scale | Severe cognitive impairment, | |
| Canada | Not specified | Not stated | Homosexual men | None stated | Active current major depression, substance abuse, or significant cognitive deficit | |
| Uganda | > 19 | Not stated | Both men and women | People with major depression on Mini Psychiatric Interview Scale | The trial excluded individuals with a severe medical disorder such as pneumonia or active tuberculosis, psychotic symptoms, and hearing or visual impairment. | |
| Abbreviations: ART: antiretroviral therapy; ARV: antiretroviral. | ||||||
| Scale | Number of items | Scale for each item1 | Total score | Interpretation | Description2 | Trials |
| Beck Depression Inventory | 21 | 0 (I do not) to 3 (I do and I can't stand it) | 0 to 63 | 0 to 13: minimal 14 to 19: mild 20 to 28: moderate 29 to 63: severe | Participants rate the intensity of depressive feelings over the preceding 1 or 2 weeks | Carrico 2005; Antoni 2006; Heckman 2007; Jones 2010; Duncan 2012; Peltzer 2012; Safren 2012 |
| Hospital Anxiety and Depression Scale (HADS) (Zigmond 1983) | 7 | 0 (not at all) to 3 (very often) | 0 to 21 | 0 to 7: normal 8 to 10: borderline 11 to 21: depression | Participants rate the frequency of depressive thoughts and behaviours over the preceding 4 weeks | |
| Geriatric Depression Scale (GDS) (Yesavage 1982) | 30 | 0 (no) to 1 (yes) | 0 to 30 | 0 to 9: normal 10 to 19: mild 20 to 30: severe | Participants report the presence or absence of depressive thoughts and behaviours | |
| The Centre for Epidemiological Studies‐Depression Scale (CES‐D) | 20 | 0 (not at all) to 3 (all of the time) | 0 to 60 | 0 to 15: normal 16 to 60: depression Cut off is 16 | Participants rate the frequency of depressive symptoms, feelings, and behaviours over the past week | |
| Self Reported Questionnaire (SRQ‐20) | 20 | 0 (no) to 1 (yes) | 0 to 20 | 0 to 5: normal 6 to 20: depression | Participants report the presence or absence of depressive symptoms, thoughts, and behaviours | |
| Profile of Mood States (POMS) Depression (D) | 15 | 0 (not at all) to 4 (extremely) | 0 to 60 | Higher scores indicate worsening depression | Participants rate adjectives describing their mood states over the past week | |
| Montgomery‐Asberg Depression Rating Scale (MADRS) (Montgomery 1979) | 10 | 0 (normal) to 6 (severe) | 0 to 60 | 0 to 6: normal 7 to 19: mild 20 to 34: moderate > 34: severe | A physician assessment based on a clinical interview covering depression symptoms | |
| 1The exact responses may vary between items. | ||||||
| Scale | Number of items (anxiety) | Score for each item1 | Total score (anxiety) | Interpretation | Description2 | Trials |
| Profile of Mood States | 9 | 0 (not at all) to 4 (extremely) | 0 to 36 | Higher scores indicate worsening anxiety | Participants rate adjectives describing their mood states over the past week | |
| Hospital Anxiety and Depression Scale (HADS) (Zigmond 1983) | 7 | 0 (not at all) to 3 (very often) | 0 to 21 | 0 to 7: normal 8 to 10: borderline 11 to 21: anxiety | Participants rate the frequency of anxiety feelings and behaviours over the preceding 4 weeks | |
| State Trait‐Anxiety Inventory | 20 | 1 (not at all) to 4 (very much so) | 20 to 80 | A cut point of 39 to 40 has been suggested to detect clinically significant symptoms | Participants rate the frequency and intensity of anxiety feelings at this moment (state), and more generally (trait) | |
| 1The exact responses may vary between items. | ||||||
| Scale | Number of items | Score for each item1 | Total score | Interpretation | Description2 | Trials |
| Perceived Stress Scale (PSS) (Cohen 1983) | 10 | 0 (never) to 4 (very often) | 0 to 40 | Higher scores indicate higher perceived stress | Participants rate the frequency of stress related thoughts and feelings in the preceding 4 weeks | |
| Dealing with Illness Scale ‐ Stress subscale (DIS) (McCain 1992) | Unclear | Unclear | Unclear | Higher scores reflect higher stress | Participants rate the desirability or undesirability and personal impact of experienced events | |
| HIV‐Related Life‐Stress Scale (Sikkema 2000) | 19 | 1 (not a problem) to 5 (most serious problem) | 1 to 5 | Higher scores indicate higher stress | Participants rate the severity of each HIV‐related potential stressor | |
| Life Experiences Survey (LES) (Sarason 1978) | 10 | 0 (not at all stressed) to 3 (extremely stressful) | 0 to 3 | 0 = not at all stressed 1 = mildly stressed 2 = moderately stressed 3 = extremely stressed | Participants rate the extent to which an event commonly experienced by HIV‐positive women had been stressful | Antoni 2008 (a 10‐item abbreviated version) |
| Impact of Event Scale (IES) | 15 | 0 (not at all) to 4 (often) | 0 to 75 | Higher scores indicate higher impact | Participants rate the frequency of intrusive or avoidant thoughts and experiences over the preceding 7 to 28 days (the authors describe this scale as measuring 'psychological distress' or 'traumatic stress') | |
| 1The exact responses may vary between items. | ||||||
| Trial | Group size | Session duration (mins) | Session frequency | Intervention | Comparison | |||||
| Underlying theory | Primary focus | Components | ||||||||
| Skills training | Relaxation techniques | Peer support2 | Education2 | |||||||
| 6 to 10 | 90 | Weekly for 8 weeks | Cognitive‐behavioural | Stress management | Cognitive restructuring coping skills | Progressive muscle relaxation (PMR)/meditation/yoga | Not described | Not described | No intervention ‐ waitlist group | |
| 4 to 9 | 135 | Weekly for 10 weeks | Cognitive‐behavioural | Stress management | Cognitive restructuring, coping skills, anger management, use of social network | PMR/meditation | Not described | Not described | No intervention ‐ waitlist group | |
| 4 to 9 | 135 | Weekly for 10 weeks | Cognitive‐behavioural | Stress management | Cognitive restructuring, coping skills | PMR/meditation | Not described | Medication adherence | 1 hour medication adherence training (MAT) | |
| 4 to 6 | 135 | Weekly for 10 weeks | Cognitive‐behavioural | Stress management | Cognitive restructuring, coping skills, assertiveness, anger management, use of social network | PMR/meditation | Not described | Not described | Condensed 1 day CBSM workshop | |
| 4 to 10 | 120 | Weekly for 12 weeks | Cognitive‐behavioural | Stress management | Cognitive strategies | PMR | Group dynamic exercises | HIV related topics | No intervention ‐ 30‐minute health check by physician | |
| 10 | 90 | Weekly for 15 weeks | Cognitive theory of stress and coping | Traumatic stress | Cognitive appraisal, coping skills | 'relaxation strategies' | Not described | Not described | Attention control ‐ HIV standard therapeutic support group | |
| 8 to 10 | 90 | Weekly for 10 weeks | Cognitive theory of stress and coping | Coping/stress | Appraising stressors, coping skills, stress management | 'relaxation guidance' | Skill building group exercises | Psychoeducation around models of coping | No intervention ‐ waitlist group | |
| 6 to 8 | 90 | Weekly for 8 weeks | Transactional model of stress and coping | Coping | Appraising stressors, coping skills, use of personal and social resources | No | Not described | Not described | No intervention ‐ usual care | |
| 6 to 810 | 90 | Weekly for 12 weeks | Transactional model of stress and coping | Coping | Appraising stressors, coping skills, use of personal and social resources | No | Not described | Not described | No intervention ‐ individual therapy upon request (ITUR) | |
| Not stated | 120 | Weekly for 10 weeks | Cognitive‐behavioural | Self‐efficacy | Cognitive restructuring, stress management, coping skills, anger management, use of social network | 'relaxation' | Expressive supportive therapy | HIV/mental health topics | Attention control group | |
| 10 to 12 | 120 to 180 | Weekly for 8 weeks | Cognitive‐behavioural, social learning theory, and the sustainable livelihoods framework | Depression | Coping skills, problem solving skills, dealing with stigma, income‐generation | Not described | Group rituals | Triggers, symptoms, and treatment of depression. | Active control group | |
| Not stated | 50 mins | Weekly for 9 weeks | Cognitive‐behavioural | Adherence/ depression | Cognitive restructuring, problem solving, activity scheduling | PMR/diaphragmatic breathing | Not described | Adherence, depression | Enhanced treatment as usual (ETAU) | |
| 10 | 60 mins | Monthly for 3 months | Cognitive‐behavioural | Adherence | Not specifically described | Not described | Buddy system to increase social support | Knowledge of HIV and HIV‐related medication | No intervention ‐ standard care | |
| Abbreviations: HIV: human immunodeficiency virus; PMR: progressive muscle relaxation. | ||||||||||
| Scale | Number of items | Score for each item1 | Total score | Interpretation | Description2 | Trials |
| Coping Self‐Efficacy Scale (CSES) (Chesney 2006) | 26 | 0 (cannot do at all) to 10 (certain can do) | 0 to 260 | Higher scores indicate better coping skills | Participants rate the extent to which they believe they could perform behaviours important to adaptive coping | |
| Cognitive Behavioral Self Efficacy (CB‐SE) (Ironson 1987) | 7 | 0 (not at all) to 4 (all of the time) | 0 to 28 | Higher scores indicate higher self‐efficacy | Participants rate their certainty that they could perform certain skills related to AIDS, and antiretroviral medication adherence | |
| Dealing with Illness Scale ‐ coping subscale (DIS) (McCain 1992) | 40 | 0 (never used) to 3 (regularly used) | 0 to 120 | Higher scores reflect more frequent use of the various coping strategies. | The DIS is a 40‐item coping subscale modelled on the Revised Ways of Coping Checklist. Participants rate the frequency that thoughts or behaviours have been used to deal with problems and stresses over the past month. | |
| 'Avoidant Coping Scale' Created from 23 items taken from 'The ways of Coping Questionnaire' and 'the Coping with AIDS Scale' (Sikkema 2013) | 23 | 0 (not at all) to 3 (used a great deal) | 0 to 69 | Higher scores reflect more frequent use of coping strategies | Participants rate how often they have used avoidant strategies for coping | |
| 1The exact responses may vary between items. | ||||||
| Trial | Group size | Session duration (mins) | Session frequency | Intervention | Comparison | |||
| Primary focus | Secondary components | |||||||
| Relaxation techniques | Peer support | Education | ||||||
| Not stated | 150 to 180 | Weekly for 8 weeks plus 1 day retreat | Mindfulness‐stress reduction | Mindfulness meditation | Not described | Stress physiology and reactivity | No intervention ‐ waitlist group | |
| 14 to 18 | 180 | Weekly for 8 weeks plus 1 day retreat | Mindfulness‐stress reduction | Mindfulness meditation | Not described | Not described | No intervention ‐ treatment as usual (TAU) group offered at end of intervention | |
| 8 to 15 | 90 | Weekly for 5 weeks, then 4 automated phone calls, then a final session in week 10 | Mindfulness‐stress reduction | Mantram repetition | Not described | Not described | Attention control | |
| Outcome or subgroup title | No. of studies | No. of participants | Statistical method | Effect size |
| 1 Depression scores Show forest plot | 10 | Std. Mean Difference (IV, Random, 95% CI) | Subtotals only | |
| 1.1 Baseline mean scores | 10 | 1600 | Std. Mean Difference (IV, Random, 95% CI) | 0.05 [‐0.05, 0.15] |
| 1.2 Mean score at end of group sessions (10 to 12 weeks after randomization) | 9 | 1142 | Std. Mean Difference (IV, Random, 95% CI) | ‐0.17 [‐0.29, ‐0.05] |
| 1.3 Mean score at longest follow‐up (6 to 15 months after randomization) | 10 | 1139 | Std. Mean Difference (IV, Random, 95% CI) | ‐0.26 [‐0.42, ‐0.10] |
| 2 Depression scores at longest follow‐up; subgrouped by depression score used Show forest plot | 10 | Mean Difference (IV, Random, 95% CI) | Subtotals only | |
| 2.1 Beck depression inventory (score out of 63) | 6 | 753 | Mean Difference (IV, Random, 95% CI) | ‐1.41 [‐2.61, ‐0.21] |
| 2.2 Hospital Anxiety and Depression score (score out of 21) | 1 | 71 | Mean Difference (IV, Random, 95% CI) | ‐2.12 [‐3.90, ‐0.34] |
| 2.3 Geriatric depression score (score out of 30) | 1 | 160 | Mean Difference (IV, Random, 95% CI) | ‐1.48 [‐2.83, ‐0.13] |
| 2.4 Centre for Epidemiological Studies (score out of 60) | 1 | 70 | Mean Difference (IV, Random, 95% CI) | 0.30 [‐4.03, 4.63] |
| 2.5 Self‐reported questionnaire (score out of 20) | 1 | 85 | Mean Difference (IV, Random, 95% CI) | ‐2.5 [‐3.91, ‐1.09] |
| 2.6 Profile of mood states (depression) (score out of 60) | 1 | 101 | Mean Difference (IV, Random, 95% CI) | ‐4.30 [‐10.47, 1.87] |
| 2.7 Montgomery‐Asberg Depression Rating Scale (score out of 60) | 1 | 66 | Mean Difference (IV, Random, 95% CI) | ‐4.72 [‐9.67, 0.23] |
| 3 Depression scores (trials with mean scores in the range of depression at baseline) Show forest plot | 5 | Std. Mean Difference (IV, Random, 95% CI) | Subtotals only | |
| 3.1 Baseline mean scores | 5 | 790 | Std. Mean Difference (IV, Random, 95% CI) | 0.04 [‐0.10, 0.18] |
| 3.2 Mean score at longest follow‐up | 5 | 628 | Std. Mean Difference (IV, Random, 95% CI) | ‐0.20 [‐0.46, 0.06] |
| 4 Depression scores at longest follow‐up; subgrouped by control Show forest plot | 10 | Std. Mean Difference (IV, Random, 95% CI) | Subtotals only | |
| 4.1 Standard care ± a minimal intervention (< 1 day) | 6 | 595 | Std. Mean Difference (IV, Random, 95% CI) | ‐0.24 [‐0.45, ‐0.04] |
| 4.2 Alternative group sessions | 3 | 300 | Std. Mean Difference (IV, Random, 95% CI) | ‐0.25 [‐0.71, 0.22] |
| 4.3 Individual therapy | 2 | 389 | Std. Mean Difference (IV, Random, 95% CI) | ‐0.22 [‐0.42, ‐0.01] |
| 5 Depression scores (trials with mean scores in the normal range at baseline) Show forest plot | 5 | Std. Mean Difference (IV, Random, 95% CI) | Subtotals only | |
| 5.1 Baseline mean scores | 5 | 810 | Std. Mean Difference (IV, Random, 95% CI) | 0.10 [‐0.11, 0.30] |
| 5.2 Mean score at longest follow‐up (6 to 15 months after randomization) | 5 | 511 | Std. Mean Difference (IV, Random, 95% CI) | ‐0.30 [‐0.48, ‐0.13] |
| 6 Depression scores at longest follow‐up; subgrouped by primary focus of intervention Show forest plot | 10 | Std. Mean Difference (IV, Random, 95% CI) | Subtotals only | |
| 6.1 Stress management | 3 | 216 | Std. Mean Difference (IV, Random, 95% CI) | ‐0.46 [‐0.73, ‐0.18] |
| 6.2 Coping | 3 | 396 | Std. Mean Difference (IV, Random, 95% CI) | ‐0.14 [‐0.37, 0.08] |
| 6.3 Self‐efficacy | 1 | 229 | Std. Mean Difference (IV, Random, 95% CI) | ‐0.13 [‐0.39, 0.13] |
| 6.4 Depression | 1 | 85 | Std. Mean Difference (IV, Random, 95% CI) | ‐0.75 [‐1.19, ‐0.30] |
| 6.5 Adherence and depression | 1 | 66 | Std. Mean Difference (IV, Random, 95% CI) | ‐0.43 [‐0.92, 0.06] |
| 6.6 Adherence | 1 | 147 | Std. Mean Difference (IV, Random, 95% CI) | 0.03 [‐0.30, 0.35] |
| 7 Depression scores at longest follow‐up; subgrouped by gender Show forest plot | 10 | 1139 | Std. Mean Difference (IV, Random, 95% CI) | ‐0.26 [‐0.42, ‐0.10] |
| 7.1 Men only | 3 | 215 | Std. Mean Difference (IV, Random, 95% CI) | ‐0.26 [‐0.55, 0.04] |
| 7.2 Women only | 1 | 229 | Std. Mean Difference (IV, Random, 95% CI) | ‐0.13 [‐0.39, 0.13] |
| 7.3 Both men and women | 6 | 695 | Std. Mean Difference (IV, Random, 95% CI) | ‐0.31 [‐0.55, ‐0.07] |
| 8 Anxiety scores Show forest plot | 4 | Std. Mean Difference (IV, Random, 95% CI) | Subtotals only | |
| 8.1 Baseline mean scores | 4 | 697 | Std. Mean Difference (IV, Random, 95% CI) | 0.11 [‐0.05, 0.27] |
| 8.2 Mean score at end of group sessions (10 to 12 weeks after randomization) | 3 | 420 | Std. Mean Difference (IV, Random, 95% CI) | ‐0.01 [‐0.25, 0.22] |
| 8.3 Mean score at longest follow‐up (12 to 15 months after randomization) | 4 | 471 | Std. Mean Difference (IV, Random, 95% CI) | ‐0.12 [‐0.31, 0.06] |
| 9 Anxiety scores: at longest follow‐up; subgrouped by anxiety scale used Show forest plot | 4 | Mean Difference (IV, Random, 95% CI) | Subtotals only | |
| 9.1 State trait anxiety inventory (score between 20 and 80) | 1 | 70 | Mean Difference (IV, Random, 95% CI) | ‐0.80 [‐6.06, 4.46] |
| 9.2 Modified State Trait Anxiety Inventory (score between 10 and 40) | 1 | 229 | Mean Difference (IV, Random, 95% CI) | ‐0.61 [‐2.09, 0.87] |
| 9.3 Hospital Anxety and Depression Scale (score out of 21) | 1 | 71 | Mean Difference (IV, Random, 95% CI) | ‐2.4 [‐4.92, 0.12] |
| 9.4 Profile of Mood States (score out of 36) | 1 | 101 | Mean Difference (IV, Random, 95% CI) | 0.20 [‐2.64, 3.04] |
| 10 Anxiety scores: at longest follow‐up; subgrouped by control Show forest plot | 4 | Mean Difference (IV, Random, 95% CI) | Subtotals only | |
| 10.1 Standard care ± a minimal intervention (< 1 day) | 2 | 172 | Mean Difference (IV, Random, 95% CI) | ‐1.18 [‐3.73, 1.36] |
| 10.2 Alternative group therapy | 1 | 70 | Mean Difference (IV, Random, 95% CI) | ‐0.80 [‐6.06, 4.46] |
| 10.3 Individual therapy | 1 | 229 | Mean Difference (IV, Random, 95% CI) | ‐0.61 [‐2.09, 0.87] |
| 11 Stress scores Show forest plot | 5 | Std. Mean Difference (IV, Random, 95% CI) | Subtotals only | |
| 11.1 Baseline mean scores | 5 | 695 | Std. Mean Difference (IV, Random, 95% CI) | 0.12 [‐0.03, 0.27] |
| 11.2 Mean score at end of group sessions | 4 | 533 | Std. Mean Difference (IV, Random, 95% CI) | ‐0.06 [‐0.23, 0.12] |
| 11.3 Mean score at longest follow‐up | 5 | 507 | Std. Mean Difference (IV, Random, 95% CI) | ‐0.04 [‐0.23, 0.15] |
| 12 Stress scores at longest follow‐up; subgrouped by stress score used Show forest plot | 5 | Mean Difference (IV, Random, 95% CI) | Subtotals only | |
| 12.1 Perceived stress score (score out of 40) | 1 | 70 | Mean Difference (IV, Random, 95% CI) | ‐0.70 [‐3.77, 2.37] |
| 12.2 Dealing with illness scale | 1 | 69 | Mean Difference (IV, Random, 95% CI) | ‐1.80 [‐7.62, 4.02] |
| 12.3 HIV‐related life‐stressor burden score (score out of 5) | 1 | 166 | Mean Difference (IV, Random, 95% CI) | 0.08 [‐0.06, 0.22] |
| 12.4 Life experiences survey (score out of 3) | 1 | 39 | Mean Difference (IV, Random, 95% CI) | ‐1.36 [‐3.00, 0.28] |
| 12.5 Impact of event scale (score out of 75) | 2 | 232 | Mean Difference (IV, Random, 95% CI) | ‐1.33 [‐3.60, 0.95] |
| 13 Stress scores at longest follow‐up; subgrouped by control Show forest plot | 5 | Mean Difference (IV, Random, 95% CI) | Subtotals only | |
| 13.1 Standard care ± a minimal intervention (< 1 day) | 3 | 274 | Mean Difference (IV, Random, 95% CI) | ‐0.37 [‐1.46, 0.71] |
| 13.2 Alternative group therapy | 4 | 454 | Mean Difference (IV, Random, 95% CI) | 0.09 [‐0.05, 0.22] |
| 13.3 Individual therapy | 0 | 0 | Mean Difference (IV, Random, 95% CI) | 0.0 [0.0, 0.0] |
| 14 Coping scores Show forest plot | 5 | Std. Mean Difference (IV, Random, 95% CI) | Subtotals only | |
| 14.1 Baseline mean scores | 5 | 1022 | Std. Mean Difference (IV, Random, 95% CI) | 0.01 [‐0.11, 0.14] |
| 14.2 Mean score at end of group sessions | 5 | 762 | Std. Mean Difference (IV, Random, 95% CI) | 0.02 [‐0.16, 0.19] |
| 14.3 Mean score at longest follow‐up (6 months after randomization) | 5 | 697 | Std. Mean Difference (IV, Random, 95% CI) | 0.04 [‐0.11, 0.19] |
| 15 Coping scores at longest follow‐up; subgrouped by coping score used Show forest plot | 5 | Mean Difference (IV, Random, 95% CI) | Subtotals only | |
| 15.1 Dealing with illness: coping subscale (score out of 120) | 1 | 69 | Mean Difference (IV, Random, 95% CI) | 1.90 [‐1.79, 5.59] |
| 15.2 Cognitive behavioural self‐efficacy scale (score out of 28) | 1 | 229 | Mean Difference (IV, Random, 95% CI) | ‐0.16 [‐1.29, 0.97] |
| 15.3 Coping self‐efficacy scale (score out of 260) | 2 | 236 | Mean Difference (IV, Random, 95% CI) | 1.76 [‐6.53, 10.05] |
| 15.4 Avoidant coping scale (score out of 69) | 1 | 163 | Mean Difference (IV, Random, 95% CI) | ‐1.70 [‐5.26, 1.86] |
| 16 Coping scores at longest follow‐up; subgrouped by control Show forest plot | 5 | Mean Difference (IV, Random, 95% CI) | Subtotals only | |
| 16.1 Standard care ± a minimal intervention (< 1 day) | 2 | 235 | Mean Difference (IV, Random, 95% CI) | 0.19 [‐0.21, 0.59] |
| 16.2 Alternative group therapy | 4 | 454 | Mean Difference (IV, Random, 95% CI) | ‐0.25 [‐0.67, 0.17] |
| 16.3 Individual therapy | 1 | 229 | Mean Difference (IV, Random, 95% CI) | ‐0.16 [‐1.29, 0.97] |
| Outcome or subgroup title | No. of studies | No. of participants | Statistical method | Effect size |
| 1 Depression scores Show forest plot | 3 | Std. Mean Difference (IV, Random, 95% CI) | Subtotals only | |
| 1.1 Baseline mean scores | 3 | 286 | Std. Mean Difference (IV, Random, 95% CI) | ‐0.11 [‐0.35, 0.12] |
| 1.2 Mean scores at end of group sessions (8 weeks after randomization) | 3 | 242 | Std. Mean Difference (IV, Random, 95% CI) | ‐0.22 [‐0.48, 0.04] |
| 1.3 Mean score at longest follow‐up | 3 | 233 | Std. Mean Difference (IV, Random, 95% CI) | ‐0.23 [‐0.49, 0.03] |
| 2 Anxiety scores Show forest plot | 2 | Std. Mean Difference (IV, Random, 95% CI) | Subtotals only | |
| 2.1 Baseline mean scores | 2 | 210 | Std. Mean Difference (IV, Random, 95% CI) | ‐0.01 [‐0.29, 0.27] |
| 2.2 Mean scores at end of group sessions (8 weeks after randomization) | 2 | 178 | Std. Mean Difference (IV, Random, 95% CI) | ‐0.23 [‐0.53, 0.07] |
| 2.3 Mean score at longest follow‐up | 2 | 162 | Std. Mean Difference (IV, Random, 95% CI) | ‐0.16 [‐0.47, 0.15] |
| 3 Stress scores Show forest plot | 2 | Mean Difference (IV, Random, 95% CI) | Subtotals only | |
| 3.1 Baseline mean scores | 2 | 169 | Mean Difference (IV, Random, 95% CI) | ‐1.02 [‐3.50, 1.46] |
| 3.2 Mean scores at end of treatment | 2 | 139 | Mean Difference (IV, Random, 95% CI) | ‐2.29 [‐4.46, ‐0.11] |
| 3.3 Mean score at longest follow‐up | 2 | 137 | Mean Difference (IV, Random, 95% CI) | ‐2.02 [‐4.23, 0.19] |