Exercise for cancer cachexia in adults
Abstract
Background
Cancer cachexia is a multifactorial syndrome characterised by an ongoing loss of skeletal muscle mass, with or without a loss of fat mass, leading to progressive functional impairment. Physical exercise may attenuate cancer cachexia and its impact on patient function. This is the first update of an original Cochrane Review published in Issue 11, 2014, which found no studies to include.
Objectives
To determine the effectiveness, acceptability and safety of exercise, compared with usual care, no treatment or active control, for cancer cachexia in adults.
Search methods
We searched CENTRAL, MEDLINE, Embase, and eight other databases to March 2020. We searched for ongoing studies in trial registries, checked reference lists and contacted experts to seek relevant studies.
Selection criteria
We sought randomised controlled trials in adults with cancer cachexia, that compared a programme of exercise alone or in combination with another intervention, with usual care, no treatment or an active control group.
Data collection and analysis
Two review authors independently assessed titles and abstracts for relevance and extracted data on study design, participants, interventions and outcomes from potentially relevant articles. We used standard methodological procedures expected by Cochrane. Our primary outcome was lean body mass and secondary outcomes were adherence to exercise programme, adverse events, muscle strength and endurance, exercise capacity, fatigue and health‐related quality of life. We assessed the certainty of evidence using GRADE and included two Summary of findings tables.
Main results
We included four new studies in this update which overall randomised 178 adults with a mean age of 58 (standard deviation (SD) 8.2) years. Study sample size ranged from 20 to 60 participants and in three studies the proportion of men ranged from 52% to 82% (the fourth study was only available in abstract form). Three studies were from Europe: one in the UK and Norway; one in Belgium and one in Germany. The remaining study was in Canada. The types of primary cancer were head and neck (two studies), lung and pancreas (one study), and mixed (one study).
We found two comparisons: exercise alone (strength‐based exercise) compared to usual care (one study; 20 participants); and exercise (strength‐based exercise/endurance exercise) as a component of a multimodal intervention (pharmacological, nutritional or educational (or a combination) interventions) compared with usual care (three studies, 158 participants). Studies had unclear and high risk of bias for most domains.
Exercise plus usual care compared with usual care
We found one study (20 participants). There was no clear evidence of a difference for lean body mass (8 weeks: MD 6.40 kg, 95% CI –2.30 to 15.10; very low‐certainty evidence).
For our secondary outcomes, all participants adhered to the exercise programme and no participant reported any adverse event during the study. There were no data for muscle strength and endurance, or maximal and submaximal exercise capacity. There was no clear evidence of a difference for either fatigue (4 to 20 scale, lower score was better) (8 weeks: MD –0.10, 95% CI –4.00 to 3.80; very low‐certainty evidence) or health‐related quality of life (0 to 104 scale, higher score was better) (8 weeks: MD 4.90, 95% CI –15.10 to 24.90; very low‐certainty evidence).
Multimodal intervention (exercise plus other interventions) plus usual care compared with usual care
We found three studies but outcome data were only available for two studies. There was no clear evidence of a difference for lean body mass (6 weeks: MD 7.89 kg, 95% CI –9.57 to 25.35; 1 study, 44 participants; very low‐certainty evidence; 12 weeks: MD –2.00, 95% CI –8.00 to 4.00; one study, 60 participants; very low‐certainty evidence).
For our secondary outcomes, there were no data reported on adherence to the exercise programme, endurance, or maximal exercise capacity. In one study (44 participants) there was no clear evidence of a difference for adverse events (patient episode report) (6 weeks: risk ratio (RR) 1.18, 95% CI 0.67 to 2.07; very low‐certainty evidence). Another study assessed adverse events but reported no data and the third study did not assess this outcome. There was no clear evidence of a difference in muscle strength (6 weeks: MD 3.80 kg, 95% CI –2.87 to 10.47; 1 study, 44 participants; very low‐certainty evidence; 12 weeks MD –5.00 kg, 95% CI –14.00 to 4.00; 1 study, 60 participants; very low‐certainty evidence), submaximal exercise capacity (6 weeks: MD –16.10 m walked, 95% CI –76.53 to 44.33; 1 study, 44 participants; very low‐certainty evidence; 12 weeks: MD –62.60 m walked, 95% CI –145.87 to 20.67; 1 study, 60 participants; very low‐certainty evidence), fatigue (0 to 10 scale, lower score better) (6 weeks: MD 0.12, 95% CI –1.00 to 1.24; 1 study, 44 participants; very low‐certainty evidence) or health‐related quality of life (0 to 104 scale, higher score better) (12 weeks: MD –2.20, 95% CI –13.99 to 9.59; 1 study, 60 participants; very low‐certainty evidence).
Authors' conclusions
The previous review identified no studies. For this update, our conclusions have changed with the inclusion of four studies. However, we are uncertain of the effectiveness, acceptability and safety of exercise for adults with cancer cachexia. Further high‐quality randomised controlled trials are still required to test exercise alone or as part of a multimodal intervention to improve people's well‐being throughout all phases of cancer care. We assessed the certainty of the body of evidence as very low, downgraded due to serious study limitations, imprecision and indirectness. We have very little confidence in the results and the true effect is likely to be substantially different from these. The findings of at least three more studies (one awaiting classification and two ongoing) are expected in the next review update.
PICO
Plain language summary
What are the benefits and risks of exercise for adults with cancer who experience loss of appetite and weight loss?
Key message
We do not know if exercise is helpful or safe for people with cancer who experience loss of appetite and weight loss. This is because too few robust studies have tested exercise with this group of patients. We need researchers to conduct rigorous and better designed studies in this area in future to help patients and clinicians decide if exercise could be beneficial.
Why did we set out to review the literature?
Many people with cancer experience loss of appetite and weight loss (cancer cachexia), because of the cancer itself or its treatment. Cachexia is more common in some types of cancer, such as lung and pancreatic, and in advanced stages of cancer. It can compromise the ability to live independently and increase the need for care due to fatigue, muscle weakness and impaired quality of life.
There is currently no standard treatment for cachexia. One treatment option would be for patients to exercise and see if that helps to strengthen their muscles and stop or slow down their weight loss and muscle wasting.
We reviewed the evidence from clinical trials to find out if exercise, alone or in combination with other treatments (such as medicines, health education or information, and practical advice about nutrition) is beneficial for people with cancer cachexia. We wanted to know if exercise improved:
· lean body mass (total body weight minus body fat);
· muscle strength and muscle endurance (ability of the muscle to repeat an exercise over an extended time);
· exercise capacity (maximum amount of physical effort that someone can sustain);
· fatigue; and
· health‐related quality of life (ability to participate in family and social life as well as some degree of self‐care and the perception of self‐efficacy)
We also looked at whether:
· people did the amount of exercise they were prescribed and
· exercise was associated with any risks (unwanted effects).
How did we identify and evaluate the evidence?
We searched the medical literature for studies that evaluated the effects of exercise, alone or with other treatments, in people with cancer cachexia. We then compared and summarised the results. We rated our confidence in the evidence, based on factors such as study methods and sizes, and the consistency of findings across studies.
What did we find?
We found four studies that included 178 people (average age: 58 years; 52% to 82% of people in each study were men). The studies lasted for six weeks to three months. Two studies included people with head and neck cancer, one study included people with lung and pancreas cancer, and the fourth study included various cancer types.
The studies compared:
· exercise plus usual care against usual care alone (one study, 20 people);
· exercise combined with other treatments (medicines, health education or nutrition) plus usual care against usual care alone (three studies, 158 people).
The studies did not provide enough robust evidence to determine if exercise is associated with benefits or risks in people with cancer cachexia.
How‐up‐to date is this review?
The evidence in this Cochrane Review is current to March 2020.
Authors' conclusions
Summary of findings
| Exercise plus usual care compared to usual care for cancer cachexia in adults | ||||||
| Patient or population: cancer cachexia in adults Setting: cancer centres Intervention: exercise plus usual care Comparison: usual care | ||||||
| Outcomes | Anticipated absolute effects*(95% CI) | Relative effect | № of participants | Certainty of the evidence (GRADE) | Comments | |
|---|---|---|---|---|---|---|
| Risk with usual care | Risk with exercise plus usual care | |||||
| Lean body mass Assessed with: bioimpedance Follow‐up: 8 weeks | The mean lean body mass was 52.7 kg (95% CI 44.04 to 61.36) | MD 6.4 kg higher (2.3 lower to 15.1 higher) | — | 20 (1 study) | ⊕⊝⊝⊝ Very lowa,b,c | — |
| Adherence to prescribed exercise programmes Assessed with: counting of participants finishing the study Follow‐up: 8 weeks | Study population | RR 1.00 (0.83 to 1.20 | 20 | ⊕⊝⊝⊝ Very lowa,b,c | The outcome was not planned in the protocol or presented in methods, but it was reported descriptively in the results and conclusion. | |
| 1000 per 1000 | 1000 per 1000 (830 to 1000) | |||||
| Occurrence of adverse events Assessed with: patient's self‐report Follow‐up: 8 weeks | Study population | Not estimable | 20 | ⊕⊝⊝⊝ Very lowa,b,c | No adverse events were reported during or after the training. | |
| 0 per 1000 | 0 per 1000 (0 to 0) | |||||
| Muscle strength and endurance | No data | No data | — | — | — | Only baseline data for muscle strength. No evidence to support or refute. |
| Maximal and submaximal exercise capacity Functional capacity assessed with: 6MWT | No data | No data | — | — | — | Only baseline data. No evidence to support or refute. |
| Fatigue Assessed with: MFI questionnaire (scale 4–20; lower score better) Follow‐up: 8 weeks | The mean fatigue score was 11.90 (95% CI 8.61 to 15.19) | MD 0.1 lower | — | 20 | ⊕⊝⊝⊝ Very lowa,b,c | — |
| Health‐related quality of life Assessed with: FAACT (scale 0–104; higher score better) Follow‐up: 8 weeks | The mean health‐related quality of life score was 59.50 (95% CI 8.61 to 15.19) | MD 4.9 higher | — | 20 | ⊕⊝⊝⊝ Very lowa,b,c | — |
| *The basis for the assumed risk (e.g. the median control group risk across studies) is provided in footnotes. The corresponding risk (and its 95% confidence interval) is based on the assumed risk in the comparison group and the relative effect of the intervention (and its 95% CI). 6MWT: six‐minute walk test; CI: confidence interval; FAACT: Functional Assessment of Anorexia/Cachexia Therapy; MD: mean difference; MFI: Multidimensional Fatigue Inventory; RR: risk ratio. | ||||||
| GRADE Working Group grades of evidence | ||||||
| aDowngraded one level for serious study limitations: high risk of bias: blinding of participants and personnel; blinding of outcome assessment; other bias. | ||||||
| Multimodal intervention (exercise plus other interventions) plus usual care compared to usual care | ||||||
| Patient or population: cancer cachexia in adults | ||||||
| Outcomes | Anticipated absolute effects* (95% CI) | Relative effect | № of participants | Certainty of the evidence | Comments | |
|---|---|---|---|---|---|---|
| Risk with usual care | Risk with multimodal intervention plus usual care | |||||
| Lean body mass Assessed with: muscle surface area (cm2) and DEXA (kg) Follow‐up: 6–12 weeks | The mean of lean body mass was 123.07 cm2 (95% CI 108.60 to 137.56) at 6 weeks | MD 7.89 cm2 higher | — | 44 | ⊕⊝⊝⊝ Very lowa,b,c | — |
| The mean lean body mass was 63.80 kg (95% CI 59.39 to 68.20) at 12 weeks | MD 2.00 kg lower | — | 60 | |||
| Adherence to prescribed exercise programmes | No data | No data | — | — | — | No evidence to support or refute. |
| Occurrence of adverse events Assessed with: self‐reported Follow‐up: 6 weeks | Study population | RR 1.18 | 44 | ⊕⊝⊝⊝ Very lowa,b,c | — | |
| 476 per 1000 | 562 per 1000 | |||||
| Muscle strength and endurance** Strength assessed with: hand‐held dynamometry (kg) Follow‐up: 6 to 12 weeks | The mean muscle strength was 31.5 kg (95% CI 25.85 to 37.14) at 6 weeks | MD 3.8 kg higher | — | 44 | ⊕⊝⊝⊝ Very lowa,b,c | — |
| The mean muscle strength was 90.0 kg (95% CI 83.48 to 96.51) at 12 weeks | MD 5 kg lower | — | 60 | — | — | |
| Maximal and submaximal exercise capacity** Submaximal capacity assessed with: 6MWT distance walked in meters Follow‐up: 6 to 12 weeks | The mean muscle endurance submaximal exercise capacity was 490.50 m (95% CI 444.47 to 536.52) at 6 weeks | MD 16.1 m lower | — | 44 | ⊕⊝⊝⊝ Very lowa,b,c | — |
| The mean muscle endurance submaximal exercise capacity was 690.80 m (95% CI 641.31 to 740.28) at 12 weeks | MD 62.6 m lower | — | 60 | |||
| Fatigue Assessed with: Fatigue Severity (scale: 0–10; lower score better) Follow‐up: 6 weeks | The mean fatigue score was 3.73 (95% CI 2.84 to 4.61) | MD 0.12 higher | — | 44 | ⊕⊝⊝⊝ Very lowa,b,c | — |
| Health‐related quality of life Assessed with: FAACT (scale: 0–136; higher score better) Follow‐up: 12 weeks | The mean health‐related quality of life score was –19.1 (95% CI –27.49 to –10.70) | MD 2.20 lower | — | 60 | ⊕⊝⊝⊝ Very lowa,b,c | — |
| *The risk in the intervention group (and its 95% confidence interval) is based on the assumed risk in the comparison group and the relative effect of the intervention (and its 95% CI). ** Endurance, and maximal exercise capacity, not measured/reported. 6MWT: six‐minute walk test; CI: confidence interval; DEXA: dual‐energy x‐ray absorptiometry; FAACT: Functional Assessment of Anorexia/Cachexia Therapy; kg: kilograms; m: meters; MD: mean difference; MFI: Multidimensional Fatigue Inventory; RCT: randomised controlled trial; RR: risk ratio. | ||||||
| GRADE Working Group grades of evidence | ||||||
| aDowngraded one level for serious study limitations: high risk of bias: blinding of participants and personnel (Solheim 2017); blinding of outcome assessment (Solheim 2017); incomplete outcome data (Capozzi 2016; Solheim 2017); selective reporting (Capozzi 2016; Solheim 2017); other bias (Capozzi 2016; Solheim 2017). | ||||||
Background
This systematic review is an update of Grande 2014. We conducted this systematic review following the protocol previously published in the Cochrane Database of Systematic Reviews (Grande 2013). For explanations of methodological terms, see the main glossary on the Cochrane website (community.cochrane.org/glossary).
Description of the condition
Cancer cachexia is defined as "a multi‐factorial syndrome characterized by an ongoing loss of skeletal muscle mass, with or without a loss of fat mass, that cannot be fully reversed by conventional nutritional support and leads to progressive functional impairment" (Fearon 2011). Prevalence varies with cancer type, but is highest in people with cancer arising from the upper gastrointestinal tract or lung, where over half of those people are affected by cachexia around the time of their cancer diagnosis (Fearon 2011; Laviano 2005). The pathophysiology of cancer cachexia is complex but is characterised by a negative energy balance and abnormal metabolism (Baracos 2018; Fearon 2012).
The combination of a persistent inflammatory response, tumour‐derived catabolic factors and a stress response leads to reduced food intake, increased resting energy expenditure and an overall loss of skeletal muscle mass, which is the result of reduced protein synthesis, increased protein breakdown and reduced insulin sensitivity (Evans 2008; Fearon 2011; Tisdale 2009). The loss of lean body mass contributes to a progressive decline in muscle performance (Stephens 2012; Weber 2009), functional exercise capacity (England 2012; Jones 2012), and physical activity level (Dodson 2011; Wilcock 2008), and is associated with increased risk of dose‐limiting chemotherapy toxicities (Prado 2007; Prado 2008; Prado 2009), accelerated functional decline (LeBlanc 2015), disability in activities of daily living (Naito 2017), and poor survival (Antoun 2013; Martin 2013).
Description of the intervention
There is no current usual intervention for cancer cachexia and some consider it refractory once established, for example, in people with progressive disease and a limited prognosis (Fearon 2011). As such, it is recommended that greater emphasis be placed on applying a proactive approach, early in the course of the disease, with the aim being to maintain or slow down the loss of function (Fearon 2011; Muscaritoli 2010). Due to the complex nature of cancer cachexia, multimodal intervention is also considered necessary as it is unlikely that any single intervention will increase food intake, attenuate the metabolic disturbances, and address the imbalance between muscle protein synthesis and breakdown (Fearon 2008). Three main component interventions are being developed alone or in combination (Solheim 2012): nutritional therapies to increase energy and protein intake (Dewey 2007); drug therapies to stimulate appetite and reduce inflammation (Lee 2011; Reid 2012; Ruiz Garcia 2013); and physical exercise.
Exercise is defined by the American College of Sports Medicine as a "planned, structured and repetitive bodily movement done to maintain or improve one or more components of physical fitness" (Thompson 2010). Different types of exercise may use everyday activities, such as walking, or specialist equipment, such as free‐weights, for the purposes of training. Exercise programmes vary widely according to the frequency, intensity, type and timing of training used, as well as contextual factors such as the programme setting and level of supervision (Thompson 2010).
How the intervention might work
Exercise may attenuate the effects of cancer cachexia via several mechanisms, including the modulation of muscle metabolism, insulin sensitivity and levels of inflammation (Maddocks 2012). Resistance exercise is a potent stimulator of muscle protein synthesis, particularly when performed in conjunction with the supplentation of amino acids (Glover 2010; Marimuthu 2011). Improved insulin action in peripheral tissues following exercise may inhibit muscle protein breakdown (Wang 2006). Exercise also triggers the formation of a cohort of cytokines from muscle fibres, including interleukin‐6, which increases insulin sensitivity and reduces the production of proinflammatory cytokines (Starkie 2003). Repeated exercise has an overall anti‐inflammatory effect, which has been observed in healthy populations (Gleeson 2011), and people with early‐stage cancer (Betof 2013). This effect would be beneficial in cancer cachexia as levels of systemic inflammation are associated with reduced weight, exercise capacity and survival (McMillan 2013; Moses 2009; Proctor 2011). Thus, by preventing or slowing down the loss of lean body mass, exercise may ultimately help people with or at risk of cancer cachexia maintain their independence for longer.
Why it is important to do this review
Despite a growing evidence base for nutritional and drug interventions for cancer cachexia, including Cochrane Reviews (Dewey 2007; Payne 2017; Reid 2012; Ruiz Garcia 2013), studies of exercise interventions in the field are few in number. Reviews examining the use of exercise in cancer cachexia are generally narrative (Gould 2013), opinion based (Argilés 2012; Maddocks 2011; Maddocks 2012), or based on animal models (Argilés 2012). Nonetheless, there are increasingly reports of published, ongoing and planned studies. Thus, there is a need to synthesise the evidence for the use of exercise for cancer cachexia and, if data permit, explore the optimal programme characteristics for this group.
Objectives
To determine the effectiveness, acceptability and safety of exercise, compared with usual care, no treatment or active control, for cancer cachexia in adults.
Methods
Criteria for considering studies for this review
Types of studies
Randomised controlled trials (RCTs) with a parallel, single‐stage or cross‐over design, including studies with a quasi‐randomised allocation in cases where allocation concealment was described.
Types of participants
Study participants were adults (aged 18 years or older) with a histological or clinical diagnosis of cancer, meeting international criteria for cancer cachexia of any stage (Fearon 2011), which included:
-
precachexia, defined as weight loss of 5% or less with anorexia and metabolic changes;
-
cachexia, defined as weight loss greater than 5% in the past six months or body mass index (BMI) less than 20 kg/m2 and ongoing weight loss greater than 2% or sarcopenia, anorexia or systemic inflammation; and
-
refractory cachexia, defined as active catabolism, ongoing weight loss, unresponsive to treatment and life expectancy of less than three months.
We contacted study authors to seek additional data where baseline demographic data were insufficient to assess participants against these criteria.
We considered studies that were relevant to the review objectives but which were not performed specifically to address cancer cachexia (e.g. studies in people with advanced cancer). As such, we included studies in which at least half of the study population fell within the cachexia definitions above. Participants could be studied in any hospital or community setting. We excluded studies relating to participants during or following treatment with curative intent, or with no evidence of current disease.
Types of interventions
Studies examining any programme of exercise offered as a sole intervention or in combination with another intervention were eligible. We considered programmes using aerobic/endurance training, resistance training or a combination of both. We expected programmes to vary in terms of session length (minutes) and frequency (sessions/week), intensity of training (low, moderate, high) and overall duration (weeks). There were no restrictions on these or other programme characteristics including the setting in which the programme was offered (hospital/centre/home) and level of supervision (none, minimal, close). Interventions could be compared to either usual care, no treatment or an active control group (e.g. a nutritional or drug intervention). We used the definition of exercise by the American College of Sports Medicine as a "planned, structured and repetitive bodily movement done to maintain or improve one or more components of physical fitness" (Thompson 2010).
Types of outcome measures
We considered only outcome measures from the primary studies that were validated and used count/rate of events.
Primary outcomes
-
Lean body mass, assessed at the first study time point following the end of an exercise programme.
Secondary outcomes
-
Adherence to prescribed exercise programme.
-
Occurrence of adverse events.
-
Muscle strength and endurance.
-
Maximal and submaximal exercise capacity.
-
Fatigue.
-
Health‐related quality of life.
Outcome measures
-
Lean body mass: any validated scale such as computed tomography, dual‐energy x‐ray absorptiometry scan or bioelectrical impedance.
-
Adherence to prescribed exercise programmes outcome measure: number of participants in each arm at different moments of studies measurements and observed dropout rates.
-
Occurrence of adverse events: participant self‐reported non‐occurrence.
-
Muscle strength and endurance: any validated scale such as dynamometer and sit and stand test.
-
Maximal and submaximal exercise capacity: any validated scale such as the six‐minute walk test (6MWT).
-
Fatigue: any validated scale such as the Fatigue Severity Scale and Multidimensional Fatigue Inventory (MFI).
-
Health‐related quality of life as measured by any validated scale such as Functional Assessment of Cancer Therapy (FACT).
Search methods for identification of studies
Electronic searches
We developed an electronic search strategy using a combination of terms based on the target population, intervention, comparator and outcomes. See Appendix 1 for the search strategies. We adapted these where necessary for the other databases listed below. We searched the following electronic databases from their start date until March 2020:
-
CENTRAL (the Cochrane Library) 2020, Issue 3;
-
MEDLINE (Ovid) 1946 to March 2020;
-
Embase (Ovid) 1974 to March 2020;
-
DARE (the Cochrane Library) 2015, Issue 2. It was not searched after 2015, since it is no longer updated/available;
-
HTA – Health Technology Assessments (the Cochrane Library) 2016, Issue 4;
-
ISI Web of Science (SCI‐Expanded and CPCI) 1900 to March 2020;
-
LILACS (Latin American and Caribbean Health Sciences) (BIREME) 1985 to March 2020;
-
PEDro (the Physiotherapy Evidence Database) 24 March 2020;
-
SciVerse SCOPUS 24 March 2020;
-
Biosis Previews PreMEDLINE 1969 to March 2020;
-
Open Grey (System for Information on Grey Literature) 24 March 2020.
Searching other resources
We identified ongoing studies using:
-
ClinicalTrials.gov (clinicaltrials.gov/);
-
International Clinical Trials Registry Platform (ICTRP) (www.who.int/ictrp/en/);
-
MetaRegister of Controlled Trials (mRCT) (www.controlled-trials.com/) updated to ISRCTN registry (www.isrctn.com/);
-
Pan African Clinical Trials (www.pactr.org); and
-
the EU Clinical Trials Register (www.clinicaltrialsregister.eu/).
We handsearched the following sources: the Society on Sarcopenia, Cachexia and Wasting Disorders (SCWD); the American Cancer Society; the British Association for Cancer Research (BACR) and the European Clinical Guidelines. We checked reference lists of relevant studies and reports citing all retrieved studies. In addition, we contacted corresponding authors of retrieved studies, experts and organisations in the field to seek potentially relevant research material, including unpublished and ongoing studies.
Data collection and analysis
Selection of studies
We used reference management software to merge results from different electronic databases and remove duplicate studies. Two review authors (AJG, VS) independently assessed titles and abstracts of articles for relevance (Higgins 2011). We obtained full‐text reports of potentially relevant studies for assessment against the inclusion criteria. We contacted the study authors by email to clarify the necessary information if missing information impaired the study selection. The two review authors discussed any disagreement in the selection of studies and resolved it by consensus. In cases of persistent disagreement, they consulted a third review author (MSP or MM). We applied no language restrictions in the selection of studies.
Data extraction and management
Two review authors (AJG and VS) independently extracted data from the included studies. We developed an online extraction form to store data relating to the study source and eligibility, methods and bias (study design, sequence generation, allocation sequence concealment, blinding), participants (number, age, sex, ethnicity, diagnosis, disease severity, setting) and intervention (exercise type and intensity, session length and frequency, and overall programme duration), adherence to the exercise programme (either self‐reported or objective) and the occurrence of any adverse events. We discussed and resolved any disagreements by consensus.
Outcome data collected at baseline immediately following a programme of exercise and at first follow‐up were:
-
lean body mass, generally assessed by anthropometry (e.g. skin fold thickness, or imaging, e.g. dual x‐ray absorptiometry and expressed as a weight (e.g. kilograms, kg), cross‐sectional area (square centimetres, cm2) or volume (cubic centimetres, cm3) normalised to height);
-
muscle strength, either isometric or isotonic, generally assessed using myometry and expressed as a measure of force (e.g. kilograms, kg, or Newton metres, Nm); muscle endurance, generally assessed as time or number of repetitions to a specified decline in muscle performance;
-
maximal and submaximal exercise capacity, generally assessed by a walking or cycling test and expressed as a measure of oxygen uptake (VO2) or performance (e.g. distance walked in metres, m);
-
fatigue, generally assessed on a numerical or categorical scale with a higher score representing more severe fatigue;
-
health‐related quality of life, generally assessed on a numerical or categorical scale with a higher score representing a better quality of life.
Assessment of risk of bias in included studies
Two review authors (AJG and VS) independently assessed risk of bias for each study using the criteria outlined in the Cochrane Handbook for Systematic Reviews of Interventions (Higgins 2017), with any disagreements resolved by discussion. We completed a 'Risk of bias' table and summary using the 'Risk of bias' tool in Review Manager 5 (Review Manager 2014).
We assessed the following for each study.
-
Random sequence generation (checking for possible selection bias): we assessed the method used in the studies to generate the randomised sequence process. We assessed the methods as: low risk of bias (e.g. random number table, using a computer random number generator, coin tossing, shuffling cards or envelopes, throwing dice, drawing of lots); unclear risk of bias (method not clearly described); high risk of bias (e.g. sequence generated by odd or even date of birth, date (or day) of admission, hospital or clinic record number; or allocation by judgement of the clinician, preference of the participant, results of a laboratory test or a series of tests or availability of the intervention).
-
Allocation concealment (checking for possible selection bias): we assessed the method used to conceal allocation to interventions prior to assignment determines whether intervention allocation could have been foreseen in advance of, or during recruitment, or changed after assignment. We assessed the methods as: low risk of bias (e.g. telephone or central randomisation; consecutively numbered, sealed, opaque envelopes); unclear risk of bias (method not clearly stated); high risk of bias (studies that did not conceal allocation (e.g. open list)).
-
Blinding of participants and personnel (checking for possible performance bias): we assessed the methods used to blind trial participants and personnel from knowledge of which intervention they received. We assessed the methods as: low risk of bias (trial stated that personnel were blinded to participant's condition and intervention); unclear risk of bias (trial did not mention it or provide an adequate description of how it was achieved); high risk of bias (trial stated that participants or personnel were not blinded).
-
Blinding of outcome assessment (checking for possible detection bias): we assessed the methods used to blind outcome assessors from knowledge of which intervention a participant received. We assessed the methods as: low risk of bias (study stated that it was blinded and described the method used to achieve blinding, e.g. outcome assessor was someone not involved in the study); unclear risk of bias (trial stated that it was blinded but did not provide an adequate description of how it was achieved); high risk of bias (e.g. the study mentioned that it was not blinded).
-
Incomplete outcome data (checking for possible attrition bias due to the amount, nature and handling of incomplete outcome data): we assessed the methods used to deal with incomplete data as: low risk (less than 10% of participants did not complete the study or missing data imputed using appropriate methods, or both); unclear risk of bias (used 'last observation carried forward for analysis without detailed time point' or lacking information to judge it); high risk of bias (used 'completer' analysis).
-
Selective reporting (checking for reporting bias): we assessed the methods used to report the outcomes of the study as: low risk of bias (if all planned outcomes in the study protocol or methods were reported in the results of the published study); unclear risk of bias (if there was no clear distinction between planned outcomes and reported outcomes); or high risk of bias (if some planned outcomes from the study protocol or methods were clearly not reported in the results).
-
Other bias (checking for possible bias not explored in the categories above): we assessed the methods as low risk of bias (e.g. if the study appeared free of other sources of bias (e.g. study funding described, balanced groups for characteristics, and carryover effect or blocking described in the study); unclear risk of bias (e.g. lack of information regarding participants, study funding not described, and carryover effect or blocking not clearly reported); high risk of bias (unbalanced groups and carryover effect or blocking not being conducted).
Measures of treatment effect
We considered the review objectives and extracted relevant counts, dichotomous, categorical and continuous data from included studies. We extracted dichotomous data and calculated risk ratio (RR) with 95% confidence intervals (CI) for adherence to prescribed programmes and occurrence of adverse events. We extracted continuous data and calculated mean difference (MD) with 95% CI for the outcomes of lean body mass, fatigue and health‐related quality of life, muscle strength and muscle endurance, maximal and submaximal exercise capacity (Deeks 2011). If studies had used different scales, we would have expressed the treatment effect as standardised mean difference (SMD) and 95% CI.
Unit of analysis issues
In the parallel‐group RCTs, we considered the individual participant as the unit of analysis. If we had included cross‐over RCTs, we would have analysed both periods, separated by periods and together. If we had included cluster‐RCTs, we would have considered each cluster group as the unit of analysis.
Dealing with missing data
We contacted authors of included studies via email to request further information when the published study report did not provide sufficient information (e.g. did not describe randomisation or intention‐to‐treat analysis, or had missing data). If no answer had been obtained from study authors, we planned to present the findings in the main discussion.
Assessment of heterogeneity
We explored clinical, methodological and statistical heterogeneity. We conducted an initial assessment of clinical heterogeneity (participants, intervention and outcome), as well as methodological heterogeneity (study design). Based on this analysis and the decision to include exercise as part of multicomponent interventions, we chose a random‐effects model to better estimate effects (Deeks 2011; Higgins 2002; Higgins 2003). We planned visual inspection of any forest plots and testing for statistical heterogeneity for any meta‐analysis to inform the interpretation of the findings.
Assessment of reporting biases
We planned to use a funnel plot and examine for asymmetry to assess for evidence of reporting bias if there were 10 or more included studies.
Data synthesis
We planned to meta‐analyse data from similar comparisons using a random‐effect model in Review Manager 5 (Review Manager 2014). Due to the limited available data, we used Review Manager 5 to report individual studies with different time points, random effects and without group totals.
Subgroup analysis and investigation of heterogeneity
We planned to use descriptive comparisons to consider differences in effect between subgroups according to the following participant characteristics: type of cancer (lung, pancreatic, etc.); stage of cachexia (precachexia, cachexia, refractory cachexia (Fearon 2011)); and intervention characteristics: type of exercise (aerobic, resistance, combined), intensity of exercise (low, moderate, high), duration of exercise programme (six weeks, 12 weeks, etc.), where there were sufficient data.
Sensitivity analysis
We planned to perform a sensitivity analysis to consider the difference in pooled effects when studies were at high or unclear risk of bias, or those with substantial (greater than 20%) missing data, were omitted from analyses, where there were sufficient data. However, we did not perform such analysis due to the number of included studies, which did not allow us to explore the results any further.
Summary of findings and assessment of the certainty of the evidence
Two review authors (AJG, VS) independently rated the certainty of the evidence for each outcome using the GRADE system and GRADEprofiler Guideline Development Tool software (GRADEpro GDT), and the guidelines provided in Chapter 14 of the CochraneHandbook for Systematic Reviews of Interventions (Schünemann 2019).
The GRADE approach uses five considerations (study limitations, consistency of effect, imprecision, indirectness and publication bias) to assess the certainty of the body of evidence for each outcome, using the following criteria (Guyatt 2008):
-
high: we are very confident that the true effect lies close to that of the estimate of the effect;
-
moderate: we are moderately confident in the effect estimate; the true effect is likely to be close to the estimate of effect, but there is a possibility that it is substantially different;
-
low: our confidence in the effect estimate is limited; the true effect may be substantially different from the estimate of the effect;
-
very low: we have very little confidence in the effect estimate; the true effect is likely to be substantially different from the estimate of effect.
The GRADE system uses the following criteria for assigning a certainty level to a body of evidence (Chapter 14 of the CochraneHandbook for Systematic Reviews of Interventions; Schünemann 2019).
-
High: RCTs or double‐upgraded observational studies.
-
Moderate: downgraded RCTs or upgraded observational studies.
-
Low: double‐downgraded RCTs or observational studies.
-
Very low: triple‐downgraded RCTs or downgraded observational studies; or case series/case reports.
Factors may decrease the certainty level of a body of evidence such as downgrading the evidence by one (–1) or two (–2) levels for the five considerations:
-
serious (–1) or very serious (–2) limitations in the design and implementation of available studies suggesting high likelihood of bias;
-
serious (–1) or very serious (–2) indirectness of evidence (indirect population, intervention, control, outcomes);
-
serious (–1) or very serious (–2) unexplained heterogeneity or inconsistency of results (including problems with subgroup analyses);
-
serious (–1) or very serious (–2) imprecision of results (wide CIs);
-
serious (–1) or very serious (–2) high probability of publication bias.
We included two 'Summary of findings' tables to present the main findings in a transparent and simple tabular format, for the comparisons:
-
exercise plus usual care compared with usual care;
-
multimodal intervention with exercise plus usual care compared with usual care.
In particular, we included key information concerning the certainty of the evidence, the magnitude of effect of the interventions examined and the sum of available data on the outcomes lean body mass (eight weeks for comparison 1 and up to 12 weeks for comparison 2); adherence to prescribed programmes (eight weeks for comparison 1 and no data for comparison 2), occurrence of adverse events (eight weeks for comparison 1 and six weeks for comparison 2); muscle strength and endurance (no data for comparison 1 and six ‐ 12 weeks for comparison 2); maximal and submaximal exercise capacity (no data for comparison 1 and six ‐ 12 weeks for comparison 2); fatigue (eight weeks for comparison 1 and six weeks for comparison 2); and health‐related quality of life (eight weeks for comparison 1 and 12 weeks for comparison 2).
In circumstances where there were no data for an outcome, the certainty of the evidence was unknown and we reported this as 'no evidence to support or refute'.
Results
Description of studies
Results of the search
We updated the search for studies up to March 2020. We identified 216 new references since the initial search in Grande 2014, plus 19 references from specialists in the area (see Figure 1). There were 149 references after removal of duplicates, and we removed 132 studies after title screening. We viewed the remaining 17 references as potentially relevant and retrieved full‐text reports. We included four studies (14 reports) in this review, we classified two as ongoing studies, and one study is awaiting classification. We excluded three references: two studies did not investigate cancer cachexia and one study was not a RCT (see Excluded studies), resulting in 21 excluded studies overall.
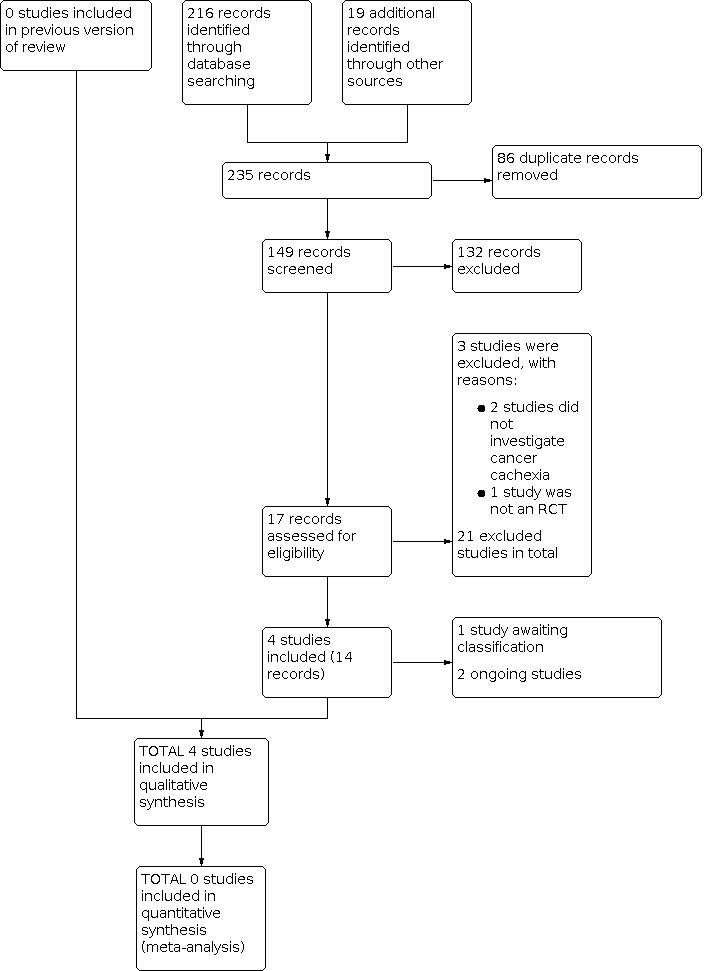
Study flow diagram.
Included studies
We included four studies that enrolled 178 adults, published between 2014 and 2018 in English (Capozzi 2016, 60 participants; Forget 2014, 54 participants; Grote 2018, 20 participants; Solheim 2017, 44 participants) (see Characteristics of included studies table). All four included studies were parallel RCTs. The study sample size ranged from 20 (Grote 2018) to 60 participants (Capozzi 2016).
Settings
Three studies enrolled participants from a single centre (Capozzi 2016; Forget 2014; Grote 2018), and one study was multicentre (Solheim 2017). Three studies were from Europe: one in the UK and Norway (Solheim 2017), one in Belgium (Forget 2014), and one in Germany (Grote 2018). The remaining study was in Canada (Capozzi 2016).
Participants
Participants had a mean age of 58.1 years (standard deviation (SD) 8.2). The proportion of men in three of the studies ranged from 52.4% to 81.7%. One study presented in abstract form only and did not report participants' sex or gender (Forget 2014). The types of primary cancer were: head and neck cancer (Capozzi 2016; Grote 2018), lung and pancreas (Solheim 2017), and mixed cancer types (Forget 2014).
Experimental and comparator interventions
Exercise alone
The Grote 2018 intervention comprised eight weeks of three‐times weekly progressive resistance training. Each session consisted of a 5‐minute warm‐up, followed by leg press, latissimus pull‐down and chest press exercises using fixed equipment performed with eight to 12 repetitions and three sets, with 60 seconds of rest between sets. Progression using fixed‐weight increments (2.5 kg to 5 kg) occurred if people reported a rating of perceived exertion of less than seven out of 10, and supervision was provided by a physiotherapist.
Multimodal interventions (exercise in combination with pharmacological, nutritional and educational interventions)
Three studies used multimodal interventions (Capozzi 2016; Forget 2014; Solheim 2017).
The Capozzi 2016 intervention comprised 12 weeks of twice‐weekly progressive resistance training. Each session included a 2‐ to 7‐minute warm‐up, followed by two or three sets of exercises of eight to 10 repetitions at a self‐rated intensity of three to five out of 10 using the Borg rating of perceived exertion, with 60 seconds of rest between sets. Progression was applied at four, six, and nine weeks, as appropriate and supervision was provided by a physiologist/personal trainer. Exercise was combined with group‐based health education and behaviour change support.
The Forget 2014 intervention comprised 12 weeks of daily exercise, with weekly supervision by a physiotherapist, combined with mirtazapine 30 mg/day, weekly advice provided by a dietician and psychological support as required.
The Solheim 2017 intervention comprised six weeks of twice‐weekly aerobic training and three‐times weekly resistance training. Aerobic sessions included 30‐minutes of exercise of the participant's choice, usually walking, and resistance sessions included six exercises targeting major muscle groups in the upper body and legs (wall push‐ups, overhead presses, biceps curls, squats, lunges, calf raises using weights), performed over approximately 20 minutes. Exercise was combined with celecoxib 300 mg once daily, oral nutritional supplements (ONS), two 220 mL cartons of ProSure (Abbott, each containing eicosapentaenoic acid (EPA) 1 g, giving a net protein intake of 2 g/day), plus nutritional counselling with advice on meal frequency and energy‐dense food provided by a dietician or trial nursing staff or both.
Comparator interventions
The comparator interventions were usual care (Capozzi 2016; Solheim 2017) or best supportive care (Forget 2014), with additional nutritional support by a professional dietician (Solheim 2017) or inpatient physiotherapy (Grote 2018) only when medically indicated, as judged by the treating physician. Capozzi 2016 used a wait list design where control participants received a delayed intervention after the primary study endpoint.
Outcome measures
Lean body mass
Three studies reported lean body mass. Solheim 2017 used computed tomography measuring muscle surface area. Capozzi 2016 used dual‐energy x‐ray absorptiometry scan measuring T score or a Z score. Grote 2018 used bioelectrical impedance analysis measuring frequency of 50 kHz and 400 μA constant current in electrical resistance of the body.
Adherence to prescribed exercise programmes
Two studies reported adherence to prescribed exercise programmes. Solheim 2017 measured the frequency of participants still completing exercise at the end of study. Capozzi 2016 measured using weekly logs.
Occurrence of adverse events
One study reported data on occurrence of adverse events. Solheim 2017 measured any adverse events self‐reported by the participants.
Muscle strength and endurance
Four studies reported muscle strength and endurance. Solheim 2017 measured muscle strength using a hand‐held dynamometer as kilogram force. Forget 2014 measured handgrip strength and provided no additional information. Capozzi 2016 measured muscle strength using a dynamometer. Grote 2018 used strength of the functional muscle group for elbow flexion in supine position as well as of knee extension in sitting position tested via hand‐held dynamometry at baseline only.
One study measured muscle endurance. Capozzi 2016 used the sit and stand test.
Maximal and submaximal exercise capacity
Three studies reported maximal and submaximal exercise capacity.Capozzi 2016, Grote 2018, and Solheim 2017 used the 6MWT.
Fatigue
Two studies reported fatigue. Solheim 2017 used the Fatigue Severity Scale. Grote 2018 used two measurements (rating of perceived exertion (RPE) from 0 to 10) and dyspnoea (RPE 0–10) and the MFI.
Health‐related quality of life
Three studies reported health‐related quality of life. Forget 2014 mentioned but did not provide information regarding outcome measurements. Capozzi 2016 used Functional Assessment of Cancer Therapy‐Anemia (FACT‐An) scale and the Functional Assessment of Cancer Therapy Head/Neck Symptom Index‐22 (FHNSI‐22). Grote 2018 used the Functional Assessment of Anorexia/Cachexia Therapy (FAACT) questionnaire.
Funding and potential conflicts
Three studies specified funding sources (Capozzi 2016; Grote 2018; Solheim 2017); the remaining study did not report this information (Forget 2014). We identified unrelated but potential conflicts of interest in two studies (Capozzi 2016; Solheim 2017). In Solheim 2017, one researcher received fees from pharmaceutical companies. In Capozzi 2016 and Solheim 2017, there were donations of ONSs or drugs (or both) from pharmaceutical companies. For additional information, see the Characteristics of included studies table.
Excluded studies
For this 2021 update, we excluded three studies, two because they did not investigate cancer cachexia (Arrieta 2019; Jain 2019), and one because it was not an RCT (Solheim 2019). There was a total of 21 excluded studies.
From the previous review, 16 studies examined an exercise intervention in adults with cancer and may have collected data on cachexia domains (Battaglini 2010; Carnaby‐Mann 2012; Cheville 2010; Courneya 2009; Elter 2009; Irwin 2009; Kuehr 2014; Litterini 2013; Mantovani 2010; Oldervoll 2006; Oldervoll 2011; Saarto 2012; Schwartz 2007; Uster 2018; Vanderbyl 2017; Zatarain 2013). We attempted to contact corresponding authors via email to determine the proportion of the sample meeting precachexia or cachexia criteria. Most authors did not explore this concept (Battaglini 2010; Courneya 2009; Elter 2009; Irwin 2009; Kuehr 2014; Mantovani 2010; Oldervoll 2006; Oldervoll 2011; Schwartz 2007; Zatarain 2013); others did not respond and are unlikely to respond, and so we made the assumption that they did not investigate cancer cachexia (Carnaby‐Mann 2012; Cheville 2010; Litterini 2013; Saarto 2012).
Two studies did not investigate exercise (Fouladiun 2007; Op den Kamp 2012).
See Characteristics of excluded studies table.
Studies awaiting classification
There was one additional completed study, but the full article or results were not yet published (Rogers 2011). A feasibility study was planned to assess the effect of a multimodal intervention (resistance training and oral ingestion of essential amino acids (EAA) plus EPA and cyclo‐oxygenase‐2 (COX‐2) inhibitor) versus usual care (EPA and COX‐2 inhibitor) for people with lung cancer with cancer cachexia. We will consider this study in future updates of this review. For more information, see the Characteristics of studies awaiting classification table.
Ongoing studies
We identified two ongoing studies (ACTRN12619000426189; Solheim 2018). For more information, see the Characteristics of ongoing studies table.
Risk of bias in included studies
The risk of bias graphs for all four studies are presented in Figure 2. Summary details for each trial are given in Figure 3. All included studies were at high or unclear risk of bias for at least three domains.

Risk of bias graph: review authors' judgements about each risk of bias item presented as percentages across all included studies.

Risk of bias summary: review authors' judgements about each risk of bias item for each included study.
Allocation
Random sequence generation
We classified two studies at low risk of bias as they appropriately described randomisation procedures (Capozzi 2016; Solheim 2017). One used computer generated numbers (Capozzi 2016), and the other used blocked randomisation (Solheim 2017). We classified two studies at unclear risk of bias as they did not provide sufficient information to enable assessment (Forget 2014; Grote 2018).
Allocation concealment
We classified three studies at unclear risk of bias since they did not provide sufficient information to enable assessment (Capozzi 2016; Forget 2014; Grote 2018). We assessed one study as low risk of bias, because personnel independent from the administrative centre allocated participants (Solheim 2017).
Blinding
Performance bias
We considered two studies at high risk of bias for blinding participants and personnel, since they reported that participants were not blinded (Grote 2018; Solheim 2017). We considered the other two studies at unclear risk, since they did not provide any information to be judged (Capozzi 2016; Forget 2014).
Detection bias
We considered Capozzi 2016 at low risk of bias because the exercise physiologist was blinded to the outcome assessment. Two studies reported that outcome assessors were not blinded (Grote 2018; Solheim 2017), thus we considered these at high risk of bias. One study did not provide sufficient information to enable assessment (Forget 2014).
Incomplete outcome data
We classified two studies at low risk of bias (Grote 2018; Solheim 2017). In Grote 2018, there were no losses to follow‐up. In Solheim 2017, there were losses to follow‐up, but adjustments were made to the analysis and the reasons were fully explained in the reporting. One study was at unclear risk of bias, since the report did not provide the analysis for 48 weeks (Capozzi 2016). We classified Forget 2014 at high risk of bias due to high loss of follow‐up (over 50%).
Selective reporting
We judged three studies at high risk of bias (Capozzi 2016; Grote 2018; Solheim 2017), and one study at unclear risk of bias (Forget 2014). Capozzi 2016 wrote in the protocol that they would report data for 12, 24, 36 and 48 weeks but did not report this in the study. Solheim 2017 planned to report six and 12 weeks but did not report 12‐week data. Grote 2018 did not fully report data for the outcomes 6MWT and muscle strength. Forget 2014 did not report enough information and so we judged it at unclear risk of bias.
Other potential sources of bias
We considered Capozzi 2016 at high risk of bias since imbalance might have affected adherence to treatment and outcomes, the experimental intervention group had higher surgery rates (20/31 participants) compared to control (6/29 participants). Forget 2014 did not provide enough information since it is a conference abstract and so we judged it at unclear risk of bias. We judged Grote 2018 and Solheim 2017 at low risk of bias as they were free from other sources of bias.
Effects of interventions
See: Summary of findings 1 Exercise plus usual care compared to usual care for cancer cachexia in adults; Summary of findings 2 Multimodal intervention (exercise plus other interventions) plus usual care compared to usual care
Exercise plus usual care compared with usual care
One study compared exercise plus usual care versus usual care (Grote 2018).
Primary outcome
Lean body mass
Data from the seven‐week and eight‐week time periods indicated there was no clear evidence of a difference for lean body mass in kilograms, but the evidence was very uncertain (7 weeks: MD 4.30 kg, 95% CI –4.91 to 13.51; 20 participants; 8 weeks: MD 6.40 kg, 95% CI –2.30 to 15.10; 20 participants). We assessed the certainty of evidence as very low, downgrading once for serious study limitations due to high risk of bias; once for indirectness due to insufficient time for the intervention to have physiological changes (adaptations) from exercise; and once for imprecision due to wide CIs and few events and studies (summary of findings Table 1).
Secondary outcomes
Adherence to prescribed exercise programmes
Grote 2018 did not present this measure in the methods section; however, it was reported descriptively in the results and conclusion. After eight weeks of the intervention, there was no clear evidence of a difference, but the evidence was very uncertain (RR 1.00, 95% CI 0.83 to 1.20; 20 participants). In Solheim 2017, adherence to components of the intervention was 76% for celecoxib, 60% for exercise and 48% for nutritional supplements. We assessed the certainty of the evidence as very low, downgrading once for serious study limitations due to high risk of bias; once for indirectness due to insufficient time for the intervention to have physiological changes (adaptations) from exercise; and once for imprecision due to wide CIs and few events and studies (summary of findings Table 1).
Occurrence of adverse events
None of the participants reported occurrence of adverse events in the exercise group or the control group. We assessed the certainty of the evidence as very low, downgrading once for serious study limitations due to high risk of bias; once for indirectness due to insufficient time for the intervention to have physiological changes (adaptations) from exercise; and once for imprecision due to wide CIs and few events and studies (summary of findings Table 1).
Muscle strength and endurance
Grote 2018 reported muscle strength only at baseline and there were no data to support or refute the effect of exercise on this outcome.
Maximal and submaximal exercise capacity
Grote 2018 reported only the baseline information for functional capacity with the 6MWT and there were no data to support or refute the effect of exercise on this outcome.
Fatigue
Data from seven weeks and eight weeks indicated no clear evidence of a difference for fatigue (4 to 20 scale, the lower the better), but the evidence was very uncertain (7 weeks: MD –1.80, 95% CI –5.74 to 2.14; 20 participants; 8 weeks: MD –0.10, 95% CI –4.00 to 3.80; 20 participants). We assessed the certainty of the evidence as very low, downgrading once for serious study limitations due to high risk of bias; once for indirectness due to insufficient time for the intervention to have physiological changes (adaptations) from exercise; and once for imprecision due to wide CIs and few events and studies (summary of findings Table 1)
Health‐related quality of life
Data from seven weeks and eight weeks indicated no clear evidence of a difference (0 to 104 scale, the higher the better), but the evidence was very uncertain (7 weeks: MD 3.10, 95% CI –13.65 to 19.85; 20 participants; 8 weeks: MD 4.90, 95% CI –15.10 to 24.90; 20 participants). We assessed the certainty of the evidence as very low, downgrading once for serious study limitations due to high risk of bias; once for indirectness due to insufficient time for the intervention to have physiological changes (adaptations) from exercise; and once for imprecision due to wide CIs and few events and studies (summary of findings Table 1).
Multimodal intervention (exercise combined with other interventions) plus usual care compared with usual care
Three studies assessed multimodal intervention plus usual care versus usual care (Capozzi 2016; Forget 2014; Solheim 2017). Forget 2014 did not provide enough data for analysis.
Primary outcome
Lean body mass
Two studies reported lean body mass (Capozzi 2016; Solheim 2017). There was no clear evidence of a difference for lean body mass, but the evidence was very uncertain (6 weeks: MD 7.89 kg, 95% CI –9.57 to 25.35; 1 study, 44 participants; Analysis 2.1; 12 weeks: MD –2.00 kg, 95% CI –8.00 to 4.00; 1 study, 60 participants; Analysis 2.1). We assessed the certainty of the evidence as very low, downgrading once for serious study limitations due to high risk of bias; once for indirectness due to insufficient time for the intervention to have physiological changes (adaptations) from exercise; and once for imprecision due to wide CIs and few events and studies (see summary of findings Table 2).
Secondary outcomes
Adherence to prescribed exercise programmes
One study reported adherence to prescribed exercise programmes (Solheim 2017). Compliance to the individual components of the intervention was 76% for celecoxib, 60% for exercise and 48% for nutritional supplements
Occurrence of adverse events
One study reported occurrence of adverse events (Solheim 2017). The other two studies reported no data for this outcome (Capozzi 2016; Forget 2014). There was no clear evidence of a difference for occurrence of adverse events (patient episode report), but the evidence was very uncertain (RR 1.18, 95% CI 0.67 to 2.07; 44 participants; Analysis 2.2).We assessed the certainty of the evidence as very low, downgrading once for serious study limitations due to high risk of bias; once for indirectness since the interventions may not have been applicable to the decision context, and the insufficient outcome timeframe for the intervention to have physiological changes (adaptations) from exercise; and once for imprecision due to wide CIs and few events and studies (see summary of findings Table 2).
Muscle strength and endurance
Two studies reported muscle strength (assessed using hand‐held dynamometry) but not endurance (Capozzi 2016; Solheim 2017). There was no clear evidence of a difference for muscle strength, but the evidence was very uncertain (6 weeks: MD 3.80, 95% CI –2.87 to 10.47; 1 study, 44 participants; 12 weeks: MD –5.00, 95% CI –14.00 to 4.00; 1 study, 60 participants; Analysis 2.3). We assessed the certainty of the evidence as very low, downgrading once for serious study limitations due to high risk of bias; once for indirectness since the interventions may not have been applicable to the decision context, and the insufficient outcome timeframe for the intervention to have physiological changes (adaptations) from exercise; and once for imprecision due to wide CIs and few events and studies (see summary of findings Table 2).
Maximal and submaximal exercise capacity
Two studies reported submaximal exercise capacity (6MWT) only (Capozzi 2016; Solheim 2017). Data from six‐week and 12‐week endpoints indicated no clear evidence of a difference for distance walked, but the evidence was very uncertain (6 weeks: MD –16.10 m, 95% CI –76.53 to 44.33; 1 study, 44 participants; 12 weeks: MD –62.60 m, 95% CI –145.87 to 20.67; 1 study, 60 participants; Analysis 2.4). We assessed the certainty of evidence as very low, downgrading once for serious study limitations due to high risk of bias; once for indirectness since the interventions may not have been applicable to the decision context, and the insufficient outcome timeframe for the intervention to have physiological changes (adaptations) from exercise; and once for imprecision due to wide CIs and few events and studies (see summary of findings Table 2).
Fatigue
One study reported fatigue (Solheim 2017). There was no clear evidence of a difference for fatigue (0 to 10 scale, lower score better), but the evidence was very uncertain at six weeks (MD 0.12, 95% CI –1.00 to 1.24; 44 participants; Analysis 2.5). We assessed the certainty of the evidence as very low, downgrading once for serious study limitations due to high risk of bias; once for indirectness since the interventions may not have been applicable to the decision context, and the insufficient outcome timeframe for the intervention to have physiological changes (adaptations) from exercise; and once for imprecision due to wide CIs and few events and studies (see summary of findings Table 2).
Health‐related quality of life
One study reported quality of life at 12 weeks (Capozzi 2016). There was no clear evidence of a difference for health‐related quality of life (0 to 104 scale, the higher the better), but the evidence was very uncertain (MD –2.20, 95% CI –13.99 to 9.59; 60 participants; Analysis 2.6). We assessed the certainty of the evidence as very low, downgrading once for serious study limitations due to high risk of bias; once for indirectness since the interventions may not been applicable to the decision context, and the insufficient outcome timeframe for the intervention to have physiological changes (adaptations) from exercise; and once for imprecision due to wide CIs and few events and studies (see summary of findings Table 2).
Exercise compared with no treatment
We found no studies.
Exercise compared with active control
We found no studies.
Discussion
Summary of main results
We aimed to determine the effectiveness, acceptability and safety of exercise, compared to usual care, no treatment or active control, on biomarkers and clinical outcomes of cachexia in adults living with cancer. We analysed findings from four RCTs and summarised the direction of effects for each outcome. There was no clear evidence of a difference for lean body mass in exercise plus usual care compared with usual care and multimodal intervention (exercise plus other interventions) plus usual care compared with usual care, but the evidence was very uncertain.
Exercise plus usual care compared with usual care
There was no clear evidence of a difference for lean body mass, adherence, fatigue and health‐related quality of life, but the evidence was very uncertain. There were no data for muscle strength and endurance and maximal and submaximal exercise capacity. There were no adverse events reported during or after the training by the participants.
Multimodal intervention (exercise combined with other interventions) plus usual care compared with usual care
There was no clear evidence of a difference for lean body mass, occurrence of adverse events, muscle strength and endurance, and maximal and submaximal exercise capacity, fatigue and health‐related quality of life, but the evidence was very uncertain. There were no data for prescribed exercise programmes.
Exercise compared with no treatment
We found no studies.
Exercise compared with active control
We found no studies.
Overall completeness and applicability of evidence
This review identified only four studies. The primary outcomes of the included studies were not always specific to cancer cachexia (e.g. health‐related quality of life), and, therefore, the interventions being examined were not always designed to address cachexia symptoms alone. Our main objective was to assess the effectiveness, acceptability and safety of exercise intervention on cancer cachexia and, according to our original protocol, we included studies where exercise was used as a standalone intervention or used in combination with other component interventions. Studies in this field are shifting towards using multicomponent approaches as a standard, therefore, studies of exercise as a sole intervention are unlikely to emerge in the future. This does limit the extent to which the specific effects of exercise can be delineated outside of laboratory/acute studies. In future updates of this review, we will consider amending the protocol towards multimodal interventions.
Another feature of the included studies was the inconsistency of the interventions in terms of specific component, and exercise intensity, volume and frequency. While we could describe 'what' was offered in sufficient detail, studies lacked detail on 'who' delivered what and 'how' components were delivered, for example which materials were used or if there were prompts or scripted interactions. Detail on dosing and adherence in particular was brief and only reported at the group level limiting the extent to which this could be assessed. We recommend authors in this field adhere to reporting standards for interventions such as the TIDieR checklist to improve transparency and utility of published studies (Hoffmann 2014). The short duration of some interventions may have been a factor in the lack of evidence for an effect on some outcomes including lean body mass (Roeland 2020).
Quality of the evidence
The overall certainty of the evidence was very low. We based this assessment on serious study limitations, indirectness and imprecision. We downgraded for serious study limitations due to a lack of blinding, risk of selection bias (allocation concealment not reported in three studies) and suspicion of reporting bias. We identified high risk of performance bias due to the non‐blinding of participants and personnel. Blinding of outcome assessor (detection bias) in half of the studies was high risk and selective outcome reporting was high risk of bias. When considering other possible biases, we noted imbalances between study groups in terms of cancer stage and the frequency of intervention contacts, both of which might have affected adherence to treatment and study outcomes.
The comparison of exercise plus usual care compared with usual care included only one study (Grote 2018), and the certainty of the evidence was very low for all outcomes analysed. The comparison of multimodal intervention (exercise plus other interventions) plus usual care compared with usual care included three studies (Capozzi 2016; Forget 2014; Solheim 2017), but outcome data were only available for two studies. The certainty of the evidence was very low for all outcomes; therefore, we have very little confidence in the results and the true effect may be substantially different.
Potential biases in the review process
We used a comprehensive and highly sensitive search strategy in the major databases and clinical trial registries. We consider it unlikely that we missed relevant studies from the search, though the poor availability of data on parameters to diagnose cachexia (e.g. weight loss reporting) was limiting. We followed usual Cochrane methods and there were no contestable decisions relating to the inclusion or exclusion of studies, data analyses or assessing risk of bias. The overall objective of this review was to determine the effectiveness, acceptability and safety of exercise, compared to usual care, no treatment or active control, for cancer cachexia in adults. Including studies of exercise combined with other interventions in this review did not permit the identification of the effectiveness of exercise alone. There are different time points published for different outcomes in the included studies. Since there is no clear agreement on the most appropriate follow‐up or adequate duration of an intervention, this could be considered a bias.
Agreements and disagreements with other studies or reviews
There are few data available for exercise or multimodal interventions for people with cancer cachexia. The lack of evidence and number of unanswered research questions are acknowledged by an international guideline (Radbruch 2010) and 2019 systematic review (Hall 2019), yet it is widely agreed malnutrition and a loss of bodyweight (muscle mass and fat) has a negative impact on function and quality of life in people with cancer (Fearon 2011; Fearon 2012; Hall 2019; Maddocks 2012). While the mechanisms of cancer cachexia are complex, existing theory indicates the potential for benefit from exercise, nutrition and anti‐inflammatory medication (Fearon 2012; Hall 2019; Maddocks 2012).
Due to the complexity of cancer cachexia, screening, assessing and monitoring may currently be conducted to increase quality of care and raise awareness in clinical practice (Arends 2017). Wilms 2016 explored the evidence on exercise and nutrition for the prevention and treatment of cachexia in a narrative review. The authors' main findings reflected that exercise interventions currently lack a strong evidence base, and nutritional interventions alone show minimal effect on the natural course and outcomes of cancer cachexia. Hall 2019 explored the optimal components for rehabilitation in people with incurable cancer using the principles of exercise and nutrition‐based interventions. The authors similarly found limited data (only two RCTs) for multimodal rehabilitation programmes combining exercise and nutritional interventions in people with incurable cancer and called for further high‐quality studies.
The American Society of Clinical Oncology published evidence‐based guidance on the clinical management of cancer cachexia in adults with advanced cancer (Roeland 2020). The guidance considered 20 systematic reviews and 13 additional RCTs, spanning three broad intervention groups: 1. nutritional interventions where evidence remained limited despite increased bodyweight in some trials; 2. pharmacological interventions with improvements in appetite or bodyweight (or both) found with progesterone analogues and corticosteroids; and 3. other interventions including exercise, all of which had insufficient evidence of benefit to draw conclusions on efficacy (Roeland 2020).

Study flow diagram.

Risk of bias graph: review authors' judgements about each risk of bias item presented as percentages across all included studies.

Risk of bias summary: review authors' judgements about each risk of bias item for each included study.

Comparison 1: Exercise plus usual care compared with usual care, Outcome 1: Lean body mass

Comparison 1: Exercise plus usual care compared with usual care, Outcome 2: Adherence to prescribed exercise programmes

Comparison 1: Exercise plus usual care compared with usual care, Outcome 3: Occurrence of adverse events

Comparison 1: Exercise plus usual care compared with usual care, Outcome 4: Fatigue

Comparison 1: Exercise plus usual care compared with usual care, Outcome 5: Health‐related quality of life

Comparison 2: Multimodal intervention (exercise plus other interventions) plus usual care compared to usual care, Outcome 1: Lean body mass

Comparison 2: Multimodal intervention (exercise plus other interventions) plus usual care compared to usual care, Outcome 2: Occurrence of adverse events

Comparison 2: Multimodal intervention (exercise plus other interventions) plus usual care compared to usual care, Outcome 3: Muscle strength and endurance

Comparison 2: Multimodal intervention (exercise plus other interventions) plus usual care compared to usual care, Outcome 4: Maximal and submaximal exercise capacity

Comparison 2: Multimodal intervention (exercise plus other interventions) plus usual care compared to usual care, Outcome 5: Fatigue

Comparison 2: Multimodal intervention (exercise plus other interventions) plus usual care compared to usual care, Outcome 6: Health‐related quality of life
| Exercise plus usual care compared to usual care for cancer cachexia in adults | ||||||
| Patient or population: cancer cachexia in adults Setting: cancer centres Intervention: exercise plus usual care Comparison: usual care | ||||||
| Outcomes | Anticipated absolute effects*(95% CI) | Relative effect | № of participants | Certainty of the evidence (GRADE) | Comments | |
|---|---|---|---|---|---|---|
| Risk with usual care | Risk with exercise plus usual care | |||||
| Lean body mass Assessed with: bioimpedance Follow‐up: 8 weeks | The mean lean body mass was 52.7 kg (95% CI 44.04 to 61.36) | MD 6.4 kg higher (2.3 lower to 15.1 higher) | — | 20 (1 study) | ⊕⊝⊝⊝ Very lowa,b,c | — |
| Adherence to prescribed exercise programmes Assessed with: counting of participants finishing the study Follow‐up: 8 weeks | Study population | RR 1.00 (0.83 to 1.20 | 20 | ⊕⊝⊝⊝ Very lowa,b,c | The outcome was not planned in the protocol or presented in methods, but it was reported descriptively in the results and conclusion. | |
| 1000 per 1000 | 1000 per 1000 (830 to 1000) | |||||
| Occurrence of adverse events Assessed with: patient's self‐report Follow‐up: 8 weeks | Study population | Not estimable | 20 | ⊕⊝⊝⊝ Very lowa,b,c | No adverse events were reported during or after the training. | |
| 0 per 1000 | 0 per 1000 (0 to 0) | |||||
| Muscle strength and endurance | No data | No data | — | — | — | Only baseline data for muscle strength. No evidence to support or refute. |
| Maximal and submaximal exercise capacity Functional capacity assessed with: 6MWT | No data | No data | — | — | — | Only baseline data. No evidence to support or refute. |
| Fatigue Assessed with: MFI questionnaire (scale 4–20; lower score better) Follow‐up: 8 weeks | The mean fatigue score was 11.90 (95% CI 8.61 to 15.19) | MD 0.1 lower | — | 20 | ⊕⊝⊝⊝ Very lowa,b,c | — |
| Health‐related quality of life Assessed with: FAACT (scale 0–104; higher score better) Follow‐up: 8 weeks | The mean health‐related quality of life score was 59.50 (95% CI 8.61 to 15.19) | MD 4.9 higher | — | 20 | ⊕⊝⊝⊝ Very lowa,b,c | — |
| *The basis for the assumed risk (e.g. the median control group risk across studies) is provided in footnotes. The corresponding risk (and its 95% confidence interval) is based on the assumed risk in the comparison group and the relative effect of the intervention (and its 95% CI). 6MWT: six‐minute walk test; CI: confidence interval; FAACT: Functional Assessment of Anorexia/Cachexia Therapy; MD: mean difference; MFI: Multidimensional Fatigue Inventory; RR: risk ratio. | ||||||
| GRADE Working Group grades of evidence | ||||||
| aDowngraded one level for serious study limitations: high risk of bias: blinding of participants and personnel; blinding of outcome assessment; other bias. | ||||||
| Multimodal intervention (exercise plus other interventions) plus usual care compared to usual care | ||||||
| Patient or population: cancer cachexia in adults | ||||||
| Outcomes | Anticipated absolute effects* (95% CI) | Relative effect | № of participants | Certainty of the evidence | Comments | |
|---|---|---|---|---|---|---|
| Risk with usual care | Risk with multimodal intervention plus usual care | |||||
| Lean body mass Assessed with: muscle surface area (cm2) and DEXA (kg) Follow‐up: 6–12 weeks | The mean of lean body mass was 123.07 cm2 (95% CI 108.60 to 137.56) at 6 weeks | MD 7.89 cm2 higher | — | 44 | ⊕⊝⊝⊝ Very lowa,b,c | — |
| The mean lean body mass was 63.80 kg (95% CI 59.39 to 68.20) at 12 weeks | MD 2.00 kg lower | — | 60 | |||
| Adherence to prescribed exercise programmes | No data | No data | — | — | — | No evidence to support or refute. |
| Occurrence of adverse events Assessed with: self‐reported Follow‐up: 6 weeks | Study population | RR 1.18 | 44 | ⊕⊝⊝⊝ Very lowa,b,c | — | |
| 476 per 1000 | 562 per 1000 | |||||
| Muscle strength and endurance** Strength assessed with: hand‐held dynamometry (kg) Follow‐up: 6 to 12 weeks | The mean muscle strength was 31.5 kg (95% CI 25.85 to 37.14) at 6 weeks | MD 3.8 kg higher | — | 44 | ⊕⊝⊝⊝ Very lowa,b,c | — |
| The mean muscle strength was 90.0 kg (95% CI 83.48 to 96.51) at 12 weeks | MD 5 kg lower | — | 60 | — | — | |
| Maximal and submaximal exercise capacity** Submaximal capacity assessed with: 6MWT distance walked in meters Follow‐up: 6 to 12 weeks | The mean muscle endurance submaximal exercise capacity was 490.50 m (95% CI 444.47 to 536.52) at 6 weeks | MD 16.1 m lower | — | 44 | ⊕⊝⊝⊝ Very lowa,b,c | — |
| The mean muscle endurance submaximal exercise capacity was 690.80 m (95% CI 641.31 to 740.28) at 12 weeks | MD 62.6 m lower | — | 60 | |||
| Fatigue Assessed with: Fatigue Severity (scale: 0–10; lower score better) Follow‐up: 6 weeks | The mean fatigue score was 3.73 (95% CI 2.84 to 4.61) | MD 0.12 higher | — | 44 | ⊕⊝⊝⊝ Very lowa,b,c | — |
| Health‐related quality of life Assessed with: FAACT (scale: 0–136; higher score better) Follow‐up: 12 weeks | The mean health‐related quality of life score was –19.1 (95% CI –27.49 to –10.70) | MD 2.20 lower | — | 60 | ⊕⊝⊝⊝ Very lowa,b,c | — |
| *The risk in the intervention group (and its 95% confidence interval) is based on the assumed risk in the comparison group and the relative effect of the intervention (and its 95% CI). ** Endurance, and maximal exercise capacity, not measured/reported. 6MWT: six‐minute walk test; CI: confidence interval; DEXA: dual‐energy x‐ray absorptiometry; FAACT: Functional Assessment of Anorexia/Cachexia Therapy; kg: kilograms; m: meters; MD: mean difference; MFI: Multidimensional Fatigue Inventory; RCT: randomised controlled trial; RR: risk ratio. | ||||||
| GRADE Working Group grades of evidence | ||||||
| aDowngraded one level for serious study limitations: high risk of bias: blinding of participants and personnel (Solheim 2017); blinding of outcome assessment (Solheim 2017); incomplete outcome data (Capozzi 2016; Solheim 2017); selective reporting (Capozzi 2016; Solheim 2017); other bias (Capozzi 2016; Solheim 2017). | ||||||
| Outcome or subgroup title | No. of studies | No. of participants | Statistical method | Effect size |
| 1.1 Lean body mass Show forest plot | 1 | Mean Difference (IV, Random, 95% CI) | Totals not selected | |
| 1.1.1 At 7 weeks | 1 | Mean Difference (IV, Random, 95% CI) | Totals not selected | |
| 1.1.2 At 8 weeks | 1 | Mean Difference (IV, Random, 95% CI) | Totals not selected | |
| 1.2 Adherence to prescribed exercise programmes Show forest plot | 1 | Risk Ratio (M‐H, Random, 95% CI) | Totals not selected | |
| 1.3 Occurrence of adverse events Show forest plot | 1 | 20 | Risk Ratio (M‐H, Random, 95% CI) | Not estimable |
| 1.4 Fatigue Show forest plot | 1 | Mean Difference (IV, Random, 95% CI) | Totals not selected | |
| 1.4.1 At 7 weeks | 1 | Mean Difference (IV, Random, 95% CI) | Totals not selected | |
| 1.4.2 At 8 weeks | 1 | Mean Difference (IV, Random, 95% CI) | Totals not selected | |
| 1.5 Health‐related quality of life Show forest plot | 1 | Mean Difference (IV, Random, 95% CI) | Totals not selected | |
| 1.5.1 At 7 weeks | 1 | Mean Difference (IV, Random, 95% CI) | Totals not selected | |
| 1.5.2 At 8 weeks | 1 | Mean Difference (IV, Random, 95% CI) | Totals not selected | |
| Outcome or subgroup title | No. of studies | No. of participants | Statistical method | Effect size |
| 2.1 Lean body mass Show forest plot | 2 | Mean Difference (IV, Random, 95% CI) | Totals not selected | |
| 2.1.1 At 6 weeks | 1 | Mean Difference (IV, Random, 95% CI) | Totals not selected | |
| 2.1.2 At 12 weeks | 1 | Mean Difference (IV, Random, 95% CI) | Totals not selected | |
| 2.2 Occurrence of adverse events Show forest plot | 1 | Risk Ratio (M‐H, Random, 95% CI) | Totals not selected | |
| 2.3 Muscle strength and endurance Show forest plot | 2 | Mean Difference (IV, Random, 95% CI) | Totals not selected | |
| 2.3.1 At 6 weeks | 1 | Mean Difference (IV, Random, 95% CI) | Totals not selected | |
| 2.3.2 At 12 weeks | 1 | Mean Difference (IV, Random, 95% CI) | Totals not selected | |
| 2.4 Maximal and submaximal exercise capacity Show forest plot | 2 | Mean Difference (IV, Random, 95% CI) | Totals not selected | |
| 2.4.1 At 6 weeks | 1 | Mean Difference (IV, Random, 95% CI) | Totals not selected | |
| 2.4.2 At 12 weeks | 1 | Mean Difference (IV, Random, 95% CI) | Totals not selected | |
| 2.5 Fatigue Show forest plot | 1 | Mean Difference (IV, Random, 95% CI) | Totals not selected | |
| 2.5.1 At 6 weeks | 1 | Mean Difference (IV, Random, 95% CI) | Totals not selected | |
| 2.6 Health‐related quality of life Show forest plot | 1 | Mean Difference (IV, Random, 95% CI) | Totals not selected | |
| 2.6.1 At 12 weeks | 1 | Mean Difference (IV, Random, 95% CI) | Totals not selected | |