Tau en LCR y cociente de tau/ABeta en LCR para el diagnóstico de la demencia de la enfermedad de Alzheimer y otras demencias en los pacientes con deterioro cognitivo leve (DCL)
Referencias
References to studies included in this review
References to studies excluded from this review
References to studies awaiting assessment
Additional references
Characteristics of studies
Characteristics of included studies [ordered by study ID]
| Study characteristics | |||
| Patient sampling | Study design: nested case‐control study with a delayed verification design Prospective MCI group of 49 participants with MCI, who attended a university‐based memory clinic, was recruited consecutively between 2005 and 2009. Twenty‐three control subjects were also recruited. We only included data on performance of the index test to discriminate between participants with MCI who converted to dementia and those who remained stable. Exclusion criteria: psychiatric disorder, anoxic brain damage, cancer, drug abuse, or cognitive symptoms related to solvent exposure. | ||
| Patient characteristics and setting | 39 MCI participants diagnosed by the Petersen 1991 criteria were included in the analysis. Ten MCI participants did not have a follow‐up assessment. GENDER: 20 men; 19 women AGE (y): MCI with abnormal CSF t‐tau level: 64 (range 45 to 76); MC with normal CSF t‐tau level: 58.5 (45 to 77) APOE ϵ4 carrier (%): not reported MMSE: MCI with abnormal CSF t‐tau level: 27.2 (range 25 to 29); MC with normal CSF t‐tau level: 27.9 (23 to 30) Education (y): MCI with abnormal CSF t‐tau level: 12.2 (range 7 to 18); MC with normal CSF t‐tau level: 11.8 (8 to 16) Sources of referral: not reported Sources of recruitment: a university‐based memory clinic, Oslo, Norway. | ||
| Index tests | CSF t‐tau Participants underwent lumbar puncture as part of the clinical evaluation. The CSF samples were examined for total tau levels with commercially available kits (Innogenetics, Ghent, Belgium). Threshold: This was prespecified. The age‐dependent criteria for pathologic values were based on a large sample of healthy control subjects and were as follows: total tau of 300 ng/L or higher for age younger than 50 years, total tau of 450 ng/L or higher for age 50 to 69 years, and total tau of 500 ng/L or higher for age older than 70 years (Sjogren 2001). The 0.90 fractile was estimated to establish reference values for CSF t‐tau. Not reported whether the index test results were interpreted without knowledge of the results of the reference standard. | ||
| Target condition and reference standard(s) | Target condition: conversion from MCI to Alzheimer's disease dementia Reference standard: The Global Deterioration Scale (Reisberg 1982) in combination with the research criteria for the diagnosis of Alzheimer's disease, International Working group (Dubois 2007) Not reported whether clinicians conducting follow‐up were aware of CSF t‐tau results. | ||
| Flow and timing | Duration of follow‐up: mean 2.6 ± 0.54 years At baseline: 49 MCI participants had CSF sample At follow‐up: 39 participants: 9 MCI with abnormal baseline CF t‐tau: 5 MCI converters and 4 MCI nonconverters; 30 MCI with normal baseline CSF t‐tau: 4 MCI converters and 26 MCI nonconverters (information from the author) Number included in analysis (N=39) Conversion to ADD: TP = 5; FP = 4; FN = 4; TN = 26 sensitivity = 55%; specificity = 87% (calculated in Revman5) Loss to follow‐up N = 17 participants (10 MCI and 7 controls) did not have a follow‐up assessment. Between baseline and follow‐up, four participants with MCI objected to re‐examination, one died of unrelated causes, and five were excluded because of definite other diagnoses. Seven control subjects objected to re‐examination. All 39 MCI participants with the follow‐up assessment were included in the analysis (page 297). | ||
| Comparative | |||
| Notes | The trial investigators contacted; they provided relevant data for creating 2 X 2 table (email on 13/12/13). | ||
| Methodological quality | |||
| Item | Authors' judgement | Risk of bias | Applicability concerns |
| DOMAIN 1: Patient Selection | |||
| Was a consecutive or random sample of patients enrolled? | Yes | ||
| Was a case‐control design avoided? | Yes | ||
| Did the study avoid inappropriate exclusions? | Yes | ||
| Low | Low | ||
| DOMAIN 2: Index Test All tests | |||
| Were the index test results interpreted without knowledge of the results of the reference standard? | Unclear | ||
| If a threshold was used, was it pre‐specified? | Yes | ||
| Unclear | Low | ||
| DOMAIN 3: Reference Standard | |||
| Is the reference standards likely to correctly classify the target condition? | Yes | ||
| Were the reference standard results interpreted without knowledge of the results of the index tests? | Unclear | ||
| Unclear | Unclear | ||
| DOMAIN 4: Flow and Timing | |||
| Was there an appropriate interval between index test and reference standard? | Yes | ||
| Did all patients receive the same reference standard? | Yes | ||
| Were all patients included in the analysis? | No | ||
| Unclear | |||
| Study characteristics | |||
| Patient sampling | Study design: prospective cohort study The inclusion of 137 participants was described in the paper by Hansson 2006, as below: 180 participants with MCI, who had sought medical advice for subjective memory difficulties, were consecutively recruited at a university hospital between July 1998 and June. Thirty‐six healthy controls were also included, but appeared to have been used for comparison purposes only and not included in the ROC analysis. CSF was obtained at baseline from 137 MCI participants. Of the 43 participants with MCI who did not undergo successful lumbar puncture at baseline, 32 preferred not to go through the procedure and in 11 the procedure did not deliver usable CSF. Participants with other causes of cognitive impairment, including brain tumour, subdural haematoma, CNS infection, and current alcohol abuse, were excluded. Buchhave 2012 and Hansson 2006 studies used the same cohort. | ||
| Patient characteristics and setting | 137 participants diagnosed by the Petersen 1991 criteria. Baseline demographic data reported for 134 participants. GENDER: 60 men; 74 women AGE (y): MCI‐MCI (stable) 61.9 ± 8.5; MCI‐AD 73.9 ± 5.8; MCI‐other dementia 71.1 ± 9.1 APOE ϵ4 carrier (%): MCI‐MCI (stable) 19 (46); MCI‐AD 53 (74); MCI‐other dementia 5 (24) MMSE: MCI‐MCI 27.5 ± 2.0; MCI‐AD 26.9 ± 1.4; MCI‐other dementia 26.8.0 ± 1.2 Education: not reported Sources of referral: not reported Sources of recruitment: secondary care, outpatients of memory disorder clinic, University hospital, Malmo, Sweden | ||
| Index tests | CSF p‐tau/ABeta ratio Cerebrospinal fluid was collected in polypropylene tubes, stored at ‐80 °C, and analysed after clinical follow‐up of the study was completed. No further details. Threshold: determined at follow‐up (page 102); a mixture model was used to establish accurate cutoff value: used to identify optimal cut‐offs: < 6.16 | ||
| Target condition and reference standard(s) | Target condition: Alzheimer's disease dementia or other forms of dementia Reference standards: NINCDS‐ADRDA and DSM‐III‐R for Alzheimer's disease dementia; DSM‐III‐R for vascular dementia; McKeith for Lewy bodies dementia and Brun for frontotemporal dementia. Clinicians conducting follow‐up were blinded to CSF biomarker results. | ||
| Flow and timing | Duration of follow‐up: median 9.2 years (range: 4.1 years to 11.8 years) At baseline: 137 MCI participants At follow‐up:134 MCI: 72 MCI‐AD; 21 MCI‐other dementias; 41 MCI‐MCI (stable); (page 99) Number included in analysis: 134 Conversion to Alzheimer's disease dementia: sensitivity 88%; specificity 90% (page 102) TP = 63; FP = 6; FN = 9; TN = 56 (calculated in RevMan5) Loss to follow‐up: 3 participants died before completion of 4 years follow‐up and were excluded from the analyses because their cognitive ability was uncertain. | ||
| Comparative | |||
| Notes | |||
| Methodological quality | |||
| Item | Authors' judgement | Risk of bias | Applicability concerns |
| DOMAIN 1: Patient Selection | |||
| Was a consecutive or random sample of patients enrolled? | Yes | ||
| Was a case‐control design avoided? | Yes | ||
| Did the study avoid inappropriate exclusions? | Yes | ||
| Low | Low | ||
| DOMAIN 2: Index Test All tests | |||
| Were the index test results interpreted without knowledge of the results of the reference standard? | Unclear | ||
| If a threshold was used, was it pre‐specified? | No | ||
| High | Low | ||
| DOMAIN 3: Reference Standard | |||
| Is the reference standards likely to correctly classify the target condition? | Yes | ||
| Were the reference standard results interpreted without knowledge of the results of the index tests? | Yes | ||
| Low | Low | ||
| DOMAIN 4: Flow and Timing | |||
| Was there an appropriate interval between index test and reference standard? | Yes | ||
| Did all patients receive the same reference standard? | Yes | ||
| Were all patients included in the analysis? | Yes | ||
| Low | |||
| Study characteristics | |||
| Patient sampling | Study design: retrospective analysis of the longitudinal data Retrospective recruitment of 42 participants with MCI from the Gothenborg study: 21 MCI converters and 21 MCI‐stable participants. The group of MCI converters comprised all MCI converters who underwent a baseline MRI investigation. The MCI‐stable participants were included consecutively to achieve matching group size. No further details. Twenty‐six controls were also recruited. We only included data on performance of the index test to discriminate between participants with MCI who converted to dementia and those who remained stable. Exclusion criteria: not reported. | ||
| Patient characteristics and setting | 42 participants, diagnosed with the Global Deterioration Scale (GDS) criteria (Reisberg 1998) at baseline. GDS criteria were not prespecified diagnostic criteria for MCI. Gender: 18 male; 24 female Age: total sample: mean age 67.9 (range 51 to 78) years; MCI‐MCI: 66.6 (range 56 to 78) years; MCI‐progressive: 69.3 (range 51 to 78) years APOEɛ4: not reported MMSE: mean 27.8 (range 22 to 30); MCI‐MCI: 28.3 (range 24 to 30); MCI‐progressive: 27.2 (range 22 to 30) Education: total sample: mean age 11.4 (range 6 to 19) years; MCI‐MCI: 12.5 (range 8 to 19) years; MCI‐progressive: 10.4 (range 6 to 17.5) years Sources of referral: not reported Sources of recruitment: University of Gothenburg, Molndal, Sweden | ||
| Index tests | CSF t‐tau CSF samples were collected by lumbar puncture (LP). Both baseline and follow‐up lumbar punctures were performed in the morning to exclude influences on the results from possible diurnal fluctuations in biomarker levels. The samples Threshold: 500 ng/L, not prespecified. ROC curves were used to calculate the cutoff values based on the maximum for the sum of sensitivity and specificity. It was not reported whether the index test results were interpreted without knowledge of the results of the reference standard. | ||
| Target condition and reference standard(s) | Target condition: conversion from MCI to ADD or FTD or subcortical VD or mixed AD/VD. Reference standard: NINCDS‐ADRDA criteria; Lund and Manchester criteria; Erkinjunitti criteria. In addition, Global Deterioration Scale (GDS) criteria (Reisberg 1998): score = 4 were used. It was not reported whether the results of the reference standard were interpreted without knowledge of the results of the index test. | ||
| Flow and timing | Duration of follow‐up: 2 years At baseline: 42 MCI participants At follow‐up: 21 MCI converters (13 MCI‐AD; 4 MCI‐VD; 2 MCI‐FTD; 2 MCI‐AD/VD); 21 MCI‐ stable (MCI‐MCI) (page 296) 21 MCI converters and 21 MCI non‐converters were selected from the Gothenborg study for the retrospective analysis. Number included in analysis: 42 Conversion to all types of dementia: sensitivity 67%; specificity 95% (Table 3, page 298) TP = 14; FP = 1; FN = 7; TN = 20 (Fig 1, page 297) Insufficient data to create 2 X 2 table for conversion from MCI to ADD. Loss to follow‐up: all retrospectively selected participants were included in the analysis | ||
| Comparative | |||
| Notes | |||
| Methodological quality | |||
| Item | Authors' judgement | Risk of bias | Applicability concerns |
| DOMAIN 1: Patient Selection | |||
| Was a consecutive or random sample of patients enrolled? | Unclear | ||
| Was a case‐control design avoided? | Yes | ||
| Did the study avoid inappropriate exclusions? | Unclear | ||
| High | Unclear | ||
| DOMAIN 2: Index Test All tests | |||
| Were the index test results interpreted without knowledge of the results of the reference standard? | Unclear | ||
| If a threshold was used, was it pre‐specified? | No | ||
| High | Low | ||
| DOMAIN 3: Reference Standard | |||
| Is the reference standards likely to correctly classify the target condition? | Unclear | ||
| Were the reference standard results interpreted without knowledge of the results of the index tests? | Unclear | ||
| Unclear | Unclear | ||
| DOMAIN 4: Flow and Timing | |||
| Was there an appropriate interval between index test and reference standard? | Yes | ||
| Did all patients receive the same reference standard? | Yes | ||
| Were all patients included in the analysis? | Unclear | ||
| Unclear | |||
| Study characteristics | |||
| Patient sampling | Study design: prospective cohort study Prospective recruitment of 16 participants with amnestic mild cognitive impairment, presenting at a memory clinic for diagnostic evaluation. Sampling procedure not described. Exclusion criteria: participants with metabolic disease that could affect cognitive function; participants with other brain diseases; participants with a diagnosis of depression according to DSM‐IV criteria. | ||
| Patient characteristics and setting | 16 participants, diagnosed with the Petersen 1999 criteria at baseline. One participant of the initial study group refused further participation and was replaced by a consecutively recruited comparable participant of the memory clinic to preserve the statistical power for prospectively planned follow‐up analyses. Gender: 9 male; 7 female Age: total sample: mean age 68.6 ± 7.9 years; MCI‐MCI: 68.8 ± 10.0 years; MCI‐progressive: 68.5 ± 5.9 years (4/8 MCI‐AD: 69.5 ± 7.9 years) APOEɛ4: not reported MMSE: mean 25.7 ± 2.7; MCI‐MCI: 27.3 ± 1.8; MCI‐progressive: 25.0 ± 2.1 (4/8 MCI‐AD: 24.3 ± 1.5) Education: not reported Sources of referral: not reported Sources of recruitment: University Memory Clinic, Germany | ||
| Index tests | CSF p‐tau Method of the index test administration described previously (Fellgiebel 2004). CSF was analysed with two sandwich enzyme‐linked immunosorbent assays: Tau protein phosphorylated at threonine 181 (p‐tau181) was determined using the Innogenetics INNOTEST Phospho‐Tau(181) kit and total tau protein (t‐tau) was examined with the INNOTEST‐hTau‐Ag kit. Threshold: Besides the previous published p‐tau181 cutoff (Fellgiebel 2004), the cutoff value of 50 pg/mL was chosen as an optimal cutoff by means of Receiver Operating Characteristic (ROC) analyses to separate participants with MCI from controls (measures in 75 participants, unpublished data). Not reported whether the index test results were interpreted without knowledge of the results of the reference standard. | ||
| Target condition and reference standard(s) | Target condition: conversion from MCI to Alzheimer's disease dementia. Reference standard: progression to Alzheimer's disease dementia was assumed if CDR reached 1 Follow‐up evaluation at variable time points (not specified), comprising neurological and psychiatric examination, CDR and MMSE. Progressive cognitive decline was defined as MMSE score reduction >/= 2 and a clinical judgement of cognitive deterioration. Clinicians conducting follow‐up were blinded to the CSF p‐tau results. | ||
| Flow and timing | Duration of follow‐up: total sample: 19.6 ± 9.0 months; MCI‐MCI: 19.5 ± 9.3 months; MCI‐progressive: 17.6 ± 8.8 months (4/8 MCI‐AD: 23.7 ± 2.0 months). At baseline: 16 MCI: 12 CSF p‐tau positive; 4 CSF p‐tau negative. At follow‐up: 16 MCI: 12 CSF positive: 4 MCI‐AD (converters), 8 MCI‐MCI (non‐converters), 4 MCI‐progressive (non‐converters); 4 CSF p‐tau negative: 4 MCI‐MCI (stable non‐converters) (page 170) Number included in analysis: 16 Conversion to AD: TP = 4; FP = 8; FN = 0; TN = 4 sensitivity: 100%; specificity: 33% (calculated in RevMan5) Loss to follow‐up:1/16; however, that participant was replaced by an additional, consecutively recruited patient from the memory clinic | ||
| Comparative | |||
| Notes | |||
| Methodological quality | |||
| Item | Authors' judgement | Risk of bias | Applicability concerns |
| DOMAIN 1: Patient Selection | |||
| Was a consecutive or random sample of patients enrolled? | Unclear | ||
| Was a case‐control design avoided? | Yes | ||
| Did the study avoid inappropriate exclusions? | Yes | ||
| Unclear | Low | ||
| DOMAIN 2: Index Test All tests | |||
| Were the index test results interpreted without knowledge of the results of the reference standard? | Unclear | ||
| If a threshold was used, was it pre‐specified? | No | ||
| High | Low | ||
| DOMAIN 3: Reference Standard | |||
| Is the reference standards likely to correctly classify the target condition? | Unclear | ||
| Were the reference standard results interpreted without knowledge of the results of the index tests? | Yes | ||
| Unclear | Unclear | ||
| DOMAIN 4: Flow and Timing | |||
| Was there an appropriate interval between index test and reference standard? | No | ||
| Did all patients receive the same reference standard? | Yes | ||
| Were all patients included in the analysis? | Yes | ||
| Unclear | |||
| Study characteristics | |||
| Patient sampling | Study design: retrospective analysis of the longitudinal data. Retrospective MCI group of 108 participants was recruited consecutively in a previous prospective study from the university memory clinic over 24 months. Participants were excluded if they had a history or presence of neurological signs of major stroke | ||
| Patient characteristics and setting | 90 participants, who had been diagnosed by the Petersen 1999 criteria at baseline and had follow‐up assessment, were included in the study. The remaining 18 participants were not included in the study because they lacked follow‐up assessment due to refusal (n = 16) or logistic problems (n = 2). CSF was obtained only from 64 participants. Demographic data were reported on 90 participants. Gender: 37 men; 53 women Age: mean 72.05 years; MCI‐MCI: 70.09 ± 7.1; MCI‐AD: 72.2 ± 7.1; MCI‐nAD: 25.5 ± 1.9 APOE ϵ4 carrier: 35; MCI‐MCI: 19; MCI‐AD: 14; MCI‐nAD: 2 MMSE: MCI‐MCI: 26.3 ± 1.9; MCI‐AD: 26.4 ± 1.6; MCI‐other dementia: 73.0 ± 7.1 Sources of recruitment: secondary care, outpatients from Translational Outpatient Memory Clinic (TOMC), Brescia, Italy | ||
| Index tests | CSF t‐tau CSF was obtained by lumbar tap between L4 and L5 or L3 and L4 and processed, as detailed elsewhere (Frisoni 2009). Levels of CSF proteins were determined by commercially available enzyme‐linked immunosorbent assay (Innogenetics, Belgium). Threshold: > 450 pg/mL for subjects with an age range between 51 and 70 years determined; > 500 pg/mL for subjects with an age range between 71 and 93 years; threshold determined at baseline and based on published criteria (page 2006). Not reported whether the index test results were interpreted without knowledge of the results of the reference standard. | ||
| Target condition and reference standard(s) | Target condition: Alzheimer's disease dementia or other forms of dementia Reference standard: NINCDS‐ADRDA criteria Unclear whether clinicians conducting follow‐up were aware of initial CSF analysis results. | ||
| Flow and timing | Duration of follow‐up: 24.0 ± 9.7 months At follow‐up: 39/90 participants converted to dementia (Abstract) Number included in analyses: 64 24 MCI with 'abnormal CSF t‐tau level': 19 MCI converters and 5 MCI‐MCI; 40 MCI with 'normal CSF t‐tau level': 15 MCI converters and 25 MCI‐MCI (from Dr Galluzzi's email) Conversion to all forms of dementia: TP = 19; FP = 5; FN = 15; TN = 25 sensitivity = 56%; specificity = 83% Loss to follow‐up: 26 (24 participants refused the LP procedure; 2 LPs were not performed due to osteoarthrosis). | ||
| Comparative | |||
| Notes | The trial investigators were contacted; they provided data tor the 2 X 2 table to be completed for conversion to all forms of dementia. Normative data for CSF p‐tau and CSF t‐tau/ABeta ratio were not available (email from Dr Galluzi on 9/12/13). | ||
| Methodological quality | |||
| Item | Authors' judgement | Risk of bias | Applicability concerns |
| DOMAIN 1: Patient Selection | |||
| Was a consecutive or random sample of patients enrolled? | Yes | ||
| Was a case‐control design avoided? | Yes | ||
| Did the study avoid inappropriate exclusions? | Yes | ||
| Low | Low | ||
| DOMAIN 2: Index Test All tests | |||
| Were the index test results interpreted without knowledge of the results of the reference standard? | Unclear | ||
| If a threshold was used, was it pre‐specified? | Yes | ||
| Unclear | Low | ||
| DOMAIN 3: Reference Standard | |||
| Is the reference standards likely to correctly classify the target condition? | Yes | ||
| Were the reference standard results interpreted without knowledge of the results of the index tests? | Unclear | ||
| Unclear | Low | ||
| DOMAIN 4: Flow and Timing | |||
| Was there an appropriate interval between index test and reference standard? | Yes | ||
| Did all patients receive the same reference standard? | Yes | ||
| Were all patients included in the analysis? | No | ||
| High | |||
| Study characteristics | |||
| Patient sampling | Study design: retrospective analysis of the longitudinal data. The MCI group was not a consecutive sample. Retrospective recruitment of 52 participants with MCI: 29 MCI converters and 23 MCI‐stable participants. In addition, 93 participants with probable AD and 10 healthy, age‐matched controls were recruited from a hospital rehabilitation department. We only included data on performance of the index test to discriminate between participants with MCI who converted to dementia and those who remained stable.The MCI group was not a consecutive sample and was selected at follow‐up. No exclusion criteria were specified. | ||
| Patient characteristics and setting | 52 MCI participants diagnosed by the Petersen 1991 criteria at baseline. Gender: 24 men; 28 women Age: mean age 72.6 years (range 54 to 87) APOE ϵ4 carrier: not reported MMSE (all MCI): 28.9 ± 1 (range 26 to 30) Sources of referral: not reported Sources of recruitment: secondary care, inpatients from Department of Rehabilitation, Pitea, Sweden | ||
| Index tests | CSF t‐tau biomarker CSF samples were taken by lumbar puncture, collected in polypropylene tubes, and stored at ‐80 ºC. T‐tau was measured in duplicate using a commercial ELISA (Innotest beta‐amyloid 1‐42, Innogenetics, Belgium). Threshold(s): ≥ 479 ng/L, established in the MCI‐MCI vs MCI‐AD at follow‐up (page 707) At follow‐up: 14 with 'normal CSF t‐tau level' and 38 with 'abnormal CSF t‐tau level' (calculated in RevMan5). Unclear whether the index test results were interpreted without knowledge of the results of the reference standard. | ||
| Target condition and reference standard(s) | Target condition: Alzheimer's disease dementia Reference standard: NINCDS‐ADRDA criteria; DSM‐IV criteria. All MCI participants were assessed with both reference standards. Unclear whether clinicians conducting follow‐up a were aware of initial CSF analysis results. | ||
| Flow and timing | Duration of follow‐up: mean 8.4 ± 5.1 months (range 2 to 24 months); follow‐up interval for converters was 9.6 ± 5.4, and for non‐converters 7.0 ± 4.3 months At follow‐up: 52 MCI: 29 MCI‐AD; 23 MCI‐MCI (page 94) Number included in analysis (N=52) Conversion to Alzheimer's disease dementia: sensitivity 90%; specificity 48% (page 707); disease positive: 29; disease negative: 23 TP = 26; FP = 12; FN = 3; TN = 11 (calculated in RevMan5) Loss to follow‐up: data for all 52 MCI participants were reported | ||
| Comparative | |||
| Notes | |||
| Methodological quality | |||
| Item | Authors' judgement | Risk of bias | Applicability concerns |
| DOMAIN 1: Patient Selection | |||
| Was a consecutive or random sample of patients enrolled? | No | ||
| Was a case‐control design avoided? | Yes | ||
| Did the study avoid inappropriate exclusions? | Unclear | ||
| High | Low | ||
| DOMAIN 2: Index Test All tests | |||
| Were the index test results interpreted without knowledge of the results of the reference standard? | Unclear | ||
| If a threshold was used, was it pre‐specified? | No | ||
| High | Low | ||
| DOMAIN 3: Reference Standard | |||
| Is the reference standards likely to correctly classify the target condition? | Yes | ||
| Were the reference standard results interpreted without knowledge of the results of the index tests? | Unclear | ||
| Unclear | Low | ||
| DOMAIN 4: Flow and Timing | |||
| Was there an appropriate interval between index test and reference standard? | No | ||
| Did all patients receive the same reference standard? | Yes | ||
| Were all patients included in the analysis? | Yes | ||
| Unclear | |||
| Study characteristics | |||
| Patient sampling | Study design: nested case‐control study with a delayed verification design. Prospective cohort of 180 participants with MCI, who had sought medical advice for subjective memory difficulties, was consecutively recruited at a university hospital between July 1998 and June 2001. 39 healthy controls were also included, but appeared to have been used for comparison purposes only and not included in the ROC analysis. Patients with other causes of cognitive impairment, including brain tumour, subdural haematoma, CNS infection, and current alcohol abuse, were excluded. | ||
| Patient characteristics and setting | 137 MCI participants, diagnosed by the Petersen 1999 and Petersen 2004 criteria, underwent successful lumbar puncture. Baseline demographic data reported for 134 participants. Of the 43 participants with MCI who did not undergo successful lumbar puncture at baseline, 32 preferred not to go through the procedure and in 11 the procedure did not deliver usable CSF. GENDER: 60 men; 73 women AGE (median (range)): MCI‐MCI (stable): 67 (50 to 86) years; MCI‐AD 75 (59 to 85) years; MCI‐other dementia 76 (54 to 82) years APOE ϵ4 carrier: MCI‐MCI (stable): 28 (50%); MCI‐AD 43 (75%); MCI‐other dementia 6 (29%) MMSE: mean ± SD: MCI‐MCI (stable) 27.3 ± 1.8; MCI‐AD 26.8 ± 1.4; MCI‐other dementia 27.0 ± 1.5 Education (higher): MCI‐MCI (stable): 26 (46%); MCI‐AD 18 (32%); MCI‐other dementia 10 (48%) Sources of referral: most participants (75%) by family practitioners Sources of recruitment: secondary care, outpatients from memory disorder clinic, University hospital, Malmo, Sweden | ||
| Index tests | CSF t‐tau; CSF p‐tau; CSF p‐tau/ABeta ratio CSF samples were obtained and stored in polypropylene tubes at –80ºC, and analysed after the clinical follow‐up of the study was completed. T‐tau, tau phosphorylated at threonine 181 (P‐tau181), and ABeta42 concentrations were measured with xMAP technology and the INNOBIA AkzBio3 kit (innogenetics), as previously described in detail (Olssson 2005). The CSF concentrations of t‐tau, p‐tau181, and ABeta42 were highly correlated to the concentrations obtained with conventional ELISA measurements. The best cutting values for the different combinations of the CSF biomarkers were established in the whole control and MCI patient material as those giving the highest Youden index (Youden 1950). Threshold: > 350 pg/mL for CSF t‐tau; ≥ 60 pg/mL for CSF p‐tau; < 6.5 pg/mL for CSF p‐tau/ABeta It was not reported whether the index test results were interpreted without knowledge of the results of the reference standard. | ||
| Target condition and reference standard(s) | Target condition: Alzheimer's disease dementia or other forms of dementia Reference standards: NINCDS‐ADRDA and DSM‐III‐R for Alzheimer's disease dementia; NINDS‐AIREN and DSM‐III‐R for vascular dementia; McKeith for Lewy bodies dementia and Brun for frontotemporal dementia. Clinicians making the diagnosis during follow‐up were unaware of all CSF analyses. | ||
| Flow and timing | Duration of follow‐up: total sample: median 5.2 years (range 4.0 to 6.8); MCI‐AD: median: 4.3 years (range 1.1 to 6.7); MCI‐other dementias: median 4.2 (1.5 to 6.3) CSF t‐tau At baseline: 137 MCI participants with CSF sample At follow‐up: 134: 38 MCI with baseline positive CSF t‐tau: 29 MCI‐AD; 4 MCI‐other dementias; 5 MCI‐MCI; 96 MCI with baseline negative CSF t‐tau: 28 MCI‐AD; 17 MCI‐other dementias; 51 MCI‐MCI Number included in analysis: 134 1) Conversion to AD: TP = 29; FP = 9; FN = 28; TN = 68; sensitivity = 51%; specificity = 88% (calculated in Revman5) 2) Conversion to all dementias: TP = 33; FP = 5; FN = 45; TN = 51; sensitivity = 42%; specificity = 91% (calculated in Revman5) CSF p‐tau At baseline: 137 MCI participants with CSF sample At follow‐up: 134: 50 CSF p‐tau positive: 39 MCI‐AD; 2 MCI‐other dementias; 9 MCI‐MCI; 84 CSF p‐tau negative: 18 MCI‐AD; 19 MCI‐other dementias; 47 MCI‐MCI Number included in analysis: 134 1) Conversion to AD: TP = 39; FP = 11; FN = 18; TN = 66; sensitivity = 68%; specificity = 86% (calculated in Revman5) 2) Conversion to all dementias: TP = 41; FP = 9; FN = 37; TN = 47; sensitivity = 52%; specificity = 84% (calculated in Revman5) CSF p‐tau/Aß ratio At baseline: 137 MCI participants with CSF sample At follow‐up: 134: 74 CSF p‐tau/ABeta positive: 55 MCI‐AD; 4 MCI‐other dementias; 15 MCI‐MCI; 60 CSF p‐tau/ABeta negative: 2 MCI‐AD; 17 MCI‐other dementias; 41 MCI‐MCI Number included in analysis: 134 1) Conversion to AD: TP = 55; FP = 19; FN = 2; TN = 58; sensitivity = 96%; specificity = 75% (calculated in Revman5) 2) Conversion to all dementias: TP = 59; FP = 15; FN = 19; TN = 41; sensitivity = 76%; specificity = 73% (calculated in Revman5) Loss to follow‐up: initially identified 180 consecutive participants with MCI; 43/180 not included in the study: 32 refused lumbar puncture and 11 non‐usable CSF samples; 3 participants died before 4 years of follow‐up (not included in the analysis) | ||
| Comparative | |||
| Notes | The trial investigators contacted; they provided relevant data for creating 2 X 2 table items (email on 29/11/13). | ||
| Methodological quality | |||
| Item | Authors' judgement | Risk of bias | Applicability concerns |
| DOMAIN 1: Patient Selection | |||
| Was a consecutive or random sample of patients enrolled? | Yes | ||
| Was a case‐control design avoided? | Yes | ||
| Did the study avoid inappropriate exclusions? | Yes | ||
| Low | Low | ||
| DOMAIN 2: Index Test All tests | |||
| Were the index test results interpreted without knowledge of the results of the reference standard? | Unclear | ||
| If a threshold was used, was it pre‐specified? | No | ||
| High | Low | ||
| DOMAIN 3: Reference Standard | |||
| Is the reference standards likely to correctly classify the target condition? | Yes | ||
| Were the reference standard results interpreted without knowledge of the results of the index tests? | Yes | ||
| Low | Low | ||
| DOMAIN 4: Flow and Timing | |||
| Was there an appropriate interval between index test and reference standard? | Yes | ||
| Did all patients receive the same reference standard? | Yes | ||
| Were all patients included in the analysis? | No | ||
| High | |||
| Study characteristics | |||
| Patient sampling | Study design: nested case‐control study with delay verification design. Participants examined in a university hospital neurological department, or from an ongoing population‐based study were prospectively recruited if they agreed to a lumbar puncture for research purposes and had a baseline diagnosis of MCI; 79 participants met these criteria. 60 controls (who were referred to the neurological department for different symptoms, or who were included in the population‐based study and had depression with normal performance in neuropsychological tests) were also included. We only included data on performance of the index test to discriminate between participants with MCI who converted to dementia and those who remained stable. No exclusion criteria were specified. | ||
| Patient characteristics and setting | 79 MCI participants diagnosed by the CDR = 0.5 criteria at baseline. Gender: 33 men; 46 women Age: 70.56 years; MCI‐MCI: 69.46֨ ± 8.14; MCI‐progressive: 71.76 ± 6.71 APOE ϵ4 carrier: 41; MCI‐MCI: 15/45 (33.3%); MCI‐progressive: 26/33 (78.8%) MMSE: MCI‐MCI: 24.09 ± 2.49; MCI‐progressive: 23.91 ± 2.69 Sources of recruitment: secondary care, inpatients from neurological department, Kuopio University Hospital, Finland | ||
| Index tests | CSF t‐tau; CSF p‐tau The CSF samples were collected by LP during the baseline visit. The samples were stored in polypropylene tubes at ‐70 °C until analysis. The measurement of CSF t‐tau and CSF P‐tau were done by using a commercial ELISA (Innogenetics, Belgium), blinded to the diagnoses. Threshold: > 400 pg/mL for CSF t‐tau; > 70 pg/L for CSF P‐tau; thresholds determined at baseline using previously published cutoff values from the ROC analysis (Herruka 2005) Index test was conducted at baseline and interpreted blinded to the diagnoses of APOE genotype. | ||
| Target condition and reference standard(s) | Target condition: Alzheimer's disease dementia or other forms of dementia Reference standard: NINCDS‐ADRDA for Alzheimer's disease dementia; DSM‐IV‐R criteria for other dementias Diagnosis of dementia was done independently and blinded to CSF biomarker results. | ||
| Flow and timing | Duration of follow‐up: mean 3.52 ± 1.95 years in MCI converters; mean 4.56 ± 3.09 years in MCI‐stable At follow‐up:79 MCI: 33 MCI converters (27 MCI‐AD; 1 MCI‐SVD; 5 MCI‐MD); 46 MCI‐MCI (page 509) Number included in analyses = 79 Conversion from MCI to all dementias (Fig 1, page 510): 1) CSF t‐tau: TP = 26, FP = 17, FN = 7, TN = 29; sensitivity = 79%; specificity = 63% (calculated in Revman5) 2) CSF P‐tau:TP = 25, FP = 16, FN = 8, TN = 30; sensitivity = 76%; specificity = 65% (calculated in Revman5) Loss to follow‐up: CSF marker and follow‐up data appeared to have been available for all participants. | ||
| Comparative | |||
| Notes | |||
| Methodological quality | |||
| Item | Authors' judgement | Risk of bias | Applicability concerns |
| DOMAIN 1: Patient Selection | |||
| Was a consecutive or random sample of patients enrolled? | No | ||
| Was a case‐control design avoided? | Yes | ||
| Did the study avoid inappropriate exclusions? | Unclear | ||
| High | Low | ||
| DOMAIN 2: Index Test All tests | |||
| Were the index test results interpreted without knowledge of the results of the reference standard? | Yes | ||
| If a threshold was used, was it pre‐specified? | Yes | ||
| Low | Low | ||
| DOMAIN 3: Reference Standard | |||
| Is the reference standards likely to correctly classify the target condition? | Yes | ||
| Were the reference standard results interpreted without knowledge of the results of the index tests? | Yes | ||
| Low | Low | ||
| DOMAIN 4: Flow and Timing | |||
| Was there an appropriate interval between index test and reference standard? | Yes | ||
| Did all patients receive the same reference standard? | Yes | ||
| Were all patients included in the analysis? | Yes | ||
| Low | |||
| Study characteristics | |||
| Patient sampling | Study design: retrospective analysis of the longitudinal data 153 participants with available CSF results and APOE ϵ4 genotyping were diagnosed with MCI in the memory clinic in the period between January 2001 and May 2008. 107 of those 153 participants had follow‐up data available and were retrospectively recruited. No exclusion criteria were reported. | ||
| Patient characteristics and setting | 107 MCI participants diagnosed by the Petersen 1991 criteria at baseline. Baseline demographic data reported for 100 participants, who were included in the analysis. Gender: 59 men; 41 women. MCI‐MCI: 38 men; 20 women; MCI‐AD: 21 men; 21 women Age: 67 ± 9 years MCI‐MCI; 69 ± 7 years MCI‐AD APOE ϵ4 carrier: 27/58 MCI‐MCI; 30/42 MCI‐AD MMSE: 27 ± 2 MCI‐MCI; 26 ± 3 MCI‐AD Sources of referral: not reported Sources of recruitment: secondary care, outpatients from memory clinic, Amsterdam, the Netherlands | ||
| Index tests | CSF t‐tau biomarker CSF was obtained by lumbar puncture between the L3/L4 and L4/L5 intervertebral space and collected in10 mL polypropylene tubes. CSFsamples were processed within 2 hours (centrifuged at 1800 × g for 10 min at 4 °C and stored at ‐80 °C in polypropylene tubes until analysis). CSF t‐tau was measured using a commercial sandwich ELISA (Innotest). Threshold(s): > 356 pg/mL abnormal level; determined at baseline and based on published data (Schoonenboom 2005) The index test results were interpreted without knowledge of the results of the reference standard. | ||
| Target condition and reference standard(s) | Target condition: Alzheimer's disease dementia or other forms of dementia Reference standard: NINCDS‐ADRDA criteria for Alzheimer's disease dementia; Neary 1998 criteria; Roman 1993 criteria; McKeth 2005 criteria Not reported whether clinicians conducting follow‐up were aware of CSF biomarker results. | ||
| Flow and timing | Duration of follow‐up: median 18 months (IQR 13 to 24); for MCI converters, the median was 17 months (IQR 13 to 24); for MCI‐stable the median was 18 months (IQR 12 to 25). At follow‐up: 107 MCI: 49 MCI converters (42 MCI‐AD; 3 MCI‐FTD, 2 MCI‐VD; 1 MCI‐LBD; 1 MCI‐dementia due to hydrocephalus); 58 MCI‐MCI (page 1373). Number included in analyses: 100 MCI: 42 MCI‐AD and 58 MCI‐MCI 36 with 'normal' CSF t‐tau level and 64 with 'abnormal' CSF t‐au level (Table 1, page 1374) Conversion to AD: TP = 35; FP = 29; FN = 7; TN = 29; sensitivity = 83%; specificity = 50% (calculated in Revman5) Missing data: 7 MCI participants who converted to other forms of dementia were excluded from the analysis. | ||
| Comparative | |||
| Notes | |||
| Methodological quality | |||
| Item | Authors' judgement | Risk of bias | Applicability concerns |
| DOMAIN 1: Patient Selection | |||
| Was a consecutive or random sample of patients enrolled? | No | ||
| Was a case‐control design avoided? | Yes | ||
| Did the study avoid inappropriate exclusions? | Unclear | ||
| High | Low | ||
| DOMAIN 2: Index Test All tests | |||
| Were the index test results interpreted without knowledge of the results of the reference standard? | Yes | ||
| If a threshold was used, was it pre‐specified? | Yes | ||
| Low | Low | ||
| DOMAIN 3: Reference Standard | |||
| Is the reference standards likely to correctly classify the target condition? | Yes | ||
| Were the reference standard results interpreted without knowledge of the results of the index tests? | Unclear | ||
| Unclear | Low | ||
| DOMAIN 4: Flow and Timing | |||
| Was there an appropriate interval between index test and reference standard? | Yes | ||
| Did all patients receive the same reference standard? | Yes | ||
| Were all patients included in the analysis? | No | ||
| High | |||
| Study characteristics | |||
| Patient sampling | Study design: nested case‐control study with a delayed verification design. Prospective MCI group of 15 participants with aMCI and 22 healthy controls were included. We only included data on performance of the index test to discriminate between participants with MCI who converted to dementia and those who remained stable. Sampling procedure and exclusion criteria not described. | ||
| Patient characteristics and setting | 15 participants diagnosed by the Petersen 1999 criteria. GENDER: 9 men; 6 women AGE (y): mean age 71.1 ± 7.2 APOE ϵ4 carrier (%): not reported MMSE: 25.1 (range 18 to 30) Education: not reported Sources of referral: not reported Sources of recruitment: not reported. The study was conducted in Finland. | ||
| Index tests | CSF t‐tau; CSF p‐tau; CSF p‐tau/ABeta42 CSF sample was collected by lumbar puncture into polypropylene tubes and stored at –70 °C until analysis. The CSF levels of ABeta42, total tau and p tau (181P) were measured by a commercial ELISA (Innogenetics, Ghent, Belgium) according to the manufacturer’s protocol. Threshold: CSF t‐tau > 400 pg/mL; CSF p‐tau < 70 pg/mL; CSF p‐tau/ABeta42 < 6.5 pg/mL. The cut‐off values used were based on the own control material. No further information. Index test was conducted before clinical follow‐up. The ELISA analyses were done blinded to the diagnosis. | ||
| Target condition and reference standard(s) | Target condition: conversion from MCI to Alzheimer's dementia Reference standard: NINCS‐ADRDA criteria; DSM‐IV criteria Not reported whether clinicians conducting follow‐up were aware of CSF biomarkers' results. | ||
| Flow and timing | Duration of follow‐up: 2 years At baseline: 15 MCI participants (10 CSF t‐tau abnormal tests; 9 CSF p‐tau abnormal tests; 9 CSF p‐tau/ABeta42 abnormal tests) (abstract) At follow‐up: 15 MCI: 6 MCI‐AD (3 CSF t‐tau abnormal tests; 3 CSF p‐tau abnormal tests; 4 CSF p‐tau/ABeta42 abnormal tests); 9 MCI‐MCI (stable) (page 381) Number included in analysis: 14 Conversion to Alzhemer's disease dementia: CSF p‐tau: TP = 2; FP = 7; FN = 3; TN = 2; sensitivity = 40%; specificity = 22% (calculated in Revman5) CSF p‐tau/ABeta42: TP = 4; FP = 6; FN = 1; TN = 3; sensitivity = 80%; specificity = 33% (calculated in Revman5) Loss to follow‐up: CCF p‐tau result was not available for one MCI‐AD participant | ||
| Comparative | |||
| Notes | The trial investigators were contacted and asked for the relevant data for CSF t‐tau (email on 30/12/13). No further information was available at the time this review was prepared. | ||
| Methodological quality | |||
| Item | Authors' judgement | Risk of bias | Applicability concerns |
| DOMAIN 1: Patient Selection | |||
| Was a consecutive or random sample of patients enrolled? | Unclear | ||
| Was a case‐control design avoided? | Yes | ||
| Did the study avoid inappropriate exclusions? | Unclear | ||
| High | Unclear | ||
| DOMAIN 2: Index Test All tests | |||
| Were the index test results interpreted without knowledge of the results of the reference standard? | Yes | ||
| If a threshold was used, was it pre‐specified? | Yes | ||
| Low | Low | ||
| DOMAIN 3: Reference Standard | |||
| Is the reference standards likely to correctly classify the target condition? | Yes | ||
| Were the reference standard results interpreted without knowledge of the results of the index tests? | Unclear | ||
| Unclear | Low | ||
| DOMAIN 4: Flow and Timing | |||
| Was there an appropriate interval between index test and reference standard? | Yes | ||
| Did all patients receive the same reference standard? | Yes | ||
| Were all patients included in the analysis? | No | ||
| Unclear | |||
| Study characteristics | |||
| Patient sampling | Study design: nested case‐control study with a delayed verification design Prospective MCI group of 37 MCI participants, attending the cognitive deterioration outpatients clinic of a general hospital, and 24 control subjects without subjective memory loss or known cognitive deterioration were recruited. No further details. We only included data on performance of the index test to discriminate between participants with MCI who converted to dementia and those who remained stable. Participants with dementia or other neurological, psychiatric or medical disease which could provoke cognitive deterioration, anticoagulant therapy, failure to obtain informed consent, or a Yesavage depression scale score > 5 were excluded. | ||
| Patient characteristics and setting | 37 participants diagnosed by the Petersen 2006 criteria at baseline; Gender: 13 men; 24 women; MCI‐MCI: 11 men, 15 women; MCI‐AD: 2 men, 9 women Age: mean 73.43 ± 6.63 years APOEϵ4 carrier: not reported MMSE: mean 25 ± 2.4; MCI‐AD: mean 23 ± 1.2 Sources of recruitment: secondary care, outpatients from General Hospital, Spain | ||
| Index tests | CSFt‐tau; CSF p‐tau; CSF t‐tau/ABeta ratio; CSF p‐tau/ABeta ratio The LP was performed by a hospital neurologist with a 20 X 3.5 gauge needle. CSF was collected in standard tubes and centrifuged if little sanguinolent, before being frozen. CSF samples with obvious blood were discarded. CSF biomarkers were analysed using xMAP Luminex technology and INNO‐BIA Alzbio3 reagents (Innogenetics, Belgium). Threshold(s): 77.5 pg/mL for CSF t‐tau; 54.5 for CSF P‐tau; 0.18 for CSF t‐tau/ABeta ratio; 0.17 for CSF P‐tau/ABeta ratio (Table 6, page 990); thresholds determined at follow‐up: ROC curve analysis was performed to determine the best cutoff values for measurement of variables. The best cutoff value was defined taking into account the highest sensitivity. Index test was conducted before clinical follow‐up and all samples were blindly analysed with respect to the clinical data. | ||
| Target condition and reference standard(s) | Target condition: conversion to Alzheimer's disease dementia Reference standard: NINCDS‐ADRDA criteria Unclear whether clinicians conducting follow‐up were aware of CSF biomarker results | ||
| Flow and timing | Duration of follow‐up: 6 months At baseline: 37 MCI At follow‐up: 11 MCI‐AD; 26 MCI‐MCI (Table 1, p 989) Number included in analyses=37 Conversion to Alzheimer's disease dementia: 1) CSF t‐au: sensitivity 72.7%; specificity 70% (Table 6, page 990) TP = 8, FP = 8, FN = 3, TN = 18 (calculated in RevMan5) 2) CSF p‐tau: sensitivity 82%; specificity 58% (Table 6, page 990) TP = 9, FP = 11, FN = 2, TN = 15 (calculated in RevMan5) 3) CSF t‐tau/ABeta ratio: sensitivity 91%; specificity 50% (Table 6, page 990) TP = 10, FP = 13, FN = 1, TN = 13 (calculated in RevMan5) 4) CSF p‐tau/ABeta ratio: sensitivity 82%; specificity 66% (Table 6, page 990) TP = 9, FP = 9, FN = 2, TN = 17 (calculated in RevMan5) Loss to follow‐up: CSF marker and follow‐up data appeared to have been available for all participants. | ||
| Comparative | |||
| Notes | |||
| Methodological quality | |||
| Item | Authors' judgement | Risk of bias | Applicability concerns |
| DOMAIN 1: Patient Selection | |||
| Was a consecutive or random sample of patients enrolled? | Unclear | ||
| Was a case‐control design avoided? | Yes | ||
| Did the study avoid inappropriate exclusions? | Yes | ||
| Unclear | Low | ||
| DOMAIN 2: Index Test All tests | |||
| Were the index test results interpreted without knowledge of the results of the reference standard? | Yes | ||
| If a threshold was used, was it pre‐specified? | No | ||
| High | Low | ||
| DOMAIN 3: Reference Standard | |||
| Is the reference standards likely to correctly classify the target condition? | Yes | ||
| Were the reference standard results interpreted without knowledge of the results of the index tests? | Unclear | ||
| Unclear | Low | ||
| DOMAIN 4: Flow and Timing | |||
| Was there an appropriate interval between index test and reference standard? | No | ||
| Did all patients receive the same reference standard? | Yes | ||
| Were all patients included in the analysis? | Yes | ||
| Unclear | |||
| Study characteristics | |||
| Patient sampling | Study design: prospective cohort study 133 participants were ”randomly recruited” among those fulfilling the MCI criteria who were referred to the memory clinic between 2000 and 2006. There were several people during this period who were not included due to administrative causes (information from the author). Exclusion criteria were not described. | ||
| Patient characteristics and setting | 133 MCI participants, diagnosed with the Petersen 2004 criteria, were recruited from the Memory Clinic of University Hospital in Malmo, Sweden. At the initial visit, all participants were assessed by physicians experienced in dementia disorders, and underwent thorough physical, psychiatric and neurological examinations, as well as an interview that focused on their cognitive symptoms and ADL function. Gender: MCI‐MCI: 34 women, 28 men; MCI‐AD: 36 women, 16 men; MCI‐other dementias: 8 women, 11 men Age (y): MCI‐MCI: mean 69.8 (range 55 to 85); MCI‐AD: 75.3 (range 55 to 87); MCI‐other dementias: 71.2 (59 to 83) APOEϵ4 carrier (%): MCI‐MCI: 28 (45); MCI‐AD: 39 (76); MCI‐other dementias: 12 (63) MMSE: MCI‐MCI: mean 28.1 ± 1.2; MCI‐AD: mean 26.1 ± 1.5; MCI‐other dementias: mean 27.1 ± 2.0 Education: not reported Sources of referral: most participants were referred from primary care units, but some referrals came from other clinics at the hospital. Sources of recruitment: memory clinic, Sweden | ||
| Index tests | CSF t‐tau; CSF p‐tau; CSF t‐tau/ABeta ratio CSF was collected at baseline in polypropylene tubes and gently mixed to avoid gradient effects. All samples were centrifuged within 30 minutes at +4 uC at 2000 g for 10 min to remove cells and debris. Samples were stored in aliquots at ‐80 oC pending biochemical analysis. The procedure used and the analysis of the CSF followed the Alzheimer’s Association Flow Chart for lumbar puncture (Blennow 2010) . The Luminex xMAP technology was used to determine the levels of tau, ABeta42 and p‐tau (Ollson 2005). In addition to tau, ABeta42 and p‐tau, the ratio of ABeta42/tau was tested as a separate variable in the logistic regression models since it previously had shown high predictive accuracy in this cohort (Hertze 2010) . Lumbar puncture was only conducted at the initial visit. Threshold: CSF t‐tau: > 87 pg/mL; CSF p‐tau: > 39 pg/mL. The cut‐offs were optimised (page e38639) Not reported whether the index test results were interpreted without knowledge of the results of the reference standard. | ||
| Target condition and reference standard(s) | Target condition: Alzheimer's disease dementia or other forms of dementia Reference standards: NINCDS‐ADRDA for AD; NINDS‐AIREN/Erkinjuntti for VaD; McKeith for DLB Clinicians conducting follow‐up were not aware of CSF biomarker results (page e38639) | ||
| Flow and timing | Duration of follow‐up: mean 5.9 years (range: 3.2 to 8.8) At baseline: 133 MCI participants At follow‐up: 62 MCI‐MCI; 52 MCI‐AD; 19 MCI‐other forms of dementias (Table, 2; page e38639) Number included in analysis: 133 Conversion to Alzheimer's disease dementia: 1) CSF t‐tau: sensitivity = 80%; specificity = 72% (Table, 2; page e38639) TP = 42; FP = 23; FN = 10; TN = 58 (calculated in RevMan5) 2) CSF p‐tau: sensitivity = 67%; specificity = 86% (Table, 2; page e38639) TP = 35; FP = 11; FN = 17; TN = 70 (calculated in RevMan5) Note: the accuracy of the CSF t‐tau/ABeta ratio not reported Loss to follow‐up: none | ||
| Comparative | |||
| Notes | The author contacted regarding the sample procedure (Dr Palmqvist email on 28/2/14). Data for CSF t‐tau/ABeta ratio not available. | ||
| Methodological quality | |||
| Item | Authors' judgement | Risk of bias | Applicability concerns |
| DOMAIN 1: Patient Selection | |||
| Was a consecutive or random sample of patients enrolled? | Yes | ||
| Was a case‐control design avoided? | Yes | ||
| Did the study avoid inappropriate exclusions? | Unclear | ||
| Unclear | Low | ||
| DOMAIN 2: Index Test All tests | |||
| Were the index test results interpreted without knowledge of the results of the reference standard? | Unclear | ||
| If a threshold was used, was it pre‐specified? | No | ||
| High | Low | ||
| DOMAIN 3: Reference Standard | |||
| Is the reference standards likely to correctly classify the target condition? | Yes | ||
| Were the reference standard results interpreted without knowledge of the results of the index tests? | Yes | ||
| Low | Low | ||
| DOMAIN 4: Flow and Timing | |||
| Was there an appropriate interval between index test and reference standard? | Yes | ||
| Did all patients receive the same reference standard? | Yes | ||
| Were all patients included in the analysis? | Yes | ||
| Low | |||
| Study characteristics | |||
| Patient sampling | Study design: nested case‐control study with a delayed verification design 454 participants were consecutively referred to the memory clinic for a first diagnostic assessment of cognitive disturbances during the period 2005 to 2007. A prospective MCI group of 90 participants were recruited. 28 participants with AD were also enrolled in the study. We only included data on performance of the index test to discriminate between participants with MCI who converted to dementia and those who remained stable. No exclusion criteria were specified. | ||
| Patient characteristics and setting | 90 participants diagnosed by the Petersen 1999 criteria at baseline and had follow‐up assessment at least once a year during four years. Gender: total: 66 men; 34 women Age (y): MCI‐MCI: mean 66.35 ± 8.22; MCI‐AD: mean 67.23 ± 9.04 APOE ϵ4 carrier: not reported MMSE: MCI‐MCI: 27.28 ± 1.47; MCI‐AD: 26.66 ± 1.58 Sources of referral: not reported Sources of recruitment: memory clinic, Clinica Neurologica, Universita degli Studi di Perugia, Italy | ||
| Index tests | CSF p‐tau/ABeta1‐42 ratio; CSF t‐tau; CSF p‐tau; CSF t‐tau/ABeta1‐42 ratio Data available only for the CSF p‐tau/ABeta1‐42 ratio. Authors contacted. Lumbar puncture was performed after an overnight fasting. CSF (10 mL) was collected in sterile polypropylene tubes, centrifuged for 10 min at 3000 × g and divided in 0.5 mL aliquots which were immediately frozen at−80 oC. CSF A1‐40 was measured using a commercially available ELISA (IBL International, Japan) following instruction from the manufacturer. CSF ABeta1‐42, total tau, and p‐tau were measured with ELISA method (Innotest ABeta1‐42, hTAU‐Ag, p‐tau 181 Ag, Innogenetics NV, Gent, Belgium) (Andreasen 1999; Blennow 1995) Threshold: 1074.0 for CSF p‐tau/ABeta1‐42 ratio. Cutoff values were calculated using sensitivity and specificity values that maximized Youden’s index (Youden 1950). Not reported whether the index test results were interpreted without knowledge of the results of the reference standard. | ||
| Target condition and reference standard(s) | Target condition: conversion from MCI to Alzheimer's disease. Reference standard: not specified. MCI participants were clinically evaluated at least once a year during 4‐year follow‐up period (p 230). However, it was reported that the NINCDS‐ADRDA criteria were used at baseline to identify AD diagnostic group. | ||
| Flow and timing | Duration of follow‐up (y): mean 3.40 ± 1.01 (maximum 4 years) At baseline: 90 MCI participants At follow‐up: 90 MCI: 32 MCI‐AD; 58 MCI‐MCI (stable); (page 230) Number included in analysis: 90 Conversion to Alzheimer's disease dementia: CSF p‐tau/ABeta1‐42 ratio: sensitivity 81%; specificity 95% (page 233) TP = 26; FP = 3; FN = 6; TN = 55 (calculated in RevMan5) Loss to follow‐up: none | ||
| Comparative | |||
| Notes | Trial investigators contacted. Missing data requested for CSF t‐tau, CSF p tau and CSF t‐tau/ABeta1‐42 ratio biomarkers. No further information was available at the time this review was prepared. | ||
| Methodological quality | |||
| Item | Authors' judgement | Risk of bias | Applicability concerns |
| DOMAIN 1: Patient Selection | |||
| Was a consecutive or random sample of patients enrolled? | Unclear | ||
| Was a case‐control design avoided? | Yes | ||
| Did the study avoid inappropriate exclusions? | Unclear | ||
| Unclear | Low | ||
| DOMAIN 2: Index Test All tests | |||
| Were the index test results interpreted without knowledge of the results of the reference standard? | Unclear | ||
| If a threshold was used, was it pre‐specified? | No | ||
| High | Low | ||
| DOMAIN 3: Reference Standard | |||
| Is the reference standards likely to correctly classify the target condition? | Unclear | ||
| Were the reference standard results interpreted without knowledge of the results of the index tests? | Unclear | ||
| Unclear | Unclear | ||
| DOMAIN 4: Flow and Timing | |||
| Was there an appropriate interval between index test and reference standard? | Yes | ||
| Did all patients receive the same reference standard? | Unclear | ||
| Were all patients included in the analysis? | Yes | ||
| Unclear | |||
| Study characteristics | |||
| Patient sampling | Study design: nested case‐control study with a delayed verification design Prospective group of participants with SCI, naMCI and aMCI were recruited from 20 memory clinics across Europe, between January 2003 and June 2005, into the prospective DESCRIPA cohort study. Neurologically healthy controls were also recruited. Sampling procedure for a MCI cohort not described. We only included data on performance of the index test to discriminate between participants with MCI who converted to dementia and those who remained stable. Exclusion criteria were a diagnosis of dementia or any somatic, psychiatric, or neurological disorder that might have caused the cognitive impairment. | ||
| Patient characteristics and setting | 168/193 participants from the DESCRIPA cohort with an available CSF baseline sample were included in the study. The data overlapped with the data from the Vos 2013 paper. However, we considered different CSF biomarkers in those two studies. Gender: 88 men; 80 women Age (years): 70.0 ± 7.7 naMCI; 70.0 ± 7.7 aMCI; 66.0 ± 7.9 SCI MMSE: 27.6 ± 2.2 naMCI; 25.9 ± 2.8 aMCI; 28.8 ± 1.2 SCI Sources of recruitment: European multicentre memory clinics | ||
| Index tests | CSF p‐tau; CSF p‐tau/ABeta ratio CSF was collected by lumbar puncture, centrifuged, and stored at –80 °C in polypropylene tubes, except where specified. The investigators measured CSF biomarkers with single‐parameter ELISA kits (Innotest β‐amyloid [1–42]; Innotest hTAU‐Ag; Innotest Phospho‐tau [¹⁸¹P]; Innogenetics, Ghent, Belgium). Analyses were done at one laboratory (Clinical Neurochemistry Laboratory, Sahlgrenska University Hospital, Sweden) by operators who were blinded to all clinical information. Threshold (positive test): CSF p‐tau: i) ≥ 51 pg/mL (used in clinic) and ii) ≥ 85 pg/mL (> 90th percentile controls after correction for age); CSF p‐tau/ABeta ratio: ˂ 9.92 (< 10th percentile of reference group after correction for age) | ||
| Target condition and reference standard(s) | Target condition: Alzheimer's disease dementia Reference standard: NINCDS‐ADRDA criteria; DSM‐IV criteria Diagnosis of dementia was conducted blinded to results of CSF biomarker analysis (page 621). | ||
| Flow and timing | Duration of follow‐up: range 1 to 3 years 193 participants in the DESCRIPA cohort had CSF samples collected. Twenty‐five participants were not included in the study: 6 had no neuropsychological test done at baseline; 11 had CSF collected at follow‐up but not at baseline; 8 had insufficient CSF left for central analysis. At baseline: N = 168 (MCI = 108 and SCI = 60) Number included in analysis: N = 158 Conversion to AD: 1.a) CSF p‐tau threshold: ≥ 51 pg/mL (used in clinic). TP = 31; FP = 77; FN = 4; TN = 46 (unpublished data obtained from the author); sensitivity = 88%; specificity = 37% (calculated in Revman5) 1.b) CSF p‐tau threshold: ≥ 85 pg/mL (> 90th percentile controls after correction for age) TP = 20; FP = 25; FN = 15; TN = 98 (unpublished data obtained from the author); sensitivity = 58%; specificity = 80% (calculated in Revman5) 2) CSF p‐tau/ABeta ratio threshold: ˂ 9.92 (< 10th percentile of controls after correction for age) TP = 28; FP = 49; FN = 7; TN = 74 (unpublished data obtained from the author); sensitivity = 80%; specificity = 60% (calculated in Revman5) Loss to follow‐up: 10 (CSF follow‐up data were not available; the reason not given) | ||
| Comparative | |||
| Notes | The trial investigators contacted; they provided requested data tor the 2 x 2 table to be completed; email from Dr Visser on 14/4/14 | ||
| Methodological quality | |||
| Item | Authors' judgement | Risk of bias | Applicability concerns |
| DOMAIN 1: Patient Selection | |||
| Was a consecutive or random sample of patients enrolled? | Unclear | ||
| Was a case‐control design avoided? | Yes | ||
| Did the study avoid inappropriate exclusions? | Yes | ||
| Unclear | Low | ||
| DOMAIN 2: Index Test All tests | |||
| Were the index test results interpreted without knowledge of the results of the reference standard? | Yes | ||
| If a threshold was used, was it pre‐specified? | Yes | ||
| Low | Low | ||
| DOMAIN 3: Reference Standard | |||
| Is the reference standards likely to correctly classify the target condition? | Yes | ||
| Were the reference standard results interpreted without knowledge of the results of the index tests? | Yes | ||
| Low | Low | ||
| DOMAIN 4: Flow and Timing | |||
| Was there an appropriate interval between index test and reference standard? | Yes | ||
| Did all patients receive the same reference standard? | Yes | ||
| Were all patients included in the analysis? | No | ||
| Unclear | |||
| Study characteristics | |||
| Patient sampling | Study design: prospective cohort study 399 participants with aMCI and 226 participants with naMCI from the DESCRIPA cohort and Alzheimer Centre of the VU University medical centre (VUmc). DESCRIPA is a European multicentre study performed in a memory clinic setting and enrolled subjects between 2003 and 2005. For this study, 431 eligible subjects were selected from 16 participating centres in which CSF was collected, MRI was performed, or APOE genotype was determined. The VUmc centre was one of the DESCRIPA centres and contributed an additional sample of 194 subjects that were seen outside the DESCRIPA inclusion period with data on CSF, MRI, or APOE measures. No differences in biomarkers were found between subjects from the VUmc centre in the DESCRIPA study and those from the additional VUmc sample. The sampling procedure was not described. Exclusion criteria were diagnosis of dementia at baseline or any other somatic, psychiatric or neurological disorder that might have caused the cognitive impairment. | ||
| Patient characteristics and setting | 231/635 had available CSF data and were included in the review. 214/235 MCI participants, diagnosed by Petersen 2004 criteria at baseline, had a least one follow‐up assessment. Baseline demographic data reported on all 625 participants. There was some data overlap with the data from the Visser 2009 paper. However, we considered different CSF biomarkers from those two studies. Gender: 270 men; 335 women Age: 70.7 ± 7.6 years naMCI; 70.7 ± 7.8 aMCI MMSE: 27.5 ± 2.1 naMCI; 26.5 ± 2.5 aMCI Sources of recruitment: European multicentre memory clinics | ||
| Index tests | CSF t‐tau; CSF t‐tau/ABeta ratio CSF was collected by lumbar puncture, centrifuged, and stored at ‐80 °C in polypropylene tubes. Three samples were thawed twice but analyses without these samples revealed similar results. CSF ABeta1‐42 and total tau (t‐tau) were measured by experienced technicians using commercially available sandwich ELISAs (Innotest ABeta‐amyloid 1‐42; Innotest hTAU‐Ag; Innogenetics, Ghent, Belgium), specially constructed to measure ABeta‐amyloid 1‐42 and t‐tau, at the lab in Gothenburg for the DESCRIPA cohort and in Amsterdam for the additional subjects of the VUmc cohort. We corrected for inter‐laboratory ELISA differences by analysing 33 samples at both labs and we adjusted VUmc values to those of DESCRIPA using the following formula: Gothenborg = (SD Gothenborg/SD VUmc) * VUmc + average Gothenborg – ((SD Gothenborg/SD VUmc) * average VUmc). Threshold (positive test): CSF t‐tau: > 450 pg/mL for age less than 70 years; > 500 pg/mL for age older than 70 years; CSF t‐tau/ABeta ratio: ABeta1–42/(240 1 [1.18 3 t‐tau]) ˂ 1.0. Index test was conducted before follow‐up. | ||
| Target condition and reference standard(s) | Target condition: Alzheimer's disease dementia Reference standard: NINCDS‐ADRDA criteria; DSM‐IV criteria Diagnosis of dementia was conducted blinded to results of CSF biomarker analysis (page 8). | ||
| Flow and timing | Duration of follow‐up: mean 2.5 years (maximum duration 5 years); follow‐up was performed annually At baseline: 231 MCI At follow‐up: 214 MCI: 91 MCI‐AD; 123 MCI‐MCI Number included in analysis: 214 Conversion to Alzheimer's disease dementia (data obtained from Dr Vos): 1) CSF t‐tau TP = 65; FP = 28; FN = 26; TN = 95; sensitivity = 71%; specificity = 77% 2) CSF t‐tau/ABeta ratio TP = 87; FP = 60; FN = 4; TN = 63; sensitivity = 96%; specificity = 51% Loss to follow‐up: 17 participants did not have a follow‐up assessment (some refused to participate or were untraceable or died before follow‐up) | ||
| Comparative | |||
| Notes | The trial investigators contacted; they provided requested data tor the 2 x 2 table to be completed; email from Dr Vos on 14/4/14 | ||
| Methodological quality | |||
| Item | Authors' judgement | Risk of bias | Applicability concerns |
| DOMAIN 1: Patient Selection | |||
| Was a consecutive or random sample of patients enrolled? | Unclear | ||
| Was a case‐control design avoided? | Yes | ||
| Did the study avoid inappropriate exclusions? | Yes | ||
| Unclear | Low | ||
| DOMAIN 2: Index Test All tests | |||
| Were the index test results interpreted without knowledge of the results of the reference standard? | Yes | ||
| If a threshold was used, was it pre‐specified? | Yes | ||
| Low | Low | ||
| DOMAIN 3: Reference Standard | |||
| Is the reference standards likely to correctly classify the target condition? | Yes | ||
| Were the reference standard results interpreted without knowledge of the results of the index tests? | Yes | ||
| Low | Low | ||
| DOMAIN 4: Flow and Timing | |||
| Was there an appropriate interval between index test and reference standard? | Yes | ||
| Did all patients receive the same reference standard? | Yes | ||
| Were all patients included in the analysis? | No | ||
| Unclear | |||
AD: Alzhemer's disease; ADD: Alzheimer's disease dementia; ADL: activities of daily living; aMCI: amnestic mild cognitive impairment; APOEϵ4: Apolipoprotein E epsilon‐4; CDR: clinical dementia rating; CNS: central nervous system; CSF: cerebrospinal fluid; DLB: Dementia with Lewy Bodies; DSM‐III‐R: Diagnostic and Statistical Manual of Mental Disorders‐III‐Revised; DSM‐IV: Diagnostic and Statistical Manual of Mental Disorders‐IV‐Revised; ELISA: enzyme‐linked immunoabsorbent assay; FTD: fronto‐temporal dementia; GDS: Global Deterioration Scale; IQR: interquartile range; LP: lumbar puncture; MCI: mild cognitive impairment; MMSE: mini‐mental state examination; nAD: non‐Alzheimer's disease; naMCI: non‐amnestic mild cognitive impairment; NINCDS‐ADRDA: National Institute of Neurological and Communicative Disorders and Stroke and the Alzheimer's Disease and Related Disorders Association; NINDS‐AIREN: National Institute of Neurological Disorders and Stroke and Association and Internationale pour la Recherché et l'Enseignement en Neurosciences; ROC: receiver operating characteristics; SCI: subjective cognitive impairment; VaD: vascular dementia
Notes:Mattson 2009 is important and one of the single most defining studies in the field. However, we were not able to include it in our review because there was an overlap between participants in the Mattsson 2009 paper and participants assessed in the seven studies included in our review: Buchhave 2012; Eckerstrom 2010; Hansson 2006; Herukka 2007; Kester 2011; Palmqvist 2012; Visser 2009; therefore, we identified this paper as a ‘multiple publication’ and added it to those seven studies
Characteristics of excluded studies [ordered by study ID]
| Study | Reason for exclusion |
| Not having data for constructing a 2 X 2 table. Study design: target condition was not conversion from MCI to dementia. The focus of the study was to asses relationship between neurodegeneration, amyloid Aß and CSF t‐tau in MCI and healthy elderly controls. ADNI participants. | |
| Not having data for constructing a 2 X 2 table. Study design: threshold not used. The objective of the study was to examine CSF biomarker levels between MCI‐AD converters and MCI‐MCI stable participants. | |
| Not having data for constructing a 2 X 2 table. Study design: threshold not used. Annual changes in CSF biomarker levels were considered.The focus of the study was to asses the effects of age on rates of clinical decline. | |
| Not having data for constructing a 2 X 2 table. Study design: threshold not used. The objective of the study was to examine prediction of progression to Alzheimer's disease and correlation with neuropsychological examination. | |
| ADNI study. Not having data for constructing a 2 X 2 table. Study design: threshold not used. Target condition was not conversion from MCI to dementia. The objective of the study was to empirically assess the concept that Alzheimer's disease biomarkers significantly depart from normality in a temporarily ordered manner. | |
| ADNI study. Not having data for constructing a 2 X 2 table. Study design: threshold not used. Target condition was not conversion from MCI to dementia. The objective of the study was to assess relationship between biomarkers in ageing and dementia. | |
| Insufficient data to complete 2 X 2 tables. Additional data were requested from the trial investigators but no further information was available at the time this review was prepared. | |
| ADNI study. Insufficient data to complete 2 X 2 tables. Additional data were requested from the trial investigators but no further information was available at the time this review was prepared. | |
| Insufficient data to complete 2 X 2 tables. Additional data were requested from the trial investigators but no further information was available at the time this review was prepared | |
| Insufficient data to complete 2 X 2 tables. Additional data were requested from the trial investigators but no further information was available at the time this review was prepared. | |
| Not having data for constructing a 2 X 2 table. Study design: retrospective analysis. The objective of the study was to evaluate changes in biomarker levels between MCI‐AD converters and MCI‐MCI stable participants over time. Participants: 15 MCI‐AD and 15 MCI‐MCI participants selected from a 4‐year follow‐up study. | |
| Insufficient data to complete 2 X 2 tables. Additional data were requested from the trial investigators but no further information was available at the time this review was prepared. | |
| Insufficient data to complete 2 X 2 tables. Additional data were requested from the trial investigators but no further information was available at the time this review was prepared. | |
| ADNI study. Not having data for constructing a 2 X 2 table. Index test: combined CSF biomarkers. The relevant data for each individual CSF biomarker were not available. | |
| Not having data for constructing a 2 X 2 table. Study design: threshold not used. The objective of the study was to examine the pattern of functional impairment in the continuum MCI‐AD. | |
| Not having data for constructing a 2 X 2 table. Study design: threshold not used. The accuracy of CSF t‐tau not evaluated. CSF t‐tau levels measured in different diagnostic groups. | |
| Insufficient data to complete 2 X 2 tables. Additional data were requested from the trial investigators but no further information was available at the time this review was prepared. | |
| ADNI study. Not having data for constructing a 2 X 2 table. Study design: threshold not used. Target condition was not conversion from MCI to dementia. The objective of the study was to develop a semi‐mechanistic disease progression model for MCI participants. | |
| Not having data for constructing a 2 X 2 table. Study design: target condition was not conversion from MCI to dementia. The aim of the study was to test the recommendation of including MCI participants with low CSFamyloid ABeta and high CSF t‐tau/ABeta ratio biomarkers in clinical trials, in order to improve efficiency of the RCT. | |
| ADNI study. Not having data for constructing a 2 X 2 table. The aim of the study was to develop a cerebrospinal fluid biomarker signature for mild Alzheimer's disease in ADNI participants. | |
| Not having data for constructing a 2 X 2 table. Study design: threshold not used. Annual changes in CSF biomarker levels were considered. The focus of the study was to assess the association between CSF biomarker levels and MRI‐based whole brain atrophy rate in MCI and AD. | |
| Not having data for constructing a 2 X 2 table. Study design: threshold not used. The aim of the study was to determine whether baseline CSF biomarker’s levels predict a rate of cognitive change, measured by CDR‐SB (Clinical Dementia Rating Sum of Boxes score) in participants with very mild DAT (CDR = 0.5 and Berg 1998 standard criteria) | |
| Not having data for constructing a 2 X 2 table. Study design: target condition was clinical progression, not conversion from MCI (SMC) to Alzheimer's disease dementia, in participants with cognitive complaints. According to our inclusion criteria, we considered participants with ‘subjective memory complaints’ (Matthew 2008). | |
| Not having data for constructing a 2 X 2 table. Study design: threshold not used. Target condition not conversion from MCI to dementia. The focus of the study was to evaluate changes in CSF levels of tau and p‐tau over time. | |
| ADNI study. Not having data for constructing a 2 X 2 table. Study design: threshold not used. Target condition was not conversion from MCI to Alzheimer's disease dementia. The aim of the study was to assess an overall classification accuracy of biomarkers for diagnostic groups (for instance, controls vs AD), or to assess predictive accuracy of clinical change in MCI. | |
| Not having data for constructing a 2 X 2 table. Study design: threshold not used. Target condition was not conversion from MCI to Alzheimer's disease dementia. The aim of the study was to determine whether CSF proteins were associated with hippocampal degeneration in participants with clinically diagnosed early AD. | |
| ADNI study. Insufficient data to complete 2 X 2 tables. Additional data were requested from the trial investigators. The accuracy of the combination of the three CSF biomarkers (ABeta42, t‐tau and p‐tau) was assessed. The author could not provide us with the relevant data for each individual CSF biomarker. | |
| ADNI study. Not having data for constructing a 2 X 2 table. The accuracy of the combined CSF biomarkers, as well as the accuracy of the combination of those CSF and structural biomarkers were assessed. The relevant data for each individual CSF biomarker were not reported. |
AD: Alzheimer's disease; ADNI: Alzheimer Disease Neuroimaging Initiative; CDR‐SB: Clinical Dementia Rating Sum of Boxes score; DAT: dementia Alzheimer's type; MCI: mild cognitive impairment; SMC: subjective memory complaints
Characteristics of studies awaiting classification [ordered by study ID]
| Study characteristics | |||
| Patient sampling | Study design: nested case‐control study with a delayed verification design. 120 participants with early onset of cognitive impairment (51 MCI; 42 AD; 10 FTD; 3 posterior cortical atrophy; 14 primary progressive aphasia), who were referred to outpatient clinic at the Hospital Clinic Barcelona, were recruited prospectively between January 2009 and March 2013. Thirty‐seven control subjects were also recruited. We only included data on performance of the index test to discriminate between participants with MCI who converted to dementia and those who remained stable. Exclusion criteria: not reported. | ||
| Patient characteristics and setting | 51 participants with MCI (25 amnestic; 20 amnestic multi‐domain; 6 non‐amnestic) diagnosed by Petersen 2004 criteria will be included in an updated review. GENDER: 28 men; 23 women AGE (y): 57.9 ± 6 (range = 37 to 66) APOE 4 carrier (%): 37.5 MMSE (SD): 25.6 ± 6 Education: not reported Sources of referral: not reported Sources of recruitment: Alzheimer’s Disease and Other Cognitive Disorders Unit outpatient clinic at the Hospital Clinic Barcelona, Italy | ||
| Index tests | CSF ABeta42/p‐tau ratio All participants underwent lumbar puncture during the morning. The samples were centrifuged and stored in polypropylene tubes at −80 ºC within 2 hours. Levels of ABeta42, t‐tau, and p‐tau were measured by experienced laboratory personnel using commercial sandwich ELISA kits (Innogenetics, Gent, Belgium). Threshold: prespecified; the ABeta42/p‐tau ratio was used in order to classify all the subjects as CSF positive (ratio ABeta42/p‐tau < 6.43) or negative (ratio ABeta42/p‐tau ≥ 6.43). | ||
| Target condition and reference standard(s) | Target condition: conversion from MCI to Alzheimer’s disease dementia Reference standard: NIA‐AA workgroup recommendations | ||
| Flow and timing | Duration of follow‐up: 41 months for MCI‐AD; 30 months for MCI‐MCI At baseline: 51 MCI: 25 MCI with positive CSF biomarker; 26 MCI with negative CSF biomarker (Figure 1, p 924) At follow‐up: 25 MCI with positive CSF biomarker: 24 MCI‐AD and 1 MCI nonconverters; 26 MCI with negative CSF biomarker: 26 MCI nonconverters; 0 MCI converters; D+ (disease positive) = 24; D‐ (disease negative) = 27 Number to be included in analysis: (N = 51) Conversion to ADD: TP = 24; FP = 1; FN = 0; TN = 26 (Fig 1, p 924) sensitivity = 100%; specificity = 96% (calculated in RevMan5) | ||
| Comparative | |||
| Notes | Authors need to be contacted in order to confirm that our calculation based on the information from Figure 1, p 924 is correct. Participants: MCI participants with early onset of cognitive impairment (age < 65 years). This needs to be taken into consideration if the study is going to be included in an updated review. | ||
| Study characteristics | |||
| Patient sampling | Study design: retrospective analysis of the longitudinal data; this is a sub‐study of the Gothenborg MCI study. We included data on performance of the index test to discriminate between participants with MCI who converted to dementia and those who remained stable. Exclusion criteria: age > 79 or < 40, Mini Mental State Examination (MMSE) score < 19, acute/unstable somatic disease, severe psychiatric disorder, substance abuse or confusion caused by drugs. | ||
| Patient characteristics and setting | 73 participants diagnosed with the Global Deterioration Scale (GDS) criteria (Reisberg 1998) at baseline: 34 MCI converters (18 MCI‐AD; 16 MCI‐non‐AD) and 39 MCI‐stable. GENDER: 14 men and 25 women MCI‐stable; 13 men and 21 women MCI converters AGE (y): 64.4 ± 7.0 MCI‐stable; 66.9 ± 6.9 MCI converters APOE 4 carrier (%): 16/39 (41%) MCI‐stable; 24/34 (71%) MCI converters MMSE: 28.6 ± 1.4 MCI‐stable; 27.6 ± 2.0 MCI converters Education: 12.4 ± 3.8 MCI‐stable; 11.3 ± 4.0 MCI converters Sources of referral: not reported Sources of recruitment: University of Gothenburg, Molndal, Sweden | ||
| Index tests | CSF p‐tau; CSF t‐tau/ABeta42 ratio CSF samples were collected by lumbar puncture, which was performed in the morning to exclude influence on the results from possible diurnal fluctuations in biomarker levels. CSF samples were collected in a polypropylene tube, and immediately transported to the local laboratory for centrifugation. They were stored at −80 ºC, without being thawed and refrozen, pending biochemical analyses. CSF T‐tau, P‐tau181, and ABeta42 levels were determined using sandwich enzyme‐linked immunosorbent assays (INNOTEST® hTau Ag, INNOTEST® PHOSPHO‐TAU(181P), and INNOTEST® !‐AMYLOID(1‐42), respectively) from Innogenetics. Threshold: CSF p‐tau: 73; CSF t‐tau/ABeta42 ratio: 0.85 (p 207); not prespecified. ROC curves were used to calculate the cutoff values based on the maximum for the sum of sensitivity and specificity | ||
| Target condition and reference standard(s) | Target condition: conversion from MCI to Alzheimer’s disease dementia or ‘all dementia’ Reference standard: NINCDS‐ADRDA criteria | ||
| Flow and timing | Duration of follow‐up: 43.1 ± 23 months MCI‐stable; 33.7 ± 24 months MCI converters At baseline: 73 MCI participants At follow‐up: 34 MCI converters (18 MCI‐AD; 16 MCI‐non‐AD) and 39 MCI‐stable. Note: One patient (MCI‐stable) declined LP. Additionally, analysis of CSF p‐tau could not be performed on 9 patients (7 MCI converters, 2 MCI‐stable) due to lack of CSF. Table 2, p 208: CSF p‐tau reported in 63/73 participants; number of MCI participants with the CSF t‐tau/ABeta Beta42 ratio value not reported Number included in analysis: (N = 63) CSF p‐tau: at follow‐up, 27 MCI converters; 36 MCI‐stable; D+ (disease positive) = 27; D‐ (disease negative) = 36 Conversion to ‘all dementia’: sensitivity = 44%; specificity = 92% (Table 3, p 209) TP = 12; FP = 3; FN = 15; TN = 33 (calculated in Revman5) Conversion to ADD: sensitivity = 75%; specificity = 92% (Table 4, p 209) Insufficient data to create 2 X 2 tables. It was not reported in which 7MCI (?MCI‐AD; ?MCI‐non‐AD) CSF p‐tau was not performed. CSF t‐tau/ABeta42 Note: The accuracy data of CSF t‐tau/ABeta42 ratio biomarker not reported | ||
| Comparative | |||
| Notes | Authors need to be contacted in order to obtain missing data. Check with the authors whether the sensitivity and specificity values given in Table 3 and Table 4 relate to a threshold given for CSF p‐tau. | ||
| Study characteristics | |||
| Patient sampling | Study design: nested case‐control study with a delayed verification design Subjects with a complete data set of CSF, MRI and neuropsychological tests were drawn from the ADNI data set including 130 participants with amnestic MCI, 81 participants with AD, and 101 elderly healthy controls. We only included data on performance of the index test to discriminate between participants with MCI who converted to dementia and those who remained stable. Exclusion criteria: not reported. | ||
| Patient characteristics and setting | 130 participants with amnestic MCI will be included in an updated review. Diagnostic criteria for amnestic MCI: subjective memory impairment and objective memory impairment identical to that for AD; a CDR of 0.5 including the memory box score of 0.5 or greater, and a MMSE score between 24 and 30; unimpaired general cognitive ability; functional performance such that participants with MCI did not meet criteria for dementia. GENDER: 44 men and 28 women MCI‐stable; 39 men and 19 women MCI‐AD AGE (y): 73.4 ± 7.4 MCI‐stable; 74.6 ± 7.3 MCI‐AD APOE 4 carrier (%): 46 MCI‐stable; 65.5 MCI‐AD MMSE: 27.4 ± 1.6 MCI‐stable; 26.9 ± 1.8 Education: not reported Sources of referral: not reported Sources of recruitment: ADNI participants | ||
| Index tests | CSF t‐tau; CSF p‐tau All CSF samples collected at the different centres were shipped on dry ice to the Penn ADNI Biomarker Core Laboratory at the University of Pennsylvania, Philadelphia for storage at ‐80 °C until further analysis at the laboratory. The concentration of CSF biomarkers was measured in the baseline CSF samples using Innogenetics reagents (research use only AlzBio3 immunoassay kits, Ghent, Belgium) and the multiplex xMAP Luminex platform (Lumnix Corporation, Austin, TX) at the Penn ADNI Biomarker Core Laboratory Threshold: not reported | ||
| Target condition and reference standard(s) | Target condition: conversion from MCI to Alzheimer’s disease dementia Reference standard: NINCDS‐ADRDA criteria | ||
| Flow and timing | Duration of follow‐up: 2 years At baseline: 130 amnestic MCI At follow‐up: 58 MCI‐AD; 72 MCI‐stable; D+ (disease positive) = 58; D‐ (disease negative) = 72 Number included in analysis: (N = 130) Conversion to ADD: CSF t‐tau Sensitivity = 60.7%; specificity = 58.9% (Table 2, p 1209) TP = 35; FP = 30; FN = 23; TN = 42 (calculated in RevMan5) CSF p‐tau Sensitivity = 63.9%; specificity = 58.9 (Table 2, p 1209) TP = 37; FP = 30; FN = 21; TN = 42 (calculated in RevMan5) | ||
| Comparative | |||
| Notes | Authors need to be contacted in order to obtain threshold's values for CSF biomarkers; also check whether all 130 MCI participants were included in the analysis (Table 2, p 1029) | ||
| Study characteristics | |||
| Patient sampling | Study design: nested case‐control study with a delayed verification design Thirty‐three participants with MCI and thirty‐five participants with AD were recruited from the Department of Geriatric Medicine, Karolinska University Hospital Huddinge, Stockholm, Sweden. We only included data on performance of the index test to discriminate between participants with MCI who converted to dementia and those who remained stable. Exclusion criteria: not reported | ||
| Patient characteristics and setting | 33 participants with MCI diagnosed by Petersen 1999 and Winbald 2004 criteria will be included in an updated review. GENDER: 11 men and 10 women MCI‐stable; 3 men and 9 women MCI‐AD AGE (y): 63.52 ± 8.23 MCI‐stable; 62.33 ± 6.96 MCI‐AD APOE 4 carrier (%): not reported MMSE: not reported Education (y): 13.10 ± 3.24 MCI‐stable; 13.58 ± 3.40 MCI‐AD Sources of referral: not reported Sources of recruitment: Department of Geriatric Medicine, Karolinska University Hospital Huddinge, Stockholm, Sweden | ||
| Index tests | CSF t‐tau; CSF p‐tau; CSF t‐tau/ABeta1‐42 ratio; CSF p‐tau/ABeta1‐42 ratio CSF samples were obtained via lumbar puncture (LP) which was performed under non‐fasting conditions, between 8 and 11 a.m., with a total of 10 mL of CSF collected. After discarding the first 0.5 mL, samples were centrifuged at 1500 × g (3000 to 4000 rpm) for 10 min at +4 ºC. Samples were then stored at –80 ºC in 1 mL portions pending biochemical analysis, without being thawed or refrozen. Levels of CSF biomarkers were determined using commercially available sandwich ELISAs (Innogenetics, Ghent, Belgium). Note: For the MCI group, levels of ABeta1‐42 and t‐tau were obtained for all subjects, with p‐tau181p available for 26 of 33 subjects. Threshold: prespecified; cutoff ˃ 400 pg/mL CSF t‐tau; cutoff ˃ 80 pg/mL CSF p‐tau; cutoff < 1.14 CSF ABeta1‐42/t‐tau ratio; cutoff < 6.5 CSF ABeta1‐42/p‐tau ratio | ||
| Target condition and reference standard(s) | Target condition: conversion from MCI to Alzheimer’s disease Reference standard: NINCDS‐ADRDA criteria | ||
| Flow and timing | Duration of follow‐up: not reported At baseline: 33 MCI At follow‐up: 21 MCI‐stable; 12 MCI‐AD Number included in analysis: (N = 33) Conversion to ADD: CSF t‐tau TP = 8; FP = 7; FN = 4; TN = 14 (Table 2, p 1081) sensitivity = 67%; specificity = 67% (calculated in Revman5) CSF ABeta1‐42/t‐tau ratio TP = 6; FP = 6; FN = 6; TN = 15 (Table 2, p 1081) sensitivity = 50%; specificity = 71% (calculated in Revman5) Number included in analysis: (N = 26) Conversion to ADD: CSF p‐tau CSF ABeta1‐42/p‐tau ratio Insufficient data to create 2 X 2 tables. It was not reported how many MCI‐stable and MCI‐AD were at follow‐up in a group of 26 MCI with available CSF p‐tau biomarkers. | ||
| Comparative | |||
| Notes | Authors need to be contacted in order to obtain missing data for creating 2 X 2 tables for the CSF p‐tau and CSF ABeta1‐42/p‐tau ratio biomarkers. Check with the authors whether the data used in 2 X 2 tables are correctly extracted from Table 2, p 1081 for the CSF t‐tau and CSF ABeta1‐42/t‐tau ratio biomarkers; ask for a length of a follow‐up period. | ||
AD: Alzheimer's disease; ADD: Alzheimer's disease dementia; FTD: fronto‐temporal dementia; GDS: Global Deterioration Scale; LP: lumbar puncture; MCI: mild cognitive impairment; MMSE: mini‐mental state examination; NIA‐AA: National Institute on Aging‐Alzheimer’s Association ;NINDS‐ADRDA: National Institute of Neurological and Communicative Disorders and Stroke and the Alzheimer's Disease and Related Disorders Association
Data
Presented below are all the data for all of the tests entered into the review.
| Test | No. of studies | No. of participants |
| 1 CSF t‐tau conversion to AD dementia Show forest plot | 7 | 709 |
| Test 1  CSF t‐tau conversion to AD dementia. | ||
| 2 CSF p‐tau conversion to AD dementia Show forest plot | 6 | 492 |
| Test 2  CSF p‐tau conversion to AD dementia. | ||
| 3 CSF p‐tau/ABeta ratio to AD dementia Show forest plot | 5 | 433 |
| Test 3 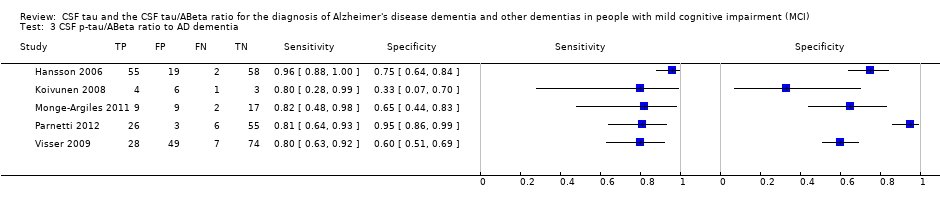 CSF p‐tau/ABeta ratio to AD dementia. | ||
| 4 CSF t‐tau conversion to All dementias Show forest plot | 4 | 319 |
| Test 4 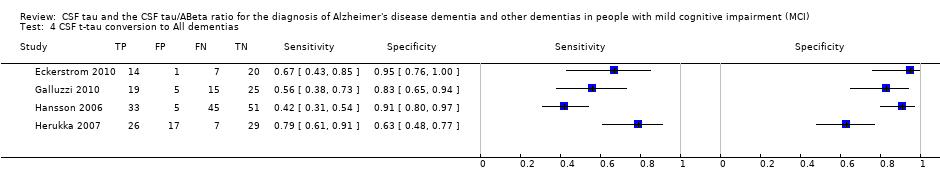 CSF t‐tau conversion to All dementias. | ||
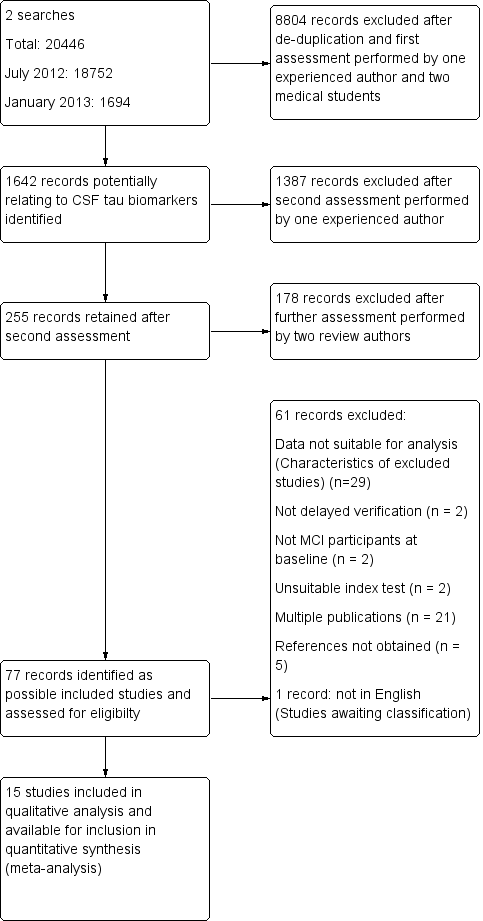
Study flow diagram
Note: a top‐up search performed in December 2015 revealed 6134 records
85 records retained after de‐duplication and assessment by one experienced reviewer
81 records excluded after further assessment performed by two review authors
4 studies identified for possible inclusion (Characteristics of studies awaiting classification)

Risk of bias and applicability concerns summary: review authors' judgements about each domain for each included study

Risk of bias and applicability concerns graph: review authors' judgements about each domain presented as percentages across included studies

Forest plot of 1 CSF t‐tau conversion to AD dementia.

Summary ROC Plot of 1 CSF t‐tau conversion to AD dementia.

Post‐test probability plots (Analysis 1): Conversion from MCI to Alzheimer’s disease for CSF t‐tau as a diagnostic test

Forest plot of 2 CSF p‐tau conversion to AD dementia.

Summary ROC Plot of 2 CSF p‐tau conversion to AD dementia.

Post‐test probability plots (Analysis 2): Conversion from MCI to Alzheimer’s disease for CSF p‐tau as a diagnostic test
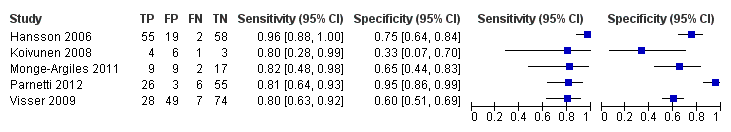
Forest plot of 3 CSF p‐tau/ABeta ratio to AD dementia.

Summary ROC Plot of 3 CSF p‐tau/ABeta ratio to AD dementia.
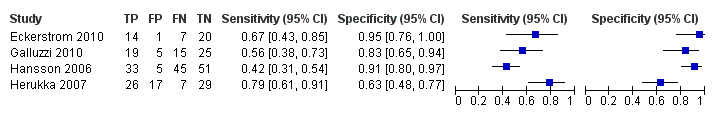
Forest plot of 4 CSF t‐tau conversion to all forms of dementia.
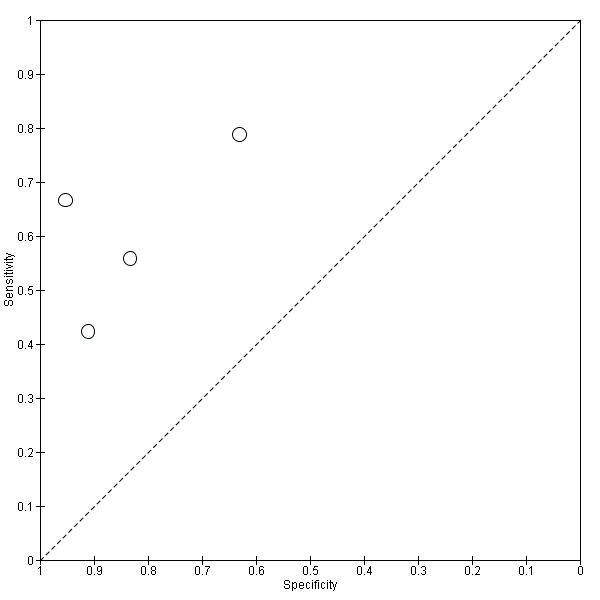
Summary ROC Plot of 4 CSF t‐tau conversion to All dementias.

CSF t‐tau conversion to AD dementia.

CSF p‐tau conversion to AD dementia.

CSF p‐tau/ABeta ratio to AD dementia.

CSF t‐tau conversion to All dementias.
| What is the diagnostic accuracy of CSF biomarker levels for detecting Alzheimer's disease pathology in people with mild cognitive impairment (MCI), and identifying those MCI participants who would convert to Alzheimer’s disease dementia or other forms of dementia over time | |||||||
| Descriptive | |||||||
| Patient population | Participants diagnosed with MCI at baseline using any of the Petersen criteria or CDR = 0.5 or any 16 definitions included by Matthews (Matthews 2008) | ||||||
| Sampling procedure | Consecutive or random (n = 5) Not consecutive or random (n = 3) Unclear (n = 7) | ||||||
| Sources of recruitment | University memory clinic (n = 8); European multicentre memory clinics (n = 2); inpatients (n = 2); General Hospital memory clinic (n = 1); Research centre outpatient memory clinic (n = 1); not reported (n = 1) | ||||||
| Prior testing | The only testing prior to performing the plasma and CSF biomarkers was the application of diagnostic criteria for identifying participants with MCI. | ||||||
| MCI criteria | Petersen criteria (n = 14) Global Deterioration Scale (GDS) (n = 1) | ||||||
| Index tests | CSF t‐tau or CSF p‐tau or CSF p‐tau/ABeta ratio or CSF t‐tau/ABeta ratio | ||||||
| Reference standard | NINCDS‐ADRDA and/or DSM and/or ICD criteria for Alzheimer's disease dementia (n = 12); Global Dementia Scale (GDS) & Research criteria (n = 1); CDR = 1 criteria (n = 1); not specified (n = 1) McKeith criteria for Lewy body dementia; Lund criteria for frontotemporal dementia; and NINDS AIREN criteria for vascular dementia | ||||||
| Target condition | Alzheimer’s disease dementia or any other types of dementia | ||||||
| Included studies | Prospectively well‐defined cohorts of MCI participants (n = 7), nested case‐control studies with a prospectively defined MCI group (n = 6) and studies with a retrospectively defined MCI group with longitudinal data (n = 2). Fifteen studies (N = 1282 participants) were included. Number included in analysis: 1172 | ||||||
| Quality concerns | Patient selection and conduct of the reference standard were poorly reported. Applicability concerns were generally low. Regarding the inclusion criteria set in the review, the majority of included studies did match the review question: 'Could CSF t‐tau and CSF t‐tau/ABetaratio biomarkers identify those MCI participants with Alzheimer’s disease pathology at baseline who would convert clinically to dementia at follow up?' However, due to a limited number of included studies and levels of heterogeneity, it is difficult to determine to what extent the findings from a meta‐analysis can be applied to clinical practice. | ||||||
| Limitations | Limited investigation of heterogeneity due to insufficient number of studies. There was a lack of common thresholds. | ||||||
| Test Median percentage converting (range) 2 | Studies | Cases/participants | Median specificity from included studies | Sensitivity (95% CI)1 at median specificity | Consequences in a cohort of 100 | ||
| Median percentage converting2 | Missed cases | Overdiagnosed | |||||
| Alzheimer's disease dementia | |||||||
| CSF t‐tau | 7 | 436/709 | 72 | 77 (67, 85) | 37 | 9 | 18 |
| Alzheimer's disease dementia | |||||||
| CSF p‐tau | 6 | 164/492 | 47.5 | 81 (64, 91.5) | 37 | 7 | 33 |
| Alzheimer's disease dementia | |||||||
| CSF p‐tau/ ABeta ratio | 5 | 140/433 | No meta‐analysis | No meta‐analysis | |||
| All types of dementia | |||||||
| CSF t‐tau | 4 | 166/319 | No meta‐analysis | No meta‐analysis | |||
| Investigation of heterogeneity: the planned investigations were not possible due to the limited number of studies available for each analysis. We were unable to investigate the effect of duration of follow‐up due to substantial variation in length and reporting. | |||||||
| Conclusions: Given the insufficient evidence to evaluate the diagnostic value in MCI of CSF t‐tau, CSF p‐tau, CSF t‐tau/ABeta ratio and CSF p‐tau/ABeta ratio for Alzheimer's disease dementia and other forms of dementias examined in this review, particular attention should be paid to the risk of misdiagnosis and overdiagnosis of dementia (and therefore overtreatment) in clinical practice. Future studies with more uniform approaches to thresholds, analysis and study conduct may provide a more homogenous estimate than the one that has been available from the included studies we have identified. | |||||||
| 1Meta‐analytic estimate of sensitivity derived from the HSROC model at a fixed value of specificity. Summary estimates of sensitivity and specificity were not computed because the studies that contributed to the estimation of the summary ROC curve used different thresholds. 2The median percentage converting was calculated using all the studies that reported 'conversion from MCI to Alzheimers' disease dementia' (Table 2) | |||||||
| Conversion from MCI to Alzheimer’s disease dementia | |||||||
| Study | Participants n/N (included in analysis) | Index test (number and % of positive tests) | Threshold (test abnormal) (prespecified Yes/No) | Number of converters (%) FP and FN | Test accuracy at study level | Duration of follow‐up | |
| Sensitivity | Specificity | ||||||
| *Balasa 2014 | 51/51 | CSF ABeta42/p‐tau ratio 25/51 (49%) | < 6.43 (Yes) | 24/51 (47%) FP =1; FN =0 | 100% | 96% | 41 months for MCI‐AD; 30 months for MCI‐MCI |
| *Ewers 2012 | 130/130 | CSF t‐tau 65/130 (50%) | Not reported | 58/130 (45%) FP = 30; FN = 23 | 60.7% | 58.9% | 24 months |
| CSF p‐tau 67/130 (51.5%) | Not reported | 58/130 (45%) FP = 30; FN = 21 | 63.9% | 58.9% | |||
| *Leuzy 2015 | 33/33 | CSF t‐tau 15/33 (45%) | ˃ 400 pg/mL(Yes) | 12/33 (36%) FP = 7; FN = 4 | 67% | 67% | Not reported |
| CSF t‐tau/ABeta ratio 12/33 (36%) | < 1.14 (Yes) | 12/33 (36%) FP = 6; FN = 6 | 50% | 71% | |||
| Conversion from MCI to all dementias | |||||||
| *Eckerstrom 2015 | 73/73 | CSF p‐tau 15/73 (20.5%) | 73 pg/mL (No) | 27/73 (36.9%) FP = 3; FN = 15 | 75% | 92% | 43.1 ± 23 months MCI‐stable; 33.7 ± 24 months MCI converters |
| Study awaiting translation | |||||||
| Urakami 2004 | |||||||
| AD: Alzheimer's disease; FN: false negative; FP: false positive; MCI: mild cognitive impairment *Authors need to be contacted in order to obtain missing data/relevant information. Data presented are provisional. | |||||||
| Included studies, index test and test accuracy at study level for conversion from MCI to Alzheimer’s disease dementia | |||||||
| Study | Participants n/N (included in analysis) | Index test (number and % of positive tests) | Threshold (test abnormal) (prespecified Yes/No) | Number of converters (%) FP and FN | Test accuracy at study level | Duration of follow‐up | |
| Sensitivity | Specificity | ||||||
| Amlien 2013 | 49/39 | CSF t‐tau 9/39 (23%) | ≥ 300 ng/L for age younger than 50 years; ≥ 450 ng/L for age 50 to 69 years; ≥ 500 ng/L for age older than 70 years (Sjogren 2001) (Yes) | 9/39 (23%); FP = 4; FN = 4 | 56% | 87% | mean 2.6 ± 0.5 years (range 1.6 to 4 years) |
| Buchhave 2012* | 137/134 | CSF p‐tau/ABeta ratio 69/134 (51%) | ˂ 6.2 ng/L (No) | 72/134 (54%) FP = 6; FN = 9 | 88% | 90% | median: 9.2 years (range 4 to 12 years) |
| Fellgiebel 2007 | 16/16 | CSF p‐tau 12/16 (75%) | ≥ 50 pg/mL (No) | 4/16 (25%) FP = 8; FN = 0 | 100% | 33% | mean 19.6 ± 9.0 months |
| Hampel 2004 | 52/52 | CSF t‐tau 38/52 (73%) | ≥ 479 ng/L (No) | 29/52 (56%); FP = 12; FN = 3 | 90% | 48% | mean 8.4 ± 5.1 months (range 2 to 24 months) |
| Hansson 2006* | 137/134 | CSF t‐tau 38/134 (28%) | > 350 ng/L (No) | 57/134 (42%); FP = 9; FN = 28 | 51% | 88% | Total sample: median 5.2 years (range 4.0 to 6.8 years); MCI‐AD: median: 4.3 years (range 1.1 to 6.7 years) MCI‐other dementias: median 4.2 years (range 1.5 to 3 years) |
| CSF p‐tau 50/134 (37%) | ≥ 60 ng/L (No) | 57/134 (42%); FP = 11; FN = 18 | 68% | 86% | |||
| CSF p‐tau/ABeta ratio 74/134 (55%) | ˂ 6.5 ng/L (No) | 57/134 (42%); FP = 19; FN = 2 | 96% | 75% | |||
| Kester 2011 | 153/100 | CSF t‐tau 64/100 (64%) | > 356 pg/mL (Yes) | 42/100 (42%) FP = 29; FN = 7 | 83% | 50% | median 18 months (IQR 13 ‐ 24) |
| Koivunen 2008 | 15/14 | CSF p‐tau 9/14 (64%) | ≥ 70 pg/mL (Yes) | 5/14 (36%) FP = 7; FN = 3 | 40% | 22% | 2 years |
| CSF p‐tau/ABeta ratio 9/14 (64%) | ˂ 6.5 pg/mL (yes) | 5/14 (36%) FP = 6; FN = 1 | 80% | 33% | |||
| Monge‐Argiles 2011 | 37/37 | CSF t‐tau 16/37 (43%) | ≥ 77.5 pg/mL (No) | 11/37 (28%) FP = 8; FN = 3 | 73% | 69% | 6 months |
| CSF p‐tau 20/37 (54%) | ≥ 54.5 pg/mL (No) | 11/37 (28%) FP = 11; FN = 2 | 82% | 58% | |||
| CSF p‐tau/ABeta ratio 18/37 (49%) | 0.17 (No) | 11/37 (28%) FP = 9; FN = 2 | 82% | 66% | |||
| CSF t‐tau/ABeta ratio 23/37 (62%) | 0.18 (No) | 11/37 (28%) FP = 13; FN = 1 | 91% | 50% | |||
| Palmqvist 2013 | 133/133 | CSF t‐tau 65/133 (49%) | > 87 pg/mL (No) | 52/133 (39%) FP = 23; FN = 10 | 81% | 72% | mean 5.9 years (range 3.2 to 8.8 years) |
| CSF p‐tau 46/133 (34%) | > 39 pg/mL (No) | 52/133 (39%) FP = 11; FN = 17 | 67% | 86% | |||
| Parnetti 2012 | 90/90 | CSF p‐tau/ABeta ratio 29/90 (32%) | 1074.0 (No) | 32/90 (35%) FP = 3; FN = 6 | 81% | 95% | maximum: 4 years; mean 3.40 ± 1.01 years |
| Visser 2009 | 168/158 | CSF p‐tau 108/158 (68%) | ≥ 51 pg/mL (used in clinical practice) (No) | 35/158 (22%) FP = 77; FN = 4 | 88% | 37% | range 1 to 3 for MCI |
| CSF p‐tau 45/158 (28%) | ≥ 85pg/mL (> 90th percentile of controls after correction for age) (No) | 35/158 (22%) FP = 25; FN = 15 | 57% | 80% | |||
| CSF p‐tau/ABeta ratio 77/158 (49%) | ˂ 9.92 (< 10th percentile of reference group after correction for age) (No) | 35/158 (22%); FP = 49; FN = 7 | 80% | 60% | |||
| Vos 2013 | 231/214 | CSF t‐tau 93/214 (43%) | > 450 pg/mL for age less than 70 years; > 500 pg/mL for age older than 70 years (Yes) | 91/214 (42%) FP = 28; FN = 26 | 71% | 77% | mean 2.5 ± 1.0 years |
| CSF t‐tau/ABeta ratio 147/214 (69%) | ABeta1–42/(240 1 [1.18 3 t‐tau]) ˂ 1.0 (Yes) | 91/214 (42%) FP = 60; FN = 4 | 96% | 51% | |||
| AD: Alzheimer's disease; FN: false negative; FP: false positive; MCI: mild cognitive impairment *Studies involved the same participants. Only Hansson 2006 is included in the meta‐analysis | |||||||
| Included studies, index test and test accuracy at study level for conversion from MCI to All dementias | |||||||
| Study | Participants n/N (included in analysis) | Index test (Number and % of positive tests) | Threshold (test abnormal) (pre‐specified Yes / No) | Number of converters (%) FP and FN | Test accuracy at study level | Duration of follow‐up | |
| Sensitivity | Specificity | ||||||
| Eckerstrom 2010 | 42/42 | CSF t‐tau 15/42 (36%) | ≥ 500 ng/L (No) | 21/42 (50%) FP = 1 FN = 7 | 67% | 95% | Total sample: 19.6 ± 9.0 months; MCI‐MCI: 19.5 ± 9.3 months; MCI‐progressive: 17.6 ± 8.8 months (4/8 MCI‐AD: 23.7 ± 2.0 months) |
| Galluzzi 2010 | 90/64 | CSF t‐tau 24/64 (37.5%) | > 450 pg/mL for subjects with an age range between 51 and 70 determined; > 500 pg/mL for subjects with an age range between 71 and 93 (Yes) | 34/64 (53%) FP = 5 FN = 15 | 56% | 83% | Total sample: 8.4 ± 5.1 months (range 2 to 24 months); follow‐up interval for converters was 9.6 ± 5.4, and for non‐converters 7.0 ± 4.3 months |
| Hansson 2006 | 137/134 | CSF t‐tau 38/134 (28%) | > 350 pg/mL (No) | 78/134 (58%) FP = 5 FN = 45 | 42% | 91% | Total sample: median 5.2 years (range 4.0 to 6.8); MCI‐AD: median: 4.3 years (range 1.1 to 6.7); MCI‐other dementias: median 4.2 (1.5 to 6.3) |
| Herukka 2007 | 79/79 | CSF t‐tau 43/79 (54%) | > 400 pg/mL (Yes) | 33/79 (42%) FP = 17 FN = 7 | 79% | 63% | Mean 3.52 ± 1.95 years in MCI converters; mean 4.56 ± 3.09 years in MCI‐stable |
| AD: Alzheimer's disease; FN: false positive; FP: false negative; MCI: mild cognitive impairment | |||||||
| Test | No. of studies | No. of participants |
| 1 CSF t‐tau conversion to AD dementia Show forest plot | 7 | 709 |
| 2 CSF p‐tau conversion to AD dementia Show forest plot | 6 | 492 |
| 3 CSF p‐tau/ABeta ratio to AD dementia Show forest plot | 5 | 433 |
| 4 CSF t‐tau conversion to All dementias Show forest plot | 4 | 319 |