Les modulateurs sélectifs des récepteurs de la progestérone (MSRP) contre les fibromes utérins
Résumé scientifique
Contexte
Les fibromes utérins sont des tumeurs du muscle lisse qui se forment dans l’utérus. Ces tumeurs, bien que bénignes, sont couramment associées à des saignements utérins anormaux (métrorragies), à des effets de masse et à une dysfonction reproductive. L’importance de la progestérone dans la pathogenèse de fibromes suggère que les modulateurs sélectifs des récepteurs de la progestérone (MSRP) pourraient constituer un traitement efficace. Les données probantes cliniques et biochimiques suggèrent que les MSRP peuvent réduire la croissance des fibromes et améliorer les symptômes. Ils peuvent provoquer des changements histologiques uniques dans l’endomètre, changements qui ne sont pas apparentés à un cancer, ne sont pas précancéreux et se sont avérés bénins et réversibles. Cette revue résume les essais randomisés menés afin d’évaluer l’efficacité du traitement par les MSRP pour le traitement des personnes atteintes de fibromes utérins.
Objectifs
Évaluer l’efficacité et l’innocuité des MSRP pour le traitement des femmes préménopausées présentant des fibromes utérins.
Stratégie de recherche documentaire
Nous avons effectué des recherches dans le registre spécialisé du Groupe Cochrane sur la gynécologie et la fertilité, le registre Cochrane des essais contrôlés (CENTRAL), MEDLINE, Embase, PsycINFO, l’Index cumulé de la littérature en soins infirmiers et apparentés (CINAHL) et les registres d’essais cliniques, depuis leur création jusqu’à mai 2016. Nous avons effectué une recherche manuelle dans les références bibliographiques des articles pertinents et contacté des experts dans le domaine pour obtenir des données supplémentaires.
Critères de sélection
Les études incluses étaient des essais contrôlés randomisés (ECR) portant sur des femmes préménopausées présentant des fibromes utérins, traitées pendant au moins trois mois avec un MSRP.
Recueil et analyse des données
Deux auteurs de la revue ont examiné indépendamment toutes les études éligibles identifiées par la recherche. Nous avons extrait les données, évalué le risque de biais de manière indépendante à l’aide de formulaires standard et analysé les données à l’aide de différences moyennes (DM) ou de différences moyennes standardisées (DMS) pour les données continues et de rapports de cotes (odds ratio, OR) pour les données dichotomiques. Nous avons effectué des méta‐analyses en utilisant le modèle à effets aléatoires. Notre critère de jugement principal était le changement des symptômes liés aux fibromes.
Résultats principaux
Nous avons inclus dans la revue 14 ECR portant sur un total de 1215 participantes. Nous n’avons pas pu extraire les données complètes de trois études. Nous avons inclus dans la méta‐analyse 11 études portant sur 1021 participantes : 685 ont reçu un MSRP et 336 une intervention témoin (placebo ou leuprolide). Les investigateurs ont évalué trois MSRP : la mifépristone (cinq études), l’acétate d’ulipristal (quatre études) et l’asoprisnil (deux études). Le critère de jugement principal était le changement de symptômes liés aux fibromes (sévérité des symptômes, qualité de vie liée à la santé, saignements utérins anormaux, douleurs pelviennes). Les événements indésirables rapportés dans les études incluses étaient limités à des remaniements de l’endomètre associés au MSRP. Plus de la moitié (8/14) de ces études présentaient un risque de biais faible dans tous les domaines. La limitation la plus fréquente des autres études était une mauvaise notification des méthodes. La principale limitation de la qualité globale des données probantes était un biais de publication potentiel.
Comparaison entre MSRP et placebo
Le traitement par un MSRP a entraîné des améliorations de la sévérité des symptômes des fibromes (DM ‐20,04 points, intervalle de confiance (IC) à 95 % de ‐26,63 à ‐13,46 ; quatre ECR, 171 femmes, I2 = 0 %; données de qualité moyenne) et la qualité de vie liée à la santé (DM 22,52 points, IC à 95 % de 12,87 à 32,17 ; quatre ECR, 200 femmes, I2 = 63 % ; données de qualité moyenne) sur l’échelle de qualité de vie en relation avec les symptômes du fibrome (UFS‐QoL, de 0 à 100). Les femmes traitées avec un MSRP ont montré une réduction de l’abondance des règles sur les échelles de ménorragie, bien que cet effet ait été de petite taille (DMS ‐1,11, IC à 95 % de ‐1,38 à ‐0,83 ; trois ECR, 310 femmes, I2 = 0 % ; données de qualité moyenne), ainsi que des taux plus élevés d’aménorrhée (29 sur 1000 dans le groupe placebo contre 237 à 961 sur 1000 dans le groupe MSRP ; OR 82,50, IC à 95 % de 37,01 à 183,90 ; 7 ECR, 590 femmes, I2 = 0 % ; données de qualité moyenne), par rapport à celles ayant reçu un placebo. Nous n’avons pas pu tirer de conclusions concernant les changements des douleurs pelviennes en raison de la variabilité dans les estimations. En ce qui concerne les effets indésirables, les remaniements de l’endomètre associés aux MSRP étaient plus fréquents après traitement par un MSRP qu’avec un placebo (OR 15,12, IC à 95 % de 6,45 à 35,47 ; 5 ECR, 405 femmes, I2 = 0 % ; données de mauvaise qualité).
Comparaison entre MSRP et acétate de leuprolide
Dans la comparaison des MSRP avec d’autres traitements, deux ECR ont évalué un MSRP par rapport à l’acétate de leuprolide. Un ECR rapportait les critères de jugement principaux. Aucune donnée n’a suggéré une différence entre les groupes leuprolide et MSRP pour l’amélioration de la qualité de vie, mesurée par le score de sévérité des symptômes UFS‐QoL (DM ‐3,70 points, IC à 95 % ‐9,85 à 2,45 ; un ECR, 281 femmes ; données de qualité moyenne) et les scores de qualité de vie liée à la santé (DM 1,06 points, IC à 95 % de ‐5,73 à 7,85 ; un ECR, 281 femmes ; données de qualité moyenne). Il était difficile de savoir si les résultats montraient une différence entre les groupes leuprolide et MSRP pour la réduction des pertes de sang menstruelles sur la base de la grille d’évaluation graphique des pertes de sang (PBAC) car les intervalles de confiance étaient larges (DM 6 points, IC à 95 % de ‐40,95 à 50,95 ; un ECR, 281 femmes ; données de mauvaise qualité), ou pour les taux d'aménorrhée (804 sur 1000 dans le groupe sous placebo contre 732 à 933 sur 1000 dans le groupe MSRP ; OR 1,14, IC à 95 % de 0,60 à 2,16 ; 1 ECR, 280 femmes ; données de qualité moyenne). Aucune donnée n’a révélé de différences entre les groupes pour les scores de douleur pelvienne, notés sur la base du Questionnaire sur la douleur de McGill (échelle de 0 à 45) (DM ‐0,01 points, IC à 95 % de ‐2,14 à 2,12 ; 281 femmes ; données de qualité moyenne). En ce qui concerne les effets indésirables, les remaniements de l’endomètre associés aux MSRP étaient plus fréquents après un traitement par un MSRP qu’après un traitement avec du leuprolide (OR 10,45, IC à 95 % de 5,38 à 20,33 ; 301 femmes ; données de qualité moyenne).
Conclusions des auteurs
L’utilisation de courte durée de MSRP a entraîné une amélioration de la qualité de vie, réduit les saignements menstruels et augmenté le taux d’aménorrhée par rapport au placebo. Par conséquent, ils peuvent constituer un traitement efficace pour les femmes présentant des fibromes utérins symptomatiques. Les données probantes issues d’un ECR n’ont montré aucune différence entre l’acétate de leuprolide et les MSRP en ce qui concerne l’amélioration de la qualité de vie et les symptômes hémorragiques. Les données étaient insuffisantes pour démontrer une différence éventuelle d’efficacité entre les MSRP et le leuprolide. Les investigateurs ont observé plus fréquemment des remaniements de l’endomètre associés aux MSRP chez les femmes traitées avec un MSRP que chez celles sous placebo ou traitées avec l’acétate de leuprolide. Comme nous l’avons signalé plus haut, les remaniements de l’endomètre associés aux MSRP sont bénins, non apparentés à un cancer et ne sont pas précancéreux. Le biais de notification peut avoir un impact sur la conclusion de cette méta‐analyse. Des ECR bien conçus comparant les MSRP à d’autres traitements sont nécessaires.
PICO
Résumé simplifié
Médicaments pour traiter les fibromes
Question de la revue
Nous avons examiné les données probantes de l’efficacité et de l’innocuité d’une nouvelle classe de médicaments appelés modulateurs sélectifs des récepteurs de la progestérone (MSRP) pour le traitement des femmes préménopausées présentant des fibromes utérins.
Contexte
Les fibromes (masses non cancéreuses dans la couche musculaire de l’utérus) sont une affection fréquente. Ils peuvent avoir un impact négatif sur la santé d’une femme en provoquant des règles abondantes, des symptômes liés à leur volume (tels qu’une pression exercée sur la vessie ou le rectum) et/ou des difficultés à concevoir.
Une nouvelle classe de médicaments appelés MSRP s’est montrée prometteuse pour le traitement des femmes présentant des fibromes utérins. Cette classe de médicaments comprend diverses molécules telles que la mifépristone, l’acétate d’ulipristal et l’asoprisnil. Les MSRP peuvent provoquer des remaniements bénins au niveau de l’endomètre, qui ne sont pas apparentés à un cancer ni précancéreux.
Date de la recherche
Nous avons effectué des recherches dans la littérature jusqu'à mai 2016.
Caractéristiques de l'étude
Les auteurs de la revue ont inclus 14 essais contrôlés randomisés (ECR) (1215 femmes), mais n’ont pas pu obtenir les données de trois études. De plus, les résultats de plusieurs essais enregistrés terminés n’avaient pas encore été rapportés. Cette revue a évalué les résultats de 11 ECR portant sur 1021 femmes présentant des fibromes utérins. Les investigateurs ont traité ces femmes avec de la mifépristone (cinq études), de l’acétate d’ulipristal (quatre études) ou de l’asoprisnil (deux études) et ont comparé les MSRP avec un placebo ou de l’acétate de leuprolide. Plus de la moitié de ces études présentaient un risque de biais faible dans tous les domaines. La limite la plus courante des autres études était la mauvaise notification des méthodes.
Principaux résultats
Les principaux critères de jugement étudiés étaient l’évolution des symptômes (sévérité des symptômes causés par les fibromes, qualité de vie, saignements menstruels, douleurs pelviennes). Par rapport à un placebo (comprimés « factices » identiques contenant un médicament non actif), les MSRP ont amélioré les symptômes causés par les fibromes (de 20 points en moyenne sur une échelle de 100 points) et la qualité de vie des femmes (de 22 points en moyenne sur une échelle de 100 points) et ont entraîné une légère diminution des métrorragies. Entre 24 % et 96 % des femmes traitées avec un MSRP n’ont pas eu de règles du tout (contre 3 % sous placebo). Les auteurs de la revue n’ont pu tirer aucune conclusion quant aux changements des douleurs pelviennes car celles‐ci n’était pas systématiquement évaluées. Deux études comparaient un MSRP à un agoniste de l’hormone de libération des gonadotrophines (leuprolide) et ont révélé que les deux médicaments (MSRP et leuprolide) étaient efficaces pour améliorer les symptômes causés par les fibromes (amélioration de la qualité de vie, réduction des saignements menstruels, arrêt des règles, réduction des douleurs pelviennes). Cependant, nous ne sommes pas certains que les chercheurs aient noté une différence d’efficacité entre les MSRP et le leuprolide.
Les femmes traitées avec un MSRP étaient plus susceptibles de développer des remaniements de la muqueuse de l’utérus (endomètre) que les femmes ayant reçu un placebo ou du leuprolide. Ces changements sont bénins et réversible à l’arrêt du MSRP.
En résumé, les études incluses dans cette revue montrent que les MSRP améliorent les symptômes causés par les fibromes, la qualité de vie et les saignements menstruels. Cependant, nous avons besoin d’études bien conçues, de plus grande taille, comparant les MSRP à d’autres traitements actuellement disponibles pour les fibromes utérins.
Qualité des données probantes
Dans les comparaisons avec un placebo, des données de qualité moyenne ont montré des améliorations de la qualité de vie, la réduction des métrorragies et l’arrêt des règles avec le MSRP. Des données probantes de qualité médiocre ont suggéré un taux plus élevé de remaniements de l’endomètre sous MSRP qu’avec le placebo. Les comparaisons avec le leuprolide étaient basées sur des données de qualité moyenne relatives aux changements de la qualité de vie, à l’arrêt des règles, aux douleurs pelviennes et aux remaniements de l’endomètre. La principale limitation de la qualité globale des données probantes était un biais de publication potentiel.
Authors' conclusions
Summary of findings
| SPRM vs placebo | ||||||
| Patient or population: women with uterine fibroids | ||||||
| Outcomes | Anticipated absolute effects* (95% CI) | Relative effect | Number of participants | Quality of the evidence | Comments | |
| Risk with placebo | Risk with SPRM | |||||
| Quality of life: change in symptom severity score measured with Uterine Fibroid Symptom Quality of Life Scale (UFS‐QoL): scale 0 to 100 | Mean change in symptom severity score (QoL) in the intervention group was 20.04 points lower (26.63 lower to 13.46 lower), indicating improvement in symptom severity with SPRM treatment for 3 months | ‐ | 171 | ⊕⊕⊕⊝ | ||
| Quality of life: change in health‐related quality of life score measured with UFS‐QoL: scale 0 to 100 | Mean change in health‐related quality of life score in the intervention group was 22.52 points higher (12.87 higher to 32.17 higher), indicating improvement in quality of life with SPRM treatment for 3 to 6 months | ‐ | 200 | ⊕⊕⊕⊝ | 1 RCT (Fiscella 2006) reported outcomes at 6 months. Remaining studies had a 3‐month follow‐up period | |
| Abnormal uterine bleeding: change in menstrual blood loss | Mean change in menstrual blood loss in the intervention group was 1.11 points lower (1.38 lower to 0.83 lower), indicating a decrease in menstrual blood loss with SPRM treatment for 3 months | ‐ | 310 | ⊕⊕⊕⊝ | Measured by PBAC score or similar menstrual pictorial score. PBAC score ≥ 100 correlates with menorrhagia, which is defined as > 80 mL menstrual blood loss | |
| Abnormal uterine bleeding: amenorrhoea | 29 per 1000 | 477 per 1000 | OR 82.50 | 590 | ⊕⊕⊕⊝ | 1 RCT (Fiscella 2006) reported outcomes at 6 months. Remaining studies had a 3‐month follow‐up period |
| Pelvic pain (measured subjectively) | No conclusions could be drawn owing to variability in estimates | 629 (7 RCTs) | ||||
| Adverse effects: SPRM‐associated endometrial changes | 77 per 1000 | 351 per 1000 | OR 15.12 | 405 | ⊕⊕⊝⊝ | |
| *Risk in the intervention group (and its 95% confidence interval) is based on mean risk in the comparison group and relative effect of the intervention (and its 95% CI) | ||||||
| GRADE Working Group grades of evidence | ||||||
| aDowngraded one level as publication bias suspected because no small negative studies included. Also, many studies were conducted and not published bDowngraded one level because of serious issues with indirectness of evidence when criteria for evaluating endometrial specimens differed between studies | ||||||
| SPRM versus leuprolide acetate for uterine fibroids | ||||||
| Patient or population: uterine fibroids | ||||||
| Outcomes | Anticipated absolute effects* (95% CI) | Relative effect | Number of participants | Quality of the evidence | Comments | |
| Risk with leuprolide acetate | Risk with SPRM | |||||
| Quality of life: change in symptom severity score measured with Uterine Fibroid Symptom Quality of Life Scale (UFS‐QoL): scale 0 to 100 | Mean change in symptom severity score (QoL) in the SPRM group was 3.7 points lower | ‐ | 281 | ⊕⊕⊕⊝ | ||
| Quality of life: change in health‐related quality of life score measured with UFS‐QoL: scale 0 to 100 | Mean change in health‐related quality of life score in the SPRM group was 1.06 points higher | ‐ | 281 | ⊕⊕⊕⊝ | ||
| Abnormal uterine bleeding: change in menstrual blood loss (measured using PBAC score) | Mean change in menstrual blood loss in the SPRM group was 6 points higher | ‐ | 281 | ⊕⊕⊝⊝ | PBAC score ≥ 100 correlates with menorrhagia, which is defined as > 80 mL menstrual blood loss | |
| Abnormal uterine bleeding: amenorrhoea | 804 per 1000 | 828 per 1000 | OR 1.14 | 280 | ⊕⊕⊕⊝ | |
| Pelvic pain (measured using McGill Pain Questionnaire: range 0 to 45) | Mean change in pelvic pain in the SPRM group was 0.01 points lower (2.14 lower to 2.12 higher) than in the leuprolide group at 3 months | ‐ | 281 | ⊕⊕⊕⊝ | ||
| Adverse effects: SPRM‐associated endometrial changes | 119 per 1000 | 585 per 1000 | OR 10.45 | 301 | ⊕⊕⊕⊝ | |
| *Risk in the intervention group (and its 95% confidence interval) is based on mean risk in the comparison group and relative effect of the intervention (and its 95% CI) | ||||||
| GRADE Working Group grades of evidence | ||||||
| aDowngraded one level as publication bias strongly suspected bDowngraded one level owing to serious issue with imprecision as point estimate has very wide confidence interval | ||||||
Background
Description of the condition
Uterine fibroids are common smooth muscle tumours arising from the uterus. They are also known as leiomyomata or myomas. The prevalence of these tumours depends on the population’s ethnicity and the method of detection. More than 80% of black women and nearly 70% of white women will develop fibroids before the age of 50 years (Baird 2003). These tumours, although benign, can cause significant distortion of the uterus and result in symptoms in up to 50% of women (Baird 2003). Fibroids are frequently associated with abnormal uterine bleeding, bulk symptoms (pelvic pressure, urinary dysfunction, constipation, pain) and reproductive dysfunction (subfertility, miscarriage, pregnancy complications) (Stovall 2001).
In the United States alone, the direct cost of treatment for women with fibroids is estimated to be over four billion dollars annually (Cardozo 2012). Fibroid‐related symptoms can be treated with surgery (hysterectomy, myomectomy, endometrial ablation, myolysis), minimally invasive procedures (uterine artery embolisation, magnetic resonance‐guided focused ultrasound) or medical therapies (Wallach 2004). Despite these treatment options, hysterectomy is the second most frequently performed surgical procedure in the United States, with fibroids the most common indication (Merrill 2008); this has contributed to significant surgical morbidity and escalating healthcare costs. Thus, focus on more conservative options is needed.
Description of the intervention
Currently, no pharmacological agents have received global approval specifically for long‐term treatment of individuals with uterine fibroids. The mainstay of medical management has comprised use of gonadotropin‐releasing hormone analogues (GnRHa) for preoperative optimisation seen as decreased blood loss, corrected anaemia and reduced fibroid volume (Sabry 2012). Leuprolide acetate is one of the most frequently used GnRHa treatments for fibroids and is approved in the United States and Europe for this indication. Challenges associated with GnRHa therapy include decreased bone mineral density, development of vasomotor symptoms and an initial oestrogen flare that may exacerbate symptoms. Although medical therapies such as combined hormonal contraceptives, progestins, progestin‐releasing intrauterine systems and danazol may be used to decrease menstrual blood flow, their specific effects on fibroids and bulk symptoms are limited, and they often cause side effects that lead to discontinuation (Ke 2009; Sangkomkamhang 2013; Van Voorhis 2009).
Traditionally, oestrogen has been considered the most important hormone for stimulating fibroid growth. Recently, progesterone was found to be essential for the maintenance and growth of fibroids (Bulun 2013). For this reason, selective progesterone receptor modulators (SPRMs) have shown promise for the treatment of women with uterine fibroids (Chwalisz 2005). These molecules bind to the progesterone receptor and show varying levels of antagonistic activity. SPRMs were first discovered in 1980, and mifepristone, a powerful progesterone antagonist, was the pioneer drug. It has been used mainly for pregnancy termination but has also been evaluated as a therapeutic agent for fibroids. Meta‐analysis of three randomised trials showed that mifepristone is effective in reducing bleeding symptoms and improving fibroid‐related quality of life, with no effect on fibroid volume (Tristan 2012).
Other SPRMs were subsequently developed, each with different affinity for the progesterone receptor and showing varying degrees of antagonistic activity. The clinical activity of each SPRM class member reflects the subtlety of its spectrum of agonist and antagonist activity, along with tissue‐specific expression of progesterone receptor (PR) subtypes.
How the intervention might work
The ‘progesterone hypothesis’ suggests that progesterone acts as a key hormone in the development of fibroids by increasing mitotic rates and reducing apoptosis of fibroid smooth muscle cells (Bulun 2013). Data also suggest that signalling occurs between oestrogen and progesterone receptors, whereby oestrogen induces increased expression of the progesterone receptor in fibroid cells (Ishikawa 2010). The importance of progesterone in fibroid pathogenesis supports SPRMs as effective treatment for women with fibroids. Fibroid cells cultured with SPRMs demonstrate inhibited proliferation and increased apoptosis, without affecting normal myometrium (Bouchard 2011). SPRMs can also downregulate the number of growth factors while reducing collagen synthesis in cultured fibroid cells (Bouchard 2011). SPRMs act upon the uterine endometrium to provide relief of bleeding symptoms in women with fibroids (Wagenfeld 2016). SPRMs are known to cause unique changes to the endometrium. Histological endometrial changes have been labelled as progesterone receptor modulator‐associated endometrial changes (PAECs) on the basis of international consensus (Mutter 2008). These changes are benign and reversible.
SPRMs may be used to treat women with fibroids in several clinical scenarios. Currently, the only SPRM approved for medical management of fibroids is ulipristal acetate (Esmya, Gedeon‐Richter, Europe, February 2012; Fibristal, Watson Laboratories Inc, Canada, July 2013). This drug was approved to treat bleeding symptoms while decreasing fibroid size for up to three months before surgery. Recently, it was approved in Europe and Canada for ongoing intermittent use. Long‐term use of SPRMs for fibroid‐related symptoms may decrease the need for surgical intervention and associated morbidity and costs. Long‐term medical therapy may be particularly beneficial for bridging perimenopausal women until menopause, when fibroids would then spontaneously decrease. Although pregnancy is contraindicated with SPRMs, evidence shows that the decrease in fibroid size is sustained after the medication has been discontinued (Donnez 2012). This may cause fibroid‐related subfertility, for which medical management may reduce fibroid volume and facilitate pregnancy after discontinuation of SPRM treatment.
Why it is important to do this review
Despite the prevalence of uterine fibroids, only a few high‐quality studies have examined the effectiveness of medical therapies. With increasing demand for less invasive fibroid therapies, the benefits and risks of medical treatments must be critically evaluated. Furthermore, women are delaying childbearing, hence fertility‐sparing therapeutic options are needed. Biochemical and clinical evidence shows that SPRMs may decrease fibroid growth and ameliorate symptoms (Chwalisz 2005). Although a Cochrane review on mifepristone has been completed (Tristan 2012), the newer SPRMs require systematic evaluation of their benefits and harms.
Objectives
To evaluate the effectiveness and safety of selective progesterone receptor modulators (SPRMs) for treatment of premenopausal women with uterine fibroids.
Methods
Criteria for considering studies for this review
Types of studies
We included data from all published and unpublished randomised controlled trials (RCTs). For cross‐over studies, we included for meta‐analysis only data from the first phase of the trial.
Types of participants
Premenopausal women with uterine fibroids, with or without symptoms. The presence of fibroids was confirmed surgically (laparoscopy, laparotomy or hysteroscopy) or through at least one of the following imaging modalities: ultrasonography, computed tomography or magnetic resonance imaging (MRI).
Types of interventions
Treatment with any SPRM for at least three months versus:
-
placebo;
-
no treatment;
-
another medical therapy (another SPRM, a GnRHa or another class of medication);
-
surgery (myomectomy or hysterectomy); or
-
uterine artery embolisation (UAE).
Commercially available SPRMs included, but were not limited to, mifepristone, asoprisnil, telapristone acetate and ulipristal acetate. Additional interventions were permitted as long as they were uniformly used in all study arms. Leuprolide acetate is a GnRHa that is commonly used to treat fibroids. We searched for comparisons of SPRM versus leuprolide acetate or other medications in the GnRHa class.
Types of outcome measures
Primary outcomes
-
Change in fibroid‐related symptoms
-
Quality of life assessed through standardised and validated measures. Examples of scales that measured health‐related quality of life for women with uterine fibroids (Williams 2006) included but were not limited to Uterine Fibroid Symptom Quality of Life Scale (UFS‐QoL) (Spies 2002), EuroQoL (Brooks 1996) and Short Form‐36 (SF‐36) (Ware 1992)
-
Abnormal uterine bleeding measured objectively (e.g. haemoglobin levels, haematocrit, ferritin levels, alkaline haematin technique) or subjectively (e.g. pictorIal blood loss assessment)
-
Pain and pelvic pressure measured subjectively (e.g. visual analogue scales, Likert scales)
-
Secondary outcomes
-
Change in fibroid or uterine size, or both, as measured by ultrasonography or MRI
-
SPRM‐related effects including, but not limited to, SPRM‐associated endometrial changes (Mutter 2008), endometrial hyperplasia, endometrial carcinoma, abnormal liver enzymes and prolactin levels, osteoporosis, breast discomfort, hot flushes, headache and nausea
Search methods for identification of studies
We searched for all published and unpublished RCTs of SPRMs used for treatment of uterine fibroids. We applied no language restrictions. We developed and executed the search strategy in consultation with the Cochrane Gynaecology and Fertility Group Information Specialist and a Mount Sinai Hospital librarian.
Electronic searches
We searched the following databases from inception until 15 May 2016.
-
Cochrane Gynaecology and Fertility Group Specialised Register (Appendix 1).
-
Cochrane Central Register of Controlled Trials (CENTRAL) (Appendix 2).
-
MEDLINE (Appendix 3).
-
Embase (Appendix 4).
-
PsycINFO (Appendix 5).
-
Cumulative Index to Nursing and Allied Health Literature (CINAHL)0 (Appendix 6).
-
Database of Abstracts of Reviews of Effects (DARE) (Appendix 7).
-
Other.
-
-
Trial registers for ongoing and registered trials: www.clinicaltrials.gov.
-
Web of Knowledge: http://wokinfo.com/.
-
Clinical study results for clinical trials of marketed pharmaceuticals: www.clinicalstudyresults.org.
-
World Health Organization (WHO) International Clinical Trials Registry Platform: www.who.int/trialsearch.
-
OpenGrey for unpublished literature from Europe: www.opengrey.eu.
-
Latin American Caribbean Health Sciences Literature (LILACS) for Portuguese and Spanish trials.
-
Searching other resources
We handsearched appropriate journals recommended by the Gynaecology and Fertility Group that were not captured in the above databases. We also handsearched reference lists of relevant articles and contacted experts in the field to obtain additional data.
Data collection and analysis
We performed statistical analysis according to the Cochrane Handbook for Systematic Reviews of Interventions (Higgins 2011). We used Review Manager 5.3 (RevMan 2014) software for the analysis.
Selection of studies
Two review authors independently completed the initial title and abstract screening. We retrieved full texts when studies met the following criteria: used an SPRM as an intervention for treatment of uterine fibroids, and had a prospective design. If we had any doubts based on these screening criteria, we retrieved the full text. We excluded studies if full‐text articles did not mention randomisation. We resolved disagreements during the screening process by consulting a third review author. We documented the selection process in a PRISMA (Preferred Reporting Items for Systematic Reviews and Meta‐Analyses) flow diagram (Figure 1).

Study flow diagram.
Data extraction and management
Two review authors independently extracted data from all eligible studies to be included in the review. We extracted data using forms that we had pilot‐tested. These forms included specifics of study characteristics and outcomes data. When data from a trial had been published more than once, review authors extracted data that were additional and were not repeated. We contacted trial authors for clarification when required. We resolved disagreements between review authors by consensus after involving an additional review author.
Assessment of risk of bias in included studies
Two review authors independently assessed bias for included studies using the Cochrane risk of bias tool (www.cochrane‐handbook.org). We assessed the following elements: selection bias (random sequence generation, allocation concealment); performance bias (blinding of participants and personnel); detection bias (blinding of outcome assessors); attrition bias (incomplete outcome data); reporting bias (selective reporting); and other biases. We paid special attention to within‐trial selective reporting when study authors failed to report obvious outcomes or reported them with insufficient detail. We compared studies against published protocols to determine whether planned outcome measures were indeed reported.
Measures of treatment effect
We analysed the various comparisons separately using RevMan 5.3. We reported dichotomous data as odds ratios (ORs) with 95% confidence intervals (CIs). We reported continuous data as mean differences (MDs) with 95% CIs. When outcomes were reported as continuous data on different scales, we reported standardised mean differences (SMDs) and 95% CIs.
We interpreted the SMD using the following rule‐of‐thumb guide: 0.2 represents a small effect, 0.5 a moderate effect and 0.8 a large effect (Cohen 1988).
Unit of analysis issues
We performed the primary analysis per woman randomised.
We prepared additional tables to briefly summarise data that did not allow valid analysis (e.g. 'per cycle' data) and did not meta‐analyse these data. This applied to "change in fibroid size data", which we analysed on the basis of number of fibroids tracked ‐ not number of participants (i.e. some participants contributed more fibroids to the analysis than others).
We included only first‐phase data from cross‐over trials.
Dealing with missing data
We contacted primary authors electronically to request missing data and clarification of any issues that arose. We analysed data on the basis of intention‐to‐treat analysis. When all randomised participants were not included in the analysis, we calculated and separately reported the percentage of participants lost to follow‐up. In these cases, we imputed values only for primary outcomes. For other outcomes, we analysed only available data.
When data were reported in a form unsuitable for analysis (e.g. did not report standard deviations or reported medians rather than means), we obtained statistical advice and imputed the data (see Appendix 12).
Assessment of heterogeneity
We evaluated included trials to determine whether studied participants, interventions and outcomes were similar enough that we could meta‐analyse them. If we determined that trials could be meta‐analysed to yield clinically relevant results, we assessed these trials for statistical heterogeneity. We performed tests for heterogeneity across studies by using the Q statistic and the I2 statistic. We used the following criteria for heterogeneity: I2 < 25% showed low, 25% to 50% moderate and > 50% high heterogeneity (Higgins 2011). When we found high heterogeneity across any of these criteria, we conducted subgroup and sensitivity analyses.
Assessment of reporting biases
We aimed to minimise reporting bias by completing a comprehensive search for eligible studies while staying conscious of data duplication. If we found a sufficient number of trials for inclusion (> 10), we used a funnel plot to assess for publication bias (under‐reporting of small negative studies).
Data synthesis
We pooled data for clinically similar studies using a random‐effects model for the meta‐analysis. When studies could not be pooled, we described outcomes in narrative form. We analysed different comparisons separately.
-
All SPRMs versus placebo or no treatment.
-
All SPRMs versus alternative active therapy, stratified by alternatives.
-
SPRMs versus medical therapy (stratified by class of medical therapy).
-
SPRMs versus surgical management (stratified by type of surgical management).
-
SPRMs versus UAE.
-
Subgroup analysis and investigation of heterogeneity
We planned to perform the following subgroup analyses if sufficient data were available (i.e. more than five studies).
-
Individual types of SPRMs versus placebo, no treatment or each alternative active therapy.
-
Duration of therapy (< 6 months, 6 to 12 months, > 12 months).
-
SPRM dose (low, medium, high).
-
Fibroid location (submucous, intramural, subserosal).
When high heterogeneity was present, we planned to explore possible explanations including individual study risk of bias, participant population (age, ethnicity, types and sizes of fibroids), dose of SPRM, duration of treatment and follow‐up.
Sensitivity analysis
We planned to conduct sensitivity analyses for primary outcomes when data were sufficient (more than five studies) to determine whether conclusions were robust to arbitrary decisions made regarding eligibility and analysis. These planned analyses included consideration of whether review conclusions would have differed if:
-
eligibility had been restricted to studies without high risk of bias;
-
a fixed‐effect model had been adopted;
-
alternative imputation strategies had been implemented; or
-
the summary effect measure had been risk ratio rather than odds ratio.
Overall quality of the body of evidence: 'Summary of findings' table
We prepared a 'Summary of findings' table using GRADEpro (GRADEpro GDT 2014) and Cochrane methods (Higgins 2011). These tables evaluated the overall quality of the body of evidence for main review outcomes (symptom severity, health‐related quality of life, menstrual blood loss, rate of amenorrhoea, pelvic pain/pressure, SPRM‐associated endometrial changes) for main review comparisons (SPRM vs placebo and SPRM vs leuprolide acetate). We assessed the quality of the evidence using the following GRADE criteria: risk of bias, consistency of effect, imprecision, indirectness and publication bias. Two review authors independently judged evidence quality (high, moderate, low or very low) and resolved disagreements by discussion. We justified, documented and incorporated these judgements into reporting of results for each outcome.
Results
Description of studies
See Characteristics of included studies and Characteristics of excluded studies.
Results of the search
The electronic search of databases generated 476 records after we eliminated duplicates. We identified no additional records through handsearching and other sources. After screening titles and abstracts, we eliminated 437 records that did not meet review inclusion criteria. We retrieved 39 full‐text manuscripts and excluded 25 citations (15 were secondary publications/duplicated cohorts, 10 compared various doses of SPRM ‐ see Characteristics of excluded studies). We identified 10 ongoing trials (see Characteristics of ongoing studies) and included 14 studies in the review. Bigatti 2014 presented preliminary data on surgical outcomes after pretreatment with a variety of hormonal agents including ulipristal acetate. We could not extract data as no participants were treated with SPRM at the time of publication and investigators reported only surgery‐related outcomes. We did not include this study in further analyses in this review. Furthermore, we could not extract data from Liu 2015 and Prasad 2013, as the numbers of participants assigned to treatment and control groups were unclear. Our attempts to contact study authors were unsuccessful. Hence, we used 11 studies for meta‐analysis. Two publications reported on the same participant cohort but reported different clinical outcomes; Wilkens 2008 reported these details. We have outlined details of the study screening process in Figure 1. The search was current as of 15 May 2016.
Included studies
For more information on included studies, see Characteristics of included studies.
Methods and setting
All studies were RCTs. Four studies were multi‐centre trials: three from European centres (Donnez 2012; Donnez 2012a; Wilkens 2008) and one from a North American centre (Chwalisz 2007). Four single‐site studies were conducted in the United States (Fiscella 2006; Levens 2008; Nieman 2011; Reinsch 1994); two in India (Bagaria 2009; Prasad 2013) and the remainder in Cuba (Esteve 2013), China (Liu 2015), Sweden (Engman 2009) and Italy (Bigatti 2014).
Participants
Studies included a total of 1215 study participants: 685 received SPRM and 336 were given a control. For two studies, numbers of participants in SPRM and control groups were unclear (Liu 2015; Prasad 2013). All studies, with one exception, included only patients with symptomatic fibroids. In Chwalisz 2007, although participants were not expected to be symptomatic at baseline, most of them experienced symptoms (76% had abnormal uterine bleeding and 94% had bulk symptoms). Three studies scheduled participants for surgery for their symptomatic fibroids (Engman 2009; Esteve 2013; Wilkens 2008). Eight studies diagnosed uterine fibroids by ultrasonography, and three by MRI (Donnez 2012; Levens 2008; Nieman 2011).
Eight studies reported the following ethnicities for 931 participants (91% of participants were included in this analysis): 644 White/Caucasian (69%), 183 Black (20%), 31 Asian (3%), 29 Afro‐Cuban (3%), 4 Hispanic (< 1%) and 40 “other” (4%).
Interventions
The SPRM in seven studies was mifepristone (see Table 1). Five studies investigated ulipristal acetate (see Table 2), and two investigated asoprisnil. Chwalisz 2007 investigated three daily doses of asoprisnil (5 mg, 10 mg, 25 mg) and compared them with placebo over a three‐month period. Wilkens 2008 compared 10 mg and 25 mg daily of asoprisnil versus placebo over three months in a cohort of 33 participants (see Table 3).
| Study | Participants | Daily dose | Control | Follow‐up (months) |
| 124 | 5 mg | Placebo | 3 | |
| 42 | 5 mg | Placebo | 6 | |
| 40 | 10 mg | Placebo | 3 | |
| 62 | 10 mg | Placebo | 3 | |
| 132 | 10 mg | Placebo | 3 | |
| 14 | 25 mg | Leuprolide acetate | 3 | |
| 30 | 50 mg | Vitamin B | 3 |
| Study | Participants | Daily dose | Control | Follow‐up (months) |
| Unknown | 5 mg | No treatment | Not stated | |
| 242 | 5 or 10 mg | Placebo | 3 | |
| 303 | 5 or 10 mg | Leuprolide acetate | 3 | |
| 22 | 10 or 20 mg | Placebo | 3 | |
| 42 | 10 or 20 mg | Placebo | 3 |
| Study | Participants | Daily dose | Control | Follow‐up (months) |
| 129 | 5 or 10 or 25 mg | Placebo | 3 | |
| 33 | 10 or 25 mg | Placebo | 3 |
Outcomes
All participant cohorts, with three exceptions (Liu 2015; Prasad 2013; Reinsch 1994), reported on the primary outcome: fibroid‐related symptoms. Researchers assessed fibroid symptoms by measuring quality of life, menstrual bleeding and pelvic pain/pressure.
Seven studies reported quality of life. Six studies used the Uterine Fibroid Symptom Quality of Life Scale (UFS‐QoL) (Donnez 2012a; Esteve 2013; Fiscella 2006; Levens 2008; Nieman 2011; Wilkens 2008). In addition to the UFS‐QoL, three studies (Fiscella 2006; Levens 2008; Nieman 2011) reported quality of life using Short Form‐36. Donnez 2012 assessed quality of life by using a unique questionnaire on discomfort associated with uterine fibroids.
Studies used both the symptom severity scale (SS‐QoL) and the Health‐Related Quality of Life scale (HR‐QoL) of the UFS‐QoL. Both measure aspects of fibroid‐related symptoms. They are mutually exclusive, and no overlap in scoring occurs between the two outcomes. The SS‐QoL (range 0 to 100) assesses bleeding, abdominal pressure, urinary frequency and fatigue. The HR‐QoL ranges from 0 to 100 points and is comprised of six domains: Concern, Activities, Energy/Mood, Control, Self‐Conscious and Sexual Function.
With the exception of Reinsch 1994 and Liu 2015, all participant cohorts reported on the change in menstrual bleeding. At a minimum, investigators reported attainment of amenorrhoea at the end of the follow‐up period as a proportion. They frequently reported haemoglobin at baseline and at follow‐up. Four studies used standardised outcome measures to better quantify menstrual blood loss. Three studies (Bagaria 2009; Donnez 2012; Donnez 2012a) used the pictorial blood loss assessment chart (PBAC) (Higham 1990). A PBAC score of 100 or higher correlates with menorrhagia, which is defined as menstrual blood loss greater than 80 mL (Higham 1990). Wilkens 2008 used a visual analogue menstrual pictogram (Wyatt 2001), and how Prasad 2013 assessed menstrual blood loss remains unclear.
Eight studies reported pelvic pain/pressure in a heterogeneous fashion. Outcome measures for pelvic pain included the McGill Pain Questionnaire, which has a score range of 0 to 45 (higher scores indicating greater pain) (Donnez 2012; Donnez 2012a; Fiscella 2006), a visual analogue scale (Bagaria 2009; Donnez 2012; Donnez 2012a; Esteve 2013), study‐specific Likert scales (Chwalisz 2007; Engman 2009; Fiscella 2006) or a daily calendar log assessing the number of days pain was present (Levens 2008). Five studies reported changes in pelvic pressure symptoms following treatment using Likert scales (Chwalisz 2007; Engman 2009; Fiscella 2006), a visual analogue scale (Bagaria 2009) or participant‐reported presence/absence of pressure symptoms (Esteve 2013).
Researchers assessed fibroid and uterine volume using ultrasonography in all patient cohorts, with the exception of Donnez 2012, which used serial MRI. Each study used different methods of calculation. See Characteristics of included studies.
Studies, with the exception of Reinsch 1994, reported endometrial histology for all participant cohorts. Studies differed in their criteria and timelines for performing endometrial biopsy and evaluated endometrial specimens using different pathological criteria. Four studies (Donnez 2012; Donnez 2012a; Esteve 2013; Nieman 2011) used the standard definition of SPRM‐associated endometrial changes (PAEC) provided by Mutter 2008. Three studies (Chwalisz 2007; Engman 2009; Wilkens 2008) evaluated specimens using their own semiquantitative assessment of glandular architecture as described in their respective manuscripts. Four studies (Bagaria 2009; Fiscella 2006; Levens 2008; Prasad 2013) evaluated endometrial histology but did not report on non‐physiological endometrial changes nor on PAEC.
Excluded studies
Of 39 full‐text articles assessed, we excluded 25 studies for various reasons. Duplication of participant cohorts and studies that compared various doses of the same SPRM were the major reasons for exclusion. For more information on excluded studies, see Characteristics of excluded studies.
Ongoing studies
We identified 10 ongoing studies through searches of trials registers: seven ulipristal acetate, two vilaprisan and one telapristone acetate. See Characteristics of ongoing studies. From trial registers, we identified an additional 10 studies that had been completed or prematurely terminated. For details of these studies, see Characteristics of studies awaiting classification. We attempted to contact study authors to obtain data but were unsuccessful.
Risk of bias in included studies

Risk of bias graph: review authors' judgements about each risk of bias item presented as percentages across all included studies.

Risk of bias summary: review authors' judgements about each risk of bias item for each included study.
Allocation
Nine studies described true random sequence generation, and we graded them as having low risk (Bagaria 2009; Chwalisz 2007; Donnez 2012; Donnez 2012a; Engman 2009; Fiscella 2006; Levens 2008; Nieman 2011; Wilkens 2008). FIve studies provided insufficient details regarding the randomisation process; we therefore graded them as having unclear risk (Bigatti 2014; Esteve 2013; Liu 2015; Prasad 2013; Reinsch 1994). For concealment of allocation, we graded 10 studies as having low risk (Bagaria 2009; Chwalisz 2007; Donnez 2012; Donnez 2012a; Engman 2009; Esteve 2013; Fiscella 2006; Levens 2008; Nieman 2011; Wilkens 2008). Four studies provided no details of allocation concealment; we considered them as having unclear risk (Bigatti 2014; Liu 2015; Prasad 2013; Reinsch 1994). When risk of bias was unclear, we attempted to contact study authors to obtain clarification.
Blinding
Ten studies described in detail adequate blinding of both study participants/personnel (performance bias) and outcome assessors (detection bias), and we graded them as having low risk (Bagaria 2009; Chwalisz 2007; Donnez 2012; Donnez 2012a; Engman 2009; Esteve 2013; Fiscella 2006; Levens 2008; Nieman 2011; Wilkens 2008). We considered the remaining four included studies as having unclear risk for both performance and detection bias owing to inadequate details on blinding (Bigatti 2014; Liu 2015; Prasad 2013; Reinsch 1994).
We considered the same risk of bias criteria to be applicable to all outcomes.
Incomplete outcome data
We considered attrition bias to introduce low risk in nine included studies (Chwalisz 2007; Donnez 2012; Donnez 2012a; Engman 2009; Fiscella 2006; Levens 2008; Nieman 2011; Reinsch 1994; Wilkens 2008). We graded three studies as having unclear risk owing to insufficient details (Bigatti 2014; Liu 2015; Prasad 2013). We considered only two studies as having high risk (Bagaria 2009; Esteve 2013). The Bagaria study included a disproportionate number of participants lost to follow‐up from placebo versus mifepristone groups (1/20 vs 4/20), and this was magnified by small study size. Similarly, the Esteve study reported unbalanced loss to follow‐up, with significantly more drop‐outs among placebo versus mifepristone groups (15/62 vs 4/62).
Selective reporting
Eight studies were at low risk for reporting bias, with protocols available for each study and preselected outcome measures consistent with final reported outcomes in the published manuscripts (Chwalisz 2007; Donnez 2012; Donnez 2012a; Engman 2009; Fiscella 2006; Levens 2008; Nieman 2011; Wilkens 2008). We graded five studies as having unclear risk (Bagaria 2009; Bigatti 2014; Esteve 2013; Liu 2015; Prasad 2013). For the Bagaria and Esteve studies, we identified no study protocol. The Bigatti, Liu and Prasad studies provided insufficient details of outcome measures, and we found no protocols for these studies. We attempted to contact study authors for clarification without success. We considered only one study to have high risk (Reinsch 1994) as we could not identify a protocol and, although investigators described fibroid volume in the methods section, they did not report this measure as an outcome.
Other potential sources of bias
We identified four studies as having additional potential sources of bias (Bagaria 2009; Bigatti 2014; Liu 2015; Prasad 2013). In the Bagaria study, we noted potential for dose variation in the mifepristone group, as researchers provided no specific details regarding the capsule derivation method from 200 mg tablets and associated quality control. The Liu, Prasad and Bigatti studies were published as conference proceedings, and we graded them as having unclear risk owing to an overall lack of details.
Effects of interventions
See: Summary of findings for the main comparison SPRM versus placebo; Summary of findings 2 SPRM versus leuprolide acetate for uterine fibroids
Comparison of SPRM versus placebo
Nine studies compared SPRM with placebo (Bagaria 2009; Chwalisz 2007; Donnez 2012; Esteve 2013; Fiscella 2006; Levens 2008; Nieman 2011; Wilkens 2008) or vitamin B (Engman 2009). See summary of findings Table for the main comparison.
PRIMARY OUTCOMES
Fibroid‐related symptoms
Quality of life
The UFS‐QoL is a validated measure of quality of life of patients with uterine fibroids (Spies 2002). It consists of a symptom severity scale (SS‐QoL) and a health‐related quality of life scale (HR‐QoL). Subscales of the UFS‐QoL evaluate different domains of fibroid‐related symptoms and are mutually exclusive of each other; therefore, we meta‐analysed these separately. The SS‐QoL (range 0 to 100) assesses bleeding, abdominal pressure, urinary frequency and fatigue. A high symptom severity score means more severe fibroid symptoms. Investigators noted greater improvement in symptom severity scores in the SPRM group than in the placebo group, from baseline to end of treatment. Four studies that investigated mifepristone (Esteve 2013), ulipristal acetate (Levens 2008; Nieman 2011) and asoprisnil (Wilkens 2008) demonstrated this over a three‐month treatment period. The mean difference in symptom severity score from baseline to end of treatment was ‐20.04 points (95% CI ‐26.63 to ‐13.46; 171 women, I2 = 0%; moderate‐quality evidence; Analysis 1.1; Figure 4).

Forest plot of comparison: 1 SPRM versus placebo, outcome: 1.1 Change in symptom severity score (QoL).
The HR‐QoL subscale of the UFS‐QoL ranges from 0 to 100 points and comprises six domains: Concern, Activities, Energy/Mood, Control, Self‐Conscious and Sexual Function. A higher HR‐QoL score means better quality of life. Improvements in HR‐QoL were found during analysis of four studies investigating mifepristone (Esteve 2013; Fiscella 2006), ulipristal acetate (Nieman 2011) and asoprisnil (Wilkens 2008). The treatment course was three months in all studies except Fiscella 2006, which provided a six‐month treatment period. The mean difference in HR‐QoL scores from baseline to end of treatment was 22.52 points (95% CI 12.87 to 32.17; 200 women; I2 = 63%; moderate‐quality evidence; Analysis 1.2; Figure 5). This suggests greater improvement in HR‐QoL in the SPRM group than in the placebo group. Inclusion of few studies with each investigating different SPRMs may be contributing to heterogeneity.
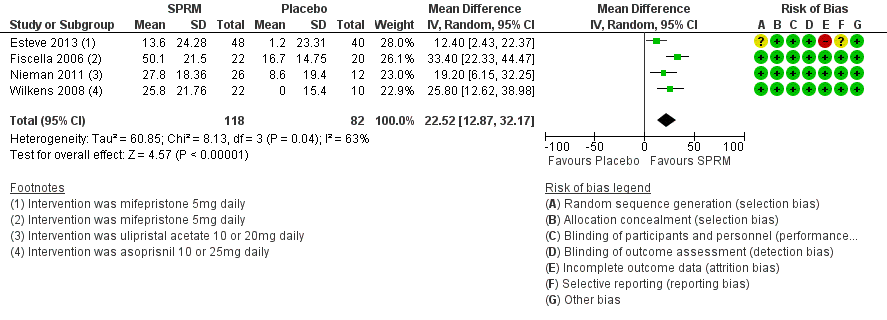
Forest plot of comparison: 1 SPRM versus placebo, outcome: 1.2 Change in health‐related quality of life score.
Abnormal uterine bleeding
Relief of bleeding
Fibroid‐related abnormal uterine bleeding symptoms were assessed in a heterogeneous fashion. We analysed various aspects separately: objective assessment of menstrual blood loss, proportion of amenorrhoeic participants at end of treatment and changes in haemoglobin (pretreatment and posttreatment).
Menstrual blood loss
Two studies investigating mifepristone (Bagaria 2009) and ulipristal acetate (Donnez 2012) used the pictorial blood loss assessment chart (PBAC). A third study evaluating asoprisnil (Wilkens 2008) used a similar menstrual pictorial score. This tool had the same directionality as PBAC, in which higher scores translated to greater menstrual blood loss. Meta‐analysis of these studies revealed improvement in menstrual bleeding at the end of three months of SPRM treatment compared with placebo (SMD ‐1.11 points, 95% CI ‐1.38 to ‐0.83; 310 women, I2 = 0%; moderate‐quality evidence; Analysis 1.3; Figure 6).

Forest plot of comparison: 1 SPRM versus placebo, outcome: 1.3 Change in menstrual blood loss.
Amenorrhoea
Seven studies investigating all three SPRMs consistently reported the proportion of participants who were amenorrhoeic at completion of treatment. Analysis demonstrates that participants treated with SPRMs for three to six months were more likely to be amenorrhoeic than those who received placebo (OR 82.50, 95% CI 37.10 to 183.90; 590 women, I2 = 0%; moderate‐quality evidence; Analysis 1.4). However, the definition of amenorrhoea was not standard between studies. A range of definitions of amenorrhoea included the following: no bleeding/spotting for the entire study period (Chwalisz 2007; Levens 2008; Nieman 2011), six or fewer days of spotting (Esteve 2013), PBAC score of 2 or less during weeks 9 to 12 (Donnez 2012), cessation of menstruation (Bagaria 2009) and not specifically defined (Fiscella 2006).
Haemoglobin
We could not meta‐analyse change in haemoglobin levels from baseline to end of treatment to yield meaningful conclusions for the following reasons: inconsistent reporting of values (means, medians, percentage point change, P value only, etc.), missing data such as measures of spread and some groups taking iron with study drug.
Eight studies reported on haemoglobin. Seven studies demonstrated an increase in haemoglobin at follow‐up in the SPRM group compared with the placebo group (Bagaria 2009; Chwalisz 2007; Donnez 2012; Engman 2009; Esteve 2013; Fiscella 2006; Nieman 2011). In Levens 2008, haemoglobin levels were unchanged over the study period in placebo and SPRM groups.
Pain and pelvic pressure
Investigators reported pelvic pain in a heterogenous manner, precluding meta‐analysis. Two studies (Donnez 2012; Fiscella 2006) used the McGill Pain Questionnaire (MPQ), two studies (Bagaria 2009; Esteve 2013) used a visual analogue scale (VAS) and the remaining studies used their own unique Likert scales (Chwalisz 2007; Engman 2009; Levens 2008).
Change in pain scores on the MPQ was less at completion of treatment compared with baseline only for the 10 mg ulipristal acetate dose compared with placebo (Donnez 2012). Fiscella 2006 reported a decrease in MPQ pain scores after treatment with 5 mg mifepristone, but this finding was not statistically significant.
Bagaria 2009 reported a non‐significant decrease in the proportion of participants experiencing complete resolution of pelvic pain, as measured by VAS, after treatment with 10 mg mifepristone. Esteve 2013 also used VAS and reported that participants treated with 5 mg mifepristone were more likely to be free of pelvic pain after completion of treatment.
Of the three studies that used their own Likert scales to evaluate pelvic pain, two did not report improvement in symptoms (Chwalisz 2007; Engman 2009). Levens 2008 presented data descriptively from daily participant journals, making it difficult for researchers to draw conclusions.
SECONDARY OUTCOMES
Change in fibroid or uterine size
Change in fibroid volume
We reported data for this outcome per fibroid tracked rather than per woman randomised and have presented this information in Table 4.
| Study | SPRM type | SPRM | Placebo | |||||
| MD | SD | n | MD | SD | n | Finding | ||
| Mifepristone | ‐41.5 cc | 220.59 | 19 | 0.6 cc | 266.63 cc | 16 | No significant difference | |
| Mifepristone | ‐10.0 cc | 107.39 | 12 | ‐16.0 cc | 98.54 cc | 15 | No significant difference | |
| Mifepristone | ‐37.0 cc | 96.24 | 58 | 4.0 cc | 99.1 cc | 47 | Favours SPRM | |
| Ulipristal acetate | ‐16.88% | 31.34 | 165 | 3.0% | 31.63 | 45 | Favours SPRM | |
| Ulipristal acetate | ‐20.5% | 20.6 | 26 | 7.0% | 25.0 | 12 | Favours SPRM | |
cc: cubic centimetres
MD: mean difference
n: fibroids tracked
SD: standard deviation
Three mifepristone studies reported ‘mean difference’ in fibroid volume from baseline to end of treatment (Bagaria 2009; Engman 2009; Esteve 2013). Two of these studies reported a decrease in fibroid volume among participants who received mifepristone compared with placebo/vitamin B. Esteve 2013 found that fibroids treated with mifepristone showed a decrease in volume compared with those treated with placebo. Two ulipristal acetate studies reported a ‘percent change’ in fibroid volume over the study period (Donnez 2012; Nieman 2011). Both of these studies reported that participants treated with ulipristal acetate had a reduction in fibroid volume compared with those given placebo. Five additional studies (Chwalisz 2007; Levens 2008; Liu 2015; Prasad 2013; Wilkens 2008) reported change in fibroid volume, but the quality of data prohibited data extraction and data were not analysed. However, qualitatively, these five studies reported a decrease in fibroid volume with SPRM treatment.
Change in uterine volume
Three studies (Bagaria 2009; Esteve 2013; Fiscella 2006) reported change in uterine volume after mifepristone treatment. Investigators reported a mean uterine volume reduction of 153.25 cc after treatment (MD ‐53.25 cc, 95% CI ‐262.19 to ‐44.32; 182 women). Donnez 2012 also assessed uterine volume after ulipristal acetate therapy but reported data as ‘percent change’ in uterine volume. The treatment group had a non‐significant reduction in median uterine volume (5 mg dose, ‐12.1 percentage point change, 95% CI ‐28.3 to 2.9; 10 mg dose, ‐12.0 percentage point change, 95% CI ‐27.7 to 6.1) compared with the placebo group (5.9 percentage point change, 95% CI ‐3.8 to 18.4). Analysis of these four studies together revealed a reduction in uterine volume after SPRM treatment compared with placebo (SMD ‐0.63, 95% CI ‐0.91 to ‐0.36; 419 women, I2 = 0; Analysis 1.5).
SPRM‐related effects
Endometrial histology
Six studies comparing all three SPRMs versus placebo (Donnez 2012; Esteve 2013; Nieman 2011; Prasad 2013; Wilkens 2008) and vitamin B (Engman 2009) assessed endometrial histology. Pathology criteria for evaluation of endometrial specimens differed between studies. Three studies (Donnez 2012; Esteve 2013; Nieman 2011) used the standard definition of SPRM‐associated endometrial changes (PAEC) provided by Mutter 2008. Engman 2009 and Wilkens 2008 evaluated specimens using their own semiquantitative assessment of glandular architecture as described in their respective manuscripts. Meta‐analysis of five studies revealed that PAEC was more common after SPRM therapy than after placebo (OR 15.12, 95% CI 6.45 to 35.47; 405 women, I2 = 0%; low‐quality evidence; Analysis 1.6). These six studies reported three cases of endometrial hyperplasia, all of which occurred in the SPRM treatment group (3/488).
Chwalisz 2007 used a different approach to evaluate endometrial histology after asoprisnil treatment. Investigators developed a new classification system for endometrial biopsies that included two additional subcategories: non‐physiological secretory effect and secretory pattern mixed‐type. Among participants for which biopsies were available, 60/85 in the asoprisnil group were classified in these new histological categories compared with 4/30 participants in the placebo group.
Four studies evaluated endometrial histology but did not report on non‐physiological endometrial changes or PAEC. Fiscella 2006 included no participants with hyperplasia in the study group. Levens 2008 reported one case of hyperplasia in the ulipristal acetate group (1/12). Bagaria 2009 included 12/19 participants in the mifepristone group showing endometrial hyperplasia compared with none in the placebo group. The pathology definition used to classify endometrial hyperplasia in this study was not clearly specified nor was any mention made of a PAEC category. Prasad 2013 reported eight cases (25%) of 'cystic glandular hyperplasia' in the mifepristone group but provided unclear pathology criteria and an unclear rate of abnormal pathology in the placebo group.
Comparison of SPRMs versus alternative active therapy
Two studies compared SPRMs versus medical therapy (leuprolide acetate). No studies compared SPRMs versus surgical management or UAE.
SPRM versus medical therapy: leuprolide acetate
See summary of findings Table 2.
We included two studies for this comparison. Reinsch 1994 evaluated 25 mg of mifepristone for three months, and we could extract only data for the uterine volume outcome. Donnez 2012a evaluated 5 mg and 10 mg of ulipristal acetate for three months and reported on other patient‐reported outcomes, in addition to uterine volume.
PRIMARY OUTCOMES
Fibroid‐related symptoms
Quality of life
Donnez 2012a found probably little or no difference in improvements in symptom severity score and HR‐QoL between ulipristal acetate and leuprolide groups using the UFS‐QoL. Results show no clear evidence of a difference in symptom severity score between SPRM and leuprolide groups (MD ‐3.70 points, 95% CI ‐9.85 to 2.45; 281 women; moderate‐quality evidence; Analysis 2.1;Figure 7), and probably little or no difference in HR‐QoL between SPRM and leuprolide groups (MD 1.06 points, 95% CI ‐5.73 to 7.85; 281 women; moderate‐quality evidence; Analysis 2.2;Figure 8).
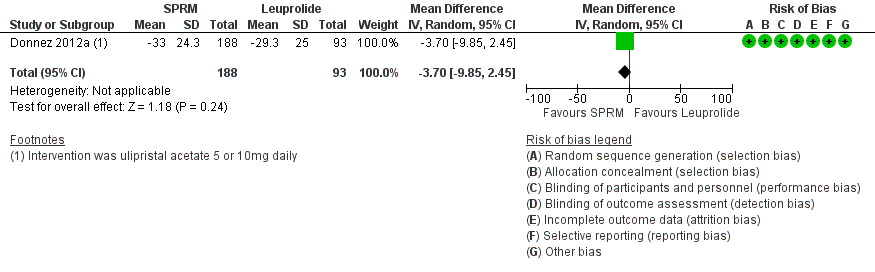
Forest plot of comparison: 2 SPRM versus leuprolide acetate, outcome: 2.1 Change in symptom severity score (QoL).

Forest plot of comparison: 2 SPRM versus leuprolide acetate, outcome: 2.2 Change in health‐related quality of life score.
Abnormal uterine bleeding
Menstrual blood loss
Donnez 2012a found little or no difference in bleeding scores on the PBAC between ulipristal acetate and leuprolide (mean difference 6 percentage point change, 95% CI ‐40.95 to 50.95; 281 women; low‐quality evidence; Analysis 2.3;Figure 9).

Forest plot of comparison: 2 SPRM versus leuprolide acetate, outcome: 2.3 Change in menstrual blood loss.
Amenorrhoea
Results showed probably little or no difference between groups in rates of amenorrhoea (5 mg dose vs leuprolide: ‐5.2 percentage point change difference, 95% CI ‐18.7 to 8.6; 10 mg dose vs leuprolide: 9.0 percentage point change difference, 95% CI ‐2.8 to 21.0). Overall, the odds ratio for amenorrhoea for the SPRM group compared with the leuprolide group was 1.14 (95% CI 0.60 to 2.16; 280 women; moderate‐quality evidence; Analysis 2.4).
Haemoglobin
Donnez 2012a found probably no difference in haemoglobin between groups (5 mg dose vs leuprolide: ‐0.02 percentage point change difference, 95% CI ‐0.3 to 0.3; 10 mg dose vs leuprolide: 0.03 percentage point change difference 95% CI ‐0.3 to 0.3).
Pain and pelvic pressure
Donnez 2012a used the McGill Pain Questionnaire and found clinically significant improvements in pelvic pain in all treatment groups. Pooled data showed probably little or no difference in improvement in pain scores between SPRM and leuprolide groups (MD ‐0.01 points on a 0 to 45 scale, 95% CI ‐2.14 to 2.12; 281 women; moderate‐quality evidence; Analysis 2.5).
SECONDARY OUTCOMES
Change in fibroid or uterine size
Change in fibroid size
We reported data for this outcome per fibroid tracked rather than per woman randomised. We have provided this information in Table 5.
| Study | SPRM | Leuprolide | |||||
| MD | SD | n | MD | SD | n | Finding | |
| Donnez 2012a | ‐39.03% | 37.92 | 188 | ‐53.0% | 24.44 | 93 | Favours leuprolide |
MD: mean difference
n: fibroids tracked
SD: standard deviation
Donnez 2012a evaluated change in total volume of the three largest myomas. Participants treated with leuprolide showed a greater reduction in fibroid volume than those treated with ulipristal acetate. The median fibroid volume reduction at end of treatment was 36 percentage point change in the 5 mg group, 42 percentage point change in the 10 mg group and 53 percentage point change in the leuprolide group. When we pooled data for the 5 mg and 10 mg doses, we found that the leuprolide group (93 participants) showed greater shrinkage in fibroid volume than the SPRM group (188 participants).
Change in uterine size
Donnez 2012a and Reinsch 1994 reported the percent change in uterine volume. Leuprolide was associated with decreased uterine volume at completion of treatment compared with SPRM. The reduction in uterine volume was 26% greater in the leuprolide group than in the SPRM group (MD 25.94%, 95% CI 20.49 to 31.39; 295 women, I2 = 0%; Analysis 2.6).
SPRM‐related effects
Donnez 2012a reported assessment of endometrial histology. This study used the definition of PAEC provided by Mutter 2008 and reported that PAEC was more common after SPRM therapy than after leuprolide treatment (OR 10.45, 95% CI 5.38 to 20.33; 301 women; moderate‐quality evidence; Analysis 2.7).
Other analyses
Formal assessment of reporting bias
We identified too few studies to construct a funnel plot to investigate publication bias.
Subgroup analyses
Included studies were few and did not allow meaningful subgroup analyses with sufficient power.
Sensitivity analyses
We applied a fixed‐effect model to our comparisons and found no significant changes in findings. When ORs were reported, we performed sensitivity analysis using risk ratio and encountered no changes to our results. Owing to the limited number of studies for primary outcomes, other planned sensitivity analyses were not possible.
Discussion
Summary of main results
This review included 14 randomised controlled trials (RCTs) that evaluated three types of selective progesterone receptor modulators (SPRMs; mifepristone, ulipristal acetate, asoprisnil). Moderate‐quality evidence shows that compared with placebo, SPRMs may improve quality of life, decrease menstrual blood loss and induce amenorrhoea. Trial results support treatment of individuals with uterine fibroids with SPRMs to improve fibroid‐related symptoms. Only two studies provided evidence obtained by comparing SPRMs versus a gonadotropin‐releasing agonist (GnRHa), and only one of these studies used sound study methods (Donnez 2012a). These limited data of moderate quality show probably little or no difference between leuprolide and SPRM in improving quality of life, achieving amenorrhoea and improving pelvic pain. Data from only one study provided insufficient evidence to allow a recommendation regarding the efficacy of one class of drugs over another for treatment of individuals with fibroid‐related symptoms.
Investigators evaluated quality of life by using two components of the Uterine Fibroid Symptom Quality of Life Scale (UFS‐QoL): symptom severity (SS‐QoL) and health‐related quality of life (HR‐QoL). Moderate‐quality evidence for both quality of life outcomes showed probable improvement with SPRM treatment compared with placebo.
Moderate‐quality evidence shows that SPRMs are probably effective in achieving amenorrhoea. The odds of achieving amenorrhoea with SPRM treatment were calculated at 82.50 compared with placebo (or 29 per 1000 in the placebo group vs 477 per 1000 in the SPRM group). See summary of findings Table for the main comparison. Furthermore, moderate‐quality evidence showed that menstrual blood loss is probably reduced with SPRM treatment. Measurement of menstrual blood loss differed between studies. Four studies used pictorial blood loss assessment charts, and the others used daily diaries, numerical rating scores or composite scores extracted from the UFS‐QoL. No studies used the alkaline‐hematin method ‐ a well‐validated quantitative assessment of menstrual bleeding.
There remains a relative paucity of data on comparison of SPRMs against other medical management options for fibroids. One RCT (Donnez 2012a) reported probably little or no difference between SPRM and leuprolide with respect to improved quality of life and menstrual bleeding scores. This same study showed that leuprolide was more effective than SPRMs in reducing fibroid volume (Analysis 2.6). Similarly, two RCTs showed that leuprolide was more effective than SPRM in reducing uterine volume (Analysis 2.6). This discrepancy between differential change in uterine/fibroid volume and similar improvements in bleeding symptoms suggests that SPRM mechanisms underpinning control of bleeding may be independent of fibroid shrinkage; this interaction is poorly understood (Wagenfeld 2016).
In keeping with known effects of SPRMs, low‐quality evidence suggests increased risk of selective progesterone receptor modulator‐associated endometrial changes (PAEC) in women treated with SPRMs versus placebo, and moderate‐quality evidence shows similar risk in comparisons with leuprolide. However, PAEC was not universally observed in all study participants (odds ratio (OR) 15.12, 95% confidence interval (CI) 4.65 to 35.47 in the comparison of SPRM vs placebo). Overall, endometrial hyperplasia was not increased after SPRM treatment. Increased rates of endometrial hyperplasia seen in one small study (Bagaria 2009) may be explained by misclassification of endometrial pathology. In light of published criteria for classifying SPRM endometrial effects (Mutter 2008), this study made no mention of a PAEC category and could have misclassified PAEC for hyperplasia.
Overall completeness and applicability of evidence
This review sought to assess the efficacy and safety of SPRMs. Researchers have reported improvements in key outcome measures when comparing SPRMs with placebo. However, additional studies comparing SPRMs versus other treatments for fibroids are needed. At present, an RCT fitting our inclusion criteria identified only leuprolide as a comparator. Other clinical trials evaluating SPRMs have not yet published results in peer‐reviewed journals nor on clinicaltrials.gov. Failure of investigators and industry to publish results of RCTs promptly has made our review vulnerable to publication bias.
With regard to safety outcomes, study authors have reported no increase in endometrial hyperplasia/malignancy after SPRM treatment. One study demonstrated an increase in endometrial hyperplasia (Bagaria 2009), but this study had serious limitations, as was previously discussed. Safety and efficacy data from this review are valid only for a treatment course of three months, as most included trials were of 12 weeks duration. The exception was Fiscella 2006, in which participants were treated for six months with no reports of hyperplasia in either group. Since the time of publication of these RCTs, more data have become available regarding endometrial safety and sustained efficacy over longer treatment periods (Donnez 2014; Donnez 2015).
Studies were conducted in Europe, North America, Cuba and India and included participants from diverse ethnic groups. However, it should be noted that participants from the PEARL (PGL4001 Efficacy Assessment in Reduction of Symptoms due to Uterine Leiomyomata) studies (Donnez 2012; Donnez 2012a) represented a significant number of those included in this meta‐analysis (549/1021). Inclusion criteria for the PEARL studies required that women have high pictorial blood loss assessment chart (PBAC) scores, anaemia and myomata larger than 3 cm. Participants were predominantly White Eastern European women. Thus, the results of this review may not be fully applicable to women with smaller, less symptomatic myomata or to those from other ethnic groups. Some evidence suggests that ulipristal acetate (UPA) may result in variable outcomes according to ethnicity (Murji 2016).
Quality of the evidence
More than half (8/14) of the included studies were at low risk of bias in all domains. The most common limitation in other studies was poor reporting of methods. We graded four studies in particular as having unclear risk across most domains primarily owing to insufficient detail in their description of study methods (Bigatti 2014; Liu 2015; Prasad 2013; Reinsch 1994). The Bigatti, Liu and Prasad papers were conference proceedings from which we could not extract reliable data, and we did not include these studies in the meta‐analyses.
Comparison of SPRM versus placebo yielded moderate‐quality evidence for most primary outcomes. We downgraded all evidence at least one level owing to strong suspicion of publication bias. Most of these studies included a small number of participants with positive results. We included no large negative studies in this review. Many unpublished industry‐sponsored studies further raise our concern regarding publication bias. Assessment of risk of SPRM‐associated endometrial changes yielded low‐quality evidence mainly owing to serious risk of measurement bias (due to inconsistencies in evaluation of endometrial histology).
Comparison of SPRM versus leuprolide generated mostly evidence of moderate quality. Again, we consistently downgraded the quality by one level owing to publication bias. For the outcome of change in menstrual blood loss, low‐quality evidence was due to very serious issues with imprecision.
One of the challenges for authors of this review was variable reporting of outcomes in these studies, particularly with regard to methods of assessing menstrual blood loss, fibroid/uterine size and quality of life parameters. Future trials assessing impact on fibroid size via imaging may wish to consider stereological assessment of the uterus rather than use of standard calliper methods (Thrippleton 2015). Consensus decisions regarding core reporting outcomes will facilitate future reviews and will permit greater ease of comparison in both future meta‐analyses and network analysis (Khan 2014; http://www.crown‐initiative.org).
Potential biases in the review process
Our literature search was comprehensive; in addition to conducting database searches, we handsearched appropriate journals, clinical trial databases and conference proceedings. Other SPRMs for which results have not yet been published are undergoing evaluation. Seven of ten studies awaiting classification were investigating telapristone acetate. Although these phase 2 and 3 studies have been completed, results are not yet published. Each of asoprisnil, vilaprisan or ulipristal acetate was the topic of one study with unpublished results.
Review authors made all important decisions regarding inclusion, bias and other aspects of analysis by discussion and consensus. When necessary, we sought additional evidence from trial authors that would help us accurately determine risk of bias. The main risk of bias involves the quality of some studies, small sample sizes and variable reporting of outcomes.
Agreements and disagreements with other studies or reviews
A previously published Cochrane review examined the use of mifepristone for uterine fibroids (Tristan 2012). Our review includes two additional studies investigating mifepristone (Esteve 2013; Reinsch 1994). Data from Esteve 2013 were published subsequent to the Tristan 2012 review. In the spirit of inclusiveness, we decided to include Reinsch 1994 data in our meta‐analysis but discussed its methodological issues both in the text and in risk of bias tables. However, owing to the small number of participants, the Reinsch study did not have a significant impact on the overall magnitude of effect size.
We also included in our analysis the three studies that were included in the Tristan 2012 mifepristone review (Bagaria 2009; Engman 2009; Fiscella 2006). Some minor differences in risk of bias assessments are evident. All review authors re‐evaluated these discrepancies and assigned final bias ratings by consensus in a manner that was consistent with ratings for other studies included in our review. Our findings are consistent with and extend those presented in the Tristan 2012 review. As a result of the larger number of participants in our study (1021 vs 112), we were able to demonstrate that SPRMs reduce fibroid volume and improve fibroid‐specific quality of life. Our review confirmed the finding that SPRMs reduce heavy menstrual bleeding.
Another Cochrane review investigated the role of pretreatment with GnRH analogues before a major surgical procedure ‐ hysterectomy or myomectomy ‐ for uterine fibroids (Lethaby 2001). An update of this review with an expanded scope including all medical therapies used before surgery for fibroids is under editorial review.
Our findings also build upon the results of other systematic reviews. For example, a meta‐analysis of ulipristal acetate for treatment of uterine fibroids found that this drug was associated with improved quality of life and reduced fibroid size when compared with placebo (Kalampokas 2016). This meta‐analysis was based on the same four ulipristal acetate studies included in our review.
Another systematic review of medical treatments for fibroids included 75 RCTs, 47 of which contributed to the network meta‐analysis (Gurusamy 2016). This meta‐analysis included the same 11 studies as were included in our review. We included three additional studies as well: Wilkens 2008 (Williams 2007 publication) reported on outcome measures of interest in our protocol, and Liu 2015 and Prasad 2013 were published subsequent to the Gurusamy 2016 review. The Gurusamy 2016 review rated risk of study bias as higher than we did, possibly because we solicited additional information/protocols from study authors that allowed us to downgrade some risk of bias assessments. The biggest difference between the two reviews involved the outcomes chosen for comparison. Our review focused on analysis of outcomes that directly impact and are clinically meaningful to patients. Our primary outcomes were changes in fibroid‐related symptoms (quality of life, amenorrhoea, reduction in bleeding, etc.). The Gurusamy review reported on the proportion of patients treated medically who underwent surgery, as well as haemoglobin levels and adverse events. On the basis of these limited comparisons, review authors concluded that evidence was insufficient to recommend medical treatment for patients with fibroids. On the basis of outcomes that we evaluated, we arrived at a different conclusion. We found that moderate‐quality evidence showed that SPRMs are more effective in improving patient‐reported outcomes when compared with placebo.
Several ongoing clinical trials are examining different drugs in the class of SPRMs. Results from these trials may alter subsequent updates of this review. Many of these ongoing trials are comparing SPRMs with other drugs rather than with placebo. These results will be of particular interest, as they will add to the literature and perhaps will inform clinical decision making.

Study flow diagram.

Risk of bias graph: review authors' judgements about each risk of bias item presented as percentages across all included studies.

Risk of bias summary: review authors' judgements about each risk of bias item for each included study.
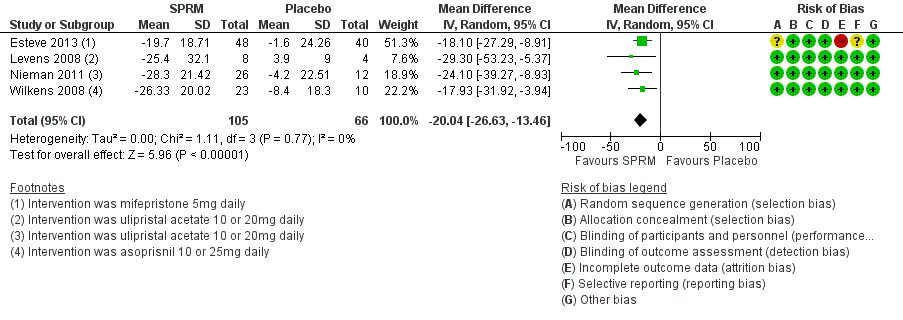
Forest plot of comparison: 1 SPRM versus placebo, outcome: 1.1 Change in symptom severity score (QoL).

Forest plot of comparison: 1 SPRM versus placebo, outcome: 1.2 Change in health‐related quality of life score.

Forest plot of comparison: 1 SPRM versus placebo, outcome: 1.3 Change in menstrual blood loss.

Forest plot of comparison: 2 SPRM versus leuprolide acetate, outcome: 2.1 Change in symptom severity score (QoL).

Forest plot of comparison: 2 SPRM versus leuprolide acetate, outcome: 2.2 Change in health‐related quality of life score.
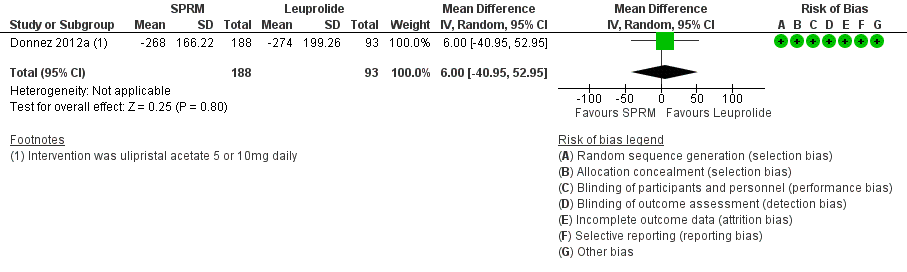
Forest plot of comparison: 2 SPRM versus leuprolide acetate, outcome: 2.3 Change in menstrual blood loss.

Comparison 1 SPRM versus placebo, Outcome 1 Change in symptom severity score (QoL).
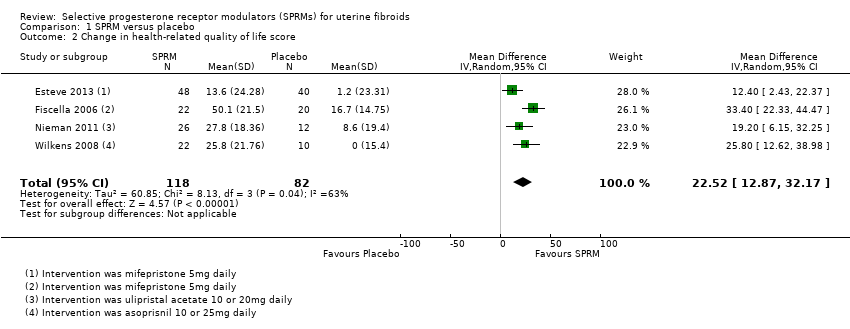
Comparison 1 SPRM versus placebo, Outcome 2 Change in health‐related quality of life score.

Comparison 1 SPRM versus placebo, Outcome 3 Change in menstrual blood loss.

Comparison 1 SPRM versus placebo, Outcome 4 Amenorrhoea.
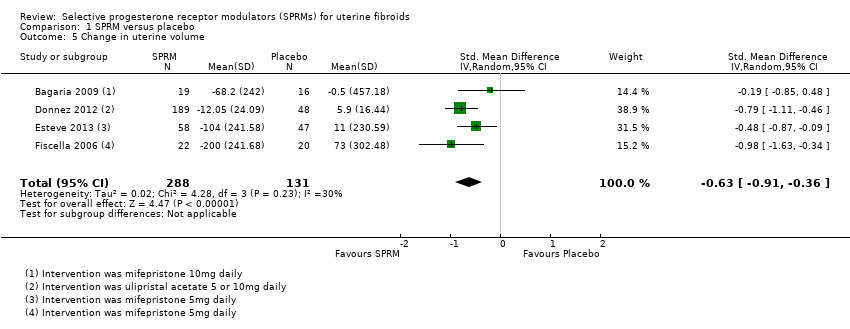
Comparison 1 SPRM versus placebo, Outcome 5 Change in uterine volume.
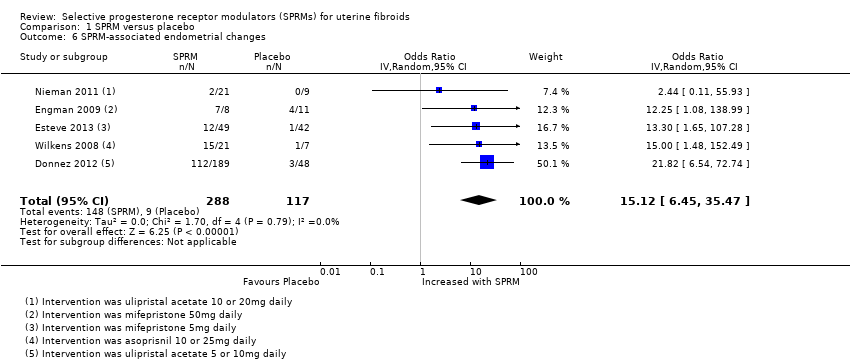
Comparison 1 SPRM versus placebo, Outcome 6 SPRM‐associated endometrial changes.
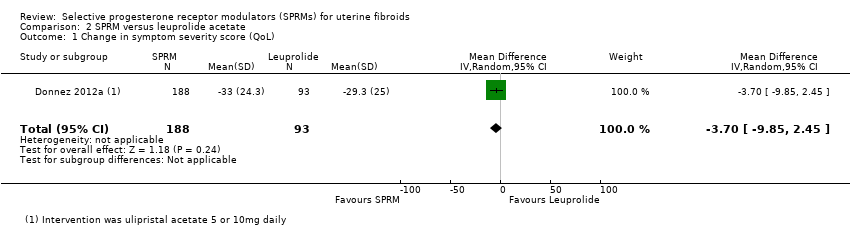
Comparison 2 SPRM versus leuprolide acetate, Outcome 1 Change in symptom severity score (QoL).

Comparison 2 SPRM versus leuprolide acetate, Outcome 2 Change in health‐related quality of life score.

Comparison 2 SPRM versus leuprolide acetate, Outcome 3 Change in menstrual blood loss.

Comparison 2 SPRM versus leuprolide acetate, Outcome 4 Amenorrhoea.

Comparison 2 SPRM versus leuprolide acetate, Outcome 5 Change in pelvic pain.
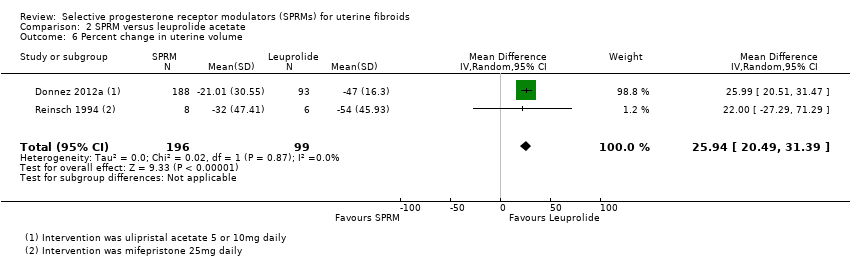
Comparison 2 SPRM versus leuprolide acetate, Outcome 6 Percent change in uterine volume.
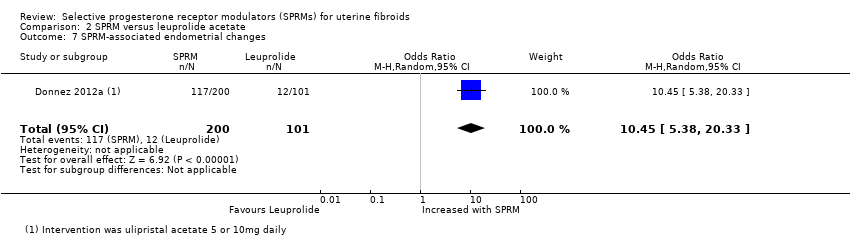
Comparison 2 SPRM versus leuprolide acetate, Outcome 7 SPRM‐associated endometrial changes.
| SPRM vs placebo | ||||||
| Patient or population: women with uterine fibroids | ||||||
| Outcomes | Anticipated absolute effects* (95% CI) | Relative effect | Number of participants | Quality of the evidence | Comments | |
| Risk with placebo | Risk with SPRM | |||||
| Quality of life: change in symptom severity score measured with Uterine Fibroid Symptom Quality of Life Scale (UFS‐QoL): scale 0 to 100 | Mean change in symptom severity score (QoL) in the intervention group was 20.04 points lower (26.63 lower to 13.46 lower), indicating improvement in symptom severity with SPRM treatment for 3 months | ‐ | 171 | ⊕⊕⊕⊝ | ||
| Quality of life: change in health‐related quality of life score measured with UFS‐QoL: scale 0 to 100 | Mean change in health‐related quality of life score in the intervention group was 22.52 points higher (12.87 higher to 32.17 higher), indicating improvement in quality of life with SPRM treatment for 3 to 6 months | ‐ | 200 | ⊕⊕⊕⊝ | 1 RCT (Fiscella 2006) reported outcomes at 6 months. Remaining studies had a 3‐month follow‐up period | |
| Abnormal uterine bleeding: change in menstrual blood loss | Mean change in menstrual blood loss in the intervention group was 1.11 points lower (1.38 lower to 0.83 lower), indicating a decrease in menstrual blood loss with SPRM treatment for 3 months | ‐ | 310 | ⊕⊕⊕⊝ | Measured by PBAC score or similar menstrual pictorial score. PBAC score ≥ 100 correlates with menorrhagia, which is defined as > 80 mL menstrual blood loss | |
| Abnormal uterine bleeding: amenorrhoea | 29 per 1000 | 477 per 1000 | OR 82.50 | 590 | ⊕⊕⊕⊝ | 1 RCT (Fiscella 2006) reported outcomes at 6 months. Remaining studies had a 3‐month follow‐up period |
| Pelvic pain (measured subjectively) | No conclusions could be drawn owing to variability in estimates | 629 (7 RCTs) | ||||
| Adverse effects: SPRM‐associated endometrial changes | 77 per 1000 | 351 per 1000 | OR 15.12 | 405 | ⊕⊕⊝⊝ | |
| *Risk in the intervention group (and its 95% confidence interval) is based on mean risk in the comparison group and relative effect of the intervention (and its 95% CI) | ||||||
| GRADE Working Group grades of evidence | ||||||
| aDowngraded one level as publication bias suspected because no small negative studies included. Also, many studies were conducted and not published bDowngraded one level because of serious issues with indirectness of evidence when criteria for evaluating endometrial specimens differed between studies | ||||||
| SPRM versus leuprolide acetate for uterine fibroids | ||||||
| Patient or population: uterine fibroids | ||||||
| Outcomes | Anticipated absolute effects* (95% CI) | Relative effect | Number of participants | Quality of the evidence | Comments | |
| Risk with leuprolide acetate | Risk with SPRM | |||||
| Quality of life: change in symptom severity score measured with Uterine Fibroid Symptom Quality of Life Scale (UFS‐QoL): scale 0 to 100 | Mean change in symptom severity score (QoL) in the SPRM group was 3.7 points lower | ‐ | 281 | ⊕⊕⊕⊝ | ||
| Quality of life: change in health‐related quality of life score measured with UFS‐QoL: scale 0 to 100 | Mean change in health‐related quality of life score in the SPRM group was 1.06 points higher | ‐ | 281 | ⊕⊕⊕⊝ | ||
| Abnormal uterine bleeding: change in menstrual blood loss (measured using PBAC score) | Mean change in menstrual blood loss in the SPRM group was 6 points higher | ‐ | 281 | ⊕⊕⊝⊝ | PBAC score ≥ 100 correlates with menorrhagia, which is defined as > 80 mL menstrual blood loss | |
| Abnormal uterine bleeding: amenorrhoea | 804 per 1000 | 828 per 1000 | OR 1.14 | 280 | ⊕⊕⊕⊝ | |
| Pelvic pain (measured using McGill Pain Questionnaire: range 0 to 45) | Mean change in pelvic pain in the SPRM group was 0.01 points lower (2.14 lower to 2.12 higher) than in the leuprolide group at 3 months | ‐ | 281 | ⊕⊕⊕⊝ | ||
| Adverse effects: SPRM‐associated endometrial changes | 119 per 1000 | 585 per 1000 | OR 10.45 | 301 | ⊕⊕⊕⊝ | |
| *Risk in the intervention group (and its 95% confidence interval) is based on mean risk in the comparison group and relative effect of the intervention (and its 95% CI) | ||||||
| GRADE Working Group grades of evidence | ||||||
| aDowngraded one level as publication bias strongly suspected bDowngraded one level owing to serious issue with imprecision as point estimate has very wide confidence interval | ||||||
| Study | Participants | Daily dose | Control | Follow‐up (months) |
| 124 | 5 mg | Placebo | 3 | |
| 42 | 5 mg | Placebo | 6 | |
| 40 | 10 mg | Placebo | 3 | |
| 62 | 10 mg | Placebo | 3 | |
| 132 | 10 mg | Placebo | 3 | |
| 14 | 25 mg | Leuprolide acetate | 3 | |
| 30 | 50 mg | Vitamin B | 3 |
| Study | Participants | Daily dose | Control | Follow‐up (months) |
| Unknown | 5 mg | No treatment | Not stated | |
| 242 | 5 or 10 mg | Placebo | 3 | |
| 303 | 5 or 10 mg | Leuprolide acetate | 3 | |
| 22 | 10 or 20 mg | Placebo | 3 | |
| 42 | 10 or 20 mg | Placebo | 3 |
| Study | Participants | Daily dose | Control | Follow‐up (months) |
| 129 | 5 or 10 or 25 mg | Placebo | 3 | |
| 33 | 10 or 25 mg | Placebo | 3 |
| Study | SPRM type | SPRM | Placebo | |||||
| MD | SD | n | MD | SD | n | Finding | ||
| Mifepristone | ‐41.5 cc | 220.59 | 19 | 0.6 cc | 266.63 cc | 16 | No significant difference | |
| Mifepristone | ‐10.0 cc | 107.39 | 12 | ‐16.0 cc | 98.54 cc | 15 | No significant difference | |
| Mifepristone | ‐37.0 cc | 96.24 | 58 | 4.0 cc | 99.1 cc | 47 | Favours SPRM | |
| Ulipristal acetate | ‐16.88% | 31.34 | 165 | 3.0% | 31.63 | 45 | Favours SPRM | |
| Ulipristal acetate | ‐20.5% | 20.6 | 26 | 7.0% | 25.0 | 12 | Favours SPRM | |
| cc: cubic centimetres MD: mean difference n: fibroids tracked SD: standard deviation | ||||||||
| Study | SPRM | Leuprolide | |||||
| MD | SD | n | MD | SD | n | Finding | |
| Donnez 2012a | ‐39.03% | 37.92 | 188 | ‐53.0% | 24.44 | 93 | Favours leuprolide |
| MD: mean difference n: fibroids tracked SD: standard deviation | |||||||
| Outcome or subgroup title | No. of studies | No. of participants | Statistical method | Effect size |
| 1 Change in symptom severity score (QoL) Show forest plot | 4 | 171 | Mean Difference (IV, Random, 95% CI) | ‐20.04 [‐26.63, ‐13.46] |
| 2 Change in health‐related quality of life score Show forest plot | 4 | 200 | Mean Difference (IV, Random, 95% CI) | 22.52 [12.87, 32.17] |
| 3 Change in menstrual blood loss Show forest plot | 3 | 310 | Std. Mean Difference (IV, Random, 95% CI) | ‐1.11 [‐1.38, ‐0.83] |
| 4 Amenorrhoea Show forest plot | 7 | 590 | Odds Ratio (IV, Random, 95% CI) | 82.50 [37.01, 183.90] |
| 5 Change in uterine volume Show forest plot | 4 | 419 | Std. Mean Difference (IV, Random, 95% CI) | ‐0.63 [‐0.91, ‐0.36] |
| 6 SPRM‐associated endometrial changes Show forest plot | 5 | 405 | Odds Ratio (IV, Random, 95% CI) | 15.12 [6.45, 35.47] |
| Outcome or subgroup title | No. of studies | No. of participants | Statistical method | Effect size |
| 1 Change in symptom severity score (QoL) Show forest plot | 1 | 281 | Mean Difference (IV, Random, 95% CI) | ‐3.70 [‐9.85, 2.45] |
| 2 Change in health‐related quality of life score Show forest plot | 1 | 281 | Mean Difference (IV, Random, 95% CI) | 1.06 [‐5.73, 7.85] |
| 3 Change in menstrual blood loss Show forest plot | 1 | 281 | Mean Difference (IV, Random, 95% CI) | 6.00 [‐40.95, 52.95] |
| 4 Amenorrhoea Show forest plot | 1 | 280 | Odds Ratio (M‐H, Random, 95% CI) | 1.14 [0.60, 2.16] |
| 5 Change in pelvic pain Show forest plot | 1 | 281 | Mean Difference (IV, Random, 95% CI) | ‐0.01 [‐2.14, 2.12] |
| 6 Percent change in uterine volume Show forest plot | 2 | 295 | Mean Difference (IV, Random, 95% CI) | 25.94 [20.49, 31.39] |
| 7 SPRM‐associated endometrial changes Show forest plot | 1 | 301 | Odds Ratio (M‐H, Random, 95% CI) | 10.45 [5.38, 20.33] |