| Study measure time point/ duration | FF/VI 100/25 mcg Mean (SE), N, of MD (95% CI) | FF 100 mcg Mean (SE), N | FF 200 mcg Mean (SE), N | FF/VI 200/25 mcg Mean (SE), N | VI 25 mcg Mean (SE), N | FP/SAL250/50 mcg twice‐daily Mean (SE), N | FP 500 mcg Mean (SE), N | Placebo Mean (SE), N | MD (95% CI, unless otherwise stated) |
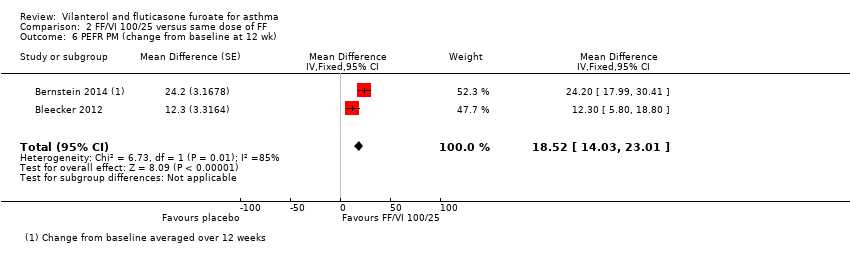
| Bernstein 2014 Trough FEV1 At 0 to 12 weeks Change in baseline trough FEV1 from baseline to week 12 | 0.441 L (0.022) | 0.365 L (0.022) | ‐ | 0.457 L (0.022) | ‐ | ‐ | ‐‐ | ‐ | ‐ |
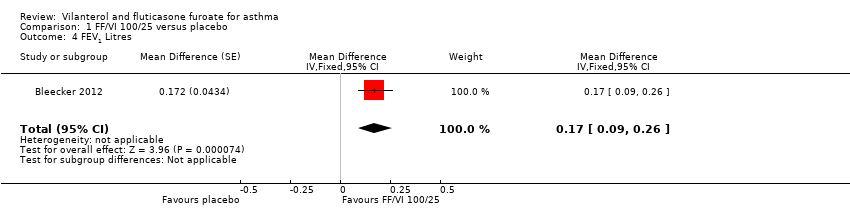
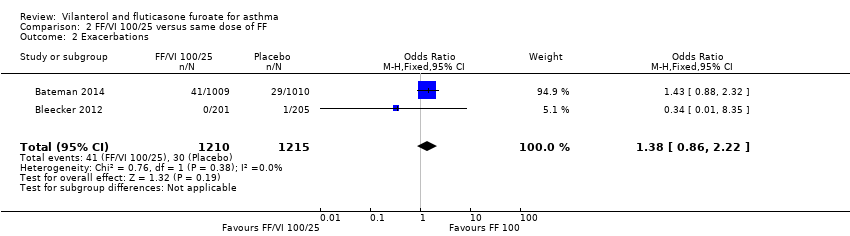
| Bleecker 2012 Trough FEV1 At 0 to 12 weeks Mean change in trough FEV1 (pre‐bronchodilator and pre‐dose) from baseline to week 12 | 0.368 L (0.0304), n = 200 | 0.332 L (0.0302), n = 203 | ‐ | ‐ | ‐ | ‐ | ‐ | 0.196 L (0.0310), n = 193 | 0.04 L (‐0.05 to 0.12) 0.17 L (0.09 to 0.26) 0.14 L (0.05 to 0.22) |
| Lee 2014 Trough FEV1 combining all treatment periods At 0 to 2 weeks 3 of 7 treatments (2 weeks) separated by 12 to 14‐day washout periods | 0.200 L, n = 158 | 0.087 L, n = 158 | ‐ | ‐ | ‐ | ‐ | ‐ | ‐ | ‐ |
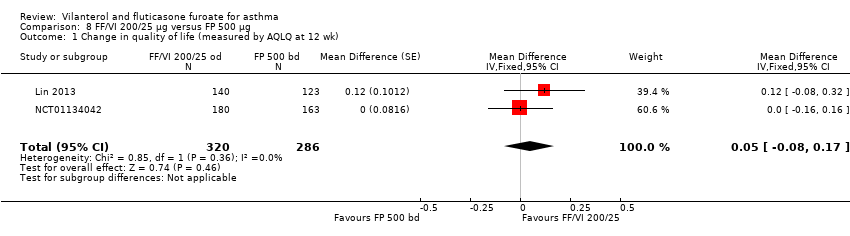
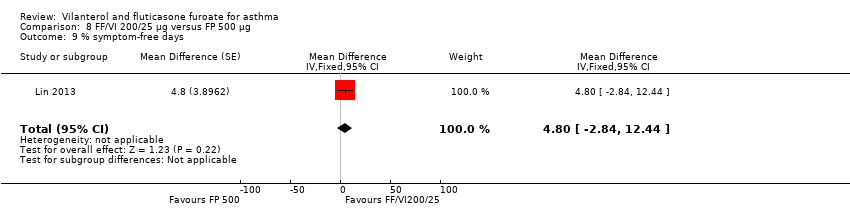
| Lin 2013 12 weeks' duration | ‐ | ‐ | ‐ | ‐ | ‐ | ‐ | ‐ | ‐ | Adjusted treatment difference 0.108 L (0.040 to 0.176) |
| Kempsford 2012 Weighted mean FEV1 over the day At day 14 Weighted mean FEV1, over 0 to 24 hours post dose at day 14 Cross‐over trial. Each period lasted 14 days with a 14 to 21‐day washout period | AM dose: 3.188 L
(3.112 to 3.265), n = 24 PM dose: 3.233 L
(3.159 to 3.306), n = 25 | ‐ | ‐ | ‐ | ‐ | ‐ | ‐ | 2.811 L
(2.729 to 2.893), n = 20 | AM vs placebo 0.377 L (90% CI 0.293 to 0.462) PM vs placebo 0.422 L (90% CI 0.337 to 0.507) AM vs PM ‐0.44 L (90% CI ‐0.125 to 0.36) |
| (Kempsford 2012) Day 14 pre‐treatment (trough) AM FEV1 At day 14 | AM dose: 3.191 L
(3.087 to 3.295), n = 24 PM dose: 3.285 L
(3.187 to 3.383), n = 25 | ‐ | ‐ | ‐ | ‐ | ‐ | ‐ | 2.788 L
(2.684 to 2.892), n = 22 | AM vs placebo 0.403 L (90% CI 0.272 to 0.533) PM vs placebo 0.496 L (90% CI 0.369 to 0.624) AM vs PM ‐0.094 L (90% CI ‐0.221 to 0.034) |
| (Kempsford 2012) Day 14 pre‐treatment (trough) PM FEV1 At day 14 | AM dose: 3.153 L
(3.049 to 3.258), n = 24 PM dose: 3.188 L
(3.088 to 3.288), n = 25 | ‐ | ‐ | ‐ | ‐ | ‐ | ‐ | 2.879 L
(2.775 to 2.982), n = 23 | AM vs placebo 0.275 L (90% CI 0.169 to 0.380) PM vs placebo 0.309 L (90% CI 0.205 to 0.413) AM vs PM ‐0.034 (90% CI ‐0.138 to 0.070) |
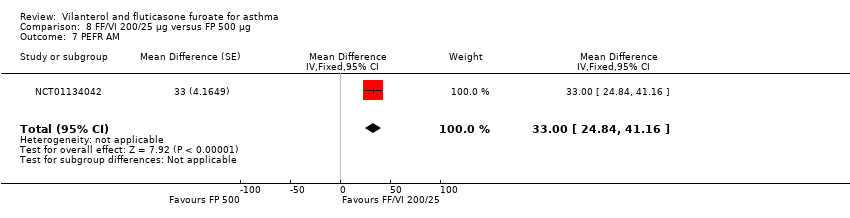
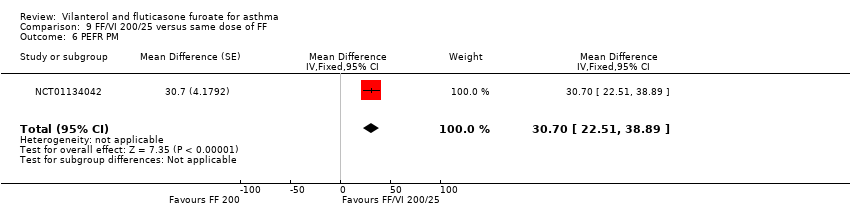
| NCT01134042 Change in baseline trough FEV1 At 24 weeks Change from baseline in clinic visit trough (pre‐bronchodilator and pre‐dose) FEV1 at end of 24‐week treatment period | ‐ | ‐ | 0.201 L (0.0303), n = 186 | 0.394 L (0.0302), n = 187 | ‐ | ‐ | 0.183 L (0.0300), n = 190 | ‐ | ‐0.19 L (‐0.28 to ‐0.11) 0.02 L (‐0.06 to 0.10) 0.21 L (0.13 to 0.29) |
| (NCT01134042) Change from baseline in weighted mean serial FEV1 over 24 hours At 24 weeks Change from baseline in weighted mean serial FEV1 over 0 to 24 hours post dose at week 24 | ‐ | ‐ | 0.328 L (0.0493), n = 83 | 0.464 L (0.0470), n = 89 | ‐ | ‐ | 0.258 L (0.0483), n = 86 | ‐ | ‐0.14 L (‐0.27 to ‐0.00) 0.07 L (‐0.07 to 0.21) 0.21 L (0.07, 0.34) |
| Oliver 2012 23 hours post challenge At day 29 Cross‐over trial ‐ 28 days for each period Weighted mean change from baseline in FEV1 between 0 and 2 hours following 22 to 23‐hour post‐treatment allergen challenge at day 29 of each treatment period | ‐0.227 L (0.0550), n = 46 | ‐0.210 L (0.0549), n = 49 | ‐ | ‐ | ‐ | ‐ | ‐ | ‐0.372 L (0.0557), n = 45 | FF vs placebo 0.162 L (0.087 to 0.237) FF/VI vs placebo 0.145 L (0.069 to 0.222) FF/VI vs FF ‐0.017 L (‐0.091 to 0.057) |
| (Oliver 2012) Decrease from baseline 23 hours post challenge At day 29 Maximum % decrease from baseline FEV1 between 0 and 2 hours following 22 to 23‐hour post‐treatment allergen challenge at day 29 of each treatment period (time frame: baseline and at day 29 of each treatment period (up to study day 197)) | ‐13.206% (2.0491), n = 46 | ‐14.040% (2.0435), n = 49 | ‐ | ‐ | ‐ | ‐ | ‐ | ‐24.991% (2.0736), n = 45 | FF vs placebo 10.951% (8.053 to 13.848)
FF/VI vs placebo 11.785% (8.849 to 14.721)
FF/VI vs FF 0.834% (‐2.010 to 3.678) |
| (Oliver 2012) Change from baseline FEV1 23 hours post challenge Minimum FEV1 absolute change from baseline between 0 and 2 hours following 22 to 23‐hour post‐treatment allergen challenge at day 29 of each treatment period | ‐0.478 L (0.0767), n = 46 | ‐0.479 L (0.0765), n = 49 | ‐ | ‐ | ‐ | ‐ | ‐ | ‐0.809 L (0.0775), n = 45 | FF vs placebo 0.330 L (0.232 to 0.429)
FF/VI vs placebo 0.331 L (0.231 to 0.43)
FF/VI vs FF 0.001 L (‐0.096 to 0.097) |
| Oliver 2013 Change from baseline 4 to 10 hours post challenge At day 21 Cross‐over trial ‐ 21 days LAR: absolute change from baseline in minimum FEV1 between 4 and 10 hours following 1‐hour post‐treatment allergen challenge at day 21 of each treatment period | ‐0.216 L
(‐0.343 to ‐0.088), n = 26 | ‐0.188 L
(‐0.315 to ‐0.061), n = 27 | ‐ | ‐ | ‐0.536 L
(‐0.676 to ‐0.396), n = 22 | ‐ | ‐ | ‐0.731 L
(‐0.878 to ‐0.584), n = 20 | ‐ |
| (Oliver 2013) Change from baseline 4 to 10 hours post challenge At day 21 LAR: absolute change from baseline in weighted mean FEV1 between 4 and 10 hours following 1‐hour post‐treatment allergen challenge at day 21 of each treatment period | 0.018 L
(‐0.089 to 0.125), n = 26 | 0.018 L
(‐0.089 to 0.124), n = 27 | ‐ | ‐ | ‐0.298 L
(‐0.415 to ‐0.181), n = 22 | ‐ | ‐ | ‐0.466 L
(‐0.589 to ‐0.343), n = 20 | ‐ |
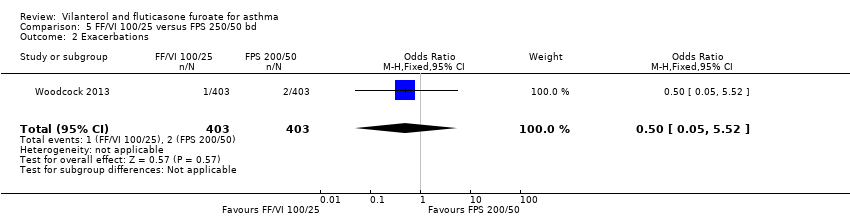
| Woodcock 2013 Change from baseline trough FEV1 At day 168 24 weeks' duration | 0.281 L (0.0191), n = 397 | ‐ | ‐ | ‐ | ‐ | 0.300 L (0.0193), n = 389 | ‐ | ‐ | ‐0.019 L (‐0.073 to 0.034) |