Werbebeschränkungen bzw. ‐verbote für alkoholische Getränke zur Verringerung des Alkoholkonsums von Erwachsenen und Jugendlichen
Referencias
References to studies included in this review
References to studies excluded from this review
Additional references
Characteristics of studies
Characteristics of included studies [ordered by study ID]
Ir a:
| Methods | STUDY TYPE:
COUNTRY:
SETTING:
DURATION OF RECRUITMENT:
DURATION OF TRIAL:
FOLLOW UP:
| |
| Participants | INCLUSION CRITERIA:
EXCLUSION CRITERIA:
Number of participants randomised: 80 in 40 pairs, each pair randomised to one of four exposure groups (20 participants in each group) Baseline data:
| |
| Interventions | Three discrete interventions and one control group were provided. Prior to the interventions, all participant pairs were told that they would see a movie clip interrupted by two commercial breaks and to act like they were relaxing at home. Free drinks were available in the refrigerator, nuts and chips were offered and smoking was allowed. Taxi fare was provided for men who drank three or more bottles of wine or beer and all participants received nine euros for their participation INTERVENTION AM/AC (20 participants):
INTERVENTION Alcohol Movie/Neutral Commercial (AM/NC) (20 participants):
INTERVENTION Neutral Movie/Alcohol Commercial (NM/AC) (20 participants):
CONTROL NM/NC (20 participants):
The commercials were selected to be similar in terms of number, length and diversity of the presented products | |
| Outcomes | The outcomes were not clearly reported as primary or secondary. OUTCOMES:
| |
| Notes | ETHICS: The local ethics committee approved the laboratory protocols INFORMED CONSENT: This is unlikely as the article states that none of the participants guessed the real aim of the study indicating that this was withheld from them. Participants provided written permission to be video and audio recorded and to allow the footage to be used afterwards FUNDING: The lead author was funded by a fellowship of the Netherlands Organisation for Scientific Research. Funding for the study was received from The Netherlands Organisation for Scientific Research and a private organisation called STAP, an organisation against alcohol misuse and its consequences. The report states that both organisations were not involved in the development of design, collection of the data, writing the paper or decision to submit the paper for publication | |
| Risk of bias | ||
| Bias | Authors' judgement | Support for judgement |
| Random sequence generation (selection bias) | High risk | The method of generating the sequence is not reported. The article states that men who were in the group allocated to watch movies with a high alcohol content reported higher rates of drinking in the week prior to the study indicating randomisation was not successful |
| Allocation concealment (selection bias) | Unclear risk | Not reported |
| Was knowledge of the allocated interventions adequately prevented during the study | High risk | The research staff were aware of the allocated groups. Participants were aware of the content they were watching but were unaware whether they were in an intervention or control group |
| Were incomplete outcome data adequately addressed | Low risk | All participants completed the trial and outcomes were available for all 80 participants |
| Was the study free from selective outcome reporting bias | Low risk | The trial was not registered on a trial database but results were reported for all outcomes identified in the methods section of the paper |
| Was the intervention unlikely to affect data collection (ITS) | Low risk | Not applicable to RCT |
| Was the intervention independent of other changes (ITS) | Low risk | Not applicable to RCT |
| Was the shape of the intervention effect pre‐specified (ITS) | Low risk | Not applicable to RCT |
| Was the study free from other risks of bias | Low risk | There is no indication of other bias |
| Methods | STUDY TYPE:
COUNTRY:
SETTING:
DURATION OF STUDY PERIOD:
ANALYSIS TYPE: Reported as time series analysis using the methods of Box and Jenkins (1970). Auto‐regressive, integrated moving average (ARIMA) models were used | |
| Participants | Adult population 15 years and older purchasing alcohol | |
| Interventions | INTERVENTION: Type:
Media:
Duration of intervention:
CONTROL: Type:
Media:
Duration of control:
COMPARISON: The consumption rates were compared to those in the province of New Brunswick where a similar ban had been in place and was not lifted during the same period | |
| Outcomes | PRIMARY OUTCOME:
SECONDARY OUTCOMES:
| |
| Notes | ETHICS: Not applicable as nationally aggregated data. FUNDING: Not clearly reported; study undertaken by employees of Health Services and Promotion branch of the Health and Welfare Canada | |
| Risk of bias | ||
| Bias | Authors' judgement | Support for judgement |
| Random sequence generation (selection bias) | High risk | Not a RCT |
| Allocation concealment (selection bias) | High risk | Not a RCT |
| Was knowledge of the allocated interventions adequately prevented during the study | Low risk | The outcome of monthly alcohol sales was objectively measured by routine data collection and was thus unlikely to have been influenced by knowledge of the intervention |
| Were incomplete outcome data adequately addressed | Low risk | There is no report of missing data as each month is accounted for. The methodology that the liquor commissions used to collect data was not reported |
| Was the study free from selective outcome reporting bias | Low risk | There is no indication that other outcomes would be of interest |
| Was the intervention unlikely to affect data collection (ITS) | Low risk | The data were collected from routine source before and after the lifting of the ban |
| Was the intervention independent of other changes (ITS) | Unclear risk | No report of historical or political reasons underpinning decision to lift the ban |
| Was the shape of the intervention effect pre‐specified (ITS) | Low risk | Yes, the lifting of the ban was predicted to increase sales of alcohol |
| Was the study free from other risks of bias | High risk | There is an acknowledged possibility that advertising from other provinces and countries would not have been stopped by the ban, causing a dilution effect. Seasonality may have affected results and this is addressed in the analysis |
| Methods | STUDY TYPE:
COUNTRY:
SETTING:
DURATION OF STUDY PERIOD:
ANALYSIS TYPE: Reported as time series analysis using the methods of Glass, Wilson and Gottman. t test values reported | |
| Participants | Defined as adult population purchasing alcohol | |
| Interventions | INTERVENTION: Type:
Media:
Duration of intervention:
CONTROL: Type:
Duration of control:
COMPARISON: The beer consumption rates were compared to those in the province of Alberta where no ban had been in place during the same period | |
| Outcomes | PRIMARY OUTCOME:
SECONDARY OUTCOMES:
| |
| Notes | ETHICS: Not applicable as nationally aggregated data FUNDING: Conducted by the Addiction Research Foundation, Canada, and assumed to be the funding source | |
| Risk of bias | ||
| Bias | Authors' judgement | Support for judgement |
| Random sequence generation (selection bias) | High risk | Not a RCT |
| Allocation concealment (selection bias) | High risk | Not a RCT |
| Was knowledge of the allocated interventions adequately prevented during the study | Low risk | The outcome of consumption was objectively measured by routine data collection and was thus unlikely to have been influenced by knowledge of the intervention |
| Were incomplete outcome data adequately addressed | Low risk | There is no report of missing data as each month is accounted for |
| Was the study free from selective outcome reporting bias | Low risk | There is no indication that other outcomes would be of interest |
| Was the intervention unlikely to affect data collection (ITS) | Low risk | The data were collected from routine source before and after the ban |
| Was the intervention independent of other changes (ITS) | Unclear risk | No report of historical or political reasons underpinning decision to implement ban |
| Was the shape of the intervention effect pre‐specified (ITS) | Low risk | It was predicted that beer sales would decrease |
| Was the study free from other risks of bias | High risk | Seasonality was not addressed although the analysis may have adjusted for this but no details are given. Broadcast and printed media originating outside the province were not subject to regulation or control by the Manitoba Provincial Liquor Commission |
| Methods | STUDY TYPE:
COUNTRY:
SETTING:
DURATION OF STUDY PERIOD:
ANALYSIS: Simple mean comparisons using t test on de‐trended data | |
| Participants | Adult population purchasing alcohol | |
| Interventions | INTERVENTION: Type:
Media:
Duration of intervention:
CONTROL: Type:
Duration of control:
COMPARISON: The consumption rates were compared to those in the province of Ontario where no ban had been in place during the same period | |
| Outcomes | PRIMARY OUTCOME:
SECONDARY OUTCOMES:
| |
| Notes | ETHICS: Not applicable as nationally aggregated data. FUNDING: Addiction Research Foundation, Canada and Alcoholism Foundation of British Columbia | |
| Risk of bias | ||
| Bias | Authors' judgement | Support for judgement |
| Random sequence generation (selection bias) | High risk | Not a RCT |
| Allocation concealment (selection bias) | High risk | Not a RCT |
| Was knowledge of the allocated interventions adequately prevented during the study | Low risk | The outcome of consumption was objectively measured by routine data collection and was thus unlikely to have been influenced by knowledge of the intervention |
| Were incomplete outcome data adequately addressed | Unclear risk | Data were not available for all alcohol types across all the same periods. The author states that he was unable to obtain the data despite requests |
| Was the study free from selective outcome reporting bias | Low risk | There is no indication that other outcomes would be of interest |
| Was the intervention unlikely to affect data collection (ITS) | Low risk | The data were collected from routine sources before and after the ban |
| Was the intervention independent of other changes (ITS) | High risk | The ban was initiated by a unanimous political vote, but the ban was stopped after elections when there was a change in political power. There is a likelihood that other political or social changes may have coincided with the period of the ban |
| Was the shape of the intervention effect pre‐specified (ITS) | Low risk | An increase in consumption was predicted after the ban was removed. This was tested and the point was dated |
| Was the study free from other risks of bias | High risk | There is an acknowledged possibility that advertising from other states would not have been stopped by the ban, causing a dilution effect. Seasonality may have affected results and this is addressed in the analysis. Mediators of alcohol use, other than advertising, are not discussed |
RCT: randomised controlled trial
SD: standard deviation
Characteristics of excluded studies [ordered by study ID]
Ir a:
| Study | Reason for exclusion |
| This marketing study performed several interrupted time series of restrictions of advertising on beer sales within Anheuser‐Busch Inc. (the company that manufacturer BUDWEISER beer) between 1963 and 1968. No numerical data were presented in the report, only graphical representation of the stimuli‐response curve and we were therefore unable to extract useful data | |
| This econometric analysis of four European nations (France, Germany, Netherlands, UK) evaluated the effects of advertising using two different models between years spanning 1968 to 1991. Bans were not in place in these countries. The authors also consider Sweden in the years 1970 to 1989 with a ban implemented in 1979. The data are not presented but the authors report that the results did not differ between the dataset spanning the period 1970 to 1989 compared with the period after the ban (1979 to 1989). The actual data are not presented and we could not therefore extract them | |
| This is a meta‐regression of elasticities of alcohol demand in 132 studies. The specific intervention time point was not possible to identify for the individual studies from the aggregated data | |
| This US‐based study used data from a large database of surveys collected by a media metrics agency to measure the effectiveness of 275 different online alcohol advertising campaigns between 2001 and 2008. 61,580 consumers browsing the website on which a campaign ran were either exposed to an advertisement for alcohol or a dummy advertisement for a neutral product, based on a randomised numerical algorithm placed on the advertisement server. Both exposed and not exposed (control) respondents were then recruited using an online survey invitation typically issued by a pop‐up window. Respondents were asked whether they were likely or not likely to purchase a variety of products including the alcohol product advertised. These results were then evaluated against the background advertising restrictions of the relevant state. The study reported that results show that people are 8% less likely to say that they will purchase an alcoholic beverage in states that have alcohol advertising bans compared with states that do not. For consumers exposed to online advertising, this gap narrows to 3%. We excluded this study as the outcome measured intent to purchase and not sales and consumption data | |
| This French government report of 1999 details the consumption of alcohol in France before, during and after the introduction of the Loi Evin (ban on alcohol and smoking advertising) implemented in 1991. The law curtails alcohol advertising on television and in cinemas, and disallows sport sponsorship. Data are not presented in a manner which allowed us to extract them and are in the form of reporting of cross‐sectional surveys. Only annual percentages of consumption are presented as reported in different surveys. No methodology, variance or significance levels were provided. The report states that in France alcohol consumption was declining prior to the introduction of the banning law and that internal surveys have produced contradictory results. The report notes that the proportion of alcohol consumers aged 12 to 18 years had a tendency to decline in the 1980s, but then increased significantly between 1991 and 1995, from 47% in 1991 to 65% in 1995 | |
| This pre‐post controlled study was conducted in an Australian community with a recognised substantial alcohol problem. Restriction of promotion or advertising of full strength beer, spirits mixers or 2 litre casks of wine was introduced simultaneously with restrictions on hours of sales of alcohol and container types for selling alcohol. The intervention was thus complex and the effects could not be disaggregated to restrictions on advertising only | |
| This study conducted regression analyses on cross‐country panel data from seventeen OECD countries for the period 1977 to 1995. Within the aggregated data, there was no indication of a specific point in time where the restrictions were implemented within individual countries. The country‐specific data were not available from the author for further analysis | |
| This study analysed panel data from 45 US states for the period 1982 to 1997. Within the aggregated data, there was no indication of a specific point in time where the restrictions were implemented within states. The state‐specific data were not available from the author for further analysis | |
| This study conducted regression analyses of cross‐country panel data from seventeen OECD countries for the period 1975 to 2000. It is an update of the Nelson 2001 study. Within the aggregated data, there was no indication of a specific point in time where the restrictions were implemented within individual countries. The country‐specific data were not available from the author for further analysis | |
| This is a pooled time series from 17 OECD countries for the period 1970 to 1983. Within the aggregated data, there was no indication of a specific point in time where the restrictions were implemented within individual countries. The country‐specific data were not available from the author for further analysis | |
| This economic analysis evaluates a pooled time series of data from 20 OECD countries for the period from 1970 to 1995. It is an update of the earlier analysis by Saffer 1991. Within the aggregated data, there was no indication of a specific point in time where the restrictions were implemented within individual countries. The country‐specific data were not available from the author for further analysis | |
| This analysis re‐examines the same dataset from Saffer 1991 evaluating 17 OECD countries from 1970 to 1983 and employs a different analysis and set of assumptions. An additional reference, Saffer 1993, offers a response to this analysis. Within the aggregated data, there was no indication of a specific point in time where the restrictions were implemented within individual countries |
OECD: Organization for Economic and Cooperation Development
Data and analyses
| Outcome or subgroup title | No. of studies | No. of participants | Statistical method | Effect size |
| 1 Total alcohol consumption in number of glasses Show forest plot | 1 | 80 | Mean Difference (IV, Fixed, 95% CI) | ‐0.65 [‐1.23, ‐0.07] |
| Analysis 1.1  Comparison 1 Low‐alcohol content movies versus high‐alcohol content movies, Outcome 1 Total alcohol consumption in number of glasses. | ||||
| Outcome or subgroup title | No. of studies | No. of participants | Statistical method | Effect size |
| 1 Total alcohol consumption in number of glasses Show forest plot | 1 | 80 | Mean Difference (IV, Fixed, 95% CI) | ‐0.73 [‐1.30, ‐0.16] |
| Analysis 2.1  Comparison 2 Non‐alcohol commercials versus alcohol commercials, Outcome 1 Total alcohol consumption in number of glasses. | ||||
| Outcome or subgroup title | No. of studies | No. of participants | Statistical method | Effect size |
| 1 Total alcohol consumption Show forest plot | 1 | Coefficient (Fixed, 95% CI) | 0.74 [0.05, 1.43] | |
| Analysis 3.1 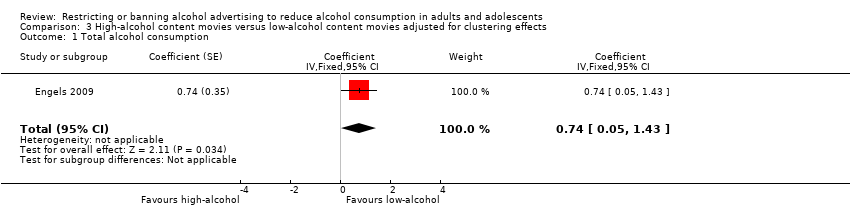 Comparison 3 High‐alcohol content movies versus low‐alcohol content movies adjusted for clustering effects, Outcome 1 Total alcohol consumption. | ||||
| Outcome or subgroup title | No. of studies | No. of participants | Statistical method | Effect size |
| 1 Total alcohol consumption Show forest plot | 1 | Coefficient (Fixed, 95% CI) | 0.83 [0.14, 1.52] | |
| Analysis 4.1 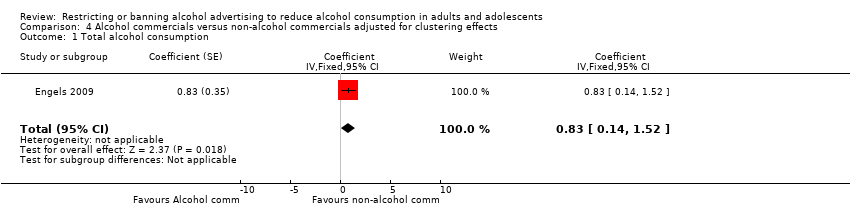 Comparison 4 Alcohol commercials versus non‐alcohol commercials adjusted for clustering effects, Outcome 1 Total alcohol consumption. | ||||
| Outcome or subgroup title | No. of studies | No. of participants | Statistical method | Effect size |
| 1 Volume of alcohol (beer, wine and spirits) sales in kilolitres Show forest plot | 1 | Mean Difference (Fixed, 95% CI) | ‐11.11 [‐27.56, 5.34] | |
| Analysis 5.1  Comparison 5 Total advertising ban versus Partial advertising ban Abrupt permanent model, Outcome 1 Volume of alcohol (beer, wine and spirits) sales in kilolitres. | ||||
| 2 Volume of beer sales in kilolitres Show forest plot | 1 | Mean Difference (Fixed, 95% CI) | 14.89 [0.39, 29.39] | |
| Analysis 5.2 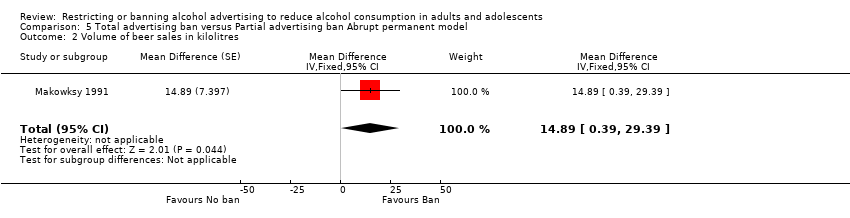 Comparison 5 Total advertising ban versus Partial advertising ban Abrupt permanent model, Outcome 2 Volume of beer sales in kilolitres. | ||||
| 3 Volume of wine sales in kilolitres Show forest plot | 1 | Mean Difference (Fixed, 95% CI) | 1.15 [‐0.91, 3.21] | |
| Analysis 5.3  Comparison 5 Total advertising ban versus Partial advertising ban Abrupt permanent model, Outcome 3 Volume of wine sales in kilolitres. | ||||
| 4 Volume of spirits sales in kilolitres Show forest plot | 1 | Mean Difference (Fixed, 95% CI) | ‐22.49 [‐36.83, ‐8.15] | |
| Analysis 5.4  Comparison 5 Total advertising ban versus Partial advertising ban Abrupt permanent model, Outcome 4 Volume of spirits sales in kilolitres. | ||||
| Outcome or subgroup title | No. of studies | No. of participants | Statistical method | Effect size |
| 1 Volume of alcohol (beer, wine and spirits) sales in kilolitres Show forest plot | 1 | Mean Difference (Fixed, 95% CI) | ‐11.96 [‐55.42, 31.50] | |
| Analysis 6.1 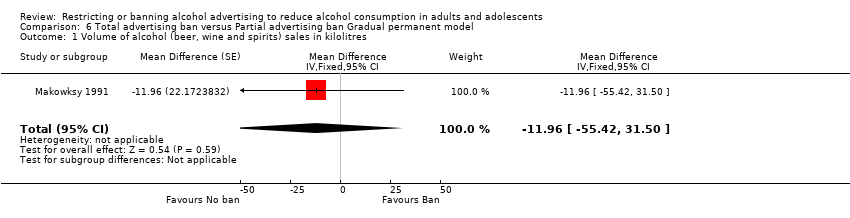 Comparison 6 Total advertising ban versus Partial advertising ban Gradual permanent model, Outcome 1 Volume of alcohol (beer, wine and spirits) sales in kilolitres. | ||||
| 2 Volume of beer sales in kilolitres Show forest plot | 1 | Mean Difference (Fixed, 95% CI) | ‐0.54 [‐1.57, 0.49] | |
| Analysis 6.2  Comparison 6 Total advertising ban versus Partial advertising ban Gradual permanent model, Outcome 2 Volume of beer sales in kilolitres. | ||||
| 3 Volume of wine sales in kilolitres Show forest plot | 1 | Mean Difference (Fixed, 95% CI) | ‐0.00 [‐0.04, 0.04] | |
| Analysis 6.3  Comparison 6 Total advertising ban versus Partial advertising ban Gradual permanent model, Outcome 3 Volume of wine sales in kilolitres. | ||||
| 4 Volume of spirits sales in kilolitres Show forest plot | 1 | Mean Difference (Fixed, 95% CI) | ‐27.8 [‐59.34, 3.74] | |
| Analysis 6.4 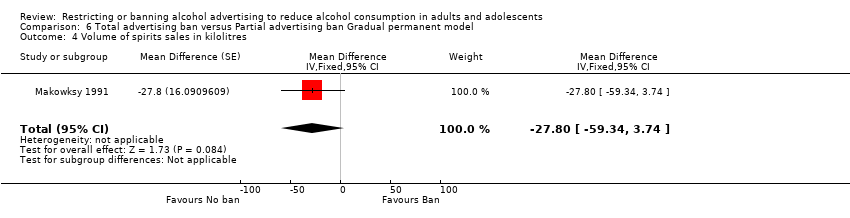 Comparison 6 Total advertising ban versus Partial advertising ban Gradual permanent model, Outcome 4 Volume of spirits sales in kilolitres. | ||||
| Outcome or subgroup title | No. of studies | No. of participants | Statistical method | Effect size |
| 1 % Change in beer consumption Show forest plot | 2 | Mean % change (Random, 95% CI) | 1.10 [‐5.26, 7.47] | |
| Analysis 7.1  Comparison 7 Alcohol ban versus no ban, Outcome 1 % Change in beer consumption. | ||||

Flow diagram of screening and eligibility of records of electronic databases: PubMed, EMBASE, The Cochrane Library (CENTRAL and UK National Health Service Economic Evaluations Database) and PsychINFO
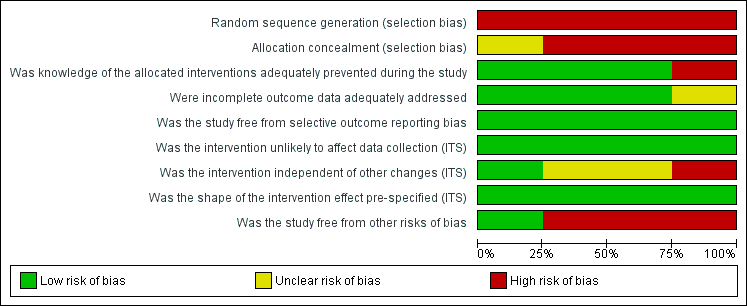
'Risk of bias' graph: review authors' judgements about each risk of bias item presented as percentages across all included studies (N = 4).

'Risk of bias' summary: review authors' judgements about each risk of bias item for each included study (N = 4).

Comparison 1 Low‐alcohol content movies versus high‐alcohol content movies, Outcome 1 Total alcohol consumption in number of glasses.
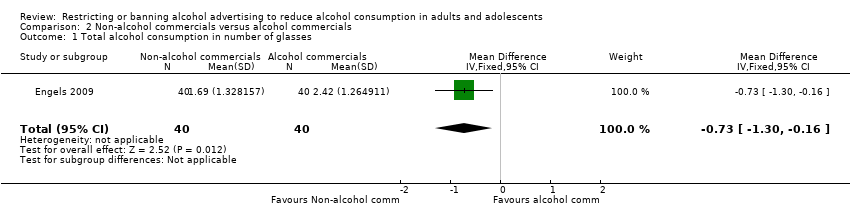
Comparison 2 Non‐alcohol commercials versus alcohol commercials, Outcome 1 Total alcohol consumption in number of glasses.

Comparison 3 High‐alcohol content movies versus low‐alcohol content movies adjusted for clustering effects, Outcome 1 Total alcohol consumption.

Comparison 4 Alcohol commercials versus non‐alcohol commercials adjusted for clustering effects, Outcome 1 Total alcohol consumption.

Comparison 5 Total advertising ban versus Partial advertising ban Abrupt permanent model, Outcome 1 Volume of alcohol (beer, wine and spirits) sales in kilolitres.

Comparison 5 Total advertising ban versus Partial advertising ban Abrupt permanent model, Outcome 2 Volume of beer sales in kilolitres.

Comparison 5 Total advertising ban versus Partial advertising ban Abrupt permanent model, Outcome 3 Volume of wine sales in kilolitres.

Comparison 5 Total advertising ban versus Partial advertising ban Abrupt permanent model, Outcome 4 Volume of spirits sales in kilolitres.

Comparison 6 Total advertising ban versus Partial advertising ban Gradual permanent model, Outcome 1 Volume of alcohol (beer, wine and spirits) sales in kilolitres.
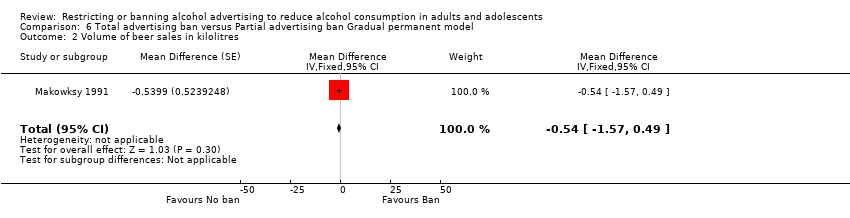
Comparison 6 Total advertising ban versus Partial advertising ban Gradual permanent model, Outcome 2 Volume of beer sales in kilolitres.
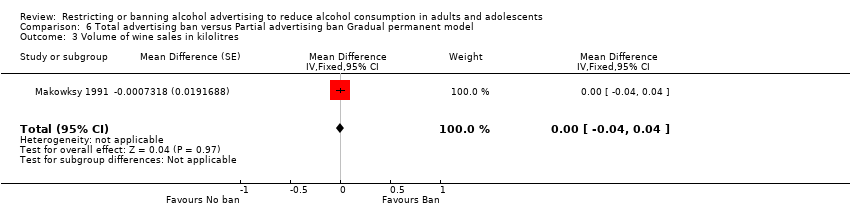
Comparison 6 Total advertising ban versus Partial advertising ban Gradual permanent model, Outcome 3 Volume of wine sales in kilolitres.

Comparison 6 Total advertising ban versus Partial advertising ban Gradual permanent model, Outcome 4 Volume of spirits sales in kilolitres.
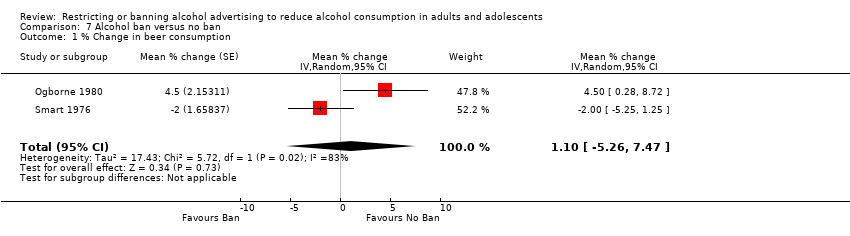
Comparison 7 Alcohol ban versus no ban, Outcome 1 % Change in beer consumption.
| Non‐alcohol commercials compared to alcohol commercials for reduction of alcohol consumption | ||||||
| Patient or population: General population | ||||||
| Outcomes | Illustrative comparative risks* (95% CI) | Relative effect | No. of participants | Quality of the evidence | Comments | |
| Assumed risk | Corresponding risk | |||||
| Alcohol commercials | Non‐alcohol commercials | |||||
| Total alcohol consumption in number of glasses | The mean total alcohol consumption in number of glasses in the intervention groups was | 80 | ⊕⊝⊝⊝ | |||
| Delayed age of initiation of alcohol use ‐ not measured | Not estimable | ‐ | This outcome was not applicable in this trial | |||
| Reduction in rate of reported risk behaviour ‐ not measured | Not estimable | ‐ | ||||
| Reduction in alcohol‐related injuries or accidents ‐ not measured | Not estimable | ‐ | ||||
| Reduction in individual spending on alcohol ‐ not measured | Not estimable | ‐ | ||||
| Loss of revenue from alcohol industry ‐ not measured | Not estimable | ‐ | This outcome was not applicable in this trial | |||
| Loss of advertising revenue ‐ not measured | Not estimable | ‐ | This outcome was not applicable in this trial | |||
| *The basis for the assumed risk (e.g. the median control group risk across studies) is provided in footnotes. The corresponding risk (and its 95% confidence interval) is based on the assumed risk in the comparison group and the relative effect of the intervention (and its 95% CI). | ||||||
| GRADE Working Group grades of evidence | ||||||
| 1 Risk of bias: rated as serious. In the Engels 2009 trial, randomisation was inadequate (the groups differed on the baseline prognostic factor prior drinking levels), allocation concealment was unclear and the researchers were not blinded to group allocation so detection bias may be present. | ||||||
| Alcohol ban compared to no ban for the general population | ||||||
| Patient or population: General population | ||||||
| Outcomes | Illustrative comparative risks* (95% CI) | Relative effect | No. of pParticipants | Quality of the evidence | Comments | |
| Assumed risk | Corresponding risk | |||||
| No ban | Alcohol ban | |||||
| Alcohol consumption: % change in beer consumption | The mean % change in beer consumption in the intervention groups was | 2 ITS studies | ⊕⊝⊝⊝ | Results for consumption of other types of alcoholic beverages and total consumption were inconsistent in the three ITS studies | ||
| Reduction in rate of reported risk behaviour ‐ not reported | See comment | See comment | Not estimable | ‐ | See comment | None of the studies measured this outcome |
| Delayed age of initiation of alcohol use ‐ not reported | See comment | See comment | Not estimable | ‐ | See comment | None of the studies measured this outcome |
| Reduction in alcohol‐related injuries or accidents ‐ not reported | See comment | See comment | Not estimable | ‐ | See comment | None of the studies measured this outcome |
| Reduction in individual spending on alcohol ‐ not reported | See comment | See comment | Not estimable | ‐ | See comment | None of the studies measured this outcome |
| Loss of revenue from alcohol industry ‐ not reported | See comment | See comment | Not estimable | ‐ | See comment | None of the studies measured this outcome |
| Loss of advertising revenue ‐ not reported | See comment | See comment | Not estimable | ‐ | See comment | None of the studies measured this outcome |
| *The basis for the assumed risk (e.g. the median control group risk across studies) is provided in footnotes. The corresponding risk (and its 95% confidence interval) is based on the assumed risk in the comparison group and the relative effect of the intervention (and its 95% CI). | ||||||
| GRADE Working Group grades of evidence | ||||||
| 1 Risk of bias: rated as serious: the risk of a dilution effect is present in both studies (Ogborne 1980 and Smart 1976) and seasonality may not be adequately addressed in the analyses. The studies were not further downgraded for limitations in causal inference due to a lack of randomisation, as the initial GRADE rating commenced at low quality. | ||||||
| Outcome or subgroup title | No. of studies | No. of participants | Statistical method | Effect size |
| 1 Total alcohol consumption in number of glasses Show forest plot | 1 | 80 | Mean Difference (IV, Fixed, 95% CI) | ‐0.65 [‐1.23, ‐0.07] |
| Outcome or subgroup title | No. of studies | No. of participants | Statistical method | Effect size |
| 1 Total alcohol consumption in number of glasses Show forest plot | 1 | 80 | Mean Difference (IV, Fixed, 95% CI) | ‐0.73 [‐1.30, ‐0.16] |
| Outcome or subgroup title | No. of studies | No. of participants | Statistical method | Effect size |
| 1 Total alcohol consumption Show forest plot | 1 | Coefficient (Fixed, 95% CI) | 0.74 [0.05, 1.43] | |
| Outcome or subgroup title | No. of studies | No. of participants | Statistical method | Effect size |
| 1 Total alcohol consumption Show forest plot | 1 | Coefficient (Fixed, 95% CI) | 0.83 [0.14, 1.52] | |
| Outcome or subgroup title | No. of studies | No. of participants | Statistical method | Effect size |
| 1 Volume of alcohol (beer, wine and spirits) sales in kilolitres Show forest plot | 1 | Mean Difference (Fixed, 95% CI) | ‐11.11 [‐27.56, 5.34] | |
| 2 Volume of beer sales in kilolitres Show forest plot | 1 | Mean Difference (Fixed, 95% CI) | 14.89 [0.39, 29.39] | |
| 3 Volume of wine sales in kilolitres Show forest plot | 1 | Mean Difference (Fixed, 95% CI) | 1.15 [‐0.91, 3.21] | |
| 4 Volume of spirits sales in kilolitres Show forest plot | 1 | Mean Difference (Fixed, 95% CI) | ‐22.49 [‐36.83, ‐8.15] | |
| Outcome or subgroup title | No. of studies | No. of participants | Statistical method | Effect size |
| 1 Volume of alcohol (beer, wine and spirits) sales in kilolitres Show forest plot | 1 | Mean Difference (Fixed, 95% CI) | ‐11.96 [‐55.42, 31.50] | |
| 2 Volume of beer sales in kilolitres Show forest plot | 1 | Mean Difference (Fixed, 95% CI) | ‐0.54 [‐1.57, 0.49] | |
| 3 Volume of wine sales in kilolitres Show forest plot | 1 | Mean Difference (Fixed, 95% CI) | ‐0.00 [‐0.04, 0.04] | |
| 4 Volume of spirits sales in kilolitres Show forest plot | 1 | Mean Difference (Fixed, 95% CI) | ‐27.8 [‐59.34, 3.74] | |
| Outcome or subgroup title | No. of studies | No. of participants | Statistical method | Effect size |
| 1 % Change in beer consumption Show forest plot | 2 | Mean % change (Random, 95% CI) | 1.10 [‐5.26, 7.47] | |