Ograniczenie lub zakaz reklamy alkoholu w celu zmniejszenia spożycia alkoholu wśród dorosłych i młodzieży
Abstract
Background
Alcohol is estimated to be the fifth leading risk factor for global disability‐adjusted life years. Restricting or banning alcohol advertising may reduce exposure to the risk posed by alcohol at the individual and general population level. To date, no systematic review has evaluated the effectiveness, possible harms and cost‐effectiveness of this intervention.
Objectives
To evaluate the benefits, harms and costs of restricting or banning the advertising of alcohol, via any format, compared with no restrictions or counter‐advertising, on alcohol consumption in adults and adolescents.
Search methods
We searched the Cochrane Drugs and Alcohol Group Specialised Register (May 2014); CENTRAL (Issue 5, 2014); MEDLINE (1966 to 28 May 2014); EMBASE (1974 to 28 May 2014); PsychINFO (June 2013); and five alcohol and marketing databases in October 2013. We also searched seven conference databases and www.clinicaltrials.gov and http://apps.who.int/trialsearch/ in October 2013. We checked the reference lists of all studies identified and those of relevant systematic reviews or guidelines, and contacted researchers, policymakers and other experts in the field for published or unpublished data, regardless of language.
Selection criteria
We included randomised controlled trials (RCTs), controlled clinical trials, prospective and retrospective cohort studies, controlled before‐and‐after studies and interrupted time series (ITS) studies that evaluated the restriction or banning of alcohol advertising via any format including advertising in the press, on the television, radio, or internet, via billboards, social media or product placement in films. The data could be at the individual (adults or adolescent) or population level.
Data collection and analysis
We used the standard methodological procedures expected by The Cochrane Collaboration.
Main results
We included one small RCT (80 male student participants conducted in the Netherlands and published in 2009) and three ITS studies (general population studies in Canadian provinces conducted in the 1970s and 80s).
The RCT found that young men exposed to movies with a low‐alcohol content drank less than men exposed to movies with a high‐alcohol content (mean difference (MD) ‐0.65 drinks; 95% CI ‐1.2, ‐0.07; p value = 0.03, very‐low‐quality evidence). Young men exposed to commercials with a neutral content compared with those exposed to commercials for alcohol drank less (MD ‐0.73 drinks; 95% CI ‐1.30, ‐0.16; p value = 0.01, very‐low‐quality evidence). Outcomes were assessed immediately after the end of the intervention (lasting 1.5 hours), so no follow‐up data were available. Using the Grading of Recommendations Assessment, Development and Evaluation approach, the quality of the evidence was rated as very low due to a serious risk of bias, serious indirectness of the included population and serious level of imprecision.
Two of the ITS studies evaluated the implementation of an advertising ban and one study evaluated the lifting of such a ban. Each of the three ITS studies evaluated a different type of ban (partial or full) compared with different degrees of restrictions or no restrictions during the control period. The results from the three ITS studies were inconsistent. A meta‐analysis of the two studies that evaluated the implementation of a ban showed an overall mean non‐significant increase in beer consumption in the general population of 1.10% following the ban (95% CI ‐5.26, 7.47; p value = 0.43; I2 = 83%, very‐low‐quality evidence). This finding is consistent with an increase, no difference, or a decrease in alcohol consumption. In the study evaluating the lifting of a total ban on all forms of alcohol advertising to a partial ban on spirits advertising only, which utilised an Abrupt Auto‐regressive Integrated Moving Average model, the volume of all forms of alcohol sales decreased by 11.11 kilolitres (95% CI ‐27.56, 5.34; p value = 0.19) per month after the ban was lifted. In this model, beer and wine sales increased per month by 14.89 kilolitres (95% CI 0.39, 29.39; p value = 0.04) and 1.15 kilolitres (95% CI ‐0.91, 3.21; p value = 0.27), respectively, and spirits sales decreased statistically significantly by 22.49 kilolitres (95% CI ‐36.83, ‐8.15; p value = 0.002). Using the GRADE approach, the evidence from the ITS studies was rated as very low due to a high risk of bias arising from a lack of randomisation and imprecision in the results.
No other prespecified outcomes (including economic loss or hardship due to decreased alcohol sales) were addressed in the included studies and no adverse effects were reported in any of the studies. None of the studies were funded by the alcohol or advertising industries.
Authors' conclusions
There is a lack of robust evidence for or against recommending the implementation of alcohol advertising restrictions. Advertising restrictions should be implemented within a high‐quality, well‐monitored research programme to ensure the evaluation over time of all relevant outcomes in order to build the evidence base.
PICO
Streszczenie prostym językiem
Czy zakaz lub ograniczenie reklam alkoholu wpływa na zmniejszenie jego spożycia?
Pytanie badawcze
W niniejszym przeglądzie zadaliśmy pytanie, czy wprowadzenie zakazu lub ograniczenia reklamy alkoholu, w jakiejkolwiek formie, prowadzi do zmniejszenia spożycia alkoholu. Formy zakazu mogą obejmować: zakaz reklamy alkoholu w telewizji, w Internecie lub na billboardach, bądź w magazynach. Ocenialiśmy również konsekwencje wynikające z wprowadzenia zakazu reklamy alkoholu, takie jak: zmniejszenie zysków w przemyśle alkoholowym i reklamowym oraz zmniejszenie zysku pochodzącego z akcyzy.
Wprowadzenie
Nadużywanie alkoholu jest istotnym czynnikiem ryzyka zachorowań, urazów (np. z powodu agresywnych zachowań lub wypadków drogowych), zgonu i problemów społecznych na całym świecie. Reklama i promowanie spożywania alkoholu jest powszechne. Zakaz lub ograniczenie reklamy alkoholu zaproponowano jako potencjalny sposób zmniejszenia spożycia alkoholu przez ogół społeczeństwa oraz jako sposób powstrzymania młodych ludzi przed rozpoczęcia picia w młodym wieku.
Charakterystyka badań
Dane, które prezentujemy, są aktualne do maja 2014 r. Znaleźliśmy cztery badania, w których oceniano ograniczenie lub zakaz reklamy alkoholu w jakikolwiek sposób. Jedno z badań było małym badaniem z randomizacją (RCT ‐ badanie, w którym uczestników przydziela się losowo do grupy badanej i kontrolnej), w którym oceniano spożywanie alkoholu u 80 młodych mężczyzn w Holandii oglądających filmy, w których pojawiał się wątek alkoholu w dużym lub małym zakresie w połączeniu z reklamą o neutralnej treści (interpretowaną jako zakaz reklamy alkoholu) lub o treści silnie związanej z alkoholem. Pozostałe trzy badania były analizami szeregów czasowych (ITS). Badania ITS to badania, w których zmiany, zazwyczaj w populacji ogólnej, mierzy się w różnych punktach czasowych przed, w trakcie, i po interwencji między innymi w zakresie zmian w polityce. W dwóch z trzech badań ITS, oceniano konsekwencje wprowadzenia zakazu reklamy produktów alkoholowych w dwóch różnych prowincjach kanadyjskich. W trzecim badaniu ITS oceniano co się stało po zniesieniu zakazu po 50 latach jego obowiązywania, w innej kanadyjskiej prowincji. W każdym badaniu oceniano inną kategorię zakazu (zakazy częściowe albo pełne).
Żadne z powyższych badań nie było finansowane przez przemysł alkoholowy lub reklamowy.
Główne wyniki
Dane pochodzące z włączonych badań nie wykazały wyraźnego efektu przemawiającego za lub przeciw zakazowi lub ograniczaniu reklam alkoholu.
W badaniu z randomizacją, młodzi mężczyźni, którzy oglądali filmy, których wątek alkoholu pojawiał się w małym zakresie, spożywali mniej alkoholu niż mężczyźni, którzy oglądali filmy, w których wątek alkoholu pojawiał się w dużym zakresie. Młodzi mężczyźni eksponowani na reklamy o neutralnej treści, w porównaniu z tymi, którzy byli eksponowani na reklamy z alkoholem, spożywali mniej alkoholu. Badanie trwało półtorej godziny, nie wiemy więc jak długo po zakończeniu badania utrzymują się efekty interwencji. W badaniu nie odnotowano żadnych szkodliwych efektów.
Wyniki trzech badań ITS były niespójne. Połączyliśmy za pomocą metod statystycznych wyniki dwóch badań, w których oceniano konsekwencje wprowadzonego zakazu. W analizie wykazano ogólne zwiększenie spożycia piwa w populacji generalnej, po wprowadzeniu zakazu, jednak wyniki te były niepewne i można je również podsumować jako spójne z brakiem jakiejkolwiek różnicy czy ogólnym spadkiem konsumpcji alkoholu. Wyniki trzeciego badania ITS, w którym porównywano zniesienie całkowitego zakazu reklamy wszystkich alkoholi do zakazu reklamy jedynie alkoholi mocnych, również nie miały jednoznacznych wyników. W żadnym z tych badań nie odnotowano jakichkolwiek szkód wynikających z wprowadzenia zakazów.
Jakość danych naukowych
Podsumowując, jakość danych z badania z randomizacją była bardzo niska. Przyczyną niskiej oceny były błędy w metodologii badania, włączona populacja, która obejmowała tylko mężczyzn, a ponadto wyniki nie były bardzo dokładne. W badaniach ITS, jakość została również oceniona bardzo nisko z powodu niejasnej metodologii badań, a wyniki nie były precyzyjne.
Wnioski
Niniejszy przegląd nie określa czy zakaz reklamy alkoholu powinien być zalecany czy też nie. Rządom, które rozważają wprowadzenie zakazu reklamy alkoholu zaleca się wdrożenie zakazu pilotażowo i monitorowanie efektów w czasie w celu zebrania danych.
Authors' conclusions
Summary of findings
| Non‐alcohol commercials compared to alcohol commercials for reduction of alcohol consumption | ||||||
| Patient or population: General population | ||||||
| Outcomes | Illustrative comparative risks* (95% CI) | Relative effect | No. of participants | Quality of the evidence | Comments | |
| Assumed risk | Corresponding risk | |||||
| Alcohol commercials | Non‐alcohol commercials | |||||
| Total alcohol consumption in number of glasses | The mean total alcohol consumption in number of glasses in the intervention groups was | 80 | ⊕⊝⊝⊝ | |||
| Delayed age of initiation of alcohol use ‐ not measured | Not estimable | ‐ | This outcome was not applicable in this trial | |||
| Reduction in rate of reported risk behaviour ‐ not measured | Not estimable | ‐ | ||||
| Reduction in alcohol‐related injuries or accidents ‐ not measured | Not estimable | ‐ | ||||
| Reduction in individual spending on alcohol ‐ not measured | Not estimable | ‐ | ||||
| Loss of revenue from alcohol industry ‐ not measured | Not estimable | ‐ | This outcome was not applicable in this trial | |||
| Loss of advertising revenue ‐ not measured | Not estimable | ‐ | This outcome was not applicable in this trial | |||
| *The basis for the assumed risk (e.g. the median control group risk across studies) is provided in footnotes. The corresponding risk (and its 95% confidence interval) is based on the assumed risk in the comparison group and the relative effect of the intervention (and its 95% CI). | ||||||
| GRADE Working Group grades of evidence | ||||||
| 1 Risk of bias: rated as serious. In the Engels 2009 trial, randomisation was inadequate (the groups differed on the baseline prognostic factor prior drinking levels), allocation concealment was unclear and the researchers were not blinded to group allocation so detection bias may be present. | ||||||
| Alcohol ban compared to no ban for the general population | ||||||
| Patient or population: General population | ||||||
| Outcomes | Illustrative comparative risks* (95% CI) | Relative effect | No. of pParticipants | Quality of the evidence | Comments | |
| Assumed risk | Corresponding risk | |||||
| No ban | Alcohol ban | |||||
| Alcohol consumption: % change in beer consumption | The mean % change in beer consumption in the intervention groups was | 2 ITS studies | ⊕⊝⊝⊝ | Results for consumption of other types of alcoholic beverages and total consumption were inconsistent in the three ITS studies | ||
| Reduction in rate of reported risk behaviour ‐ not reported | See comment | See comment | Not estimable | ‐ | See comment | None of the studies measured this outcome |
| Delayed age of initiation of alcohol use ‐ not reported | See comment | See comment | Not estimable | ‐ | See comment | None of the studies measured this outcome |
| Reduction in alcohol‐related injuries or accidents ‐ not reported | See comment | See comment | Not estimable | ‐ | See comment | None of the studies measured this outcome |
| Reduction in individual spending on alcohol ‐ not reported | See comment | See comment | Not estimable | ‐ | See comment | None of the studies measured this outcome |
| Loss of revenue from alcohol industry ‐ not reported | See comment | See comment | Not estimable | ‐ | See comment | None of the studies measured this outcome |
| Loss of advertising revenue ‐ not reported | See comment | See comment | Not estimable | ‐ | See comment | None of the studies measured this outcome |
| *The basis for the assumed risk (e.g. the median control group risk across studies) is provided in footnotes. The corresponding risk (and its 95% confidence interval) is based on the assumed risk in the comparison group and the relative effect of the intervention (and its 95% CI). | ||||||
| GRADE Working Group grades of evidence | ||||||
| 1 Risk of bias: rated as serious: the risk of a dilution effect is present in both studies (Ogborne 1980 and Smart 1976) and seasonality may not be adequately addressed in the analyses. The studies were not further downgraded for limitations in causal inference due to a lack of randomisation, as the initial GRADE rating commenced at low quality. | ||||||
Background
Description of the condition
Alcohol is estimated to be the fifth leading risk factor for global disability‐adjusted life years (DALYs) for all ages and sexes (Lim 2012). This estimate has increased by 32% from 1990 to 2010 (Lim 2012). For people aged 15 to 49 years, alcohol is the leading risk factor for DALYs worldwide (Lim 2012). Over 2.7 million deaths (95% uncertainty index 2,464,575 to 3,006,459) are attributed to alcohol use linked to injury (intentional, unintentional and transport), cardiovascular disease, cirrhosis, cancer, mental and behavioural disorders, human immunodeficiency virus infection/acquired immunodeficiency syndrome, tuberculosis, and neurological disorders (Lim 2012). Alcohol affects not only the health of the drinking individual, but in pregnant women the neurotoxic effects of alcohol may cause a range of congenital defects including foetal alcohol spectrum disorders and foetal death, stillbirth, and infant and child mortality (Burd 2012).
In addition to its effects on mortality and morbidity, alcohol has significant adverse social and economic effects. A 2006 review of studies estimating the global economic burden of alcohol found that alcohol accounts for 1.3% to 3.3% of total health costs, 6.4% to 14.4% of total public order and safety costs, 0.3 to 1.4 per thousand USD of gross domestic product (GDP) for criminal damage costs, 1.0 to 1.7 per thousand USD of GDP for drink‐driving costs and 2.7 to 10.9 per thousand USD of GDP for workplace costs (absenteeism, unemployment and premature mortality) (Baumberg 2006).The authors of the review caution readers to consider the methodological differences between studies and inherent design limitations, but these findings are supported by a 2009 analysis conducted in partnership with the World Health Organization (WHO). This aggregate analysis of reviews of published work found that costs associated with alcohol amounted to 1% of GDP in high‐income and middle‐income countries, with social harm accounting for the greater proportion of these costs, in addition to health costs (Rehm 2009). In a 2010 UK multicriteria decision analysis to assess the relative harms of 20 drugs, harms both to the user and others were greatest for alcohol compared with all other drugs, including heroin and cocaine. Harms assessed included crime, family adversity and a decline in social cohesion within communities (Nutt 2010).
In an overview of systematic reviews and quantitative meta‐analyses, Rehm and colleagues evaluated the evidence for a causal impact of average volume of alcohol consumption and pattern of drinking on diseases and injury, and quantified those relationships identified as causal (Rehm 2010). Their findings indicate that alcohol is causally related to many chronic and acute disease outcomes as well as to injury. They report that there is evidence that both the average volume and specific drinking pattern are causally related to ischaemic heart disease, foetal alcohol syndrome, and both intentional and unintentional injury. They postulate that episodes of heavy drinking are likely to influence additional disease outcomes but that epidemiological research to date has had a limited focus on drinking patterns. Due to an absence of research, they were unable to conclude whether the quality of alcohol is a significant factor in disease outcomes.
Description of the intervention
One of the main aims of commercial advertising is to encourage the consumer to use and purchase promoted products. In their extensive 2009 review of the effectiveness and cost‐effectiveness of alcohol policies and programmes, Anderson, Chisholm and Fuhr report that alcohol is increasingly marketed using sophisticated advertising in the mainstream media, through the linking of alcohol brands to sports and cultural activities, through sponsorships and product placements, and through direct marketing such as on the internet, and via podcasts and mobile telephones (Anderson 2009). Alcohol marketing campaigns have recently targeted social networking sites such as Facebook and Twitter, which are disproportionately used by young people (Hastings 2013). In a systematic review of 13 longitudinal studies of 38,000 young people, Anderson et al found that longitudinal studies consistently suggest that there is an association between exposure to media/commercial communications and alcohol and adolescents starting to drink alcohol, and with increased drinking among baseline drinkers (Anderson 2009a). In another systematic review of seven cohort studies of young people, Smith and Foxcroft suggest that while there is an association between exposure to alcohol advertising or promotional activity and subsequent alcohol consumption in young people, the modest effect sizes may be limited by the potential influence of residual or unmeasured confounding in the included studies (Smith 2009). Snyder et al, in their longitudinal investigation, found empirical evidence to suggest that exposure to advertising has direct measurable effects on both drink initiation and consumption levels (Snyder 2006).
In their 2008 independent review of the effects of alcohol pricing and promotion for the UK Department of Health, Booth and colleagues identify the methodological complexity of linking advertising to consumption (Booth 2008). Cross‐sectional studies will fail to meet the causality criteria of temporality (the intervention predates the effect), and cohort studies and time series analyses may be prone to confounding unless adequately controlled. In addition, they point out that subpopulations such as problem drinkers are likely to be under‐represented in general population aggregated data, which are primarily used in national or state‐level studies. Despite these methodological limitations, they conclude that there is evidence for an effect of alcohol advertising on underage drinkers and that exposure to television, music videos and billboards that contain alcohol advertising predict the onset of youth drinking and increased drinking (Booth 2008).
How the intervention might work
Prevention strategies to reduce the quantity of alcohol consumed and the age of initiation of alcohol use include several public health interventions targeted at the general population. One such strategy is the restriction or banning of all forms of advertising of alcohol. The reduction in marketing may be voluntary and implemented by the alcohol, media or advertising industries, or mandatory and implemented by government decree.
Theoretically, a restriction or banning of alcohol advertising may reduce the consumption of alcohol across the general population and may raise the age of initiation of drinking in young people. In their 2001 international comparison of bans on the broadcast advertising of alcohol in 17 Organization for Economic and Cooperation Development (OECD) countries between 1977 and 1995, Nelson and Young report that there are several theoretical models of advertising, including social learning theory, which argues that advertising contributes to normalising perceptions of drinking in society (Nelson 2001). They also describe conflicting economic theories, with advertising either increasing or decreasing consumption because it affects both demand and the levels of prices that sellers find optimal. They warn that partial bans on advertising using specific forms of media may drive substitution towards other advertising media (Nelson 2001).
In their review of policies and programmes, Anderson et al indicate that making alcohol less available and more expensive, and placing a ban on alcohol advertising are the most cost‐effective ways to reduce the harm caused by alcohol (Anderson 2009a). However, little evidence is provided to support the statement on banning alcohol advertising. The authors acknowledge that in regions where alcohol marketing relies on self regulation (rather than regulatory banning or restrictions), several studies show that these voluntary systems do not prevent marketing content directed at young people. In another study of pooled time series data from 20 countries over a 26‐year period, the authors' primary conclusion was that alcohol advertising bans decrease consumption by 5% to 8% (Saffer 2002). Similarly, a cross‐sectional study in the emerging market context of Brazil found evidence of association, but not causation, between alcohol consumption and alcohol promotion (Pinsky 2010).
Why it is important to do this review
In the 2012 Global Burden of Disease report, the authors state that public policy to improve the health of populations will be more effective if policies address the major causes of disease burden. They argue that small reductions in population exposure to large risks will yield substantial health gains (Lim 2012). Reducing or banning alcohol advertising may reduce exposure to the very large risk posed by alcohol both to the individual and to the general population. To date, no systematic review has evaluated the effectiveness, possible harms and cost‐effectiveness of this intervention. This Cochrane review aims to evaluate, in a systematic manner, the benefits and harms of reducing or banning alcohol advertising and the cost‐effectiveness of such an intervention.
Objectives
To evaluate the benefits, harms and costs of restricting or banning the advertising of alcohol, via any format, compared with no restrictions or counter‐advertising, on alcohol consumption in adults and adolescents
Methods
Criteria for considering studies for this review
Types of studies
We considered both general population‐level studies (where aggregate data from regions are collated before and after a reduction of or ban on advertising) and individual‐level studies (where participants may be randomised to different levels of advertising and their subsequent consumption measured) to be applicable to the review.
General population level
-
-
Randomised controlled trials (RCTs)
-
Controlled clinical trials (CCTs)
-
Prospective cohort studies
-
Retrospective cohort studies if baseline exposure data were collected at time of baseline of study
-
Controlled before and after (CBA) studies, including econometric studies
-
Interrupted time series (ITS) studies. We used the definition for ITS given by the Cochrane Effective Practice and Organization of Care (EPOC) Review Group, viz:
-
there were at least three time points before and after the intervention, irrespective of the statistical analysis used
-
the intervention occurred at a clearly defined point in time
-
the study measured provider performance or participant outcome objectively
-
-
Individual level
-
-
RCTs
-
CCTs
-
Prospective cohort studies
-
Retrospective cohort studies if baseline data were collected at time of baseline of study
-
CBA cross‐sectional studies
-
ITS studies
-
NOTE: For both population‐ and individual‐level ITS studies, if the study ignored secular (trend) changes and performed a simple t‐test of the pre‐ versus postintervention periods without further justification, the study was not included in the review unless re‐analysis was possible.
Types of participants
Adults of any age and adolescents (defined by WHO as aged 10 to 19 years).
Types of interventions
Intervention
A reduction in or restriction or banning of advertising of alcohol and related products via any format including advertising in the press, on the television, radio, or internet, or via billboards, social media or product placement in films.
We used the broad definition of advertising recommended by the WHO, which defines marketing (with emphasis on its persuasive impact) as: "any form of commercial communication or message that is designed to increase, or has the effect of increasing, the recognition, appeal and/or consumption of particular products and services. It could comprise anything that acts to advertise or otherwise promote a product or service" (WHO 2010, page 15). Hence, a restriction on advertising may include restricting responsible drinking campaigns led by the alcohol industry and the marketing of positive associations between industry and socially responsible initiatives.
We attempted to include restrictions on all new forms of marketing, for example those facilitated by digital technologies, but acknowledge that research into the impacts of advertising restrictions is likely to lag behind new marketing technologies.
Comparison
Advertising of alcohol and related products via any format including counter‐advertising (defined as the promotion of healthy choices and harm reduction messages).
As for the intervention, we used the definition of advertising recommended by the WHO (WHO 2010).
Types of outcome measures
Primary outcomes
-
Reduction in alcohol consumption
In population‐based studies, this may be measured via econometric data (e.g. annual sales of alcohol per capita) and in individual‐based studies this may be measured by rate of drinks (number during a specified time).
Secondary outcomes
-
Delayed age of initiation of alcohol use
-
Reduction in rate of reported risk behaviour
-
Reduction in alcohol‐related injuries or accidents
-
Reduction in individual spending on alcohol
Adverse effects
-
Loss of revenue from alcohol industry
-
Loss of advertising revenue
-
Reduction in GDP attributable to alcohol sales
-
Loss of employment from alcohol industry
-
Reduction in taxes generated
Search methods for identification of studies
We developed the search strategy with the assistance of the Cochrane Drugs and Alcohol Review Group Trials Search Co‐ordinator. We formulated a comprehensive and exhaustive search strategy in an attempt to identify all relevant RCTs, cohort studies and CBA studies, regardless of language or publication status (published, unpublished, in press and in progress).
Electronic searches
As we did not limit the strategy to search for RCTs or cohort studies, we did not use the RCT strategy developed by The Cochrane Collaboration and detailed in the Cochrane Handbook for Systematic Reviews of Interventions (Higgins 2011). We used a combination of terms specific to alcohol consumption and to advertising. The search was iterative and used both database‐specific syntax and free‐text terms. There were no language restrictions.
We searched the following databases.
1. Journal databases
-
Cochrane Drugs and Alcohol Group Specialised Register (May 2014)
-
MEDLINE (PubMed) (1966 to 28 May 2014); see Appendix 1 for the MEDLINE search strategy
-
EMBASE (elsevier.com/online‐tools/embase) (1974 to 28 May 2014); see Appendix 2 for the EMBASE search strategy
-
The Cochrane Library (Issue 5, 2014), which includes the Cochrane Central Register of Controlled Trials (CENTRAL) and the UK National Health Service Economic Evaluations Database (28 May 2014); see Appendix 3 for The Cochrane Library search strategy
-
PsycINFO (on 14 June 2013); see Appendix 4 for the PsychINFO search strategy
We also search the following additional databases, including economic and marketing databases:
-
AgEcon (ageconsearch.umn.edu/) (on 16 October 2013);
-
Business Source Premier (on EBSCOHOST) (on 18 October 2013)
-
National Institute of Health Alcohol and Alcohol Problems Science Database (1972 to 2003) (http://etoh.niaaa.nih.gov/) (on 22 October 2013;
-
Association for Consumer Research (http://www.acrwebsite.org/search/search‐conference‐proceedings.aspx) (on 22 October 2013);
-
Chartered Institute of Marketing (http://library.cim.co.uk/ics‐wpd/exec/icswppro.dll) (on 22 October 2013).
2. Conference databases
We attempted to search several relevant conference proceedings. Electronic database searches or reports were available only for the following conferences:
-
conference proceedings of the Research Society on Alcoholism (www.rsoa.org);
-
conference proceedings of the Kettil Bruun Society 39th Annual Symposium 2013;
-
conference proceedings of the International Network on Brief Interventions for Alcohol Problems;
-
conference proceedings of the International Health Economics Association (www.ssrn.com);
-
meeting reports of the International Center for Alcohol Policies (http://www.icap.org/);
-
meeting reports of the European Advertising Standards Alliance (http://www.easa‐alliance.org/);
-
meeting reports of the The Foundation for Alcohol Research (http://www.abmrf.org/).
3. Ongoing trials
To identify ongoing RCTs we searched ClinicalTrials.gov (www.clinicaltrials.gov/) and the WHO International Clinical Trials Registry Platform (WHO ICTRP) (http://apps.who.int/trialsearch/) (on 10 October 2013). One author, NS, searched both sites using separate terms and combinations of terms. These included [advertising AND alcohol]; [marketing AND alcohol]; [ban AND alcohol]; [restrictions AND alcohol]; [advertis*]; and [ban OR banning].
In the absence of registries for non‐RCTs, we contacted experts and researchers in the field, to identify ongoing cohort, CBA and ITS studies.
Searching other resources
We checked the reference lists of all studies identified by the above methods and examined the references of any systematic reviews, meta‐analyses or guidelines we identified during the search process.
During the period of the review, we were in close contact with individual researchers working in the field and policymakers based in inter‐governmental organisations including the WHO. We also contacted experts in the field who may have been aware of unpublished or ongoing studies (e.g. Center on Alcohol Marketing and Youth and the European Centre for Monitoring Alcohol Marketing).
We did not conduct handsearching of specific journals other than those searched by the Cochrane Drugs and Alcohol Review Group and already included in CENTRAL.
Data collection and analysis
Selection of studies
Two authors, NS and DCP, read the titles, abstracts and descriptor terms of all downloaded material from the electronic searches to identify potentially eligible reports. We obtained full‐text articles for all citations identified as potentially eligible, and NS and DP independently inspected these to establish the relevance of each article according to the prespecified criteria. Where there was any uncertainty as to the eligibility of the record, we obtained the full article.
NS and DCP independently applied the inclusion criteria and any differences of opinion arising were resolved by discussions with a third review author, JEA. We reviewed studies for relevance based on study design, types of participants, exposures and outcome measures.
Data extraction and management
NS and DP independently extracted data into a standardised data extraction form. We piloted the form on two studies to assess its completeness and usability. We extracted the following characteristics from each included study.
-
Administrative details: trial or study identification number; author(s); published or unpublished; year of publication; number of studies included in paper; year in which study was conducted; details of other relevant papers cited
-
Details of the study: study design; type, duration and completeness of follow up; country and location of study (e.g. higher‐income versus lower‐income country); informed consent and ethics approval
-
Details of participants: setting; numbers; relevant baseline characteristics, including age and sex
-
Details of intervention: type of intervention (e.g. restriction, full banning); media setting (e.g. press, television, internet, social media, product placement); timing and duration of intervention; additional co‐interventions
-
Details of comparison: type and media setting of advertising; timing and duration of current advertising
-
Details of outcomes: decreased alcohol consumption; delayed age of initiation of alcohol use; decreased rate of reported risk behaviour; reduction in alcohol‐related injuries or accidents; loss of revenue from alcohol industry; loss of revenue from the advertising agency sector; reduction in GDP; loss of employment from alcohol industry; decreased individual spending on alcohol
-
Details of the analysis: for RCTs, details of the type of analysis (intention‐to‐treat or per protocol); for cohort studies, details of the type of adjustment performed in analyses
Assessment of risk of bias in included studies
Assessment of RCTs, CCTs, CBA and cohort studies
For RCTs, CCTs, CBA and cohort studies, NS and DP independently examined the components of each included study for risk of bias using a standard form.
We performed the 'Risk of bias' assessment for RCTs, CCTs, cohort studies and CBAs in this review using the criteria recommended in the Cochrane Handbook for Systematic Reviews of Interventions (Higgins 2011). The recommended approach for assessing risk of bias in studies included in a Cochrane Review is a two‐part tool, addressing seven specific domains, namely sequence generation and allocation concealment (selection bias), blinding of participants and providers (performance bias), blinding of outcome assessor (detection bias), incomplete outcome data (attrition bias), selective outcome reporting (reporting bias) and other sources of bias. The first part of the tool allows for a description of what was reported to have happened in the study. The second part of the tool involves assigning a judgement relating to the risk of bias for that entry, in terms of low, high or unclear risk. To make these judgements we used the criteria indicated by the Cochrane Handbook for Systematic Reviews of Interventions adapted for the addiction field.
The domains of sequence generation and allocation concealment (avoidance of selection bias) were addressed in the tool by a single entry for each study.
Blinding of participants, personnel and outcome assessor (avoidance of performance bias and detection bias) was considered separately for objective outcomes (e.g. use of alcohol measured by biomarker analysis) and subjective outcomes (e.g. patient self‐reported use of substance).
The presence of incomplete outcome data (avoidance of attrition bias) was considered separately for all reported outcomes.
We planned to used the criteria drawn from the Newcastle‐Ottawa Scale (NOS) (Newcastle‐Ottawa) and the criteria developed by the Cochrane Effective Practice and Organization of Care (EPOC) Review Group (EPOC 2008) to assess observational studies. Specifically, the NOS makes judgements in three general areas: selection of study groups, comparability of groups and ascertainment of outcomes (in the case of cohort studies). As a result, this instrument can assess the quality of non‐randomised studies so that they can be used in a meta‐analysis or systematic review. The 'Risk of bias' tables were adapted to be used for the assessment of RCTs, CCTs, CBA and prospective observational studies according to these criteria. See Appendix 5 for full details. As we did not identify any observational studies for inclusion we did not conduct an assessment using the table.
Assessment for ITS studies
We used the criteria recommended by the Cochrane EPOC Review Group to assess the methodological quality of the ITS studies. The assessment comprises seven standard criteria specific to ITS. See Appendix 6 for full details.
Measures of treatment effect
We conducted data analysis using Review Manager 5 (RevMan 2012).
For RCT data, we calculated outcome measures for dichotomous data (e.g. the proportion of decreasing consumption) as risk ratios with 95% confidence intervals (CIs). For continuous data (e.g. mean age of initiation) we calculated the mean differences (MDs) and standard deviations (SDs) where means were reported.
For cohort and other study design data, we preferentially reported on the adjusted analysis using the estimate of effect reported in the study rather than calculating estimates of effects based on the crude data. Where only crude data were presented, where appropriate, we calculated the crude risk ratios and 95% CIs for dichotomous data and MDs and SDs for continuous data where means were reported, or we reported medians if data were skewed.
Unit of analysis issues
Cluster trials
Studies may employ 'cluster‐randomisation' (such as randomisation by student group or region), but analysis and pooling of clustered data poses problems. Authors often fail to account for intraclass correlation in clustered studies, leading to a 'unit of analysis' error (Divine 1992) whereby p values are spuriously low, CIs unduly narrow and statistical significance overestimated. This causes type I errors (Bland 1997).
Where clustering was not accounted for in primary studies, we planned to present data in a table, using a (*) symbol to indicate the presence of a probable unit of analysis error. If cluster studies have been appropriately analysed, taking into account intraclass correlation coefficients, and relevant data documented in the report, synthesis with other studies is possible using the generic inverse variance technique.
Cross‐over trials
We did not anticipate that any cross‐over trials would have been conducted on this topic.
Dealing with missing data
Where data were missing, we contacted study authors and requested additional data. Where this was not possible, we stated explicitly where calculations were based on assumptions regarding missing data.
Assessment of heterogeneity
For both RCT and cohort meta‐analyses, we formally tested for statistical heterogeneity using the Chi² test for statistical homogeneity with a 10% level of significance as the cut‐off. We quantified the impact of any statistical heterogeneity using the I² statistic (Higgins 2002).
Where studies did not have combinable outcomes, we have provided the data in a narrative form.
Data synthesis
Where RCTs were found to be methodologically or clinically comparable, we planned to pool trial results in a meta‐analysis. As we anticipated the presence of statistical heterogeneity we planned to combine the data using the random‐effects model. As only one RCT was included we did not conduct a meta‐analysis. However, if this was possible we had planned to combine the results and calculate the risk ratios and 95% CIs for dichotomous data. For continuous data, we planned to combine the MDs to calculate an overall MD and SD. If time‐to‐event data were available, we planned to combine the hazard ratios (HRs) reported in the RCTs using the generic inverse variance function.
Where cohort and ITS studies were found to be methodologically or clinically comparable, we pooled the results in a meta‐analysis using the generic inverse variance function in RevMan to allow adjusted data to be used in the analysis. We anticipated heterogeneity due to the likelihood of different analytical techniques and different adjusted variables, and combined studies using the random‐effects model.
For the cohort and ITS studies, we planned to report on the adjusted analysis using the estimate of effect reported in the study. Where the adjusted estimate of effect was reported with 95% CIs, we calculated the standard error (SE) in order to enter the data into RevMan, using the following formulae for ratio measures:
-
lower limit = ln(lower confidence limit given for HR);
-
upper limit = ln(upper confidence limit given for HR);
-
intervention effect estimate = lnHR;
-
SE = (upper limit – lower limit)/3.92.
Subgroup analysis and investigation of heterogeneity
We anticipated statistical heterogeneity due to differences between study populations and interventions. We planned to explore the expected heterogeneity using the following subgroups:
-
setting: resource‐constrained or resource‐rich settings as defined by the World Bank as middle‐ or low‐income countries and high‐income countries, respectively;
-
setting: international, national, regional or community settings;
-
age: adolescent, adult or mixed populations;
-
type of advertising: audiovisual, print or social media.
Sensitivity analysis
For RCTs, we planned to explore the effect of study quality on the results by excluding those studies where allocation concealment was unclear or inadequate from the meta‐analysis and assessing the effect of this on the overall results. For cohort studies we planned to examine the effect of adjustments for confounding. If data were available, we also planned to explore the effects of funding source (industry versus non‐industry) on the meta‐analysis. As data were too limited, we were not able to conduct sensitivity analyses.
GRADE assessment
We used GRADEpro version 3.6 to create 'Summary of findings' and evidence profile tables. The GRADEpro software was developed as part of a larger initiative led by the Grading of Recommendations Assessment, Development and Evaluation (GRADE) Working Group. GRADE offers a system for rating the quality of evidence in systematic reviews and guidelines, and grading the strength of recommendations in guidelines (Guyatt 2011). Use of GRADEpro within a Cochrane systematic review facilitates the process of presenting and grading evidence transparently (http://ims.cochrane.org/revman/other‐resources/gradepro/about‐gradepro).
In determining the level of evidence for each outcome, we integrated both the efficacy results and the assessment of the risk of bias into a final assessment of the level of evidence and provided full details of the decision in footnotes. For the one RCT identified, the quality of evidence started graded as high and we then downgraded where necessary to reach a final overall quality assessment. For the ITS studies, the quality of evidence started graded as low (due to the lack of randomisation and inherent limitations in inferring causality from this type of study) before we considered other quality parameters for grading.
Results
Description of studies
Results of the search
1. Journal databases
1.1 Health‐specific databases
The February 2013 search of the electronic journal databases was conducted via OVID and retrieved 4114 records (see Figure 1 for the records retrieved per database).
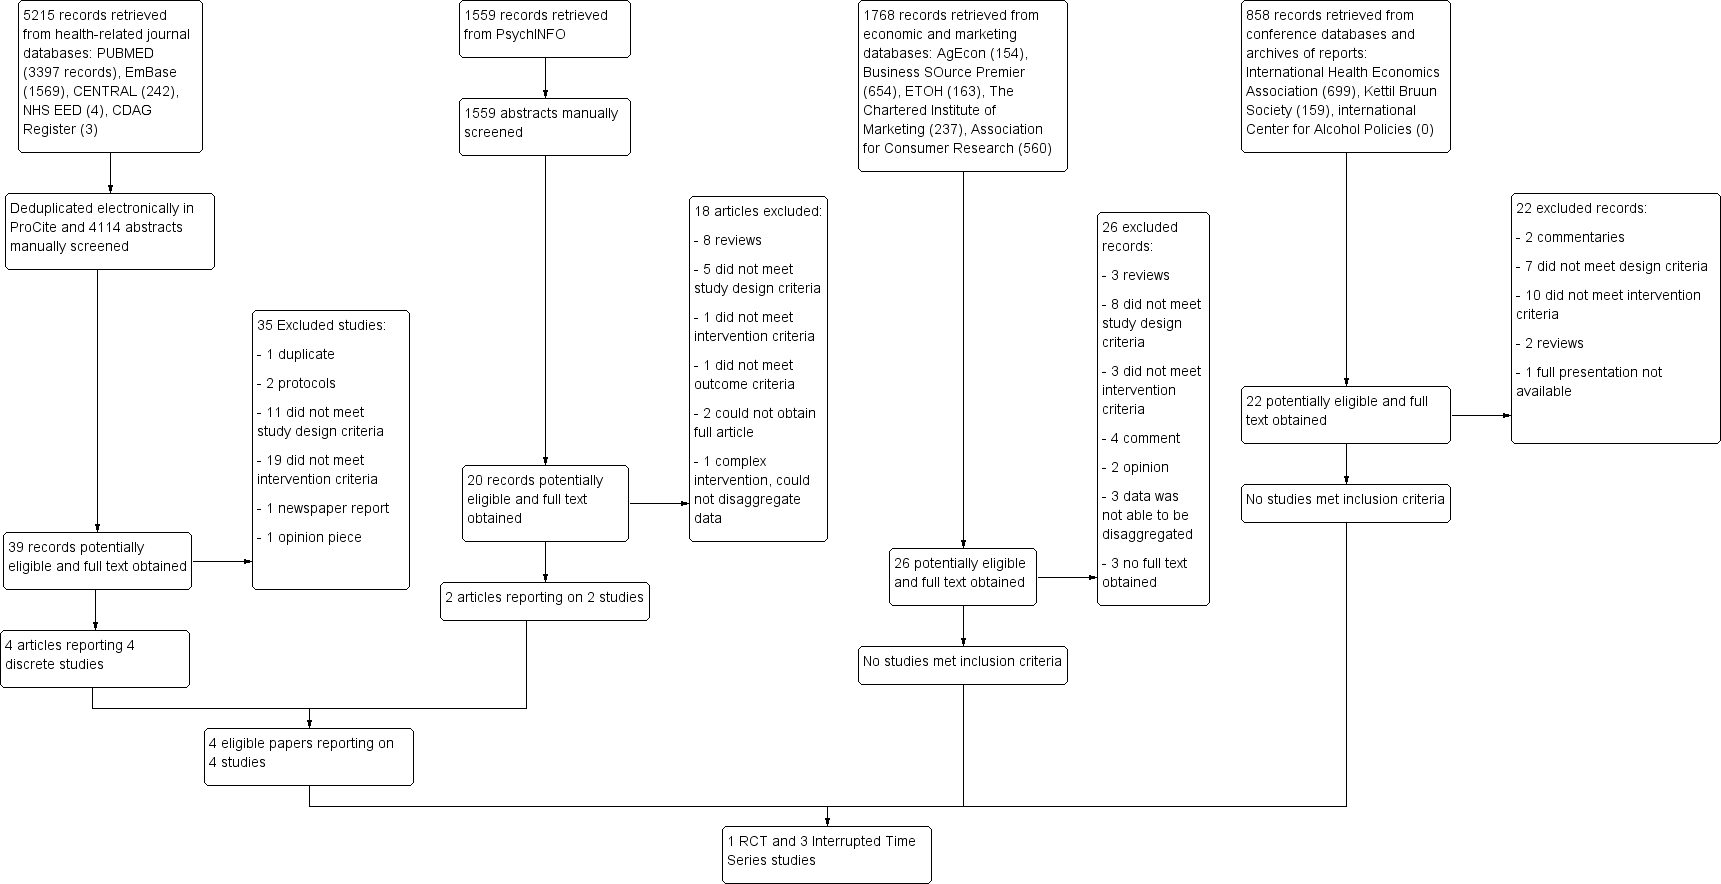
Flow diagram of screening and eligibility of records of electronic databases: PubMed, EMBASE, The Cochrane Library (CENTRAL and UK National Health Service Economic Evaluations Database) and PsychINFO
After NS and DP manually screened all 4114 abstracts, we identified 39 records as possibly eligible and the full articles were obtained for eligibility assessment. Four of these articles reported on studies which were eligible for inclusion. We also identified a further 18 records which reported reviews or were likely to contain important references and obtained the full articles for these. See Figure 1.
The PsychINFO search was conducted later than the above search (on 14 June 2013) via EBSCOhost and retrieved 1559 records of which we identified 20 records as possibly eligible and obtained the full articles for further scrutiny. Two of these articles reported studies which were eligible for inclusion, both of which were already identified in the earlier search.
The May 2014 updated search retrieved a further 619 records from which none were eligible for inclusion (see Appendix 7 for the records retrieved per database).
1.2 Economic and marketing databases
We searched several other databases which are not specific to health or medical topics in order to ensure we included economic and marketing studies (see Appendix 8 for a full description of the databases, terms used and number of records retrieved). We searched a total of 1768 records of which 26 were potentially eligible and full articles were obtained. Of these none reported on eligible studies.
2. Conference databases
For the search of conference presentations, NS searched the relevant conference databases and archives of manual reports and retrieved 858 records, none of which related to studies that were considered eligible (see Appendix 9 for a full description of the conferences and report archives, responses to requests and number of records retrieved).
3. Trials registries
The search of ClinicalTrials.gov resulted in 159 titles, none of which were relevant to the review. The search of the WHO ICTRP resulted in 66 titles, none of which were relevant to this review.
Included studies
After conducting a full eligibility assessment on all the selected full articles, we identified four eligible studies: one RCT (Engels 2009) and three ITS studies (Makowksy 1991; Ogborne 1980; Smart 1976). Full details of each study is contained in the Characteristics of included studies table.
RCT
Individual level RCT
The RCT (Engels 2009) was conducted in the Netherlands and recruited 40 male pairs aged between 18 and 29 years old. Participants were randomised to one of three intervention groups or to a control group. Participants in the intervention groups watched movie clips containing either a high degree of alcohol content or a low amount of alcohol content interrupted with commercials containing advertising for alcohol products. The control group watched a movie clip containing a low amount of alcohol content and a commercial for neutral products. We interpreted the commercials for neutral products as the equivalent of a ban on alcohol advertising. The observed number of alcohol drinks consumed during the viewing session was counted and self‐reported frequency of drinking prior to the trial was recorded.
Population level RCT
No RCT evaluating the effects of a restriction or ban on alcohol advertising at the general population level were identified.
ITS studies
All three ITS studies were conducted in Canada and were published more than 20 years ago (Makowksy 1991; Ogborne 1980; Smart 1976). Each of the studies evaluated a different type of ban (partial or full) compared with different degrees of restrictions or no restrictions during the control period. Ogborne 1980 and Smart 1976 evaluated the effects of an implementation of restrictions, whereas Makowksy 1991 evaluated the effects of lifting a restriction.
Ogborne 1980 compared the effects of a partial ban on beer advertising in print and electronic media implemented from 1974 onwards with the pre‐ban period when no ban was in place in Manitoba. Per capita beer consumption was derived from monthly beer sales divided by the year's estimate of the size of the provincial adult population. The consumption rates in Manitoba were compared to those in the province of Ontario where no ban had been in place during the same period.
Smart 1976 evaluated a time‐limited total ban on alcohol advertising for beer, wine and spirits in electronic, print and billboard media implemented in British Columbia on 1 September 1971 and continuing to 31 October 1972. Periods before and after the ban was implemented were used as the control period. The outcome assessed was per capita alcohol consumption measured by sales data for alcohol beverages and population estimates from census data.
The third study (Makowksy 1991) compared alcohol consumption before and after the lifting of a total ban on beer and wine advertising on the radio and television and in print media, which had been in effect for 58 years in the province of Saskatchewan. The total ban on advertising for spirits, which was part of the 58‐year ban, continued in place and was not lifted. The outcome assessed was alcohol sales by volume derived from monthly sales data and expressed in litres of pure alcohol sold per population aged 15 years and older. The consumption rates were compared to those in the province of New Brunswick where a similar ban was in place and was not lifted during the same period.
Excluded studies
We excluded 35 of the articles retrieved from the combined journal database search, 18 articles from the PsychINFO search, 26 of the articles retrieved in the search of marketing and economic databases and 22 of the reports and presentations retrieved from the conference search. See Figure 1 for reasons for exclusion, which mainly included studies not meeting the study design criteria or not meeting the intervention design criteria.
Several prominent studies that have previously been included in reviews on this topic were excluded from our review. We document the specific reasons for exclusion of these studies in the Characteristics of excluded studies table. These included regression analyses of large national or regional datasets, which evaluated the association between consumption and whether or not countries or provinces within the regional datasets implemented advertising restrictions (Nelson 2001; Nelson 2003; Nelson 2010; Saffer 1991; Saffer 2002; Young 1993). Although these studies can be viewed as pooled ITS studies, they did not meet all the review study inclusion criteria for ITS studies, specifically that the intervention could be identified as occurring at a clearly defined point in time. Data was aggregated and not analysed or reported within individual countries or states, and no defined points in time were reported for ban implementation. The country‐specific data were not available from the authors for further analysis.
The Loi Evin 1999 report of the French government details the consumption of alcohol in France before, during and after the introduction of the Loi Evin (ban on alcohol and smoking advertising) implemented in 1991. The law curtails alcohol advertising on television and in cinemas, and disallows sport sponsorship. In the report data are not presented in a manner that allowed us to extract them, as only percentages of use over time are reported. The report states that in France alcohol consumption was declining prior to the introduction of the banning law and that internal surveys have produced contradictory results. The report notes that the proportion of alcohol consumers aged 12 to 18 years had a tendency to decline in the 1980s, but then increased significantly between 1991 and 1995, from 47% in 1991 to 65% in 1995. No variance or significance levels were provided.
Risk of bias in included studies
We assessed the risk of bias using the combination of the standard appraisal for RCTs and the EPOC appraisal specifically for ITS studies (see Appendix 5 and Appendix 6). We provide a full description of the risk of bias for each included study in the Characteristics of included studies table, which is summarised in Figure 2 and Figure 3. None of the included studies were funded by the alcohol or advertising industries.
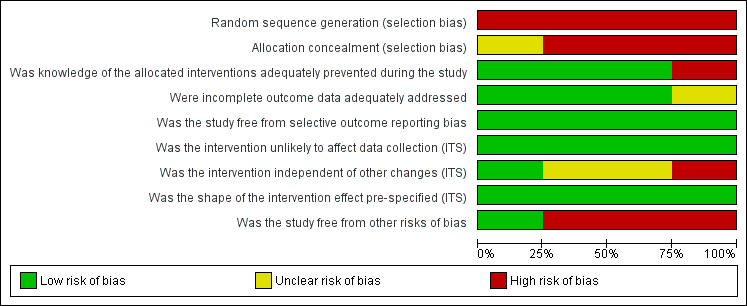
'Risk of bias' graph: review authors' judgements about each risk of bias item presented as percentages across all included studies (N = 4).
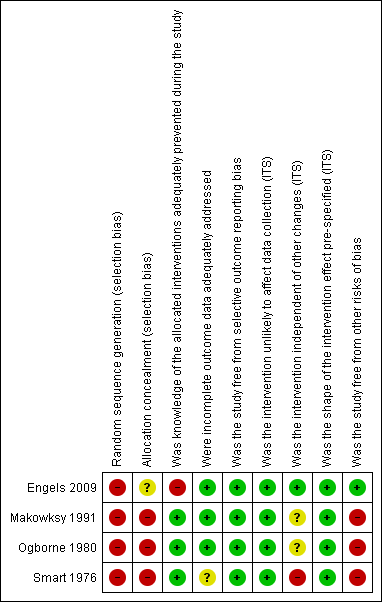
'Risk of bias' summary: review authors' judgements about each risk of bias item for each included study (N = 4).
Allocation
In Engels 2009 the method of generating the sequence or concealing allocation is not reported. The article states that men who were in the group allocated to watch movies with a high alcohol content reported higher rates of drinking in the week prior to the study indicating that randomisation did not achieve similar baseline differences between groups. We assessed the risk of biasas high.
We assessed all three ITS studies as having a high risk of bias due to a lack of randomisation and allocation concealment.
Blinding
Blinding of research staff was absent in the Engels 2009 trial and detection bias may be present so we rated the risk of bias as high.
We assessed the risk of performance and detection bias to be low in the three ITS studies, as outcomes were objectively measured by routine data collection and the outcomes were unlikely to be influenced by knowledge of the intervention groups.
Incomplete outcome data
We judged the risk of attrition bias to be unclear in Smart 1976, as data were not available for all alcohol types across all the same time periods. We judged the risk of attrition bias as low in the RCT and in the other two ITS studies.
Selective reporting
We considered that none of the studies were at risk of selective reporting bias. The Engels 2009 trial was not registered on a prospective trials registry but results were reported for all the outcomes identified in the methods section. We judged it to be unlikely that the outcomes were changed during the reporting period. For the three ITS studies, there is no indication that other outcomes would be of interest.
Other potential sources of bias
We made three additional assessments of risk of bias specifically pertaining to the ITS studies. These were whether the intervention would affect data collection, whether the intervention was independent of other changes, and whether the shape of the intervention effect had been prespecified.
Data collection influenced by intervention
For all three ITS studies the data were collected from routine sources and we considered the studies to be at low risk of bias.
Intervention independent of other changes
For Makowksy 1991 and Ogborne 1980, there was no report of historical or political reasons underpinning the decisions to lift or implement the ban. In Smart 1976, the advertising ban was initiated by a unanimous political vote, but the ban was stopped after elections when there was a change in political power. There is a likelihood that other political or social changes may have coincided with the period of the ban and as a result we rated this study as at high risk of bias.
Shape of the intervention effect pre‐specified
The directional effects of implementing or lifting advertising bans on alcohol consumption or sales were predicted in all three ITS studies prior to testing the intervention effect.
Other forms of bias
We judged all three ITS studies to be at high risk of bias introduced by a possible dilution effect on the advertising restrictions caused by an inability to regulate or control advertising originating in neighbouring provinces or the USA and available in print or electronic media.
Effects of interventions
See: Summary of findings for the main comparison Non‐alcohol commercials compared to alcohol commercials for reduction of alcohol consumption; Summary of findings 2 Alcohol ban compared to no ban for the general population
The RCT differed significantly from the three ITS studies in terms of design, participant level (individual versus population level) and duration. For this reason we present the results stratified according to study design and did not seek to conduct meta‐analysis across study design.
Alcohol consumption
RCT data
Engels 2009 reported that there were baseline differences between groups with participants in the groups exposed to movie clips with high‐alcohol content and commercials for alcohol reporting higher alcohol consumption in the week prior to the trial than those in the groups exposed to low‐alcohol content movie clips and neutral commercials. This was reported as a statistically significant difference (t (38) = 2.9; p value < 0.01). The means presented in the trial report were corrected for this difference using analysis of covariance but no further details are provided. Using the corrected means and reported SEs we calculated the SDs using the formula: SD = SE * Sqrt(N) to allow data entry into RevMan.
The Engels 2009 trial found that young men who viewed a movie clip with a low‐alcohol content, regardless of the content viewed in the commercial breaks, drank a mean of 1.73 (SD 1.33) glasses of alcoholic drink compared with young men viewing a movie clip with a high‐alcohol content who drank a mean of 2.38 (SD 1.33) glasses of alcoholic drink. This was a statistically significant difference (MD ‐0.65 drinks, 95% CI ‐1.2, ‐0.07; p value = 0.03). See Analysis 1.1. The number of alcoholic drinks consumed was 1.69 (SD 1.38) in young men who viewed commercials with no alcohol content compared with a mean of 2.42 (SD 1.25) alcoholic drinks in young men who viewed commercials for alcohol, regardless of the content of alcohol portrayed in the movie clips. This was a statistically significant difference (MD ‐0.73 drinks, 95% CI ‐1.30, ‐0.16); p value = 0.01). See Analysis 2.1.
As participants were recruited in pairs, the investigators conducted an analysis to adjust for clustering effects within pairs. The total alcohol consumption was reported to be statistically significantly higher in young men who viewed movie clips with a high‐alcohol content regardless of commercial content compared with young men who viewed movie clips with a low‐alcohol content (coefficient 0.74, 95% CI 0.05, 1.43; SE 0.35; p value = 0.03). See Analysis 3.1. Total alcohol consumption was statistically significantly higher in young men who viewed commercials with alcohol content compared with those who viewed commercials with neutral content, regardless of the content of alcohol portrayed in the movie clips (coefficient 0.83, 95% CI 0.14, 1.52; SE 0.35; p value = 0.02). See Analysis 4.1. Outcomes were assessed immediately after the intervention so no follow‐up data were available for evaluating the longer‐term effects of the low‐alcohol content movies or advertising.
ITS data
Due to differences in the reported types of effect estimates between the ITS studies, we were not able to combine these in a meta‐analysis, with the exception of Ogborne 1980 and Smart 1976. which both reported the mean percentage change in beer consumption.
Smart 1976 provide graphs and some statistical test results in the text, but we were unable to extract sufficient details for entering into RevMan with the exception of the data for beer consumption. We provide the results in narrative form as reported by the authors. The reported yearly per capita consumption data analysis did not show any effects of the 14‐month total ban on alcohol advertising implemented in 1971 and lifted in 1972. The authors reported a Mann‐Whitney U‐test indicating that there were no statistically significant differences in consumption of beer, wine and spirits during the ban years compared to the pre‐ban years (z 0.31, p value > 0.05).
A more detailed analysis using moving averages and a t‐test was conducted in Smart 1976 using monthly data in order to account for the ban spanning parts of two calendar years. The article reports that neither of the t values for wine nor beer was significant, with a reduction in wine consumption during (12%) and after (20%) the ban. The authors report that it was not possible to assess the monthly data on spirit consumption as data were not available for a full 24‐month period either before or after the ban. The authors report that inspection of the graph of spirit consumption shows similar results as for the beer data, with no graphically noticeable effect on consumption.
In Makowksy 1991 the effects of changing a total ban on all forms of alcohol advertising to a partial ban on spirits advertising only was compared for 2.5 years before the lifting of the ban and for 3.5 years after the lifting of the ban in Saskatchewan. Two types of models were applied to the data ‐ Abrupt and Gradual Auto‐regressive Integrated Moving Average (ARIMA) models, which adjust for seasonality, trends and random error. Both models assumed the change would be a permanent and not a temporary effect, given that the ban was not reversed. Following the lifting of the ban, the Abrupt ARIMA model indicated that the volume of all forms of alcohol sales decreased by 11.11 kilolitres (95% CI ‐27.56, 5.34; p value = 0.19) per month. This decrease was not statistically significant. See Analysis 5.1. Each type of alcohol was also examined separately within the model: the volume of beer sales increased statistically significantly by 14.89 kilolitres (95% CI 0.39, 29.39; p value = 0.04) per month following the ban; the volume of wine sales increased by 1.15 kilolitres (95% CI ‐0.91, 3.21; p value = 0.27) per month following the ban and was not statistically significant; and the volume of spirits decreased statistically significantly by 22.49 kilolitres (95% CI ‐36.83, ‐8.15; p value = 0.002). See Analysis 5.2, Analysis 5.3; and Analysis 5.4.
The Gradual ARIMA model (see Analysis 6.1; Analysis 6.2; Analysis 6.3; Analysis 6.4) did not find any statistically significant effects of the ban (under the assumption that prior to the intervention (lifting of the ban) the series was trendless). The authors conclude that the change in legislation regulating advertising of alcoholic beverages cannot be well modelled within the context of a gradual permanent impact on sales volumes due to a lack of statistical significance in the estimates for each type of alcoholic beverage and for total alcohol consumption.
Ogborne 1980 evaluated the effects of a partial ban on beer advertising on beer consumption and not on other forms of alcohol. Smart 1976 and Ogborne 1980 both reported the mean percentage change in beer consumption. In Ogborne 1980 the SD was not explicitly labelled as such so we made an assumption that the reported values were SD. We calculated the SE using the formula: SE = MD/t value.
Ogborne 1980 found a mean percentage increase in beer consumption of 4.5% (SD 2.15) following implementation of the partial ban on beer advertising, and Smart 1976 found a 2% (SD 1.66) decrease in beer consumption following implementation of a total ban on all forms of alcohol advertising. We combined the results in a meta‐analysis using the random‐effects model producing an overall mean percentage increase in beer consumption of 1.10% following the implementation of the bans (95% CI ‐5.26, 7.47; p value = 0.43). See Analysis 7.1. The finding was not statistically significant and considerable heterogeneity is present (Chi² = 5.72, df = 1 (p value = 0.02); I² = 83%) indicating that 83% of the variability in the effect estimate is due to heterogeneity rather than chance alone. We advise that these results should be interpreted with caution.
None of the ITS studies reported on adverse effects, either in terms of economic losses to the alcohol or advertising industries or in reductions in government tax revenues income.
GRADE ASSESSMENTS
GRADE assessments were conducted for all outcomes where data were available to enter into GRADEPro. For the 'Summary of findings' tables we selected seven outcomes per comparison and ranked their importance.
Using the GRADE approach to assess the overall quality of the evidence, we rated the quality of the evidence generated from the RCT as very low for the outcome of alcohol consumption (summary of findings Table for the main comparison). This was due to a serious risk of bias, serious indirectness of the included population and serious imprecision present in the results, primarily driven by the small sample size. No other outcomes were measured and therefore could not be graded.
Overall, when using the GRADE approach, we judged the evidence for alcohol consumption arising from the ITS studies to be very low quality. This was due to a high risk of bias arising from a lack of randomisation and imprecision in the results (summary of findings Table 2). As for the RCT, no other outcomes were measured and therefore could not be graded.
Using the GRADE approach, we conclude that we have very little confidence in the effect estimates and that the true effect is likely to be substantially different from the estimate of effect.
Discussion
Summary of main results
There is a lack of robust evidence either in support of or against restricting the advertising of alcohol to reduce alcohol consumption. One small RCT and three ITS studies were included in this review. Although the RCT found a statistically significant reduction in alcohol consumption among young men who were not exposed to alcohol advertising compared with young men who were exposed to alcohol advertising, the results should be viewed with caution in the light of the high risk of bias identified within the trial. The RCT did not evaluate any longer‐term effects as there was no follow‐up period, which limits inferences beyond the immediate effects.
Two of the three included ITS studies evaluated the implementation of a ban on advertising and the other ITS study evaluated the lifting of a ban which had been in place for over 50 years. The results from the three ITS studies were inconsistent. A meta‐analysis of the two studies which evaluated the implementation of a ban showed a non‐statistically significant mean percentage increase in beer consumption in the general population following the ban. The study evaluating the lifting of a total ban on all forms of alcohol advertising to a partial ban on spirits advertising only indicated that the volume of all forms of alcohol sales decreased per month after the ban was lifted. This was not statistically significant.
Overall completeness and applicability of evidence
The RCT was conducted in young, educated Dutch men in a university setting and may not be generalisable to women, older men or people living in rural and low‐resource settings. The results from the trial do, however, provide an indication of the potential for an RCT design to evaluate the immediate response behaviour of study participants to televised alcohol advertising. Stronger evidence would be gained from replicating trials within different age groups, with gender mixes, and in high‐ and low‐resource settings. The use of other electronic media, such as mobile phone messaging, for alcohol advertising and the context in which the advertising is delivered (e.g. television, at a cinema, on the internet) would also require consideration to ensure wider applicability of the results from future trials.
The ITS studies included in this review are over two decades old, thus limiting the utility of the findings to the present day landscape. With the advent of the internet and social media, it may be impossible to implement an advertising ban effectively. All three studies measured general population alcohol consumption using alcohol sales data and population census data. The figures from statistical records were used to estimate per capita alcohol consumption. Such per capita estimates provide an average picture but hide variations in consumption that exist, for instance, between heavy‐ and moderate‐alcohol drinkers, and among young people. An assessment of impact in this regard would require taking into account the patterns of change that occur between specific population groups as a result of a ban or restriction on advertising. Although household surveys may under‐report alcohol consumption (Stockwell 1999), they are most likely to show variations in the impact of a ban on advertising in an ITS study. Such an approach may also capture the effects on youth who are under the legal drinking age and who may not have started to drink yet. Hastings and colleagues have emphasized the importance of this group as they argue that the alcohol industry targets advertising to such persons to get them to begin drinking (Hastings 2010).
None of the included studies measured the additional outcomes prespecified in the review, including delaying the age of initiation of alcohol use or rates of reported risk behaviours, alcohol‐related injuries or other harms, or individual spending on alcohol. In addition, none of the studies considered the potential adverse effects of advertising restrictions, such as loss of revenue from the alcohol and advertising industries and a reduction in GDP attributable to alcohol sales, nor did any refer to potential job losses in the marketing and communication sectors due to an advertising ban. Future studies should aim to measure outcomes and adverse effects as comprehensively as possible in order to provide a balanced overall assessment of the effects of implementing advertising bans and restrictions.
We did not identify any studies conducted in resource‐constrained settings. In an assessment of the international determinants of alcohol advertising restrictions, Gallet and Andres conducted Probit regressions using observations from the year 2002 for 103 countries captured in the Global Information System on Alcohol and Health of the WHO (Gallet 2011). From the analysis they concluded that advertising restrictions were more probable in countries with higher income, higher life expectancy, higher percentage of the population that is young, and with a majority of the population that is Muslim. With the exception of the last observation, the studies included in this review broadly meet these criteria, with all three ITS studies conducted in Canada, a high‐income setting. There is therefore a clear gap in the evidence base regarding the influence of advertising restriction on general population alcohol consumption levels in low‐ and middle‐income countries. Authors of an overview of alcohol policy reform in Australia note that population‐wide interventions, such as advertising bans, may be more equitable than those interventions aimed at reducing alcohol harms, which rely on a healthcare practitioner for delivery (Doran 2010). This argument suggests that advertising restrictions may be an appropriate intervention for resource‐constrained settings should effectiveness be demonstrated.
Quality of the evidence
We judged the single RCT identified to be at a high risk of bias due to inadequate randomisation, uncertain allocation procedure and a lack of blinding. When using the GRADE approach to assess the overall quality of the evidence, we rated the quality of the evidence generated from the RCT as very low for the outcome of alcohol consumption (summary of findings Table for the main comparison). This was due to the risk of bias, indirectness of the included population and imprecision present in the results, primarily driven by the small sample size.
The three ITS studies were well conducted and met most of the criteria outlined by the EPOC 'Risk of bias' assessment. However, we identified all three as at risk of a dilution effect because advertising arising from neighbouring Canadian provinces or from the USA was not subject to regulation and the integrity of the intervention was thus compromised. Nevertheless, such dilution effects are a reflection of the current reality as alternative advertising forms, such as social media and internet‐driven advertising, arising from regions outside a study area or region where a ban is implemented, will remain challenging to regulate. In addition, other forms of alcohol control policy within a region may also dilute or (potentially) increase the impact of a reduction in advertising should such an impact exist. We were not able to determine this clearly from the study reports.
Seasonality was addressed inconsistently between the studies and different types of analyses were employed in each study to address it. This difference likely reflects the development of more sophisticated analyses over the 15‐year period between publication of the first ITS study in 1976 and the last ITS study in 1991. Overall, when using the GRADE approach, we judged the evidence arising from the three studies to be of very low quality. This was due to the high risk arising from a lack of randomisation and imprecision in the results (summary of findings Table 2).
Potential biases in the review process
We minimised possible selection biases in the review process by using a comprehensive search strategy to identify studies and, wherever possible, independently selecting and appraising the studies. In addition to searching journal electronic databases, we also searched conference databases and prospective trials registries, and contacted experts in the field who may have been aware of unpublished or ongoing studies. We contacted several authors of conference abstracts to confirm whether the data in their abstracts corresponded to subsequent journal articles or to assess whether the reported data were eligible for inclusion in this review. It is unlikely that we have missed any important studies given the close partnership we established with agencies and organisations working in this area.
Two authors independently carried out data extraction and quality assessment, which was checked by a third author. We presented the preliminary results at a Global Alcohol Policy Alliance meeting in Seoul, South Korea, in October 2013 and we have incorporated the feedback obtained into the review.
Agreements and disagreements with other studies or reviews
In 1988, Smart published a review of empirical studies on whether alcohol advertising affects overall consumption (Smart 1988). In addition to the two ITS studies we included in this review, which were published at the time (Ogborne 1980; Smart 1976), he reports on the lack of an effect of advertising bans implemented in Norway in 1975 and Finland in 1976, but presents no study designs or data. Despite the 25 years that have passed, our review agrees with his conclusion that no studies have examined the effects of advertising bans on specific segments of the population, such as heavy drinkers or young people. However, our review disagrees with his conclusion that advertising bans do not affect overall alcohol consumption as the data included in our review indicates that there is uncertainty as to whether this effect is beneficial, neutral or harmful. We did not identify any other reviews which specifically focused on the causal relationship between advertising restrictions and alcohol consumption.
During our search for eligible studies, we identified several reviews of the association between advertising and alcohol consumption, many of which were targeted at evaluating the link between advertising and the youth market. An argument can be made that should a causal link be shown between advertising and consumption, then reducing advertising should reduce consumption. It should be noted that we did not conduct a systematic search or critical appraisal of these reviews and we present the results of these reviews as reported by the authors.
A review published online in 2013 (Aspara 2013) reports on a qualitative review of 16 studies which the authors claim are most referred to by alcohol and addiction researchers to show that alcohol advertising increases total consumption. They conclude that the evidence is undermined by several methodological problems including the exclusive use of survey data, use of self‐reported data, a lack of exclusive outcomes in young people and the high attrition noted in many of the longitudinal studies. They recommend large‐scale field experiments and note that advertising should not be evaluated apart from other marketing variables, especially pricing. In a 2009 systematic review, Smith and Foxcroft (Smith 2009) identified seven cohort studies conducted almost exclusively in young people (more than 13,000) and concluded that the modest association effect size observed between exposure to alcohol advertising and subsequent alcohol consumption is likely to be limited by residual or unmeasured confounding. In another systematic review of 13 longitudinal studies of 38,000 young people, also published in 2009, Anderson et al. found that there was a consistent association between exposure to media/commercial communications and alcohol and adolescents starting to drink alcohol, but the authors acknowledge that they did not attempt to quantify the quality of study characteristics other than the longitudinal design (Anderson 2009a). In a 2010 published summary of the second edition of the book Alcohol: No ordinary commodity, the Alcohol and Public Policy Group report that there is consistent evidence to show that alcohol marketing reduces the age of onset of drinking and increases consumption by those who are already drinkers (Alcohol and Public Policy Group). The summary reports that despite the consistent evidence in support of the association, the question of whether restrictions are effective in reducing consumption remains unknown.

Flow diagram of screening and eligibility of records of electronic databases: PubMed, EMBASE, The Cochrane Library (CENTRAL and UK National Health Service Economic Evaluations Database) and PsychINFO

'Risk of bias' graph: review authors' judgements about each risk of bias item presented as percentages across all included studies (N = 4).

'Risk of bias' summary: review authors' judgements about each risk of bias item for each included study (N = 4).

Comparison 1 Low‐alcohol content movies versus high‐alcohol content movies, Outcome 1 Total alcohol consumption in number of glasses.
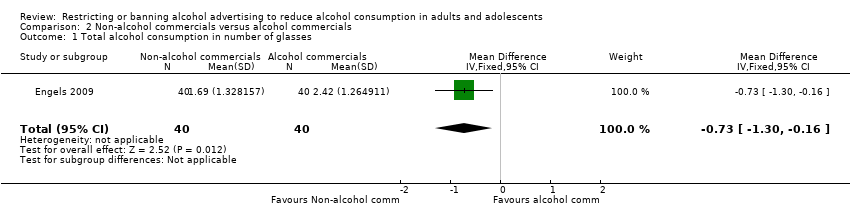
Comparison 2 Non‐alcohol commercials versus alcohol commercials, Outcome 1 Total alcohol consumption in number of glasses.

Comparison 3 High‐alcohol content movies versus low‐alcohol content movies adjusted for clustering effects, Outcome 1 Total alcohol consumption.

Comparison 4 Alcohol commercials versus non‐alcohol commercials adjusted for clustering effects, Outcome 1 Total alcohol consumption.

Comparison 5 Total advertising ban versus Partial advertising ban Abrupt permanent model, Outcome 1 Volume of alcohol (beer, wine and spirits) sales in kilolitres.
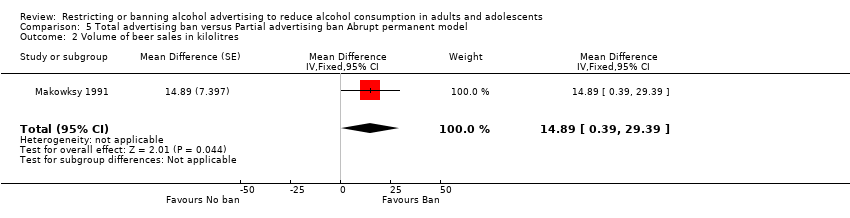
Comparison 5 Total advertising ban versus Partial advertising ban Abrupt permanent model, Outcome 2 Volume of beer sales in kilolitres.

Comparison 5 Total advertising ban versus Partial advertising ban Abrupt permanent model, Outcome 3 Volume of wine sales in kilolitres.

Comparison 5 Total advertising ban versus Partial advertising ban Abrupt permanent model, Outcome 4 Volume of spirits sales in kilolitres.
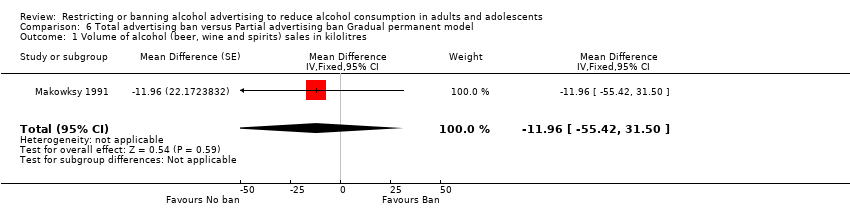
Comparison 6 Total advertising ban versus Partial advertising ban Gradual permanent model, Outcome 1 Volume of alcohol (beer, wine and spirits) sales in kilolitres.
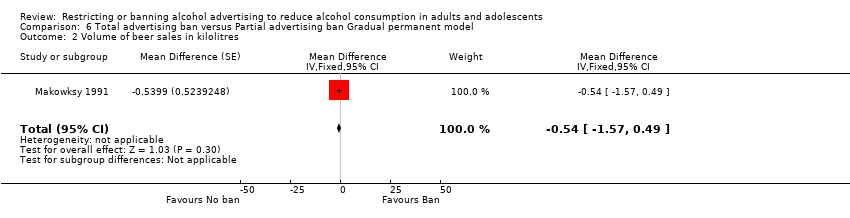
Comparison 6 Total advertising ban versus Partial advertising ban Gradual permanent model, Outcome 2 Volume of beer sales in kilolitres.
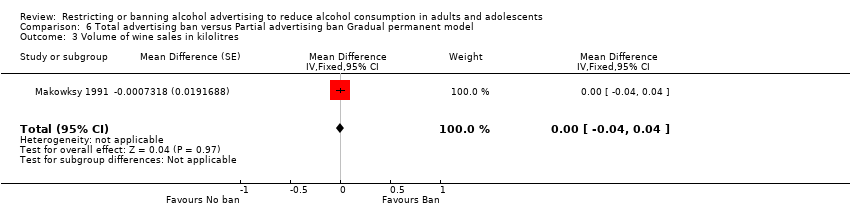
Comparison 6 Total advertising ban versus Partial advertising ban Gradual permanent model, Outcome 3 Volume of wine sales in kilolitres.
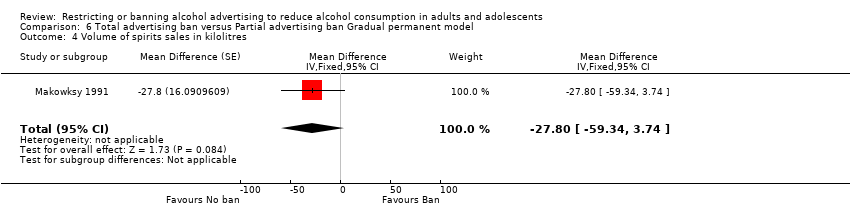
Comparison 6 Total advertising ban versus Partial advertising ban Gradual permanent model, Outcome 4 Volume of spirits sales in kilolitres.
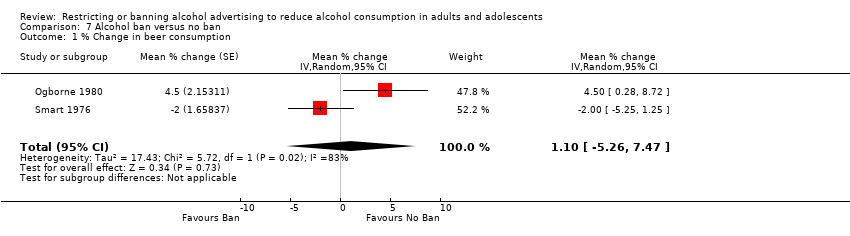
Comparison 7 Alcohol ban versus no ban, Outcome 1 % Change in beer consumption.
| Non‐alcohol commercials compared to alcohol commercials for reduction of alcohol consumption | ||||||
| Patient or population: General population | ||||||
| Outcomes | Illustrative comparative risks* (95% CI) | Relative effect | No. of participants | Quality of the evidence | Comments | |
| Assumed risk | Corresponding risk | |||||
| Alcohol commercials | Non‐alcohol commercials | |||||
| Total alcohol consumption in number of glasses | The mean total alcohol consumption in number of glasses in the intervention groups was | 80 | ⊕⊝⊝⊝ | |||
| Delayed age of initiation of alcohol use ‐ not measured | Not estimable | ‐ | This outcome was not applicable in this trial | |||
| Reduction in rate of reported risk behaviour ‐ not measured | Not estimable | ‐ | ||||
| Reduction in alcohol‐related injuries or accidents ‐ not measured | Not estimable | ‐ | ||||
| Reduction in individual spending on alcohol ‐ not measured | Not estimable | ‐ | ||||
| Loss of revenue from alcohol industry ‐ not measured | Not estimable | ‐ | This outcome was not applicable in this trial | |||
| Loss of advertising revenue ‐ not measured | Not estimable | ‐ | This outcome was not applicable in this trial | |||
| *The basis for the assumed risk (e.g. the median control group risk across studies) is provided in footnotes. The corresponding risk (and its 95% confidence interval) is based on the assumed risk in the comparison group and the relative effect of the intervention (and its 95% CI). | ||||||
| GRADE Working Group grades of evidence | ||||||
| 1 Risk of bias: rated as serious. In the Engels 2009 trial, randomisation was inadequate (the groups differed on the baseline prognostic factor prior drinking levels), allocation concealment was unclear and the researchers were not blinded to group allocation so detection bias may be present. | ||||||
| Alcohol ban compared to no ban for the general population | ||||||
| Patient or population: General population | ||||||
| Outcomes | Illustrative comparative risks* (95% CI) | Relative effect | No. of pParticipants | Quality of the evidence | Comments | |
| Assumed risk | Corresponding risk | |||||
| No ban | Alcohol ban | |||||
| Alcohol consumption: % change in beer consumption | The mean % change in beer consumption in the intervention groups was | 2 ITS studies | ⊕⊝⊝⊝ | Results for consumption of other types of alcoholic beverages and total consumption were inconsistent in the three ITS studies | ||
| Reduction in rate of reported risk behaviour ‐ not reported | See comment | See comment | Not estimable | ‐ | See comment | None of the studies measured this outcome |
| Delayed age of initiation of alcohol use ‐ not reported | See comment | See comment | Not estimable | ‐ | See comment | None of the studies measured this outcome |
| Reduction in alcohol‐related injuries or accidents ‐ not reported | See comment | See comment | Not estimable | ‐ | See comment | None of the studies measured this outcome |
| Reduction in individual spending on alcohol ‐ not reported | See comment | See comment | Not estimable | ‐ | See comment | None of the studies measured this outcome |
| Loss of revenue from alcohol industry ‐ not reported | See comment | See comment | Not estimable | ‐ | See comment | None of the studies measured this outcome |
| Loss of advertising revenue ‐ not reported | See comment | See comment | Not estimable | ‐ | See comment | None of the studies measured this outcome |
| *The basis for the assumed risk (e.g. the median control group risk across studies) is provided in footnotes. The corresponding risk (and its 95% confidence interval) is based on the assumed risk in the comparison group and the relative effect of the intervention (and its 95% CI). | ||||||
| GRADE Working Group grades of evidence | ||||||
| 1 Risk of bias: rated as serious: the risk of a dilution effect is present in both studies (Ogborne 1980 and Smart 1976) and seasonality may not be adequately addressed in the analyses. The studies were not further downgraded for limitations in causal inference due to a lack of randomisation, as the initial GRADE rating commenced at low quality. | ||||||
| Outcome or subgroup title | No. of studies | No. of participants | Statistical method | Effect size |
| 1 Total alcohol consumption in number of glasses Show forest plot | 1 | 80 | Mean Difference (IV, Fixed, 95% CI) | ‐0.65 [‐1.23, ‐0.07] |
| Outcome or subgroup title | No. of studies | No. of participants | Statistical method | Effect size |
| 1 Total alcohol consumption in number of glasses Show forest plot | 1 | 80 | Mean Difference (IV, Fixed, 95% CI) | ‐0.73 [‐1.30, ‐0.16] |
| Outcome or subgroup title | No. of studies | No. of participants | Statistical method | Effect size |
| 1 Total alcohol consumption Show forest plot | 1 | Coefficient (Fixed, 95% CI) | 0.74 [0.05, 1.43] | |
| Outcome or subgroup title | No. of studies | No. of participants | Statistical method | Effect size |
| 1 Total alcohol consumption Show forest plot | 1 | Coefficient (Fixed, 95% CI) | 0.83 [0.14, 1.52] | |
| Outcome or subgroup title | No. of studies | No. of participants | Statistical method | Effect size |
| 1 Volume of alcohol (beer, wine and spirits) sales in kilolitres Show forest plot | 1 | Mean Difference (Fixed, 95% CI) | ‐11.11 [‐27.56, 5.34] | |
| 2 Volume of beer sales in kilolitres Show forest plot | 1 | Mean Difference (Fixed, 95% CI) | 14.89 [0.39, 29.39] | |
| 3 Volume of wine sales in kilolitres Show forest plot | 1 | Mean Difference (Fixed, 95% CI) | 1.15 [‐0.91, 3.21] | |
| 4 Volume of spirits sales in kilolitres Show forest plot | 1 | Mean Difference (Fixed, 95% CI) | ‐22.49 [‐36.83, ‐8.15] | |
| Outcome or subgroup title | No. of studies | No. of participants | Statistical method | Effect size |
| 1 Volume of alcohol (beer, wine and spirits) sales in kilolitres Show forest plot | 1 | Mean Difference (Fixed, 95% CI) | ‐11.96 [‐55.42, 31.50] | |
| 2 Volume of beer sales in kilolitres Show forest plot | 1 | Mean Difference (Fixed, 95% CI) | ‐0.54 [‐1.57, 0.49] | |
| 3 Volume of wine sales in kilolitres Show forest plot | 1 | Mean Difference (Fixed, 95% CI) | ‐0.00 [‐0.04, 0.04] | |
| 4 Volume of spirits sales in kilolitres Show forest plot | 1 | Mean Difference (Fixed, 95% CI) | ‐27.8 [‐59.34, 3.74] | |
| Outcome or subgroup title | No. of studies | No. of participants | Statistical method | Effect size |
| 1 % Change in beer consumption Show forest plot | 2 | Mean % change (Random, 95% CI) | 1.10 [‐5.26, 7.47] | |