Kapnografi berbanding pemantauan standard untuk prosedur bius dan analgesia jabatan kecemasan
Referencias
References to studies included in this review
References to studies excluded from this review
Additional references
References to other published versions of this review
Characteristics of studies
Characteristics of included studies [ordered by study ID]
Ir a:
| Methods | Design: prospective, RCT Blinding: research associates blinded, participants and personnel unblinded, allocation concealed Dates: April 2006 to April 2010 | |
| Participants | n = 986 Included: adults (aged > 16 years) requiring PSA Excluded: critically ill people or people unable to give consent Location: emergency department, tertiary care university hospital, Canada | |
| Interventions | Control (n = 501) Standard monitoring (cardiac monitoring, blood pressure monitoring, pulse oximetry) Intervention (n = 485) Standard monitoring (as above) and end‐tidal capnography (measured every 5 seconds or absence of waveform at any time) | |
| Outcomes | Primary Oxygen desaturation (< 90% SpO2 for > 30 seconds) Airway interventions (airway repositioning manoeuvre, positive pressure ventilation, oral/nasal airway placement, endotracheal intubation)* Secondary Hypotension (SBP < 100 mmHg or < 85 mmHg if baseline < 100 mmHg) Sedation time (time from first dose of drug administration to commencement of procedure Recovery time (time from end of procedure to cessation of monitoring) Vomiting | |
| Funding sources | Research grant from government organization (Capital Health Research Fund, Halifax, Nova Scotia, Canada) | |
| Declarations of interest | No authors declared any actual or potential conflicts of interest. | |
| Notes | * Published data for airway interventions was continuous. Dichotomous data obtained by contacting authors. | |
| Risk of bias | ||
| Bias | Authors' judgement | Support for judgement |
| Random sequence generation (selection bias) | Low risk | Randomly assigned to each group by research associates (blinded) using computer‐generated randomization. |
| Allocation concealment (selection bias) | Low risk | Allocation concealed using opaque white envelopes. |
| Blinding of participants and personnel (performance bias) | High risk | Unblinded participants and personnel. |
| Blinding of outcome assessment (detection bias) | High risk | Unblinded outcome assessment. |
| Incomplete outcome data (attrition bias) | Low risk | No data excluded, all data included in analysis. |
| Selective reporting (reporting bias) | Unclear risk | All participants accounted for. Study was not enrolled in a trial registry and thus modifications to the study methods could not be assessed. |
| Other bias | Low risk | Funding: supported by an independent government grant. |
| Methods | Design: prospective RCT Blinding: research associates blinded, participants and personnel unblinded, allocation concealed Dates: November 2006 to February 2008 | |
| Participants | n = 132 Included: adults (aged > 18 years) requiring PSA Excluded: severe chronic obstructive pulmonary disease; chronic oxygen requirements; haemodynamic instability; respiratory distress; pregnancy; inability to provide informed consent; allergy to propofol, morphine, or fentanyl (or other components of its formulation); or if, in the judgement of the attending emergency physician, procedural sedation could compromise participant safety; critically ill patients or patients unable to give consent Location: emergency department, tertiary care university hospital, US | |
| Interventions | Control (n = 64) Standard monitoring (cardiac monitoring, pulse oximetry, and blood pressure monitoring) and blinded capnography Intervention (n = 68) Standard monitoring and capnography (measured every 5 seconds with waveform, respiratory depression defined as > 50 mmHg, absolute increase or decrease from baseline of > 10%, or loss of waveform for > 15 seconds)* | |
| Outcomes | Primary Hypoxia defined as < 93% SpO2 for > 15 seconds Secondary Airway Interventions (verbal or physical stimulation; airway realignment; use of additional oxygen; and use of airway adjuncts, assisted ventilation, or intubation) Hypotension (undefined, not reported in results) Vomiting (not reported in results) | |
| Funding sources | Capnography equipment donated by private company (Oridian Medical, Needham, MA) | |
| Declarations of interest | No authors declared any actual or potential conflicts of interest | |
| Notes | * Disqualified graphs if > 35% data loss | |
| Risk of bias | ||
| Bias | Authors' judgement | Support for judgement |
| Random sequence generation (selection bias) | Low risk | Randomly assigned to each group by research associates (blinded) using a computer‐generated randomization list. |
| Allocation concealment (selection bias) | Low risk | Research associates and treating physicians were blinded to the randomization choice until after enrolment. |
| Blinding of participants and personnel (performance bias) | High risk | Although all participants had capnography, only the participants/personnel in the capnography group could see the capnography monitor, whereas the standard group knew that they could not see the capnography monitor. Therefore, this was not blinded. |
| Blinding of outcome assessment (detection bias) | Low risk | Investigators evaluating graphs for outcome measures were blinded. |
| Incomplete outcome data (attrition bias) | High risk | Participant data excluded if 35% data loss. This resulted in 18/150 (12%) participants excluded. |
| Selective reporting (reporting bias) | High risk | Primary outcome data all accounted for outside the above exclusions. Secondary outcomes listed including vomiting and hypotension were mentioned in methods section but not reported on in results. The specific airway interventions were not reported (only total number of interventions) despite the methods section stating these data were collected. |
| Other bias | Unclear risk | Oxygen desaturation outcome defined as SpO2 < 93%. We were unable to reach author for unpublished data regarding this outcome. Funding: a device performing capnography was donated by a private medical manufacturing company. |
| Methods | Design: prospective RCT Blinding: research associates unblinded, participants and personnel unblinded, allocation concealed Dates: September 2011 to January 2013. | |
| Participants | n = 154 Included: paediatric participants (aged 1 to 20 years) requiring PSA Excluded: intubation, administration of baseline supplemental oxygen without preceding hypoxaemia, and conditions associated with abnormal ETCO2 values such as lower airway disease (e.g. asthma), diabetic ketoacidosis, moderate to severe dehydration, and major trauma. Participants were excluded if they did not tolerate the capnography cannula or if the participant cried for > 20% of the sedation Location: paediatric emergency department, tertiary care university hospital, US | |
| Interventions | Control (n = 77) Standard monitoring (cardiac monitoring, pulse oximetry, and blood pressure monitoring) and blinded capnography Intervention (n = 77) Standard monitoring and capnography (alerts at ETCO2 levels of < 30 mmHg and > 50 mmHg) | |
| Outcomes | Primary Oxygen desaturation (SpO2 < 95%) Airway interventions (verbal or physical stimulation, bag‐valve mask ventilation, jaw thrust, head tilt, use of a shoulder roll, supplemental oxygen, or reversal agents)* Secondary Oxygen desaturation (SpO2 < 90%)** | |
| Funding sources | Research grant from government organization (National Center for Advancing Translational Science, components of the National Institutes of Health) | |
| Declarations of interest | Not stated in publication | |
| Notes | *Airway interventions: verbal or physical stimulation, bag‐valve mask ventilation, airway repositioning (jaw thrust or head tilt), use of a shoulder roll, supplemental oxygen or reversal agents **Primary outcome was SpO2 < 95%. Secondary outcome SpO2 < 90% obtained by contacting author directly. | |
| Risk of bias | ||
| Bias | Authors' judgement | Support for judgement |
| Random sequence generation (selection bias) | Low risk | A statistician provided blocked randomization using Proc Plan (Sas 9.2, Cary, NC), with a 7‐digit random seed; group assignments were allocated to participants in a random sequence within blocks of 6. |
| Allocation concealment (selection bias) | Low risk | Allocation concealed with sealed, opaque envelopes. |
| Blinding of participants and personnel (performance bias) | High risk | Participants and personnel not blinded to capnography screens. |
| Blinding of outcome assessment (detection bias) | High risk | Research associates during procedures not blinded. |
| Incomplete outcome data (attrition bias) | Low risk | Outside of a priori defined exclusion criteria, all data included. |
| Selective reporting (reporting bias) | Low risk | All participant outcomes accounted for upon contacting author directly. |
| Other bias | Low risk | Unpublished data for the oxygen desaturation outcome was obtained from author. Funding: supported by an independent government grant. |
ETCO2: end‐tidal carbon dioxide partial pressure; n: number of participants; PSA: procedural sedation and analgesia; RCT: randomized controlled trial; SBP: systolic blood pressure; SpO2: blood oxygen saturation.
Characteristics of excluded studies [ordered by study ID]
Ir a:
| Study | Reason for exclusion |
| Not relevant interventions: supplemental oxygen vs compressed air for midazolam and fentanyl PSA. Retrospectively analysed blinded capnography data. | |
| Not relevant interventions: supplemental oxygen vs compressed air for propofol PSA. Retrospectively analysed blinded capnography data. | |
| Non‐relevant interventions: RCT comparing fentanyl vs fentanyl‐midazolam vs meperidine‐promethazine‐chlorpromethazine compound as sedation drugs for PSA. | |
| Non‐relevant interventions: RCT comparing sedation drugs for PSA then retrospectively analysed for adverse events and utility of capnography. |
PSA: procedural sedation and analgesia; RCT: randomized controlled trial.
Data and analyses
| Outcome or subgroup title | No. of studies | No. of participants | Statistical method | Effect size |
| 1 Oxygen desaturation Show forest plot | 3 | 1272 | Risk Ratio (M‐H, Random, 95% CI) | 0.89 [0.48, 1.63] |
| Analysis 1.1  Comparison 1 Capnography plus standard monitoring versus standard monitoring only, Outcome 1 Oxygen desaturation. | ||||
| 2 Hypotension Show forest plot | 1 | Risk Ratio (M‐H, Random, 95% CI) | Totals not selected | |
| Analysis 1.2  Comparison 1 Capnography plus standard monitoring versus standard monitoring only, Outcome 2 Hypotension. | ||||
| 3 Emesis, pulmonary aspiration Show forest plot | 1 | Risk Ratio (M‐H, Random, 95% CI) | Totals not selected | |
| Analysis 1.3  Comparison 1 Capnography plus standard monitoring versus standard monitoring only, Outcome 3 Emesis, pulmonary aspiration. | ||||
| 4 Airway interventions Show forest plot | 3 | 1272 | Risk Ratio (M‐H, Random, 95% CI) | 1.26 [0.94, 1.69] |
| Analysis 1.4  Comparison 1 Capnography plus standard monitoring versus standard monitoring only, Outcome 4 Airway interventions. | ||||
| 5 Oxygen desaturation (subgroup analysis) Show forest plot | 3 | Risk Ratio (M‐H, Random, 95% CI) | Subtotals only | |
| Analysis 1.5  Comparison 1 Capnography plus standard monitoring versus standard monitoring only, Outcome 5 Oxygen desaturation (subgroup analysis). | ||||
| 5.1 Adults (aged ≥ 18 years) | 2 | 1118 | Risk Ratio (M‐H, Random, 95% CI) | 0.79 [0.37, 1.71] |
| 5.2 Paediatric (aged <18 years) | 1 | 154 | Risk Ratio (M‐H, Random, 95% CI) | 1.33 [0.49, 3.66] |
| 6 Oxygen desaturation (sensitivity analysis), Deitch 2010 excluded Show forest plot | 2 | 1140 | Risk Ratio (M‐H, Random, 95% CI) | 1.33 [0.66, 2.69] |
| Analysis 1.6 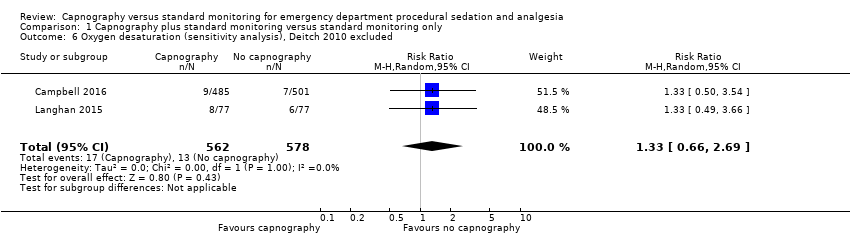 Comparison 1 Capnography plus standard monitoring versus standard monitoring only, Outcome 6 Oxygen desaturation (sensitivity analysis), Deitch 2010 excluded. | ||||
| 7 Airway interventions (subgroup analysis) Show forest plot | 3 | 1272 | Risk Ratio (M‐H, Random, 95% CI) | 1.26 [0.94, 1.69] |
| Analysis 1.7  Comparison 1 Capnography plus standard monitoring versus standard monitoring only, Outcome 7 Airway interventions (subgroup analysis). | ||||
| 7.1 Adults (aged ≥ 18 years) | 2 | 1118 | Risk Ratio (M‐H, Random, 95% CI) | 1.44 [1.16, 1.79] |
| 7.2 Paediatric (aged < 18 years) | 1 | 154 | Risk Ratio (M‐H, Random, 95% CI) | 0.97 [0.71, 1.34] |

Search flow diagram.

Risk of bias summary: review authors' judgements about each risk of bias item for each included study.

Risk of bias graph: review authors' judgements about each risk of bias item presented as percentages across all included studies.
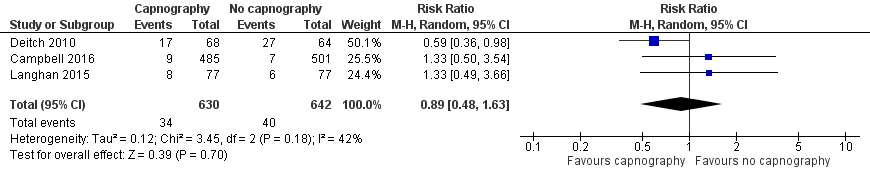
Forest plot of comparison: capnography plus standard monitoring versus standard monitoring, outcome: 1.1 oxygen desaturation.
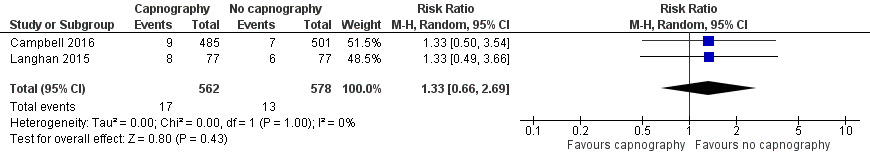
Forest plot of comparison: capnography plus standard monitoring) versus standard monitoring, outcome: 1.6 oxygen desaturation (sensitivity analysis based on definition of oxygen desaturation. Deitch 2010 excluded).

Forest plot of comparison: capnography plus standard monitoring versus standard monitoring, outcome: 1.7 airway interventions (subgroup analysis based on participant age).

Comparison 1 Capnography plus standard monitoring versus standard monitoring only, Outcome 1 Oxygen desaturation.

Comparison 1 Capnography plus standard monitoring versus standard monitoring only, Outcome 2 Hypotension.
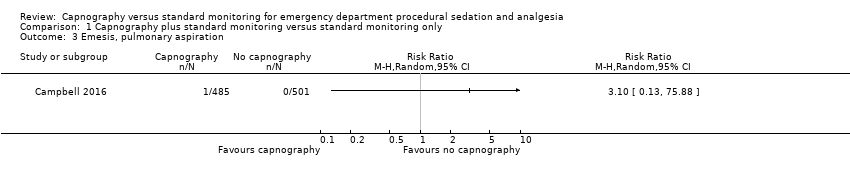
Comparison 1 Capnography plus standard monitoring versus standard monitoring only, Outcome 3 Emesis, pulmonary aspiration.
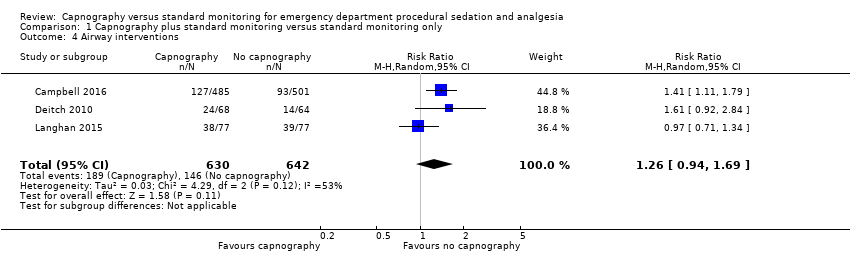
Comparison 1 Capnography plus standard monitoring versus standard monitoring only, Outcome 4 Airway interventions.
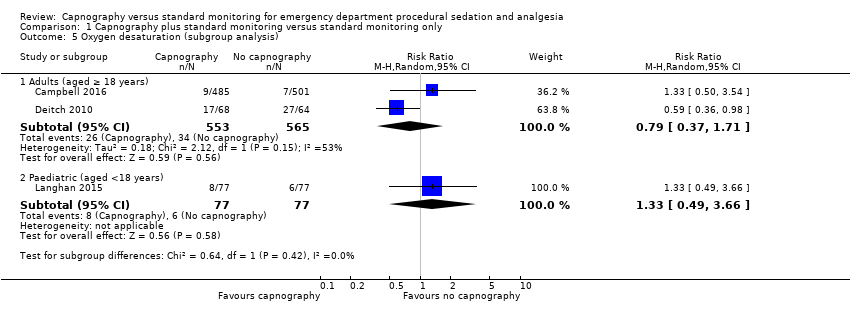
Comparison 1 Capnography plus standard monitoring versus standard monitoring only, Outcome 5 Oxygen desaturation (subgroup analysis).

Comparison 1 Capnography plus standard monitoring versus standard monitoring only, Outcome 6 Oxygen desaturation (sensitivity analysis), Deitch 2010 excluded.
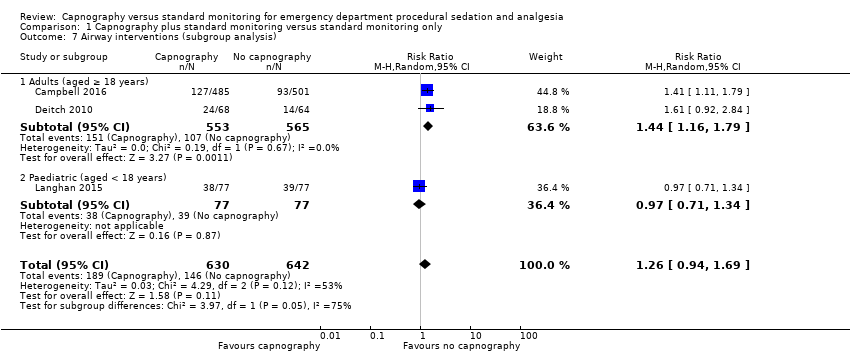
Comparison 1 Capnography plus standard monitoring versus standard monitoring only, Outcome 7 Airway interventions (subgroup analysis).
| Capnography and standard monitoring compared with standard monitoring for emergency department patients undergoing procedural sedation and analgesia | ||||||
| Patient or population: patients undergoing PSA Settings: emergency departments in North America Intervention: capnography and standard monitoring Comparison: standard monitoring | ||||||
| Outcomes | Illustrative comparative risks* (95% CI) | Relative effect | No of Participants | Quality of the evidence | Comments | |
| Assumed risk | Corresponding risk | |||||
| Standard monitoring | Capnography and standard monitoring | |||||
| Oxygen desaturation | Medium risk population | RR 0.89 (0.48 to 1.63) | 1272 participants (3 studies) | ⊕⊕⊕⊝ | ‐ | |
| 8 per 1000a | 7 per 1000 | |||||
| Hypotension | Medium risk population | RR 2.36 (0.98 to 5.69) | 986 participants (1 study) | ⊕⊕⊕⊝ | ‐ | |
| 6 per 1000c | 14 per 1000 | |||||
| Emesis, pulmonary aspiration | Medium risk population | RR 3.10 (0.13 to 75.88) | 986 participants (1 study) | ⊕⊕⊕⊝ | None of the studies recorded pulmonary aspiration events. | |
| 4 per 1000e | 4 per 1000 (1 to 304) | |||||
| Airway interventions | Medium risk population | RR 1.26 (0.94 to 1.69) | 1272 participants (3 studies) | ⊕⊕⊕⊝ | 2 studies included verbal/physical stimulation and supplemental oxygen as airway interventions (not consistent with our definition) but only reported total airway interventions (as dichotomous outcomes). | |
| 150 per 1000f | 189 per 1000 | |||||
| Airway interventions adult subgroup analysis (aged ≥ 18 years)h | Medium risk population | RR 1.44 (1.16 to 1.79) | 1118 participants (2 studies) | ⊕⊕⊕⊝ | ‐ | |
| 190 per 1000i | 274 per 1000 | |||||
| Recovery time | None of the studies reported recovery time. | |||||
| *The basis for the assumed risk (e.g. the median control group risk across studies) is provided in footnotes. The corresponding risk (and its 95% confidence interval) is based on the assumed risk in the comparison group and the relative effect of the intervention (and its 95% CI). CI: confidence interval; PSA: procedural sedation and analgesia; RR: risk ratio. | ||||||
| GRADE Working Group grades of evidence | ||||||
| aCampbell 2006; Cudny 2013. No study found to determine assumed risk for all‐age population, combined incidence of these studies used as a surrogate. Hypoxia defined as oxygen saturation < 90% at any time with baseline oxygen saturation ≥ 95% for Campbell 2006. Unknown definition of hypoxia for Cudny 2013. b Although statistics show low to moderate heterogeneity (I2 = 42%, P = 0.18), quality downgraded due to heterogeneity in study designs. cCampbell 2006. Hypotension defined as systolic blood pressure < 85 mmHg at any time with baseline systolic blood pressure ≥ 100 mmHg. d Downgraded for reporting bias in one study. eLanghan 2012. Used this paediatric study as surrogate for all ages population. g Downgraded due to significant heterogeneity (I2 = 53%). h The study by Campbell 2016 reported adults aged 16 years or greater whereas the study by Deitch 2010 reported adults aged greater than 18 years. j Downgraded due to heterogeneity in outcome definitions as well as small number of studies. | ||||||
| Outcome or subgroup title | No. of studies | No. of participants | Statistical method | Effect size |
| 1 Oxygen desaturation Show forest plot | 3 | 1272 | Risk Ratio (M‐H, Random, 95% CI) | 0.89 [0.48, 1.63] |
| 2 Hypotension Show forest plot | 1 | Risk Ratio (M‐H, Random, 95% CI) | Totals not selected | |
| 3 Emesis, pulmonary aspiration Show forest plot | 1 | Risk Ratio (M‐H, Random, 95% CI) | Totals not selected | |
| 4 Airway interventions Show forest plot | 3 | 1272 | Risk Ratio (M‐H, Random, 95% CI) | 1.26 [0.94, 1.69] |
| 5 Oxygen desaturation (subgroup analysis) Show forest plot | 3 | Risk Ratio (M‐H, Random, 95% CI) | Subtotals only | |
| 5.1 Adults (aged ≥ 18 years) | 2 | 1118 | Risk Ratio (M‐H, Random, 95% CI) | 0.79 [0.37, 1.71] |
| 5.2 Paediatric (aged <18 years) | 1 | 154 | Risk Ratio (M‐H, Random, 95% CI) | 1.33 [0.49, 3.66] |
| 6 Oxygen desaturation (sensitivity analysis), Deitch 2010 excluded Show forest plot | 2 | 1140 | Risk Ratio (M‐H, Random, 95% CI) | 1.33 [0.66, 2.69] |
| 7 Airway interventions (subgroup analysis) Show forest plot | 3 | 1272 | Risk Ratio (M‐H, Random, 95% CI) | 1.26 [0.94, 1.69] |
| 7.1 Adults (aged ≥ 18 years) | 2 | 1118 | Risk Ratio (M‐H, Random, 95% CI) | 1.44 [1.16, 1.79] |
| 7.2 Paediatric (aged < 18 years) | 1 | 154 | Risk Ratio (M‐H, Random, 95% CI) | 0.97 [0.71, 1.34] |