Хирургическое лечение эмпиемы плевры в сравнении с нехирургическим
Appendices
Appendix 1. Glossary of terms
Decortication: surgical removal of fibrous tissue in the pleural space.
Dyspnoea: symptom of breathlessness.
Fibropurulent: also known as fibrinopurulent. It pertains to pus or suppurative exudate that contains a relatively large amount of fibrin.
Intrapleural fibrinolytics: therapy involving administration of fibrinolytics (streptokinase or urokinase) through a chest tube drain to facilitate breakdown of any fibrous loculations and improve the drainage of the pleural collections.
Lactate dehydrogenase (LDH): an enzyme that functions in anaerobic glucose metabolism and glucose synthesis.
Mediastinum: a group of structures in the middle of the thorax, including the heart and its surrounding structures.
Open thoracotomy: surgical procedure to open up the chest cavity (typically a posterolateral incision in an intercostal space), which is widened by rib spreaders (retractors) to gain direct visualisation and access to the pleural space.
Thoracentesis: bedside procedure involving a fine needle (usually 12 to 14 G cannula) connected to a syringe that is inserted into the pleural space to drain any fluid for therapeutic or diagnostic purposes.
Thoracostomy: bedside procedure involving a small incision between two ribs and the insertion of a flexible plastic tube into the pleural space to drain pleural collections.
Video‐assisted thoracoscopic surgery (VATS): surgical procedure involving the insertion of a small video camera along with other surgical instruments through three to four small incision ports into the patient's chest, enabling the chest cavity to be visualised for the performance of surgical procedures.
Appendix 2. MEDLINE search strategy
MEDLINE (Ovid)
1 empyema/ or empyema, pleural/ (5754)
2 Pleural Effusion/ (13675)
3 empyema*.tw. (7147)
4 (pleur* adj3 (effus* or exud* or purulent* or suppurat* or pus)).tw. (18190)
5 pyothora*.tw. (539)
6 ((parapneumon* or para‐pneumon* or para pneumon*) adj3 effus*).tw. (530)
7 or/1‐6 (32019)
We combined the MEDLINE search strategy with the Cochrane Highly Sensitive Search Strategy for identifying randomised trials in MEDLINE (Lefebvre 2011).
Appendix 3. Embase (Elsevier) search strategy
#9 #7 AND #8 1572
#8 798343
#8.8 #8.3 NOT #8.7 798343
#8.7 #8.4 NOT #8.6
#8.6 #8.4 AND #8.5
#8.5 'human'/de
#8.4 'animal'/de OR 'nonhuman'/de OR 'animal experiment'/de
#8.3 #8.1 OR #8.2
#8.2 random*:ab,ti OR placebo*:ab,ti OR crossover*:ab,ti OR 'cross over':ab,ti OR allocat*:ab,ti OR trial:ti OR (doubl* NEXT/1 blind*):ab,ti
#8.1 'randomized controlled trial'/exp OR 'single blind procedure'/exp OR 'double blind procedure'/exp OR 'crossover procedure'/exp
#7 #1 OR #2 OR #3 OR #4 OR #5 OR #6 37679
#6 ((parapneumon* OR 'para‐pneumonia' OR 'para pneumonia') NEAR/3 effus*):ab,ti 650
#5 pyothora*:ab,ti 398
#4 (pleur* NEAR/3 (effus* OR exud* OR purulent* OR suppurat* OR pus)):ab,ti 18502
#3 empyema*:ab,ti 6015
#2 'pleura effusion'/de 26464
#1 'empyema'/de OR 'pleura empyema'/de 6876
Appendix 4. CINAHL (Ebsco) search strategy
S18 S7 AND S17 143
S17 S8 OR S9 OR S10 OR S11 OR S12 OR S13 OR S14 OR S15 OR S16 194,657
S16 (MH "Quantitative Studies") 8,886
S15 TI placebo* OR AB placebo* 20,650
S14 (MH "Placebos") 6,726
S13 (MH "Random Assignment") 29,577
S12 TI random* OR AB random* 103,219
S11 TI ( (singl* or doubl* or tripl* or trebl*) W1 (blind* or mask*) ) OR AB ( (singl* or doubl* or tripl* or trebl*) W1 (blind* or mask*) ) 14,983
S10 TI clinic* trial* OR AB clinic* trial* 31,567
S9 PT 50,578
S8 (MH "Clinical Trials+") 116,013
S7 S1 OR S2 OR S3 OR S4 OR S5 OR S6 1,693
S6 TI ( (parapneumon* or para‐pneumon* or para pneumon*) N3 effus* ) OR AB ( (parapneumon* or para‐pneumon* or para pneumon*) N3 effus* ) 54
S5 TI pyothora* OR AB pyothora* 5
S4 TI ( pleur* N3 (effus* or exud* or purulent* or suppurat* or pus) ) OR
AB ( pleur* N3 (effus* or exud* or purulent* or suppurat* or pus) ) 974
S3 TI empyema* OR AB empyema* 311
S2 (MH "Pleural Effusion") 943
S1 (MH "Empyema") 267
Appendix 5. LILACS (BIREME) search strategy
mh:empyema OR empiema OR mh:"Empyema, Pleural" OR pyothorax OR piotórax OR mh:"Pleural Effusion" OR "Derrame Pleural" OR "pleural effusion" OR "empyema thoracis" OR "para‐pneumonic effusion" OR "para‐pneumonic effusions" AND db:("LILACS") AND type_of_study:("clinical_trials")

Study flow diagram.
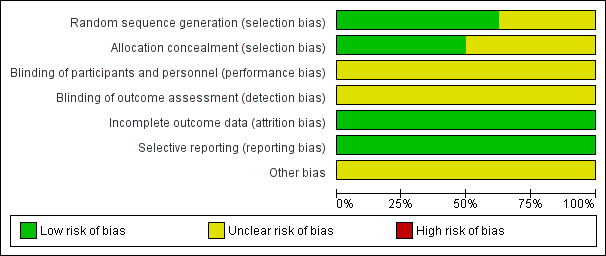
Risk of bias graph: review authors' judgements about each risk of bias item presented as percentages across all included studies.
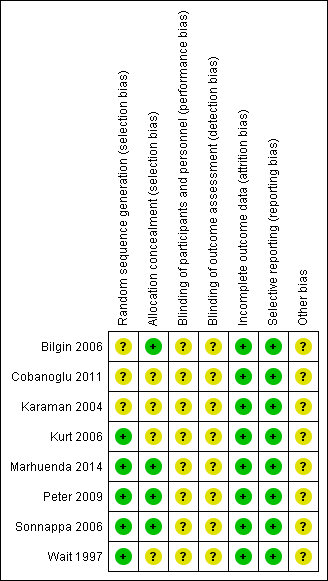
Risk of bias summary: review authors' judgements about each risk of bias item for each included study.
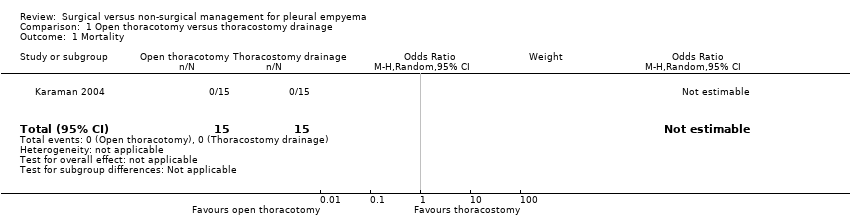
Comparison 1 Open thoracotomy versus thoracostomy drainage, Outcome 1 Mortality.

Comparison 1 Open thoracotomy versus thoracostomy drainage, Outcome 2 Length of hospital stay (days).

Comparison 1 Open thoracotomy versus thoracostomy drainage, Outcome 3 Procedural complications.

Comparison 2 VATS versus thoracostomy drainage, Outcome 1 Mortality.

Comparison 2 VATS versus thoracostomy drainage, Outcome 2 Length of hospital stay (days).

Comparison 2 VATS versus thoracostomy drainage, Outcome 3 Procedural complications.
| Open thoracotomy compared to thoracostomy drainage for pleural empyema | ||||||
| Patient or population: children with pleural empyema | ||||||
| Outcomes | Anticipated absolute effects* (95% CI) | Relative effect | № of participants | Quality of the evidence | Comments | |
| Thoracostomy drainage | Open thoracotomy | |||||
| Mortality Follow‐up: up to 3 months after discharge | Risk in study population | Not estimable | 30 | ⊕⊕⊕⊝ | No deaths occurred in either group. | |
| — | — | |||||
| Length of hospital stay (days) Follow‐up: up to 3 months after discharge | The mean length of hospital stay in the control group was 15.4 days. | The mean length of hospital stay in the intervention group was 5.9 days fewer (7.29 fewer to 4.51 fewer). | — | 30 | ⊕⊕⊕⊝ | |
| Procedural complications Follow‐up: up to 3 months after discharge | Risk in study population | OR 0.10 | 30 | ⊕⊕⊕⊝ | ||
| 600 per 1000 | 130 per 1000 | |||||
| *The risk in the intervention group (and its 95% confidence interval) is based on the assumed risk in the comparison group and the relative effect of the intervention (and its 95% CI). | ||||||
| GRADE Working Group grades of evidence | ||||||
| 1Downgraded one level due to small sample size and only one study. | ||||||
| VATS compared to thoracostomy drainage for pleural empyema | ||||||
| Patient or population: children and adults with pleural empyema | ||||||
| Outcomes | Anticipated absolute effects* (95% CI) | Relative effect | № of participants | Quality of the evidence | Comments | |
| Thoracostomy drainage | VATS | |||||
| Mortality | Risk in study population | OR 0.80 | 361 | ⊕⊕⊝⊝ | Data only for adults | |
| 6 per 1000 | 5 per 1000 | |||||
| Mortality: children | Risk in study population | Not estimable | 271 | ⊕⊕⊕⊝ | No deaths occurred in either group. | |
| Not pooled | Not pooled | |||||
| Mortality: adults Follow‐up: not reported | Risk in study population | OR 0.80 | 90 | ⊕⊕⊕⊝ | No deaths occurred in Bilgin 2006. Data based on Wait 1997 | |
| 23 per 1000 | 18 per 1000 | |||||
| Length of hospital stay (days) Follow‐up: 1 year in Cobanoglu 2011 and 3 months in Marhuenda 2014 | Control group | The mean length of hospital stay in the intervention group was 2.52 days fewer (4.26 fewer to 0.77 fewer). | — | 231 | ⊕⊕⊕⊝ | Note: Follow‐up period not reported in Kurt 2006; Peter 2009; Wait 1997. |
| Procedural complications Follow‐up: 6 months in Bilgin 2006 and not reported in Wait 1997 | Risk in study population | OR 0.46 | 271 | ⊕⊕⊕⊝ | ||
| 23 per 1000 | 11 per 1000 | |||||
| *The risk in the intervention group (and its 95% confidence interval) is based on the assumed risk in the comparison group and the relative effect of the intervention (and its 95% CI). | ||||||
| GRADE Working Group grades of evidence | ||||||
| 1Downgraded two levels due to wide confidence intervals (data from only one study) and indirectness (data only available for adults). | ||||||
| Trial | Total treatment cost (USD): | Total treatment cost (USD): | P value |
| Mean 386.672 ± 72.06 | Mean 957.487 ± 137.238 | < 0.001 | |
| Median (IQR) 21,947 (17,895 to 37,458) | Median (IQR) 19,714 (17,325 to 23,000) | 0.315 | |
| Mean 9127 | Mean 11,379 | < 0.001 | |
| Mean 7600 ± 5400 | Mean 11,700 ± 2900 | 0.02 | |
| Mean 24,052 ± 3466 | Mean 16,642 ± 2841 | 0.11 | |
| IQR: interquartile range | |||
| Trial | Duration of chest tube | Duration of chest tube drainage: | P value |
| Mean 9.48 ± 2.50 | Mean 6.56 ± 1.55 | < 0.001 | |
| Mean 13.8 ± 2.3 | Mean 7.5 ± 1.1 | < 0.05 | |
| Mean 9.63 ± 5.45 | Mean 2.80 ± 0.63 | < 0.001 | |
| Median (IQR) 5 (4 to 6) | Median (IQR) 4 (3 to 5) | < 0.001 | |
| Mean 9.8 ± 1.3 | Mean 5.8 ± 1.1 | 0.03 | |
| IQR: interquartile range | |||
| Trial | Postintervention fever duration: | Postintervention fever | P value |
| Mean 3.9 ± 2.1 | Mean 3.4 ± 2.4 | 0.782 | |
| Mean 6.25 ± 4.10 | Mean 3.60 ± 2.95 | 0.146 | |
| Median (IQR) 6 (3 to 7) | Median (IQR) 4 (2 to 7) | 0.62 | |
| Median (range) 2.5 (0 to 25) | Median (range) 2.5 (0 to 10) | 0.635 | |
| Mean 3.8 ± 2.9 | Mean 3.1 ± 2.7 | 0.46 | |
| IQR: interquartile range | |||
| Outcome or subgroup title | No. of studies | No. of participants | Statistical method | Effect size |
| 1 Mortality Show forest plot | 1 | 30 | Odds Ratio (M‐H, Random, 95% CI) | 0.0 [0.0, 0.0] |
| 2 Length of hospital stay (days) Show forest plot | 1 | 30 | Mean Difference (IV, Random, 95% CI) | ‐5.9 [‐7.29, ‐4.51] |
| 3 Procedural complications Show forest plot | 1 | 30 | Odds Ratio (M‐H, Random, 95% CI) | 0.10 [0.02, 0.63] |
| Outcome or subgroup title | No. of studies | No. of participants | Statistical method | Effect size |
| 1 Mortality Show forest plot | 7 | 361 | Odds Ratio (M‐H, Random, 95% CI) | 0.8 [0.04, 14.89] |
| 1.1 Children | 5 | 271 | Odds Ratio (M‐H, Random, 95% CI) | 0.0 [0.0, 0.0] |
| 1.2 Adults | 2 | 90 | Odds Ratio (M‐H, Random, 95% CI) | 0.8 [0.04, 14.89] |
| 2 Length of hospital stay (days) Show forest plot | 5 | 231 | Mean Difference (IV, Random, 95% CI) | ‐2.52 [‐4.26, ‐0.77] |
| 2.1 Children | 4 | 211 | Mean Difference (IV, Random, 95% CI) | ‐1.99 [‐4.36, 0.39] |
| 2.2 Adults | 1 | 20 | Mean Difference (IV, Random, 95% CI) | ‐4.10 [‐4.99, ‐3.21] |
| 3 Procedural complications Show forest plot | 5 | 271 | Odds Ratio (M‐H, Random, 95% CI) | 0.46 [0.08, 2.75] |
| 3.1 Children | 3 | 181 | Odds Ratio (M‐H, Random, 95% CI) | 0.94 [0.06, 15.48] |
| 3.2 Adults | 2 | 90 | Odds Ratio (M‐H, Random, 95% CI) | 0.28 [0.03, 2.88] |