Terapija željezom u anemičnih odraslih osoba bez kronične bubrežne bolesti
Abstract
Background
Anaemia affects about a quarter of the world's population. An estimated 50% of anaemic people have anaemia due to iron deficiency.
Objectives
To assess the safety and efficacy of iron therapies for the treatment of adults with anaemia who are not pregnant or lactating and do not have chronic kidney disease.
Search methods
We ran the search on 11 July 2013. We searched the Cochrane Central Register of Controlled Trials (CENTRAL), PubMed, EMBASE (Ovid SP), the Cumulative Index to Nursing and Allied Health Literature (CINAHL) Plus (EBSCO Host), the Institute for Scientific Information Web of Science (ISI WOS) Scientific Citation Index (SCI)‐EXPANDED (1970) and Conference Proceedings Citation Index (CPCI)‐Science (1990) and Clinicaltrials.gov; we also screened reference lists. An updated search was run on 24 November 2014 but the results have not yet been incorporated into the review.
Selection criteria
Two review authors independently selected references for further assessment by going through all titles and abstracts. Further selection was based on review of full‐text articles for selected references.
Data collection and analysis
Two review authors independently extracted study data. We calculated the risk ratio (RR) with 95% confidence interval (CI) for binary outcomes and the mean difference (MD) or the standardised mean difference (SMD) with 95% CI for continuous outcomes. We performed meta‐analysis when possible, when I2 was less than or equal to 80% using a fixed‐effect or random‐effects model, using Review Manager software. The range of point estimates for individual studies is presented when I2 > 80%.
Main results
We included in this systematic review 4745 participants who were randomly assigned in 21 trials. Trials were conducted in a wide variety of clinical settings. Most trials included participants with mild to moderate anaemia and excluded participants who were allergic to iron therapy. All trials were at high risk of bias for one or more domains. We compared both oral iron and parenteral iron versus inactive controls and compared different iron preparations.
The comparison between oral iron and inactive control revealed no evidence of clinical benefit in terms of mortality (RR 1.05, 95% CI 0.68 to 1.61; four studies, N = 659; very low‐quality evidence). The point estimate of the mean difference in haemoglobin levels in individual studies ranged from 0.3 to 3.1 g/dL higher in the oral iron group than in the inactive control group. The proportion of participants who required blood transfusion was lower with oral iron than with inactive control (RR 0.74, 95% CI 0.55 to 0.99; three studies, N = 546; very low‐quality evidence). Evidence was inadequate for determination of the effect of parenteral iron on mortality versus oral iron (RR 1.49, 95% CI 0.56 to 3.94; 10 studies, N = 2141; very low‐quality evidence) or inactive control (RR 1.04, 95% CI 0.63 to 1.69; six studies, N = 1009; very low‐quality evidence). Haemoglobin levels were higher with parenteral iron than with oral iron (MD ‐0.50 g/dL, 95% CI ‐0.73 to ‐0.27; six studies, N = 769; very low‐quality evidence). The point estimate of the mean difference in haemoglobin levels in individual studies ranged between 0.3 and 3.0 g/dL higher in the parenteral iron group than in the inactive control group. Differences in the proportion of participants requiring blood transfusion between parenteral iron and oral iron groups (RR 0.61, 95% CI 0.24 to 1.58; two studies, N = 371; very low‐quality evidence) or between parenteral iron groups and inactive controls (RR 0.84, 95% CI 0.66 to 1.06; eight studies, N = 1315; very low‐quality evidence) were imprecise. Average blood volume transfused was less in the parenteral iron group than in the oral iron group (MD ‐0.54 units, 95% CI ‐0.96 to ‐0.12; very low‐quality evidence) based on one study involving 44 people. Differences between therapies in quality of life or in the proportion of participants with serious adverse events were imprecise (very low‐quality evidence). No trials reported severe allergic reactions due to parenteral iron, suggesting that these are rare. Adverse effects related to oral iron treatment included nausea, diarrhoea and constipation; most were mild.
Comparisons of one iron preparation over another for mortality, haemoglobin or serious adverse events were imprecise. No information was available on quality of life. Thus, little evidence was found to support the use of one preparation or regimen over another.
Subgroup analyses did not reveal consistent results; therefore we were unable to determine whether iron is useful in specific clinical situations, or whether iron therapy might be useful for people who are receiving erythropoietin.
Authors' conclusions
• Very low‐quality evidence suggests that oral iron might decrease the proportion of people who require blood transfusion, and no evidence indicates that it decreases mortality. Oral iron might be useful in adults who can tolerate the adverse events, which are usually mild.
• Very low‐quality evidence suggests that intravenous iron results in a modest increase in haemoglobin levels compared with oral iron or inactive control without clinical benefit.
• No evidence can be found to show any advantage of one iron preparation or regimen over another.
• Additional randomised controlled trials with low risk of bias and powered to measure clinically useful outcomes such as mortality, quality of life and blood transfusion requirements are needed.
PICO
Laički sažetak
Terapija željezom u odraslih osoba bez bolesti bubrega
Dosadašnje spoznaje
Anemija je često stanje, koje zahvaća otprilike četvrtinu svjetske populacije. Anemija se može definirati kao smanjenje broja crvenih krvnih stanica u krvotoku ili smanjena količina hemoglobina u krvi (oboje služe za prijenos kisika). Procjenjuje se da 50% anemičnih ljudi ima anemiju zbog manjka željeza. Cilj ovog Cochrane sustavnog pregleda bio je ocijeniti sigurnost i korisnost liječenja željezom u odraslih muškaraca i odraslih žena (koje nisu bile trudne niti su nedavno bile rodile), koji nisu bolovali od bubrežnih bolesti. Autori Cochrane sustavnog pregleda pretražili su medicinsku literaturu u srpnju 2013. godine kako bi pronašli relevantne studije. Uključena su samo randomizirana istraživanja — studije u kojima je terapija koju primaju sudionici određena slučajnim odabirom, tako da su sudionicima sa sličnim karakteristikama dane različite terapije koje su se potom proučavale. Na taj se način ocjenjuje učinak terapije na te sudionike, umjesto ispitivanja već postojećih razlika između osoba koje primaju različite terapije. Uključena su sva istraživanja, bez obzira na godinu i jezik na kojem su objavljena. Dvoje autora sustavnog pregleda nezavisno su odabrali studije i zabilježili informacije iz tih studija kako bi se mogućnost pogreške smanjila na najmanju moguću razinu.
Značajke istraživanja
Uključeno je 4745 sudionika iz 21 istraživanja koji su primili injekcije željeza, željezo u tabletama ili nisu bili liječeni. Kliničke okolnosti tih istraživanja uključivale su, između ostalog, gubitak krvi, karcinom, anemiju prije operacije zbog različitih uzroka i zatajenje srca. Većina istraživanja uključivala je sudionike s blagom do umjerenom anemijom, a isključivala one sudionike koji su bili alergični na terapiju željezom.
Ključni rezultati
Uspoređivanjem liječenja sudionika tabletama željeza i neliječenja, nije pronađen dokaz da liječenje tabletama željeza ima koristan učinak u pogledu smanjenja smrtnosti i poboljšanja kvalitete života. Međutim, zabilježena je smanjena potreba za transfuzijom krvi unutar skupine pacijenata koji su primali tablete željeza, za razliku od onog dijela sudionika koji nije primio liječenje. Razine hemoglobina bile su više u sudionika koji su primali tablete željeza nego u onih koji nisu bili liječeni. Sudionici koji su liječeni injekcijama željeza imali su više razine hemoglobina u usporedbi sa sudionicima liječenima tabletama željeza i neliječenim sudionicima, ali nije dokazana korist injekcija željeza u vidu smanjenja smrtnosti, smanjivanja broja pacijenata kojima je potrebna transfuzija krvi, te u pogledu poboljšanja kvalitete života sudionika. Iako je prosječna količina krvi dana transfuzijom bila manja u skupini koja je liječena injekcijama željeza u usporedbi s onom koja je dana grupi liječenoj tabletama željeza, samo je jedna studija izvijestila o tom ishodu, zbog čega ne možemo biti sigurni u taj rezultat. Razlike u ozbiljnim komplikacijama između osoba koje su primale terapiju željezom i onih koje nisu primale terapiju nisu bile precizne. Niti jedno istraživanje nije izvijestilo o ozbiljnim alergijskim reakcijama na injekcije željeza, što navodi na zaključak da su one rijetke. Većina zapaženih nuspojava povezanih s liječenjem tabletama željeza bile su blage, poput mučnine, proljeva i zatvora. Usporedbama nije precizno utvrđena prednost jednog preparata željeza nad drugim po pitanju korisnog učinka. Nije bilo moguće odrediti je li željezo korisno u specifičnim kliničkim situacijama zbog toga što dostupne informacije nisu bile jasno predstavljene. Zaključak ovog sustavnog pregleda jest da u ovom trenutku nema dostupnih dokaza koji bi poduprijeli rutinsku primjenu injekcija željeza u odraslih anemičnih muškaraca i odraslih anemičnih žena koje nisu trudne i koje nisu nedavno rodile. Tablete željeza mogle bi biti korisne u onih anemičnih odraslih muškaraca i odraslih žena koji mogu podnositi njihove nuspojave. Nije dokazana ikakva prednost jednog preparata željeza nad drugim.
Buduća istraživanja
Dodatna randomizirana kontrolirana istraživanja nužna su kako bi se odredilo smanjuje li terapija željezom smrtnost i potrebe za transfuzijom krvi, te povećava li kvalitetu života. Takva bi istraživanja trebala biti odgovarajuće ustrojena i trebala bi uključivati dovoljno velik broj sudionika, kako bi se smanjila mogućnost pogrešnih zaključaka.
Authors' conclusions
Summary of findings
| Oral iron vs inactive control for anaemic patients | |||||
| Patient or population: patients with anaemia | |||||
| Outcomes | Illustrative comparative risks* (95% CI) | Relative effect | Number of participants | Quality of the evidence | |
| Assumed risk | Corresponding risk | ||||
| Inactive control | Oral iron | ||||
| Mortality | 100 per 1000 | 105 per 1000 (68 to 161) | RR 1.05 (0.68 to 1.61) | 659 | ⊕⊝⊝⊝ |
| Proportion requiring blood transfusion | 279 per 1000 | 206 per 1000 | RR 0.74 | 546 | ⊕⊝⊝⊝ |
| Length of hospital stay | Mean hospital stay in control groups was | Mean hospital stay in intervention groups was | 300 | ⊕⊝⊝⊝ | |
| Haemoglobin | Mean haemoglobin in control groups ranged between 11.4 g/dL and 12.4 g/dL | Point estimate of haemoglobin in intervention groups in the individual studies was 0.30 to 3.10 higher | 402 | ⊕⊝⊝⊝ | |
| Quality of life | ‐ | Mean quality of life in intervention groups was | 276 | ⊕⊝⊝⊝ | |
| Serious adverse events | 205 per 1000 | 197 per 1000 | RR 0.96 (0.76 to 1.22) | 731 | ⊕⊝⊝⊝ |
| *The basis for the assumed risk is the average risk among controls. The corresponding risk (and its 95% confidence interval) is based on assumed risk in the comparison group and the relative effect of the intervention (and its 95% CI). | |||||
| GRADE Working Group grades of evidence. | |||||
| aTrial(s) reporting this outcome was/were at high risk of bias. | |||||
| Parenteral iron vs inactive control for anaemic patients | |||||
| Patient or population: patients with anaemia | |||||
| Outcomes | Illustrative comparative risks* (95% CI) | Relative effect | Number of participants | Quality of the evidence | |
| Assumed risk | Corresponding risk | ||||
| Inactive control | Parenteral iron | ||||
| Mortality | 46 per 1000 | 47 per 1000 | RR 1.04 (0.63 to 1.69) | 2141 | ⊕⊝⊝⊝ |
| Proportion requiring blood transfusion | 182 per 1000 | 153 per 1000 | RR 0.84 (0.66 to 1.06) | 1315 | ⊕⊝⊝⊝ |
| Haemoglobin | Mean haemoglobin in control groups ranged between 11.2 g/dL and 13.0 g/dL | The point estimate of haemoglobin in intervention groups in the individual studies was from 0.30 to 3.00 higher | 1371 | ⊕⊝⊝⊝ | |
| Quality of life | ‐ | The point estimate of haemoglobin in intervention groups in the individual studies was between 0.04 standard deviations lower and 0.44 standard deviations higher | 1629 | ⊕⊝⊝⊝ | |
| Serious adverse events | 184 per 1000 | 184 per 1000 | RR 1 (0.74 to 1.34) | 1802 | ⊕⊝⊝⊝ |
| *The basis for the assumed risk is the average risk among controls. The corresponding risk (and its 95% confidence interval) is based on assumed risk in the comparison group and the relative effect of the intervention (and its 95% CI). | |||||
| GRADE Working Group grades of evidence. | |||||
| aTrial(s) reporting this outcome was/were at high risk of bias. | |||||
| Parenteral iron vs oral iron for anaemic patients | ||||||
| Patient or population: patients with anaemia | ||||||
| Outcomes | Illustrative comparative risks* (95% CI) | Relative effect | Number of participants | Quality of the evidence | Comments | |
| Assumed risk | Corresponding risk | |||||
| Oral iron | Parenteral iron | |||||
| Mortality | 12 per 1000 | 18 per 1000 | RR 1.49 (0.56 to 3.94) | 1009 | ⊕⊝⊝⊝ | |
| Proportion requiring blood transfusion | 189 per 1000 | 115 per 1000 | RR 0.61 (0.24 to 1.58) | 371 | ⊕⊝⊝⊝ | |
| Mean blood transfused | Mean mean blood transfused in control groups was | Mean blood transfused in intervention groups was | 44 | ⊕⊝⊝⊝ | ||
| Haemoglobin | Mean haemoglobin in control groups was between | Mean haemoglobin in intervention groups was | 769 | ⊕⊕⊝⊝ | ||
| Quality of life | ‐ | Mean quality of life in intervention groups was | 771 | ⊕⊝⊝⊝ | SMD 0.09 (‐0.04 to 0.22) | |
| Serious adverse events | 131 per 1000 | 162 per 1000 | RR 1.23 (0.99 to 1.54) | 1100 | ⊕⊝⊝⊝ | |
| *The basis for the assumed risk is average risk among controls. The corresponding risk (and its 95% confidence interval) is based on assumed risk in the comparison group and the relative effect of the intervention (and its 95% CI). | ||||||
| GRADE Working Group grades of evidence. | ||||||
| aTrial(s) reporting this outcome was/were at high risk of bias. | ||||||
Background
Description of the condition
Oxygen is necessary for efficient extraction of energy from food. Red blood cells carry oxygen in the blood, which is bound to a protein called haemoglobin (NCBI‐Hemoglobins). Iron is an essential component of haemoglobin (NCBI‐Iron).
Anaemia can be defined as a reduction in the number of circulating red cells or in the quantity of haemoglobin in the blood (NLM Anemia). The definition of anaemia (WHO 2001) provided by the World Health Organization (WHO) is shown in Table 1. The global prevalence of anaemia in the general population is 24.8%, with an estimated 1.6 billion people affected by anaemia worldwide (WHO 2008). Regional variations and differences in anaemia prevalence have been noted in men, non‐pregnant women, pregnant women and children of various ages (WHO 2001; WHO 2008).
| Group characteristics | Haemoglobin | Haematocrit | Haematocrit |
| Children (6 months to 59 months) | 110 | 6.83 | 0.33 |
| Children (5 to 11 years) | 115 | 7.13 | 0.34 |
| Children (12 to 14 years) | 120 | 7.45 | 0.36 |
| Non‐pregnant women (over 15 years of age) | 120 | 7.45 | 0.36 |
| Pregnant women | 110 | 6.83 | 0.33 |
| Men (over 15 years of age) | 130 | 8.07 | 0.39 |
aHaematocrit is the volume of packed red blood cells expressed in terms of fraction or percentages in a whole blood specimen (NCBI‐Hematocrit).
Common causes of anaemia include:
-
nutritional deficiency (such as deficient iron, folic acid or vitamin B12; vitamin A deficiency and protein‐energy malnutrition);
-
increased nutritional demand (as in pregnancy);
-
impaired production of red cells (as in chronic kidney disease);
-
genetic haemoglobin disorders resulting in increased destruction of red cells (such as thalassaemias);
-
infectious diseases (such as worm infestation and malaria);
-
malabsorption and disorders of the small intestine;
-
blood loss (acute blood loss as in surgery and chronic blood loss as in menstrual disorders or occult gastrointestinal bleeding); and
-
anaemia of chronic disease (also known as anaemia of inflammation).
These causes are associated with a combination of defective incorporation of iron into developing red cells, decreased availability of iron stores as the result of increased uptake and retention of iron within the reticuloendothelial system, decreased erythropoietin and increased destruction of red cells resulting from increased cytokines released as part of a chronic inflammatory response (examples include rheumatoid arthritis, malignancy, chronic infection and chronic kidney disease) (Balarajan 2011; Davis 2012; Goonewardene 2012; Fireman 2004; Weiss 2005).
For an estimated 50% of anaemic people, iron deficiency is the cause of their condition (WHO 2001; WHO 2008) and may be due to insufficient intake, decreased absorption or blood loss greater than 5 to 10 mL per day (the amount of iron the gut can absorb from a normal diet) (Balarajan 2011; Liu 2012). Vegetarians have a high prevalence of iron deficiency (Waldmann 2004) and a higher prevalence of anaemia compared with non‐vegetarians (Jain 2012). It is important to note that the etiopathogenesis of anaemia in nutritional deficiency and blood loss is iron deficiency and in chronic inflammatory disorders such as rheumatoid arthritis consists of defective incorporation of iron into developing red cells and increased destruction of red cells (Davis 2012; Fireman 2004). Because circulatory iron is low in people with anaemia of chronic disease (Weiss 2005), and because erythropoietin deficiency is one of the mechanisms of anaemia of chronic disease (Davis 2012; Weiss 2005), people with anaemia due to chronic disease can be treated with a combination of erythropoietin and iron (Davis 2012).
Anaemia can cause fatigue (Foubert 2006) and decreased work activity (Scholz 1997). Anaemia can worsen heart failure (Ghali 2009) and is associated with increased mortality in people with chronic heart failure (von Haehling 2010). In people undergoing an operation, preoperative anaemia is associated with increased mortality (Beattie 2009; Dunne 2002; Musallam 2011) and morbidity (Musallam 2011) and prolonged hospital stay (Leichtle 2011). In children, anaemia may cause developmental delays and cognitive impairment (Yadav 2011).
Description of the intervention
Iron therapy can be administered orally (ferrous sulphate, ferrous fumarate and ferrous gluconate), intramuscularly (iron dextran) or intravenously (iron dextran, iron sucrose, iron isomaltoside, ferumoxytol and ferric carboxymaltose) (Goddard 2011). Serious adverse events related to intravenous iron are rare and include death, pulmonary embolism, anaphylaxis, unresponsiveness, loss of consciousness, circulatory collapse, hypotension, anaphylactoid reaction, dyspnoea, pruritus, hypersensitivity and urticaria (Bailie 2012). According to the US Food and Drug Administration (FDA) database, on average, four major or serious adverse events have been reported for every one million units (one unit is equivalent to 100 mg of iron, otherwise called 100 mg dose equivalent) of iron sucrose sold in the United States (Bailie 2012). Serious and major adverse events for other intravenous iron preparations from this database include 184 per million units for ferumoxytol, 10 per million units for sodium ferric gluconate and 27 per million units for iron dextran (Bailie 2012). The adverse effects of oral iron are usually gastrointestinal and include heartburn, nausea, vomiting, diarrhoea and constipation (Hyder 2002). Iron preparations generally are made from chemicals, not from animal products; hence they are acceptable for vegetarians.
How the intervention might work
Iron supplementation provides iron to the blood circulation system. The amount of iron that reaches the blood circulation varies with different routes of administration, the form of iron given and other factors specific to the route of administration. Bioavailability indicates the proportion of administered iron that reaches the general body circulation. Oral iron in the form of bivalent iron (ferrrous form) is preferable to the trivalent form (ferric) because the ferrous form is more bioavailable. On average, the bioavailability of the ferrous form is about 10% to 15% that of total iron, and that of the ferric form is three to four times less (Santiago 2012). The bioavailability of oral iron depends on various factors, including iron stores of the individual, fasting state at the time of iron consumption, the chemical to which the iron is bound (e.g. ferrous sulphate vs ferrous fumarate) and the addition of vitamin C and lysine (Santiago 2012). Oral iron absorption is reduced in infection, inflammation and chronic disease (Weiss 2005). The bioavailability of intramuscular iron is unpredictable; this fact, combined with other factors such as painful injection and staining of the skin at the injection site, has generally made intramuscular iron obsolete (Silverstein 2004). Intravenous iron directly enters the circulation and reaches the reticuloendothelial system, where it is used for haemoglobin production (Danielson 2004). Iron therapy acts by replenishing iron stores in the body in the case of nutritional iron deficiency or chronic blood loss. Iron is an essential component of haemoglobin; therefore replenishing iron stores may increase the production of haemoglobin. In the case of anaemia of chronic disease, increasing circulatory iron may increase the iron that is available for the production of haemoglobin.
Why it is important to do this review
Cochrane reviews about the role of iron therapy in people with chronic kidney disease, in people undergoing renal transplant, in pregnant women and in postpartum women and children are available or have been registered as in progress (Albaramki 2012;Dodd 2004; Reveiz 2011; Zeng 2009). However, no systematic review of randomised controlled trials (RCTs) has assessed the clinical benefits of iron therapy in anaemic people without chronic kidney disease or pregnancy, or during the postpartum period. It is important to obtain evidence of the effectiveness of iron therapy in different clinical conditions. Hence, the findings of this review can influence the care of a large number of people.
Objectives
To assess the safety and efficacy of iron therapies for the treatment of adults with anaemia who are not pregnant or lactating and do not have chronic kidney disease.
Methods
Criteria for considering studies for this review
Types of studies
Randomised controlled trials, irrespective of blinding, language, publication status, date of publication, study setting and sample size, were included. We planned to include cluster‐randomised trials provided that the effect size had been adjusted for clustering; however, we did not find any such trials.
Studies in which treatment group allocation could be predicted, such as allocation by hospital number or date of birth, were excluded. Trials at unclear or at high risk of bias due to allocation concealment were also excluded from the review.
Types of participants
Any non‐pregnant and non‐lactating anaemic adult without chronic kidney disease was included in this review, irrespective of the setting and the degree of anaemia. We included the following broad categories of participants (this is not an exhaustive list).
-
Blood loss.
-
Cancer.
-
Preoperative anaemia.
-
Chronic heart failure.
-
Autoimmune disorders.
We excluded four important categories of people with anaemia.
-
Patients with chronic kidney disease and renal transplant, because these participants were included in the review, 'Parenteral versus oral iron therapy for adults and children with chronic kidney disease' (Albaramki 2012).
-
Pregnant women because these participants were included in the review, 'Treatments for iron‐deficiency anaemia in pregnancy' (Reveiz 2011).
-
Postpartum women because these participants were included in the review, 'Treatment for women with postpartum iron deficiency anaemia' (Dodd 2004).
-
Children because they were included in another review, 'Iron supplementation for iron deficiency anaemia in children' (Zeng 2009). We made efforts to exclude children in cases in which their data were described in detail; however, if no detailed description was provided, the trial was included with the knowledge that a small quantity of data from children may be included in the review.
We accepted any definition of anaemia used by study authors, provided that all male participants had less than 13 g/dL and all female participants had less than 12 g/dL of haemoglobin (i.e. all participants must have met the WHO criteria for anaemia for adult males and non‐pregnant females). We are aware that some potential participants who meet the WHO criteria may not be included in a trial because it used a different level of haemoglobin or another measure to diagnose anaemia (e.g. 11 g/dL haemoglobin).
Types of interventions
-
Oral iron versus placebo or no iron therapy.
-
Parenteral iron versus placebo or no iron therapy.
-
Parenteral iron versus oral iron.
-
Different oral iron formulations (and doses).
-
Different parenteral iron formulations (and routes (intramuscular vs intravenous) and doses).
Co‐interventions were allowed if they were provided equally in study groups.
Types of outcome measures
Primary outcomes
-
Mortality: risk of death at one year (all‐cause mortality).
Secondary outcomes
-
Mortality: hazard ratio of all‐cause mortality at different periods of follow‐up (short, medium and long, depending on available follow‐up periods of studies).
-
Risk of requiring blood transfusion.
-
Mean difference in blood transfused (as defined by study authors).
-
Mean difference in haemoglobin levels.
-
Mean difference (or standardised mean difference if different scales were used) in quality of life (as defined by study authors).
-
Risk of serious adverse events: Serious adverse events are defined as any events that would increase mortality; are life threatening; or required inpatient hospitalisation or resulted in persistent or significant disability; and any important medical events that might have jeopardised participants or required intervention to prevent them (ICH‐GCP 1996) (within 30 days of cessation of treatment).
-
Narrative summary of length of hospital stay.
Search methods for identification of studies
To reduce publication and retrieval bias, we did not restrict our search by language, date or publication status. We included appropriate studies regardless of whether they are published or unpublished.
Electronic searches
We searched the following electronic databases.
-
Cochrane Central Register of Controlled Trials (The Cochrane Library) (Issue 7, 2013);
-
MEDLINE (Ovid) (1950 to July 2013);
-
EMBASE (Ovid) (1980 to July 2013);
-
CINAHL (Cumulative Index to Nursing and Allied Health Literature) Plus (EBSCO) (1957 to July 2013);
-
ISI Web of Science: Science Citation Index Expanded (SCI‐EXPANDED) (1970 to July 2013);
-
ISI Web of Science: Conference Proceedings Citation Index‐Science (CPCI‐S) (1990 to July 2013).
Search strategies are listed in Appendix 1.
An updated search was run on 24 November 2014 but the results have not yet been incorporated into the review. The studies identified are listed in Studies awaiting classification.
Searching other resources
We searched the reference lists of all included studies and previously published reviews for additional studies. We contacted study authors and experts in the field to request additional published or unpublished study information.
We had planned to search Google Scholar and to investigate the following online trial registers using the search strategy provided in Appendix 1.
-
ClinicalTrials.gov (www.clinicaltrials.gov).
-
WHO International Clinical Trials Registry Platform (ICTRP) portal (http://apps.who.int/trialsearch/).
However because of the number of reports retrieved (tens of thousands of reports), we searched only the ClinicalTrials.gov trial register.
Data collection and analysis
We performed this systematic review in accordance with instructions given in the Cochrane Handbook for Systematic Reviews of Interventions (Higgins 2011).
Selection of studies
Two review authors (KSG and TR or MN) identified trials for inclusion independently of each other. We listed the excluded studies along with reasons for exclusion. We resolved differences through discussion.
Data extraction and management
KSG and MN independently extracted the following data from each included study report.
-
Year and language of publication.
-
Country of participant recruitment.
-
Year of conduct of the trial.
-
Inclusion and exclusion criteria.
-
Sample size.
-
Population characteristics.
-
Details of iron supplementation, including dose, route, frequency and duration.
-
Outcomes reported and times the outcomes were measured.
-
Outcomes included in this review.
-
Risk of bias (as described later).
We obtained this information from all reports if multiple reports described a particular trial. We sought unclear or missing information by contacting the authors of individual trials. If we had any doubt about whether trials shared the same participants, completely or partially (with common authors and centres), we contacted the study authors to clarify whether the trial report had been duplicated. We resolved differences in opinion through discussion.
For cluster‐randomised trials, we planned to extract effect estimates of the outcomes adjusted for a cluster effect. However, we identified no cluster‐randomised trials.
Assessment of risk of bias in included studies
We followed the instructions given in the Cochrane Handbook for Systematic Reviews of Interventions (Higgins 2011b). According to empirical evidence (Kjaergard 2001; Lundh 2012; Moher 1998; Schulz 1995; Wood 2008), the risk of bias of included trials was assessed on the basis of the following bias risk domains.
Sequence generation
-
Low risk of bias: The method used was adequate (e.g. computer‐generated random numbers, table of random numbers) or was unlikely to introduce confounding.
-
Uncertain risk of bias: Information was insufficient to allow assessment of whether the method used was likely to introduce confounding. Such studies were excluded.
-
High risk of bias: The method used (e.g. quasi‐randomised studies) was improper and was likely to introduce confounding. Such studies were excluded.
Allocation concealment
-
Low risk of bias: The method used (e.g. central allocation) was unlikely to induce bias on the final observed effect.
-
Uncertain risk of bias: Information was insufficient to allow assessment of whether the method used was likely to induce bias on the estimate of effect.
-
High risk of bias: The method used (e.g. open random allocation schedule) was likely to induce bias on the final observed effect.
Blinding of participants, personnel
-
Low risk of bias: Blinding was performed adequately, or the outcome measurement was not likely to be influenced by lack of blinding.
-
Uncertain risk of bias: Information was insufficient to allow assessment of whether the type of blinding used was likely to induce bias on the estimate of effect.
-
High risk of bias: No blinding or incomplete blinding was applied, and the outcome or the outcome measurement was likely to be influenced by lack of blinding.
Blinding of outcome assessors
-
Low risk of bias: Blinding was performed adequately, or the outcome measurement was not likely to be influenced by lack of blinding.
-
Uncertain risk of bias: Information was insufficient to allow assessment of whether the type of blinding used was likely to induce bias on the estimate of effect.
-
High risk of bias: No blinding or incomplete blinding was applied, and the outcome or the outcome measurement was likely to be influenced by lack of blinding.
Incomplete outcome data
-
Low risk of bias: The underlying reasons for missingness were unlikely to make treatment effects a departure from plausible values, or proper methods had been employed to handle missing data.
-
Uncertain risk of bias: Information was insufficient to allow assessment of whether the missing data mechanism in combination with the method used to handle missing data was likely to induce bias on the estimate of effect.
-
High risk of bias: The crude estimate of effects (e.g. complete case estimate) were clearly biased because of the underlying reasons for missingness, and the methods used to handle missing data were unsatisfactory.
Selective outcome reporting
-
Low risk of bias: The trial protocol was available, and all of the trial's prespecified outcomes that are of interest for the review had been reported; if the trial protocol was not available, mortality and serious adverse events were reported.
-
Uncertain risk of bias: Information was insufficient to allow assessment of whether the magnitude and the direction of the observed effect were related to selective outcome reporting.
-
High risk of bias: Not all of the trial's prespecified primary outcomes had been reported or were similar.
Source of funding bias
-
Low risk of bias: The trial protocol was available, and the trial was carried out according to the protocol; or if the trial protocol was not available, the trial was funded by a sponsor who had no vested interest in the results of the trial.
-
Uncertain risk of bias: Information was insufficient to allow assessment of whether the magnitude and the direction of the observed effect were related to the source of funding.
-
High risk of bias: Violation of trial protocol occurred, and information on the funder was insufficient; or if the trial protocol was not available, the trial was funded by a sponsor who had vested interest in the results of the trial, such as an iron manufacturer.
We considered all trials that were classified as having low risk of bias in all of the previously listed domains as low risk of bias trials.
Measures of treatment effect
For dichotomous variables, we calculated the risk ratio (RR) with 95% confidence interval (CI). For continuous variables, we calculated the mean difference (MD) with 95% CI for outcomes such as hospital stay, and standardised mean difference (SMD) with 95% CI for quality of life (when different scales were used). For time‐to‐event outcomes such as mortality at maximal follow‐up, we planned to calculate the hazard ratio (HR) with 95% CI.
Unit of analysis issues
The unit of analysis was the individual anaemic person undergoing treatment. In the case of cluster‐randomised trials, we planned to obtain the effect estimate adjusted for the cluster effect.
Dealing with missing data
We performed an intention‐to‐treat analysis (Newell 1992) when possible. We planned to impute data for binary outcomes using various scenarios such as good outcome analysis, bad outcome analysis, best‐case scenario and worst‐case scenario, if more than 25% was missing (Gurusamy 2009).
For continuous outcomes, we used available‐case analysis. If the mean and the standard deviation were not available from the trial report, we sought this information from the trial authors. If this information still was not available, we imputed the standard deviation from P values in keeping with instructions given in the Cochrane Handbook for Systematic Reviews of Interventions (Higgins 2011), and we used the median for the meta‐analysis when the mean was not available. If it was not possible to calculate the standard deviation from the P value or the confidence intervals, we imputed the standard deviation as the highest standard deviation in the other trials included under that outcome, fully recognising that this form of imputation would decrease the weight of the study for calculation of mean differences and would bias the effect estimate to no effect in case of a standardised mean difference (Higgins 2011).
For time‐to‐event outcomes, if the hazard ratio and the 95% confidence interval were not reported, we planned to obtain the logarithm of hazard ratios (ln(HR)) and the standard error (SE) of ln(HR) according to the methods described by Parmar 1998, using the Excel sheet provided by Tierney 2007.
Assessment of heterogeneity
We anticipated that major sources of clinical heterogeneity would be associated with different iron preparations (including different doses, frequencies and durations of administration), inclusion of different types of participants (blood loss, cancer, preoperative anaemia, chronic heart failure and autoimmune disorders) and use of erythropoietin as a co‐intervention. Methodological diversity (trials with low risk of bias vs trials with high risk of bias) may be another source of heterogeneity.
We explored heterogeneity within each meta‐analysis using a Chi2 test with significance set at a P value of 0.10, and we expressed the percentage of heterogeneity due to variation rather than to chance as I2 (Higgins 2002). We considered heterogeneity to be moderate if I2 > 50%. If considerable heterogeneity was noted (I2 > 80%), we did not perform a meta‐analysis.
Assessment of reporting biases
We used visual asymmetry on a funnel plot to explore reporting bias in the presence of at least 10 trials for the outcome (Egger 1997; Macaskill 2001). We used the linear regression approach described by Egger 1997 to determine funnel plot asymmetry. Selective reporting was also considered as evidence of reporting bias.
Data synthesis
We performed the meta‐analyses using the software package Review Manager version 5.2 (RevMan 2012) and in accordance with recommendations of theCochrane Handbook for Systematic Reviews of Interventions (Higgins 2011). We compared the results of a random‐effects model (DerSimonian 1986) versus those of a fixed‐effect model (DeMets 1987) to assess the effects of small studies. However, we reported the results of the random‐effects model. We planned to use the generic inverse variance method to pool (separately) hazard ratios, while carrying out separate analyses for short‐term (less than one year), medium‐term (longer than one year but less than three years) and long‐term follow‐up (longer than three years).
Similarly, for risk ratios, in the presence of cluster‐randomised trials, we planned to use generic inverse variance methods to pool unadjusted effect estimates calculated from simple parallel RCTs with effect estimates adjusted for cluster effect obtained from cluster RCTs.
For continuous outcomes, we pooled mean differences or standardised mean differences accordingly by using the inverse variance method. For the mean amount of blood transfused, we analysed separately trials using different methods of measurement of transfused blood (e.g. amount of blood transfused reported in millilitres, amount of blood transfused reported in units of blood transfusion).
Subgroup analysis and investigation of heterogeneity
We planned to perform the following subgroup analyses in the presence of at least two trials under at least two subgroups for the primary outcome (mortality).
-
Different iron preparations.
-
Different types of participants (blood loss, cancer, preoperative anaemia, chronic heart failure, autoimmune disorders and infectious disease).
-
Trials in which erythropoietin was used as a co‐intervention in both groups versus trials in which erythropoietin was not used as a co‐intervention.
We used the 'Test for subgroup differences' available in Review Manager software to identify differences between subgroups. A P value < 0.05 was considered statistically significant.
Because of the different iron preparations and dosage regimens used in different trials, we did not perform a subgroup analysis of different iron preparations.
Sensitivity analysis
We planned to perform a sensitivity analysis by excluding trials with unclear or high risk of bias for random sequence generation; unclear or high risk of bias due to lack of blinding of participants, healthcare providers or outcome assessors (for subjective outcomes such as proportion requiring blood transfusion, amount of blood transfused, quality of life, serious adverse events and length of hospital stay); and unclear or high risk of bias due to incomplete outcome data. However, all trials had at least one domain with unclear or high risk of bias.
We planned to perform a sensitivity analysis by imputing data for binary outcomes using various scenarios such as good outcome analysis, bad outcome analysis, best‐case scenario and worst‐case scenario (Gurusamy 2009), if more than 25% of data was missing. None of the trials met this criterion. We performed a sensitivity analysis by excluding trials in which the mean and the standard deviation were imputed in the presence of at least two trials for the outcome.
Summary of findings
We have presented the main results of the review in a ‘Summary of findings’ table. We included the following outcomes.
-
Risk of mortality.
-
Risk of requiring blood transfusion.
-
Mean difference in blood transfused.
-
Mean difference in haemoglobin levels.
-
Mean difference (or standardised mean difference if different scales are used) in quality of life.
-
Risk of serious adverse events.
We used GRADEpro software to prepare the 'Summary of findings' table. We will judge the overall quality of the evidence for each outcome as ‘high,’ ‘moderate,’ ‘low’ or ‘very low’ according to the GRADE (Grades of Recommendation, Assessment, Development and Evaluation) approach (Schünemann 2011). We considered the following.
-
Impact of risk of bias of individual trials.
-
Precision of pooled estimate.
-
Inconsistency or heterogeneity (clinical, methodological and statistical).
-
Indirectness of evidence.
-
Impact of selective reporting and publication bias on effect estimate.
Results
Description of studies
Results of the search
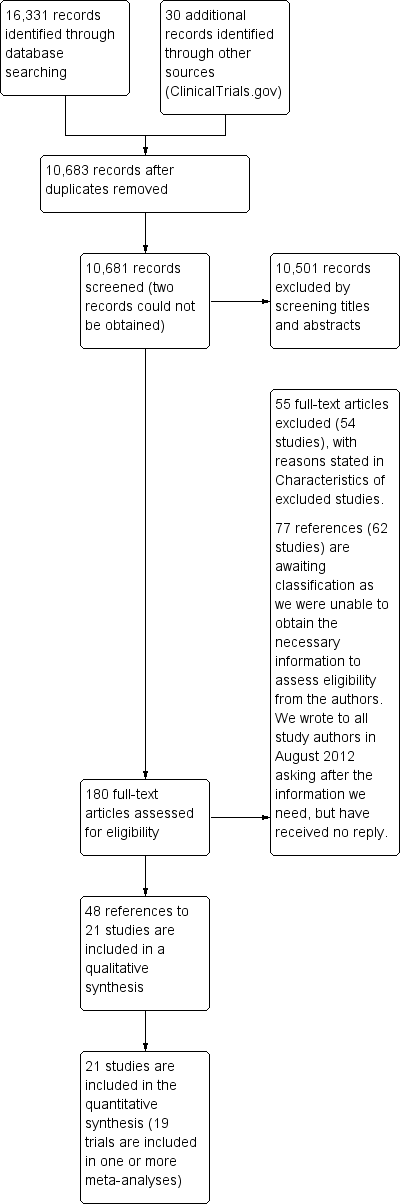
We identified a total of 16,331 references through electronic searches of the Cochrane Central Register of Controlled Trials (CENTRAL) (n = 1825), MEDLINE (n = 8473), EMBASE (n = 3661), Science Citation Index‐Expanded (n = 1042) and the Cumulative Index to Nursing and Allied Health Literature (CINAHL) Plus (n = 1330). From ClinicalTrials.gov, we identified 30 trials that potentially met the inclusion criteria. We have shown the flow of references in Figure 1. We excluded 5678 duplicates, then 10,501 clearly irrelevant references, by reading titles and abstracts. The full‐text copy of two references could not be obtained (Izuel‐Rami 2006; Kang 2006). Neither of these references is likely to provide additional information for the systematic review, but we are looking for them so we can be absolutely sure. We identified a further 82 references upon updating the searches on 24 November 2014; these references are awaiting classification.
Study flow diagram.
A total of 180 references were retrieved for further assessment. No references were identified by reference searching. Of 180 study reports retrieved in full text, we excluded 55 references (to 54 studies) for the reasons listed in the Characteristics of excluded studies table. In all, 77 references (62 studies including 30 potentially eligible trials identified from trial registers) are awaiting classification, as more information is required, although we contacted the authors of every study listed in August 2012. Although many of these studies mention that they were randomised, the method of allocation concealment was not stated, and because this is one of the inclusion criteria for our review, we cannot include these studies until further information is received. It was not clear whether many of the trials identified from the ClinicalTrials.gov register included participants with chronic kidney disease, children and pregnant or lactating women. People with these characteristics are excluded from this review.
In total, 48 publications describing 21 randomised trials fulfilled the inclusion criteria. All 21 randomised controlled trials provided quantitative data for this review, but only 19 trials could be included in the meta‐analysis. Data from two trials could not be included in a meta‐analysis, as there was no other similar study, but the results are shown on a forest plot (Evstatiev 2011; Hetzel 2012).
Included studies
Four trials compared oral iron with inactive control (Lidder 2007; Parker 2010; Pieracci 2009; Sutton 2004). Six trials compared parenteral iron versus inactive control (Anker 2009; Edwards 2009; Hedenus 2007; Karkouti 2006; Madi‐Jebara 2004; Vadhan‐Raj 2013). Two trials compared parenteral iron with standard practice, which consisted of oral iron or no intervention (Auerbach 2010; Bastit 2008). Four trials compared parenteral iron versus oral iron (Dangsuwan 2010; Lindgren 2009; Maccio 2010; Van Wyck 2009). Three trials compared parenteral iron, oral iron and inactive control (Abrahamsen 1965; Beck‐da‐Silva 2013; Steensma 2010). Two trials compared different preparations of intravenous iron (Evstatiev 2011; Hetzel 2012). None of the trials that compared different preparations of oral iron met all of the eligibility criteria of this review (allocation concealment at low risk of bias).
Participants
Overall, 4799 participants took part in the 21 trials included in this systematic review. The average age of participants in these trials ranged from 39 to 82 years in the trials that provided this information. The proportion of females ranged from 23.8% to 100% in the trials that provided this information. The proportion of postrandomisation dropouts ranged from 0% to 19.2%. After postrandomisation dropouts occurred, 4745 participants were included in the various analyses in this systematic review. Most of the trials included participants with mild to moderate anaemia and excluded participants who were allergic to iron therapy.
The clinical settings in the different included trials were blood loss (five trials) (Abrahamsen 1965; Karkouti 2006; Parker 2010; Sutton 2004; Van Wyck 2009); cancer (six trials) (Auerbach 2010; Bastit 2008; Dangsuwan 2010; Hedenus 2007; Maccio 2010; Steensma 2010); preoperative anaemia of varied aetiology (three trials) (Edwards 2009; Lidder 2007; Madi‐Jebara 2004); chronic heart failure (two trials) (Anker 2009; Beck‐da‐Silva 2013); autoimmune disorders (two trials) (Evstatiev 2011; Lindgren 2009); and others (three trials) (Hetzel 2012; Pieracci 2009; Vadhan‐Raj 2013). Further details of participants are shown in the Characteristics of included studies table and in Table 2.
|
Study name | Participant characteristics | Clinical setting | Co‐interventions | Routes and methods of administration of parenteral iron |
Comparison | |||||||||||
| Sample size (after postrandomisation dropouts) | Mean age (years) | Females | Postrandomisation dropouts | Blood loss conditions | Cancer | Preoperative | Chronic heart failure | Autoimmune | Miscellaneous | Added erythropoietin | Added oral iron | Parenteral iron—intravenous | Parenteral iron—intramuscular | Total dose infusion | ||
| 30 | Not stated | Not stated | 0 (0%) | Yes | No | No | No | No | No | No | Not applicable | No | Yes | No | Parenteral iron vs oral iron vs inactive control | |
| 158 | Not stated | Not stated | 0 (0%) | No | No | No | Yes | No | No | No | No | Yes | No | No | Parenteral iron vs inactive control | |
| 238 | 63 | 158 (66.4%) | 5 (2.1%) | No | Yes | No | No | No | No | Yes | Oral iron was allowed as part of standard treatment | Yes | No | No | Parenteral iron vs inactive control | |
| 396 | 61 | 240 (60.6%) | 2 (0.5%) | No | Yes | No | No | No | No | Yes | Oral iron was allowed as part of standard treatment | Yes | No | No | Parenteral iron vs inactive control | |
| 23 | 66 | 7 | Not stated | No | No | No | Yes | No | No | No | Not applicable | Yes | No | No | Parenteral iron vs oral iron vs inactive control | |
| 44 | 51 | 44 (100%) | 0 (0%) | No | Yes | No | No | No | No | No | Not applicable | Yes | No | No | Parenteral iron vs oral iron | |
| 18 | Not stated | Not stated | Not stated | No | No | Yes | No | No | No | No | No | Yes | No | No | Parenteral iron vs inactive control | |
| 483 | 39 | 284 (58.8%) | 2 (0.4%) | No | No | No | No | Yes | No | No | No | Yes | No | Yes | Different preparations | |
| 67 | 76 | 42 (62.7%) | 0 (0%) | No | Yes | No | No | No | No | Yes | No | Yes | No | No | Parenteral iron vs inactive control | |
| 605 | Not stated | Not stated | Not stated | No | No | No | No | No | Yes | No | No | Yes | No | No | Different preparations | |
| 21 | 62 | 5 (23.8%) | 5 (19.2%) | Yes | No | No | No | No | No | No | Yes | Yes | No | No | Parenteral iron vs inactive control | |
| 20 | Not stated | 9 (45%) | Not stated | No | No | Yes | No | No | No | No | Not applicable | Not applicable | Not applicable | Not applicable | Oral iron vs inactive control | |
| 91 | 42 | 63 (69.2%) | Not stated | No | No | No | No | Yes | No | No | Not applicable | Yes | No | No | Parenteral iron vs oral iron | |
| 148 | 68 | 59 (39.9%) | 0 (0%) | No | Yes | No | No | No | No | Yes | Not applicable | Yes | No | No | Parenteral iron vs oral iron | |
| 80 | Not stated | Not stated | 0 (0%) | No | No | Yes | No | No | No | No | No | Yes | No | No | Parenteral iron vs inactive control | |
| 300 | 82 | 245 (81.7%) | 0 (0%) | Yes | No | No | No | No | No | No | Not applicable | Not applicable | Not applicable | Not applicable | Oral iron vs inactive control | |
| 200 | 57 | 103 (51.5%) | 0 (0%) | No | No | No | No | No | Yes | No | Not applicable | Not applicable | Not applicable | Not applicable | Oral iron vs inactive control | |
| 490 | 64 | 320 (65.3%) | 12 (2.4%) | No | Yes | No | No | No | No | Yes | Not applicable | Yes | No | No | Parenteral iron vs oral iron vs inactive control | |
| 72 | 70 | 30 (41.7%) | Not stated | Yes | No | No | No | No | No | No | Not applicable | Not applicable | Not applicable | Not applicable | Oral iron vs inactive control | |
| 808 | 45 | 720 | 4 (0.5%) | No | No | No | No | No | Yes | No | No | Yes | No | No | Parenteral iron vs inactive control | |
| 453 | 39 | 453 (100%) | 24 (5%) | Yes | No | No | No | No | No | No | Not applicable | Yes | No | No | Parenteral iron vs oral iron | |
Intervention
Most trials used the intravenous route as the form of parenteral administration of iron. Intramuscular iron was used as parenteral iron in one trial (Abrahamsen 1965). Most trials using intravenous iron gave it as a divided dose (undiluted or diluted in normal saline). Total dose infusion was provided in one of the arms of one trial (Evstatiev 2011). Further details of interventions are given in the Characteristics of included studies table and in Table 2.
Control
The inactive control for the comparison between oral iron versus inactive control was oral placebo in two trials (Pieracci 2009; Sutton 2004). The inactive control for the comparison between intravenous iron versus inactive control was placebo in five trials (Anker 2009; Edwards 2009; Karkouti 2006; Madi‐Jebara 2004; Vadhan‐Raj 2013). One trial comparing intravenous iron, oral iron and inactive control used an intravenous placebo and an oral placebo, so that adequate blinding could be achieved (Beck‐da‐Silva 2013). Another trial comparing intravenous iron, oral iron and inactive control used a oral placebo to blind the comparison between oral iron and inactive control but used no intravenous placebo to blind the comparison between intravenous iron with oral iron and inactive control (Steensma 2010).
Co‐interventions
Supplementary erythropoietin was used in all arms of five trials (Auerbach 2010; Bastit 2008; Hedenus 2007; Maccio 2010; Steensma 2010). In the remaining trials, supplementary erythropoietin was not used for the participants included in this review. Supplementary oral iron was used as a co‐intervention in both arms of one trial comparing parenteral iron versus inactive control (Karkouti 2006). Supplementary oral iron was allowed as part of standard practice (i.e. investigators were allowed to continue their standard practice, and some participants in the control group received oral iron while others did not receive this, depending upon investigators' preference) in two trials comparing parenteral iron versus control (Auerbach 2010; Bastit 2008).
Excluded studies
Reasons for exclusion are shown in the Characteristics of excluded studies table.
Risk of bias in included studies
None of the included studies was of low risk of bias in every domain. Risk of bias in individual trials is shown in Figure 2, and the proportions of trials with low risk, unclear risk and high risk of bias in each of the domains are shown in Figure 3.

Risk of bias graph: review authors' judgements about each risk of bias item presented as percentages across all included studies. Twenty‐one studies are included in this review.
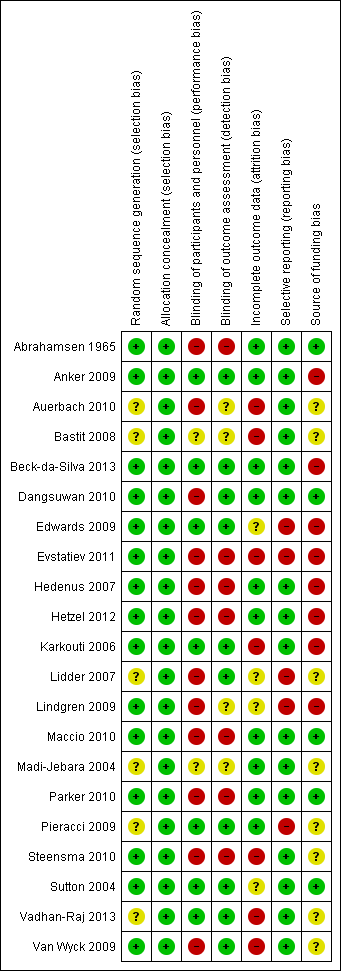
Risk of bias summary: review authors' judgements about each risk of bias item for each included study.
Allocation
Random sequence generation was adequate in 15 trials (Abrahamsen 1965; Anker 2009; Beck‐da‐Silva 2013; Dangsuwan 2010; Edwards 2009; Evstatiev 2011; Hedenus 2007; Hetzel 2012; Karkouti 2006; Lindgren 2009; Maccio 2010; Parker 2010; Steensma 2010; Sutton 2004; Van Wyck 2009). As trials that were at unclear or high risk of bias due to allocation concealment were excluded from the review, allocation concealment was adequate in all 21 trials. Overall, 15 trials were at low risk of selection bias (Abrahamsen 1965; Anker 2009; Beck‐da‐Silva 2013; Dangsuwan 2010; Edwards 2009; Evstatiev 2011; Hedenus 2007; Hetzel 2012; Karkouti 2006; Lindgren 2009; Maccio 2010; Parker 2010; Steensma 2010; Sutton 2004; Van Wyck 2009).
Blinding
Seven trials were free from performance bias and detection bias because of use of placebo and blinding of participants, healthcare providers and outcome assessors to the groups to which participants were randomly assigned (Anker 2009; Beck‐da‐Silva 2013; Edwards 2009; Karkouti 2006; Pieracci 2009; Sutton 2004; Vadhan‐Raj 2013).
Incomplete outcome data
No postrandomisation dropouts were reported in 10 trials; these trials were considered free from risk of attrition bias (Abrahamsen 1965; Anker 2009; Beck‐da‐Silva 2013; Dangsuwan 2010; Hedenus 2007; Hetzel 2012; Maccio 2010; Madi‐Jebara 2004; Parker 2010; Pieracci 2009).
Selective reporting
We were able to locate a published protocol for only one trial (Beck‐da‐Silva 2013). This trial reported the main outcomes of interest as stated in its protocol and was considered to be at low risk of selective outcome reporting bias. Fifteen trials reported mortality and serious adverse events, which are expected to be reported as per International Conference on Harmonisation (ICH)‐Good Clinical Practice (GCP) guidelines for clinical trials of pharmaceutical agents (ICH‐GCP 1996). These trials were considered at low risk of selective outcome reporting bias, and the remaining trials were considered at high risk of selective outcome reporting bias (Abrahamsen 1965; Anker 2009; Auerbach 2010; Bastit 2008; Dangsuwan 2010; Hedenus 2007; Hetzel 2012; Karkouti 2006; Maccio 2010; Madi‐Jebara 2004; Parker 2010; Steensma 2010; Sutton 2004; Vadhan‐Raj 2013; Van Wyck 2009).
Other potential sources of bias
Five trials were free from source of funding bias and were considered to be free from other potential sources of bias (Abrahamsen 1965; Dangsuwan 2010; Maccio 2010; Parker 2010; Sutton 2004).
Effects of interventions
See: Summary of findings for the main comparison Oral iron vs inactive control for anaemic patients; Summary of findings 2 Parenteral iron vs inactive control for anaemic patients; Summary of findings 3 Parenteral iron vs oral iron for anaemic patients
Although the risk of mortality at one year was the primary outcome for this review, only short‐term mortality was reported in all trials. None of the trials reported long‐term mortality; therefore hazard ratio was not calculated for any of the comparisons. All references to mortality indicate the risk ratio of short‐term mortality within one year, with mortality measured in most trials a few weeks after the start of therapy.
Oral iron versus inactive control
Results are summarised in summary of findings Table for the main comparison.
Mortality
Four trials reported this outcome (Abrahamsen 1965; Beck‐da‐Silva 2013; Parker 2010; Steensma 2010). No statistically significant differences in mortality were observed between oral iron and inactive control groups (RR 1.05, 95% CI 0.68 to 1.61; I2 = 0%; Chi2 test for heterogeneity P value 0.45) (Analysis 1.1). No significant change in results with use of the fixed‐effect model or the random‐effects model would have changed the conclusions.
Blood transfusion requirements
Three trials reported the proportions of participants who required blood transfusion (Lidder 2007; Pieracci 2009; Steensma 2010). The proportion of participants who required blood transfusion was statistically significantly lower in the oral iron group than in the inactive control group when the random‐effects model was used (RR 0.74, 95% CI 0.55 to 0.99; I2 = 0%; Chi2 test for heterogeneity P value 0.57) (Analysis 1.2). No statistically significant differences were noted in the proportions of participants who required blood transfusion when the fixed‐effect model was used (RR 0.76, 95% CI 0.56 to 1.02).
None of the trials reported mean blood transfused.
Haemoglobin levels
Four trials reported haemoglobin levels. Three trials reported final haemoglobin levels (Beck‐da‐Silva 2013; Parker 2010; Sutton 2004) and one trial reported change in haemoglobin (Abrahamsen 1965). As considerable heterogeneity was noted (I2 = 89%), we did not perform the meta‐analysis (Analysis 1.4). The point estimate of the mean difference in haemoglobin levels in individual studies ranged from 0.3 to 3.1 g/dL higher in the oral iron group than in the inactive control group (Analysis 1.4).
Mean or standard deviation or both were imputed in two trials (Abrahamsen 1965; Sutton 2004), but we did not perform a sensitivity analysis, as a meta‐analysis was not performed.
Quality of life
One trial (Steensma 2010) used the Fatigue Linear Analog Scale Assessment (LASA) (Steensma 2010). No statistically significant difference in quality of life was noted between oral iron and inactive control groups (SMD 0.13, 95% CI ‐0.10 to 0.37) (Analysis 1.5).
Serious adverse events
Five trials reported this outcome (Abrahamsen 1965; Beck‐da‐Silva 2013; Parker 2010; Steensma 2010; Sutton 2004), and no serious adverse events were observed in either group in four trials (Abrahamsen 1965; Beck‐da‐Silva 2013; Parker 2010; Sutton 2004). No statistically significant differences in serious adverse events were noted between oral iron and inactive control groups in the remaining trial (Steensma 2010) (RR 0.96, 95% CI 0.76 to 1.22) (Analysis 1.6). Adverse events related to oral iron included nausea, diarrhoea or constipation; most reported cases were mild.
Length of hospital stay
One trial (Parker 2010) found no statistically significant difference in length of hospital stay between the two groups (MD ‐2.50 days, 95% CI ‐6.82 to 1.82).
Subgroup analysis (primary outcome)
Subgroup analysis was not possible, as a minimum of two trials is needed.
Sensitivity analysis
No imputation of mean or standard deviation was performed for length of hospital stay or quality of life.
Reporting bias
As fewer than 10 trials provided information for each of the outcomes under this comparison, we did not explore reporting bias using a funnel plot.
Parenteral iron versus inactive control
Results are summarised in summary of findings Table 2.
Mortality
Ten trials reported mortality (Abrahamsen 1965; Anker 2009; Auerbach 2010; Bastit 2008; Beck‐da‐Silva 2013; Hedenus 2007; Karkouti 2006; Madi‐Jebara 2004; Steensma 2010; Vadhan‐Raj 2013). No statistically significant differences in mortality were observed between parenteral iron and inactive control groups (RR 1.04, 95% CI 0.63 to 1.69; I2 = 8%; Chi2 test for heterogeneity P value 0.37) (Analysis 2.1). The conclusions are not changed with use of the fixed‐effect model or the random‐effects model.
Blood transfusion requirements
Eight trials reported the proportions of participants who required blood transfusion (Anker 2009; Auerbach 2010; Bastit 2008; Edwards 2009; Hedenus 2007; Karkouti 2006; Madi‐Jebara 2004; Steensma 2010). No statistically significant differences were noted in the proportions of participants who required blood transfusion between parenteral iron and inactive control groups (RR 0.84, 95% CI 0.66 to 1.06; I2 = 0%; Chi2 test for heterogeneity P value 0.67) (Analysis 2.2). No significant change in results with use of the fixed‐effect model or the random‐effects model would have changed the conclusions.
No trials reported the amount of blood transfused.
Haemoglobin levels
Eight trials reported haemoglobin levels. Six trials reported final haemoglobin levels (Anker 2009; Beck‐da‐Silva 2013; Edwards 2009; Hedenus 2007; Karkouti 2006; Madi‐Jebara 2004) and three trials reported change in haemoglobin from the baseline measurement (Abrahamsen 1965; Auerbach 2010; Vadhan‐Raj 2013). As considerable heterogeneity was noted (I2 = 95%), we did not perform the meta‐analysis (Analysis 2.3). The point estimate of the mean difference in haemoglobin levels in individual studies ranged from 0.3 to 3.0 g/dL higher in the parenteral iron group than in the inactive control group (Analysis 2.3).
Mean or standard deviation or both were imputed in two trials (Abrahamsen 1965; Hedenus 2007), but we did not perform a sensitivity analysis, as a meta‐analysis was not performed.
Quality of life
Four trials reported on quality of life (Anker 2009; Bastit 2008; Steensma 2010; Vadhan‐Raj 2013). The scales used were self‐reported Patient Global Assessment (Anker 2009), Functional Assessment of Cancer Therapy‐Fatigue (FACT‐F) (Bastit 2008), Fatigue Linear Analog Scale Assessment (LASA) (Steensma 2010) and Functional Assessment of Chronic Illness Therapy Fatigue (FACITFatigue) (Vadhan‐Raj 2013). As considerable heterogeneity was noted (I2 = 81%), we did not perform the meta‐analysis. Statistical heterogeneity was high (I2 = 81%). The point estimate of the standardised mean difference in quality of life in individual studies ranged from 0.04 lower to 0.44 higher in the parenteral iron group than in the inactive control group (Analysis 2.4). No mean or standard deviation for quality of life was imputed.
Serious adverse events
Seven trials provided information on serious adverse events (Abrahamsen 1965; Anker 2009; Bastit 2008; Beck‐da‐Silva 2013; Hedenus 2007; Steensma 2010; Vadhan‐Raj 2013). No statistically significant differences in serious adverse events were noted between parenteral iron and inactive control groups (RR 1.00, 95% CI 0.74 to 1.34; I2 = 25%; Chi2 test for heterogeneity P value 0.25) (Analysis 2.5). None of the trials reported severe allergic reactions due to parenteral iron, suggesting that these are rare. No significant change in results with use of the fixed‐effect model or the random‐effects model would have changed the conclusions.
Length of hospital stay
This outcome was not reported in any of the trials.
Subgroup analysis
The test for subgroup differences was not statistically significant for subgroup analysis based on clinical setting or for erythropoietin use (P values of 0.93 and 0.34, respectively) (Analysis 5.1; Analysis 5.2).
Sensitivity analysis
In one of the trials included in this comparison, some participants in the control group received oral iron based on investigators' preference (Bastit 2008). No important change was noted in interpretation of results for comparisons for which meta‐analysis was performed after this trial was excluded. This was a post hoc sensitivity analysis.
Reporting bias
As fewer than 10 trials provided information for each of the outcomes under this comparison, we did not explore reporting bias by funnel plot.
Parenteral iron versus oral iron
Results are summarised in summary of findings Table 3.
Mortality
Six trials reported mortality (Abrahamsen 1965; Beck‐da‐Silva 2013; Dangsuwan 2010; Maccio 2010; Steensma 2010; Van Wyck 2009). No statistically significant differences in mortality between parenteral iron and oral iron groups were reported (RR 1.49, 95% CI 0.56 to 3.94; I2 = 0%; Chi2 test for heterogeneity P value 0.52) (Analysis 3.1). No significant change in results with use of the fixed‐effect model or the random‐effects model would have changed the conclusions.
Blood transfusion requirements
Two trials reported the proportions of participants who required blood transfusion (Dangsuwan 2010; Steensma 2010). No statistically significant differences between parenteral iron and oral iron were noted in the proportions of participants who required blood transfusion (RR 0.61, 95% CI 0.24 to 1.58; I2 = 72%; Chi2 test for heterogeneity P value 0.06) (Analysis 3.2). No significant change in results with use of the fixed‐effect model or the random‐effects model would have changed the conclusions.
Only one trial reported mean blood transfused (Dangsuwan 2010). Mean blood transfused was statistically significantly less in the parenteral iron group than in the oral iron groups (MD ‐0.54 units, 95% CI ‐0.96 to ‐0.12) (Analysis 3.3). No mean or standard deviation for quantity of blood transfused was imputed.
Haemoglobin levels
Six trials reported haemoglobin levels. Three trials reported final haemoglobin levels (Beck‐da‐Silva 2013; Dangsuwan 2010; Lindgren 2009) and three trials reported change in haemoglobin (Abrahamsen 1965; Maccio 2010; Van Wyck 2009). Haemoglobin levels were statistically significantly higher with parenteral iron than with oral iron (MD ‐0.50 g/dL, 95% CI ‐0.73 to ‐0.27; I2 = 0%; Chi2 test for heterogeneity P value 0.53) (Analysis 3.4). Negative signs ensured that better outcomes in intervention were shown when the summary estimate was to the left of the line of no effect. No significant change in results with use of the fixed‐effect model or the random‐effects model would have changed the conclusions. Mean or standard deviation or both were imputed in two trials (Abrahamsen 1965; Lindgren 2009). Excluding these trials did not alter the point estimate, nor did it change the statistical significance, although confidence intervals became wider (i.e. the results became less precise; MD ‐0.49 g/dL, 95% CI ‐0.86 to ‐0.12).
Quality of life
Three trials reported on quality of life (Dangsuwan 2010; Steensma 2010; Van Wyck 2009). The scales used were Functional Assessment of Cancer Therapy–Anemia (Fact‐An) (Dangsuwan 2010), Short‐Form 36 (SF‐36) (Van Wyck 2009) and Fatigue Linear Analog Scale Assessment (LASA) (Steensma 2010). No statistically significant differences in quality of life were observed between parenteral iron and oral iron groups (SMD ‐0.02, 95% CI ‐0.16 to 0.13; I2 = 0%; Chi2 test for heterogeneity P value 0.47) (Analysis 3.5). No significant change in results with use of the fixed‐effect model or the random‐effects model would have changed the conclusions. No mean or standard deviation for quality of life was imputed.
Serious adverse events
Seven trials reported serious adverse events (Abrahamsen 1965; Beck‐da‐Silva 2013; Dangsuwan 2010; Lindgren 2009; Maccio 2010; Steensma 2010; Van Wyck 2009). No statistically significant differences in serious adverse events between parenteral iron and oral iron groups were reported (RR 1.23, 95% CI 0.99 to 1.54; I2 = 0%; Chi2 test for heterogeneity P value 0.57) (Analysis 3.6). No trials reported severe allergic reactions due to parenteral iron, suggesting that these are rare. Adverse events related to oral iron treatment included effects such as nausea, diarrhoea or constipation; most cases were mild. No significant change in results with use of the fixed‐effect model or the random‐effects model would have changed the conclusions.
Length of hospital stay
This outcome was not reported in any of the trials.
Subgroup analysis
Subgroup differences were not statistically significant for subgroup analysis based on clinical setting (P value 0.52) (Analysis 5.3)—the only subgroup analysis with at least two subgroups and at least two trials.
Reporting bias
As fewer than 10 trials provided information for each of the outcomes under this comparison, we did not explore reporting bias using a funnel plot.
Iron: different preparations
Mortality
Only one trial reported mortality (Hetzel 2012). This trial compared two intravenous iron preparations (ferrumoxytol vs iron sucrose) and reported no statistically significant differences in mortality between the two intravenous iron preparations (RR 1.47, 95% CI 0.06 to 36.03) (Analysis 4.1).
Blood transfusion requirements
None of the trials reported the proportions of participants who required blood transfusion or mean blood transfused.
Haemoglobin levels
Both trials—one comparing intravenous ferric carboxymaltose versus intravenous iron sucrose (Evstatiev 2011) and one comparing intravenous ferric carboxymaltose versus intravenous iron sucrose (Hetzel 2012)—reported haemoglobin levels. Both trials reported final haemoglobin levels. No statistically significant differences in haemoglobin levels were reported for either comparison (MD ‐0.20 g/dL, 95% CI ‐0.68 to 0.28, and MD ‐0.30 g/dL, 95% CI ‐1.11 to 0.51, respectively) (Analysis 4.2). No mean or standard deviation was imputed for these two trials.
Quality of life
No trials reported this outcome.
Serious adverse events
Two trials—one comparing intravenous ferric carboxymaltose versus intravenous iron sucrose (Evstatiev 2011) and one comparing intravenous ferric carboxymaltose versus intravenous iron sucrose (Hetzel 2012)—reported serious adverse events. One participant with serious adverse events was described in the intravenous carboxymaltose group, and no serious adverse events were reported in the intravenous iron sucrose group (Evstatiev 2011). This difference was not statistically significant (Analysis 4.3). No statistically significant differences in the proportions of participants who developed serious adverse events were noted in the comparison between intravenous ferrumoxytol and iron sucrose (RR 1.67, 95% CI 0.62 to 4.45) (Analysis 4.3).
Length of hospital stay
Length of hospital stay was not reported for any of the trials.
Subgroup analysis
Subgroup analysis was not possible because too few trials were included under each comparison.
Reporting bias
As fewer than 10 trials provided information for each of the outcomes under each comparison, we did not explore reporting bias by funnel plot.
Discussion
Summary of main results
In this systematic review, we examined the utility of iron therapy in the treatment of individuals with anaemia (non‐peripartal anaemic adults without chronic kidney disease). We compared parenteral iron versus oral iron; parenteral iron versus inactive control; oral iron versus inactive control and different iron preparations. Most trials included participants with mild to moderate anaemia.
In these participants, haemoglobin levels were statistically significantly higher among participants receiving parenteral iron than among those who received oral iron or inactive control. However these trials demonstrate no clinical benefit in terms of mortality, proportions of participants requiring blood transfusion or quality of life—outcomes that would determine whether an intervention could be recommended routinely. Although the mean blood transfused was less in the parenteral iron group than in the oral iron group, only one trial reported this outcome (Dangsuwan 2010).
Advantages gained as a result of iron therapy for clinical outcomes such as mortality, quality of life or blood transfusion requirements must be balanced against adverse events. No statistically significant differences were reported among proportions of participants who developed serious adverse events as a result of parenteral iron therapy. According to the Food and Drug Administration (FDA) database, on average, four major or serious adverse events have been reported for every one million units (one unit is equivalent to 100 mg of iron, otherwise called 100 mg dose equivalent) of iron sucrose sold in the USA (Bailie 2012). Serious and major adverse events reported for other intravenous iron preparations from this database include 184 per million units for ferumoxytol; 10 per million units for sodium ferric gluconate; and 27 per million units for iron dextran (Bailie 2012). Most trials reporting serious adverse events found no allergic or anaphylactic reactions or serious reactions, suggesting that these are rare.
No justification is apparent for routine use of parenteral iron in the absence of significant clinical benefit, as merely an improvement in haemoglobin level (with no clinical improvement or benefit) is not a reason for iron therapy.
Comparisons between oral iron and inactive control again revealed no clinical benefit in terms of mortality and quality of life. A statistically significant reduction in the proportion of participants who required blood transfusion was reported among those who received oral iron therapy as compared with those who received no iron therapy. No statistically significant differences in the proportions of participants who developed serious adverse events as a result of oral iron therapy were reported. Adverse events related to oral iron therapy were gastrointestinal side effects such as nausea, diarrhoea or constipation; most cases were mild. Although the balance of benefits and harms of oral iron therapy appear to favour routine oral iron therapy in anaemic people, the quality of evidence is very low, as is shown in summary of findings Table for the main comparison.
Eleven studies compared different preparations or regimens of oral iron (Adsul 2005; Black 1981; Chen 2002; Devasthali 1991; Ferrari 2012; Gordeuk 1987; Jacobs 2000; Langstaff 1993; Li 2005; Mimura 2008; Pedrazzoli 1988). Although these studies were stated to be randomised controlled trials, study authors did not report the method of allocation concealment used; therefore we could not be sure whether they were randomised controlled trials. Thus no trials that compared different oral iron preparations are included in this review. No significant clinical benefits of one intravenous iron preparation over another were revealed in the two comparisons included in this review. Thus, little evidence is available on which one preparation or regimen can be recommended over another.
Various subgroup analyses were performed to determine whether iron would be useful in specific clinical situations, or whether iron therapy might be useful in people receiving erythropoietin. Trials included under each of these subgroups were few, and the results were not consistent; therefore we were not able to determine whether iron therapy might be useful in any specific situation.
Overall completeness and applicability of evidence
This review is applicable only for non‐pregnant and non‐lactating anaemic adults without chronic kidney disease who have mild to moderate anaemia. It should be noted that most trials excluded participants who were allergic to iron therapy and measured ferritin and transferrin levels to ensure that participants had iron deficiency anaemia. Iron therapy should be provided only after appropriate medical consultation.
Quality of the evidence
Overall, the quality of evidence was very low as indicated in summary of findings Table 3summary of findings Table 2 and summary of findings Table for the main comparison. Many trials did not report important clinical outcomes, although it is likely that such clinical outcomes were measured. This has resulted in assignment of high risk of selective outcome reporting bias. Overall, the quality of evidence was very low for measured outcomes, most often because of high risk of bias, imprecision and inconsistency.
Potential biases in the review process
We searched most of the medical literature databases. We did not search trial registers except ClinicalTrials.gov, as the search resulted in over sixteen thousand references, making it impossible to complete a review for which the searches are current. The main purpose of searching trial registers is to identify any trial that was not reported in the medical literature because of trial results. However, we did not find significant clinical benefit in most comparisons. It should be noted that we did not restrict the articles by language of publication or by whether trials were reported in full text, decreasing the possibility of reporting bias. Two review authors went through the lists of articles independently and extracted data independently to minimise the risk of missing any trials and outcomes reported in the trial reports.
We imputed mean and standard deviation when these were not available. This could have introduced bias. However, no evidence suggested such a bias, as exclusion of these trials did not alter the results significantly. It must be noted that the alternative to this imputation is exclusion of such trials or use of a table to report study results; selection of this option would have resulted in even greater bias and difficulty in interpreting data.
Agreements and disagreements with other studies or reviews
This is the first systematic review for non‐pregnant and non‐lactating anaemic adults without chronic kidney disease. We agree with the trial authors who did not recommend routine intravenous iron. We agree with Lee et al, who suggest that improvement in haemoglobin with intravenous iron versus oral iron is of uncertain clinical significance in people with inflammatory bowel disease (Lee 2012). We do not agree with the suggestion of an important role for intravenous iron supplementation in people with cancer, as provided by Baribeault et al (Baribeault 2011). More recently, a systematic review was published that included all trials in which intravenous iron was compared with oral iron or no iron therapy, irrespective of the clinical setting (Litton 2013). Our findings are broadly similar to the findings of that review, which indicated that intravenous iron increased haemoglobin levels and decreased transfusion requirements. That systematic review reported increased infective complications with intravenous iron. Our review found no significant differences among serious adverse events. However, confidence intervals were wide; therefore the results that we identified might have been due to lack of evidence of effect rather than to lack of effect. We disagree with the authors of the other systematic review that intravenous iron might have broad applicability for many patients in hospital, among whom anaemia is common (Litton 2013), but we agree with the editorial that accompanied this article, which suggests that use of intravenous iron should not be adopted widely until further evaluation (McIntyre 2013).

Study flow diagram.

Risk of bias graph: review authors' judgements about each risk of bias item presented as percentages across all included studies. Twenty‐one studies are included in this review.

Risk of bias summary: review authors' judgements about each risk of bias item for each included study.
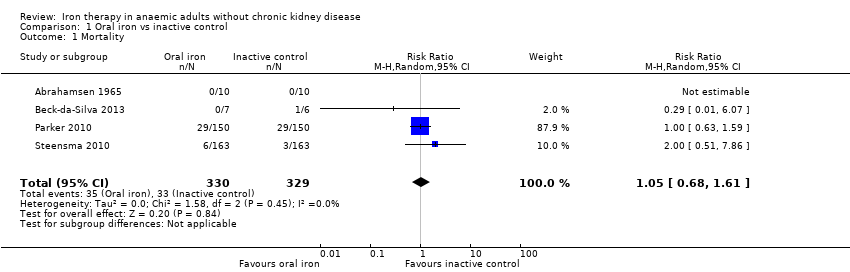
Comparison 1 Oral iron vs inactive control, Outcome 1 Mortality.

Comparison 1 Oral iron vs inactive control, Outcome 2 Proportion requiring blood transfusion.
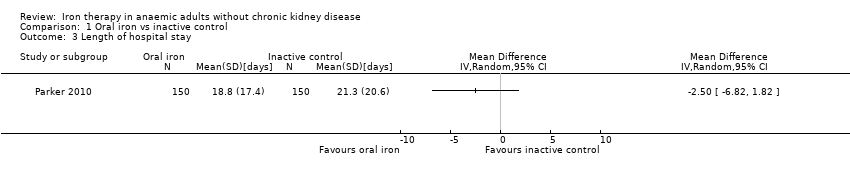
Comparison 1 Oral iron vs inactive control, Outcome 3 Length of hospital stay.

Comparison 1 Oral iron vs inactive control, Outcome 4 Haemoglobin.
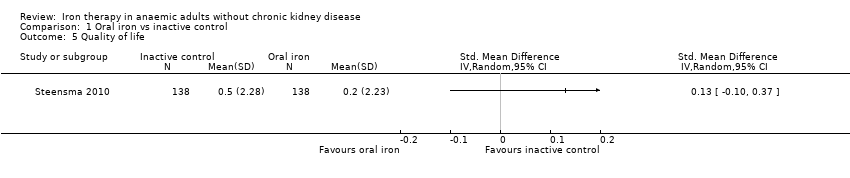
Comparison 1 Oral iron vs inactive control, Outcome 5 Quality of life.

Comparison 1 Oral iron vs inactive control, Outcome 6 Serious adverse events.

Comparison 2 Parenteral iron vs inactive control, Outcome 1 Mortality.
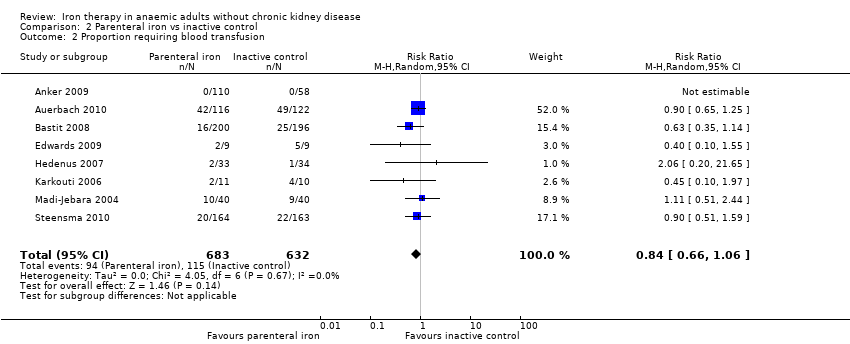
Comparison 2 Parenteral iron vs inactive control, Outcome 2 Proportion requiring blood transfusion.
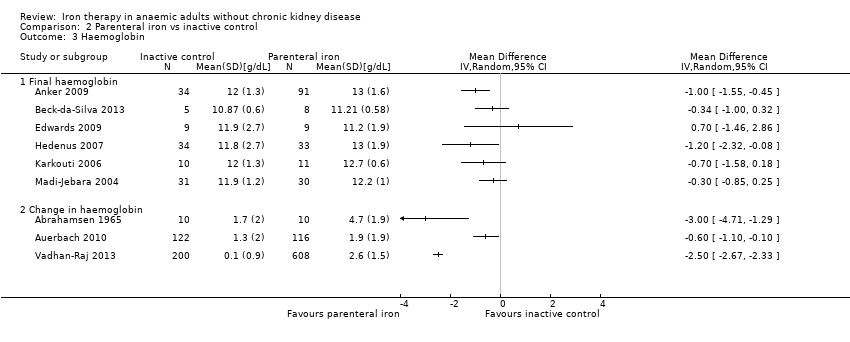
Comparison 2 Parenteral iron vs inactive control, Outcome 3 Haemoglobin.

Comparison 2 Parenteral iron vs inactive control, Outcome 4 Quality of life.

Comparison 2 Parenteral iron vs inactive control, Outcome 5 Serious adverse events.

Comparison 3 Parenteral iron vs oral iron, Outcome 1 Mortality.

Comparison 3 Parenteral iron vs oral iron, Outcome 2 Proportion requiring blood transfusion.
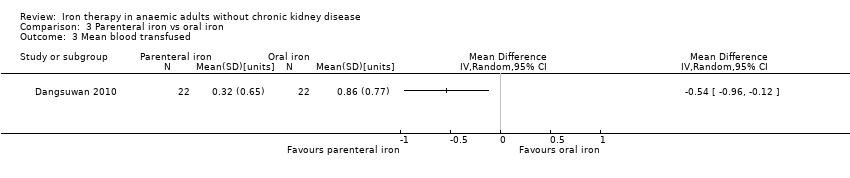
Comparison 3 Parenteral iron vs oral iron, Outcome 3 Mean blood transfused.
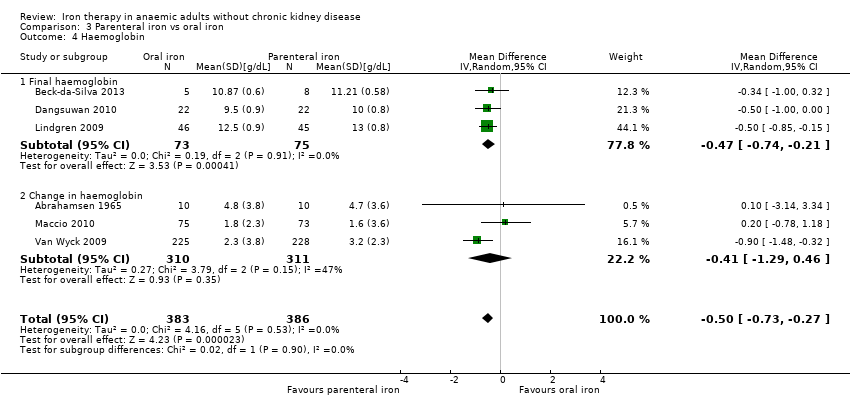
Comparison 3 Parenteral iron vs oral iron, Outcome 4 Haemoglobin.
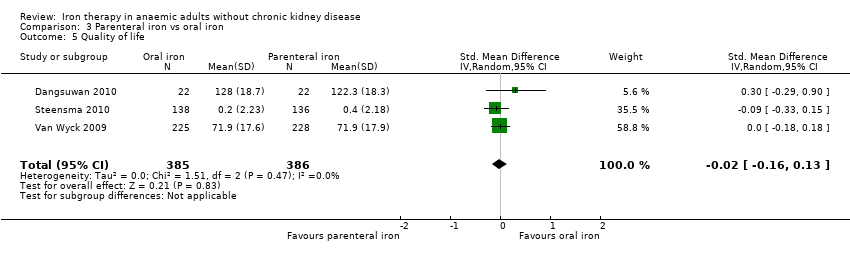
Comparison 3 Parenteral iron vs oral iron, Outcome 5 Quality of life.
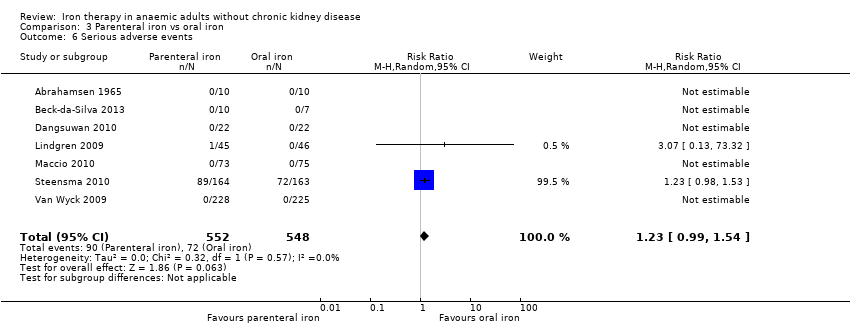
Comparison 3 Parenteral iron vs oral iron, Outcome 6 Serious adverse events.
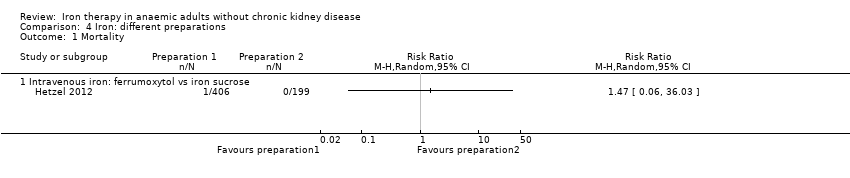
Comparison 4 Iron: different preparations, Outcome 1 Mortality.
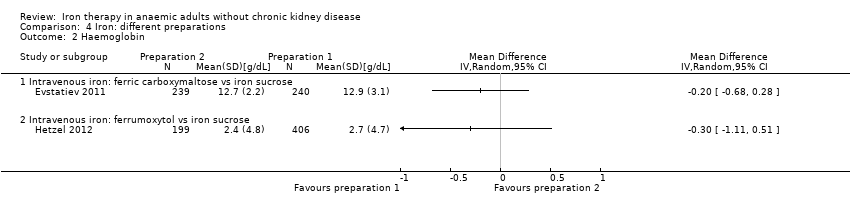
Comparison 4 Iron: different preparations, Outcome 2 Haemoglobin.
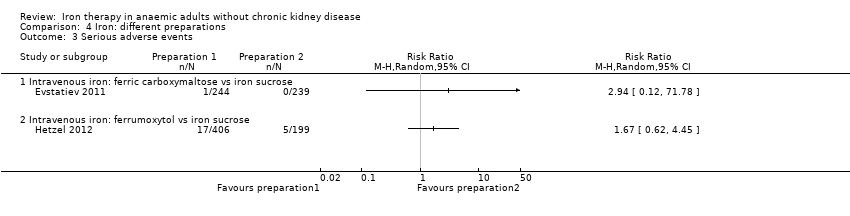
Comparison 4 Iron: different preparations, Outcome 3 Serious adverse events.
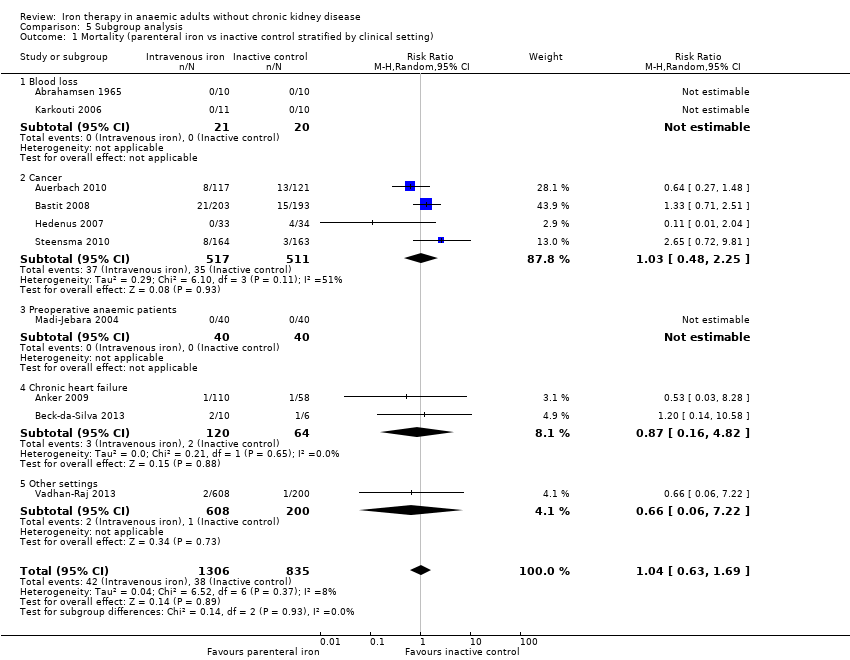
Comparison 5 Subgroup analysis, Outcome 1 Mortality (parenteral iron vs inactive control stratified by clinical setting).
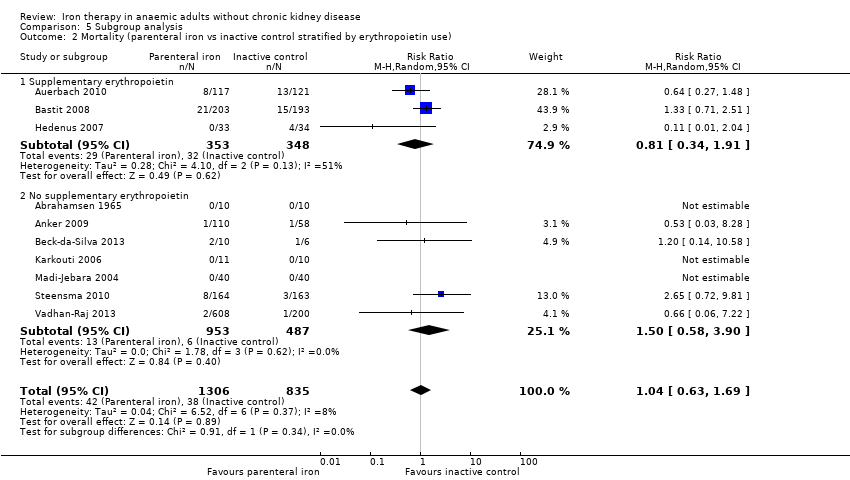
Comparison 5 Subgroup analysis, Outcome 2 Mortality (parenteral iron vs inactive control stratified by erythropoietin use).
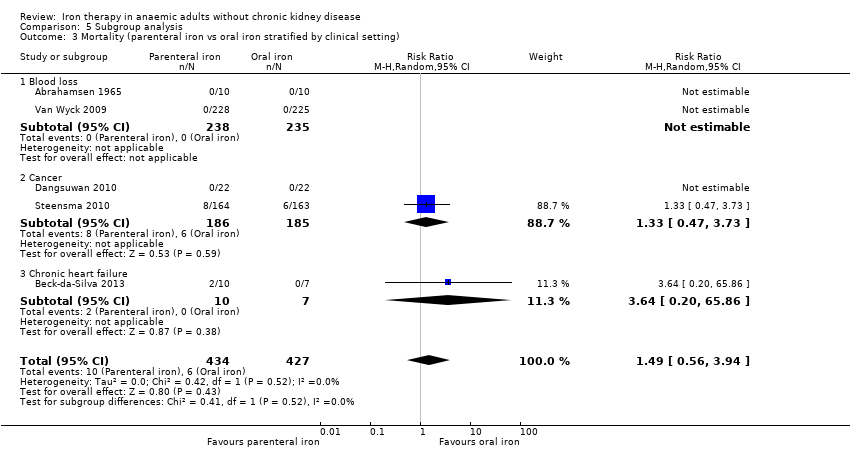
Comparison 5 Subgroup analysis, Outcome 3 Mortality (parenteral iron vs oral iron stratified by clinical setting).
| Oral iron vs inactive control for anaemic patients | |||||
| Patient or population: patients with anaemia | |||||
| Outcomes | Illustrative comparative risks* (95% CI) | Relative effect | Number of participants | Quality of the evidence | |
| Assumed risk | Corresponding risk | ||||
| Inactive control | Oral iron | ||||
| Mortality | 100 per 1000 | 105 per 1000 (68 to 161) | RR 1.05 (0.68 to 1.61) | 659 | ⊕⊝⊝⊝ |
| Proportion requiring blood transfusion | 279 per 1000 | 206 per 1000 | RR 0.74 | 546 | ⊕⊝⊝⊝ |
| Length of hospital stay | Mean hospital stay in control groups was | Mean hospital stay in intervention groups was | 300 | ⊕⊝⊝⊝ | |
| Haemoglobin | Mean haemoglobin in control groups ranged between 11.4 g/dL and 12.4 g/dL | Point estimate of haemoglobin in intervention groups in the individual studies was 0.30 to 3.10 higher | 402 | ⊕⊝⊝⊝ | |
| Quality of life | ‐ | Mean quality of life in intervention groups was | 276 | ⊕⊝⊝⊝ | |
| Serious adverse events | 205 per 1000 | 197 per 1000 | RR 0.96 (0.76 to 1.22) | 731 | ⊕⊝⊝⊝ |
| *The basis for the assumed risk is the average risk among controls. The corresponding risk (and its 95% confidence interval) is based on assumed risk in the comparison group and the relative effect of the intervention (and its 95% CI). | |||||
| GRADE Working Group grades of evidence. | |||||
| aTrial(s) reporting this outcome was/were at high risk of bias. | |||||
| Parenteral iron vs inactive control for anaemic patients | |||||
| Patient or population: patients with anaemia | |||||
| Outcomes | Illustrative comparative risks* (95% CI) | Relative effect | Number of participants | Quality of the evidence | |
| Assumed risk | Corresponding risk | ||||
| Inactive control | Parenteral iron | ||||
| Mortality | 46 per 1000 | 47 per 1000 | RR 1.04 (0.63 to 1.69) | 2141 | ⊕⊝⊝⊝ |
| Proportion requiring blood transfusion | 182 per 1000 | 153 per 1000 | RR 0.84 (0.66 to 1.06) | 1315 | ⊕⊝⊝⊝ |
| Haemoglobin | Mean haemoglobin in control groups ranged between 11.2 g/dL and 13.0 g/dL | The point estimate of haemoglobin in intervention groups in the individual studies was from 0.30 to 3.00 higher | 1371 | ⊕⊝⊝⊝ | |
| Quality of life | ‐ | The point estimate of haemoglobin in intervention groups in the individual studies was between 0.04 standard deviations lower and 0.44 standard deviations higher | 1629 | ⊕⊝⊝⊝ | |
| Serious adverse events | 184 per 1000 | 184 per 1000 | RR 1 (0.74 to 1.34) | 1802 | ⊕⊝⊝⊝ |
| *The basis for the assumed risk is the average risk among controls. The corresponding risk (and its 95% confidence interval) is based on assumed risk in the comparison group and the relative effect of the intervention (and its 95% CI). | |||||
| GRADE Working Group grades of evidence. | |||||
| aTrial(s) reporting this outcome was/were at high risk of bias. | |||||
| Parenteral iron vs oral iron for anaemic patients | ||||||
| Patient or population: patients with anaemia | ||||||
| Outcomes | Illustrative comparative risks* (95% CI) | Relative effect | Number of participants | Quality of the evidence | Comments | |
| Assumed risk | Corresponding risk | |||||
| Oral iron | Parenteral iron | |||||
| Mortality | 12 per 1000 | 18 per 1000 | RR 1.49 (0.56 to 3.94) | 1009 | ⊕⊝⊝⊝ | |
| Proportion requiring blood transfusion | 189 per 1000 | 115 per 1000 | RR 0.61 (0.24 to 1.58) | 371 | ⊕⊝⊝⊝ | |
| Mean blood transfused | Mean mean blood transfused in control groups was | Mean blood transfused in intervention groups was | 44 | ⊕⊝⊝⊝ | ||
| Haemoglobin | Mean haemoglobin in control groups was between | Mean haemoglobin in intervention groups was | 769 | ⊕⊕⊝⊝ | ||
| Quality of life | ‐ | Mean quality of life in intervention groups was | 771 | ⊕⊝⊝⊝ | SMD 0.09 (‐0.04 to 0.22) | |
| Serious adverse events | 131 per 1000 | 162 per 1000 | RR 1.23 (0.99 to 1.54) | 1100 | ⊕⊝⊝⊝ | |
| *The basis for the assumed risk is average risk among controls. The corresponding risk (and its 95% confidence interval) is based on assumed risk in the comparison group and the relative effect of the intervention (and its 95% CI). | ||||||
| GRADE Working Group grades of evidence. | ||||||
| aTrial(s) reporting this outcome was/were at high risk of bias. | ||||||
| Group characteristics | Haemoglobin | Haematocrit | Haematocrit |
| Children (6 months to 59 months) | 110 | 6.83 | 0.33 |
| Children (5 to 11 years) | 115 | 7.13 | 0.34 |
| Children (12 to 14 years) | 120 | 7.45 | 0.36 |
| Non‐pregnant women (over 15 years of age) | 120 | 7.45 | 0.36 |
| Pregnant women | 110 | 6.83 | 0.33 |
| Men (over 15 years of age) | 130 | 8.07 | 0.39 |
| aHaematocrit is the volume of packed red blood cells expressed in terms of fraction or percentages in a whole blood specimen (NCBI‐Hematocrit). | |||
|
Study name | Participant characteristics | Clinical setting | Co‐interventions | Routes and methods of administration of parenteral iron |
Comparison | |||||||||||
| Sample size (after postrandomisation dropouts) | Mean age (years) | Females | Postrandomisation dropouts | Blood loss conditions | Cancer | Preoperative | Chronic heart failure | Autoimmune | Miscellaneous | Added erythropoietin | Added oral iron | Parenteral iron—intravenous | Parenteral iron—intramuscular | Total dose infusion | ||
| 30 | Not stated | Not stated | 0 (0%) | Yes | No | No | No | No | No | No | Not applicable | No | Yes | No | Parenteral iron vs oral iron vs inactive control | |
| 158 | Not stated | Not stated | 0 (0%) | No | No | No | Yes | No | No | No | No | Yes | No | No | Parenteral iron vs inactive control | |
| 238 | 63 | 158 (66.4%) | 5 (2.1%) | No | Yes | No | No | No | No | Yes | Oral iron was allowed as part of standard treatment | Yes | No | No | Parenteral iron vs inactive control | |
| 396 | 61 | 240 (60.6%) | 2 (0.5%) | No | Yes | No | No | No | No | Yes | Oral iron was allowed as part of standard treatment | Yes | No | No | Parenteral iron vs inactive control | |
| 23 | 66 | 7 | Not stated | No | No | No | Yes | No | No | No | Not applicable | Yes | No | No | Parenteral iron vs oral iron vs inactive control | |
| 44 | 51 | 44 (100%) | 0 (0%) | No | Yes | No | No | No | No | No | Not applicable | Yes | No | No | Parenteral iron vs oral iron | |
| 18 | Not stated | Not stated | Not stated | No | No | Yes | No | No | No | No | No | Yes | No | No | Parenteral iron vs inactive control | |
| 483 | 39 | 284 (58.8%) | 2 (0.4%) | No | No | No | No | Yes | No | No | No | Yes | No | Yes | Different preparations | |
| 67 | 76 | 42 (62.7%) | 0 (0%) | No | Yes | No | No | No | No | Yes | No | Yes | No | No | Parenteral iron vs inactive control | |
| 605 | Not stated | Not stated | Not stated | No | No | No | No | No | Yes | No | No | Yes | No | No | Different preparations | |
| 21 | 62 | 5 (23.8%) | 5 (19.2%) | Yes | No | No | No | No | No | No | Yes | Yes | No | No | Parenteral iron vs inactive control | |
| 20 | Not stated | 9 (45%) | Not stated | No | No | Yes | No | No | No | No | Not applicable | Not applicable | Not applicable | Not applicable | Oral iron vs inactive control | |
| 91 | 42 | 63 (69.2%) | Not stated | No | No | No | No | Yes | No | No | Not applicable | Yes | No | No | Parenteral iron vs oral iron | |
| 148 | 68 | 59 (39.9%) | 0 (0%) | No | Yes | No | No | No | No | Yes | Not applicable | Yes | No | No | Parenteral iron vs oral iron | |
| 80 | Not stated | Not stated | 0 (0%) | No | No | Yes | No | No | No | No | No | Yes | No | No | Parenteral iron vs inactive control | |
| 300 | 82 | 245 (81.7%) | 0 (0%) | Yes | No | No | No | No | No | No | Not applicable | Not applicable | Not applicable | Not applicable | Oral iron vs inactive control | |
| 200 | 57 | 103 (51.5%) | 0 (0%) | No | No | No | No | No | Yes | No | Not applicable | Not applicable | Not applicable | Not applicable | Oral iron vs inactive control | |
| 490 | 64 | 320 (65.3%) | 12 (2.4%) | No | Yes | No | No | No | No | Yes | Not applicable | Yes | No | No | Parenteral iron vs oral iron vs inactive control | |
| 72 | 70 | 30 (41.7%) | Not stated | Yes | No | No | No | No | No | No | Not applicable | Not applicable | Not applicable | Not applicable | Oral iron vs inactive control | |
| 808 | 45 | 720 | 4 (0.5%) | No | No | No | No | No | Yes | No | No | Yes | No | No | Parenteral iron vs inactive control | |
| 453 | 39 | 453 (100%) | 24 (5%) | Yes | No | No | No | No | No | No | Not applicable | Yes | No | No | Parenteral iron vs oral iron | |
| Outcome or subgroup title | No. of studies | No. of participants | Statistical method | Effect size |
| 1 Mortality Show forest plot | 4 | 659 | Risk Ratio (M‐H, Random, 95% CI) | 1.05 [0.68, 1.61] |
| 2 Proportion requiring blood transfusion Show forest plot | 3 | 546 | Risk Ratio (M‐H, Random, 95% CI) | 0.74 [0.55, 0.99] |
| 3 Length of hospital stay Show forest plot | 1 | Mean Difference (IV, Random, 95% CI) | Totals not selected | |
| 4 Haemoglobin Show forest plot | 4 | Mean Difference (IV, Fixed, 95% CI) | Totals not selected | |
| 4.1 Final haemoglobin | 3 | Mean Difference (IV, Fixed, 95% CI) | 0.0 [0.0, 0.0] | |
| 4.2 Change in haemoglobin | 1 | Mean Difference (IV, Fixed, 95% CI) | 0.0 [0.0, 0.0] | |
| 5 Quality of life Show forest plot | 1 | Std. Mean Difference (IV, Random, 95% CI) | Totals not selected | |
| 6 Serious adverse events Show forest plot | 5 | 731 | Risk Ratio (M‐H, Fixed, 95% CI) | 0.96 [0.76, 1.22] |
| Outcome or subgroup title | No. of studies | No. of participants | Statistical method | Effect size |
| 1 Mortality Show forest plot | 10 | 2141 | Risk Ratio (M‐H, Random, 95% CI) | 1.04 [0.63, 1.69] |
| 2 Proportion requiring blood transfusion Show forest plot | 8 | 1315 | Risk Ratio (M‐H, Random, 95% CI) | 0.84 [0.66, 1.06] |
| 3 Haemoglobin Show forest plot | 9 | Mean Difference (IV, Random, 95% CI) | Totals not selected | |
| 3.1 Final haemoglobin | 6 | Mean Difference (IV, Random, 95% CI) | 0.0 [0.0, 0.0] | |
| 3.2 Change in haemoglobin | 3 | Mean Difference (IV, Random, 95% CI) | 0.0 [0.0, 0.0] | |
| 4 Quality of life Show forest plot | 4 | Std. Mean Difference (IV, Random, 95% CI) | Totals not selected | |
| 5 Serious adverse events Show forest plot | 7 | 1802 | Risk Ratio (M‐H, Random, 95% CI) | 1.00 [0.74, 1.34] |
| Outcome or subgroup title | No. of studies | No. of participants | Statistical method | Effect size |
| 1 Mortality Show forest plot | 6 | 1009 | Risk Ratio (M‐H, Random, 95% CI) | 1.49 [0.56, 3.94] |
| 2 Proportion requiring blood transfusion Show forest plot | 2 | 371 | Risk Ratio (M‐H, Random, 95% CI) | 0.61 [0.24, 1.58] |
| 3 Mean blood transfused Show forest plot | 1 | Mean Difference (IV, Random, 95% CI) | Totals not selected | |
| 4 Haemoglobin Show forest plot | 6 | 769 | Mean Difference (IV, Random, 95% CI) | ‐0.50 [‐0.73, ‐0.27] |
| 4.1 Final haemoglobin | 3 | 148 | Mean Difference (IV, Random, 95% CI) | ‐0.47 [‐0.74, ‐0.21] |
| 4.2 Change in haemoglobin | 3 | 621 | Mean Difference (IV, Random, 95% CI) | ‐0.41 [‐1.29, 0.46] |
| 5 Quality of life Show forest plot | 3 | 771 | Std. Mean Difference (IV, Random, 95% CI) | ‐0.02 [‐0.16, 0.13] |
| 6 Serious adverse events Show forest plot | 7 | 1100 | Risk Ratio (M‐H, Random, 95% CI) | 1.23 [0.99, 1.54] |
| Outcome or subgroup title | No. of studies | No. of participants | Statistical method | Effect size |
| 1 Mortality Show forest plot | 1 | Risk Ratio (M‐H, Random, 95% CI) | Totals not selected | |
| 1.1 Intravenous iron: ferrumoxytol vs iron sucrose | 1 | Risk Ratio (M‐H, Random, 95% CI) | 0.0 [0.0, 0.0] | |
| 2 Haemoglobin Show forest plot | 2 | Mean Difference (IV, Random, 95% CI) | Totals not selected | |
| 2.1 Intravenous iron: ferric carboxymaltose vs iron sucrose | 1 | Mean Difference (IV, Random, 95% CI) | 0.0 [0.0, 0.0] | |
| 2.2 Intravenous iron: ferrumoxytol vs iron sucrose | 1 | Mean Difference (IV, Random, 95% CI) | 0.0 [0.0, 0.0] | |
| 3 Serious adverse events Show forest plot | 2 | Risk Ratio (M‐H, Random, 95% CI) | Totals not selected | |
| 3.1 Intravenous iron: ferric carboxymaltose vs iron sucrose | 1 | Risk Ratio (M‐H, Random, 95% CI) | 0.0 [0.0, 0.0] | |
| 3.2 Intravenous iron: ferrumoxytol vs iron sucrose | 1 | Risk Ratio (M‐H, Random, 95% CI) | 0.0 [0.0, 0.0] | |
| Outcome or subgroup title | No. of studies | No. of participants | Statistical method | Effect size |
| 1 Mortality (parenteral iron vs inactive control stratified by clinical setting) Show forest plot | 10 | 2141 | Risk Ratio (M‐H, Random, 95% CI) | 1.04 [0.63, 1.69] |
| 1.1 Blood loss | 2 | 41 | Risk Ratio (M‐H, Random, 95% CI) | 0.0 [0.0, 0.0] |
| 1.2 Cancer | 4 | 1028 | Risk Ratio (M‐H, Random, 95% CI) | 1.03 [0.48, 2.25] |
| 1.3 Preoperative anaemic patients | 1 | 80 | Risk Ratio (M‐H, Random, 95% CI) | 0.0 [0.0, 0.0] |
| 1.4 Chronic heart failure | 2 | 184 | Risk Ratio (M‐H, Random, 95% CI) | 0.87 [0.16, 4.82] |
| 1.5 Other settings | 1 | 808 | Risk Ratio (M‐H, Random, 95% CI) | 0.66 [0.06, 7.22] |
| 2 Mortality (parenteral iron vs inactive control stratified by erythropoietin use) Show forest plot | 10 | 2141 | Risk Ratio (M‐H, Random, 95% CI) | 1.04 [0.63, 1.69] |
| 2.1 Supplementary erythropoietin | 3 | 701 | Risk Ratio (M‐H, Random, 95% CI) | 0.81 [0.34, 1.91] |
| 2.2 No supplementary erythropoietin | 7 | 1440 | Risk Ratio (M‐H, Random, 95% CI) | 1.50 [0.58, 3.90] |
| 3 Mortality (parenteral iron vs oral iron stratified by clinical setting) Show forest plot | 5 | 861 | Risk Ratio (M‐H, Random, 95% CI) | 1.49 [0.56, 3.94] |
| 3.1 Blood loss | 2 | 473 | Risk Ratio (M‐H, Random, 95% CI) | 0.0 [0.0, 0.0] |
| 3.2 Cancer | 2 | 371 | Risk Ratio (M‐H, Random, 95% CI) | 1.33 [0.47, 3.73] |
| 3.3 Chronic heart failure | 1 | 17 | Risk Ratio (M‐H, Random, 95% CI) | 3.64 [0.20, 65.86] |