Scolaris Content Display Scolaris Content Display

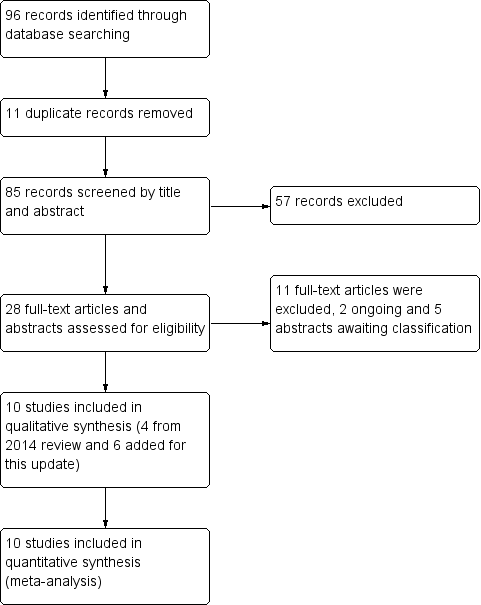
Study flow diagram.
Figuras y tablas -
Figure 1

Study flow diagram.

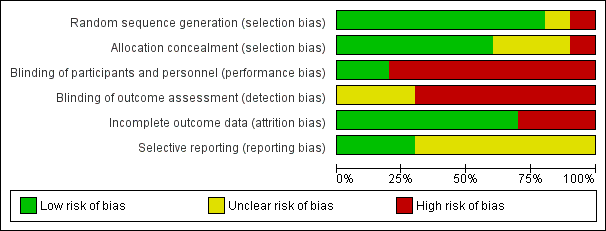
Risk of bias graph: review authors' judgements about each risk of bias item presented as percentages across all included studies.
Figuras y tablas -
Figure 2

Risk of bias graph: review authors' judgements about each risk of bias item presented as percentages across all included studies.

Risk of bias summary: review authors' judgements about each risk of bias item for each included study.
Figuras y tablas -
Figure 3

Risk of bias summary: review authors' judgements about each risk of bias item for each included study.

Comparison 1 Oral and sublingual immunotherapy versus no therapy for egg allergy, Outcome 1 Increase in the amount of egg that can be tolerated.
Figuras y tablas -
Analysis 1.1

Comparison 1 Oral and sublingual immunotherapy versus no therapy for egg allergy, Outcome 1 Increase in the amount of egg that can be tolerated.

Comparison 1 Oral and sublingual immunotherapy versus no therapy for egg allergy, Outcome 2 Complete recovery.
Figuras y tablas -
Analysis 1.2

Comparison 1 Oral and sublingual immunotherapy versus no therapy for egg allergy, Outcome 2 Complete recovery.

Comparison 1 Oral and sublingual immunotherapy versus no therapy for egg allergy, Outcome 3 Number of participants with serious adverse events.
Figuras y tablas -
Analysis 1.3

Comparison 1 Oral and sublingual immunotherapy versus no therapy for egg allergy, Outcome 3 Number of participants with serious adverse events.

Comparison 1 Oral and sublingual immunotherapy versus no therapy for egg allergy, Outcome 4 Number of participants with mild‐to‐severe adverse events.
Figuras y tablas -
Analysis 1.4

Comparison 1 Oral and sublingual immunotherapy versus no therapy for egg allergy, Outcome 4 Number of participants with mild‐to‐severe adverse events.

Summary of findings for the main comparison. Oral and sublingual immunotherapy versus no therapy for egg allergy

Oral and sublingual immunotherapy versus no therapy for egg allergy

Population: children with egg allergy

Setting: hospitals
Intervention: oral and sublingual immunotherapy for egg allergy. (Each study used a different oral immunotherapy protocol)

Comparison: placebo or egg‐free diet. (Three studies used placebo and seven studies used an egg avoidance diet as controls)

Outcomes

Illustrative comparative risks* (95% CI)

Relative effect
(95% CI)

No of participants
(studies)

Quality of the evidence
(GRADE)

Comments

Assumed risk

Corresponding risk

Control

Oral immunotherapy versus no therapy for egg allergy

Increase in the amount of egg that could be tolerated

Study population

RR 7.48
(4.91 to 11.38)

410
(9 studies)

⊕⊕⊝⊝
low1,2

82% of children in the oral immunotherapy group could ingest a partial serving of egg (1 g to 7.5 g) compared to 10% of the control group.

102 per 1000

763 per 1000
(501 to 1000)

Complete recovery

Study population

RR 4.25
(2.77 to 6.53)

439
(10 studies)

⊕⊕⊝⊝
low1,2

45% of children receiving oral immunotherapy were able to tolerate a full serving of egg compared to 10% of the control group.

100 per 1000

425 per 1000
(277 to 653)

Numbers of children with serious adverse events

See comment

See comment

Not estimable

439
(10 studies)

⊕⊕⊝⊝
low1,2

All 10 trials reported numbers of children with serious adverse events (SAEs): SAEs requiring epinephrine/adrenaline occurred in 21/249 (8.4%) of children in the oral immunotherapy group and none in the control group.

Because adverse events were classified differently among the studies, it is difficult to comment on whether they were under‐ or over‐estimated. Surprisingly, only one study showed a high level of SAEs (Vazquez‐Ortiz 2014): 13 children required epinephrine/adrenaline administration 18 times, and one grade 5 reaction occurred.

Number of children with mild‐to‐severe adverse events

Study population

RR 8.35
(5.31 to 13.12)

439
(10 studies)

⊕⊕⊝⊝
low1,2

Mild‐to‐severe adverse events were frequent; 75% of children presented mild‐to‐severe adverse events during oral immunotherapy treatment versus 6.8% of children in the control group.

68 per 1000

568 per 1000
(361 to 892)

*The basis for the assumed risk (e.g. the median control group risk across studies) is provided in footnotes. The corresponding risk (and its 95% confidence interval) is based on the assumed risk in the comparison group and the relative effect of the intervention (and its 95% CI).
CI: Confidence interval; RR: Risk ratio;

GRADE Working Group grades of evidence
High quality: Further research is very unlikely to change our confidence in the estimate of effect.
Moderate quality: Further research is likely to have an important impact on our confidence in the estimate of effect and may change the estimate.
Low quality: Further research is very likely to have an important impact on our confidence in the estimate of effect and is likely to change the estimate.
Very low quality: We are very uncertain about the estimate.

The assumed risk is the risk of the control arm

1 Downgraded one level because of risk of bias: all studies were assessed at high or unclear risk of bias in at least one domain.
2 Downgraded one level because of imprecision: few events.

Figuras y tablas -
Summary of findings for the main comparison. Oral and sublingual immunotherapy versus no therapy for egg allergy
Table 1. Skin prick test to egg white (wheal size, mm)

Study name

Oral immunotherapy

Control/placebo

Oral immunotherapy versus control/placebo

Pre‐treatment

Post‐treatment

P value

Pre‐treatment

Post‐treatment

P value

P value pre‐treatment

P value post‐treatment

Burks 2012

10.5

(2.5 to 26.0)

not available

not available

13.0

(7.5 to 20.0)

not available

not available

not significant

P = 0.02

Caminiti 2015

11.0

(6.5 to 18)

9.2

P = 0.05

9.0

(6.0 to 16.0)

10.0

not available

not significant

P = 0.88

Dello Iacono 2013

10.0

(7.0 to 15.0)

5.0

(4.0 to 13.0)

not available

9.25

(5.5 to 15.0)

10.0

(5.5 to 15.0)

not available

P = 0.976

P = 0.007

Escudero 2015

6.0

(3.0 to 11.0)

5.0

(3.0 to 8.0)

P = 0.001

6.0

(3.0 to 12.0)

5.5

(0 to 13.0)

P = 0.45

P = 0.2

P = 0.16

Fuentes‐Aparicio 2013

8.74

(4 to 16)

not available

P < 0.001

9.68

(3.0 to 16.0)

not available

not available

not available

not available

Meglio 2013

5.5

(2.5 to 7.0)

3.5

(1.0 to 5.0)

P < 0.01

4.0

(1.0 to 7.0)

6.0

(1.0 to 8.0)

P = NS

not available

not available

Pérez‐Rangel 2017

7.0

(5.0 to 10.0)

not available

not available

7.0

(4.0 to 12.0)

not available

not available

not available

P < 0.05

Figuras y tablas -
Table 1. Skin prick test to egg white (wheal size, mm)
Comparison 1. Oral and sublingual immunotherapy versus no therapy for egg allergy

Outcome or subgroup title

No. of studies

No. of participants

Statistical method

Effect size

1 Increase in the amount of egg that can be tolerated Show forest plot

9

410

Risk Ratio (M‐H, Fixed, 95% CI)

7.48 [4.91, 11.38]

2 Complete recovery Show forest plot

10

439

Risk Ratio (M‐H, Fixed, 95% CI)

4.25 [2.77, 6.53]

3 Number of participants with serious adverse events Show forest plot

10

Risk Ratio (M‐H, Fixed, 95% CI)

Totals not selected

4 Number of participants with mild‐to‐severe adverse events Show forest plot

10

439

Risk Ratio (M‐H, Fixed, 95% CI)

8.35 [5.31, 13.12]

Figuras y tablas -
Comparison 1. Oral and sublingual immunotherapy versus no therapy for egg allergy