Фармакологические вмешательства при соматоформных расстройствах у взрослых
Referencias
References to studies included in this review
References to studies excluded from this review
References to ongoing studies
Additional references
Characteristics of studies
Characteristics of included studies [ordered by study ID]
| Methods | Randomised, parallel‐group, double‐blind, fixed‐dose triala,f | |
| Participants | n(randomised/ITT) = 30 Diagnosis: somatisation disorder, undifferentiated somatoform disorder (DSM‐III‐R) Inclusion criteria: no information provided Exclusion criteria: no information provided Age: mean (± SD) 49.20 ± 9.64 years, range 18‐77 years; sex: 43.3% women; mean length of time since diagnosis of a somatoform disorder: ns; country: Italy; setting: no information provided | |
| Interventions | Levosulpiride (n = 15; AP; mean dose = 150 mg/day, max dose = 150 mg/day; no information regarding mode/frequency of administration provided) Racemic sulpiride (n = 15; AP; mean dose= 300 mg/day, max dose = 300 mg/day; no information regarding mode/frequency of administration provided) Treatment duration: 21 days | |
| Outcomes | Primary outcome: Scale for Somatoform Disorders (Lipman 1969) ‐ Total Score, Somatisation Score (self rated) Secondary outcomes: Scale for Somatoform Disorders ‐ Depression Score (self rated): baseline, week 1, 2, 3, 4, 5 HARS ‐ Total Score (clinician‐rated): baseline, week 1, 2, 3, 4, 5 All‐cause drop‐outs: n = 2 (levosulpiride), n = 2 (racemic sulpiride) Drop‐outs due to adverse effects: n = 1 (levosulpiride), n = 1 (racemic sulpiride) Reported drug‐related adverse effects: Levosulpiride: anticholinergic adverse effects (n = 1, 6.6%) Racemic sulpiride: extrapyramidal adverse effects (n = 2, 13.3%), anticholinergic adverse effects (n = 3, 20.0%) No information about the total rate of participants with drug‐related adverse events provided. There were no significant differences between groups regarding severity of anticholinergic adverse effects | |
| Notes | Funding: no information provided Ethics approval: no information provided Underlined outcome measures and time points were considered in the meta‐analytical part of the review | |
| Risk of bias | ||
| Bias | Authors' judgement | Support for judgement |
| Random sequence generation (selection bias) | Unclear risk | Authors states that participants were randomly assigned to 1 of 2 treatment groups (p. 26); no information provided about the random sequence generation |
| Allocation concealment (selection bias) | Unclear risk | No information about method of allocation concealment provided |
| Blinding of participants and personnel (performance bias) | Unclear risk | Participants "were treated under double blind conditions" (p. 25); insufficient information provided about who was and was not blinded |
| Blinding of outcome assessment (detection bias) | Unclear risk | No information about method of blinding outcome assessment provided |
| Incomplete outcome data (attrition bias) | Unclear risk | Drop‐out rate in total sample: 13.3%; although reasons for missing outcome data were partly likely to be related to true outcome, missing outcome data were balanced in number across intervention with similar reasons for missing data across groups; however, no information was provided about how missing values were replaced; furthermore, no information was provided about how many of the randomised participants (placebo‐responder) were excluded from the trial after the 1‐week placebo run‐in phase before the treatment started |
| Selective reporting (reporting bias) | High risk | No protocol available; generally accepted outcomes were used. Means and SD only presented in a graph, but not as concrete values in a table or text |
| Other bias | High risk | "After one week of placebo treatment, not responders were treated under double blind conditions" (p. 25), "A placebo week followed the treatment" (p. 25), participants were randomised and passed a 1‐week placebo run‐in phase before they started the treatment, only placebo‐non‐responders (improvement < 20% on clinical rating scales) were included to the study. This exclusion of placebo‐responders before the treatment started could have led to a change of the magnitude of the effect estimation |
| Methods | Randomised, parallel‐group, double‐blind, fixed‐dose trial | |
| Participants | n(randomised) = 35; n(ITT) = 29 Diagnosis: pain disorder associated with psychological factors (DSM‐IV‐TR) Inclusion criteria: presence of psychological factors that might have influenced the onset or the clinical course (or both) of pain; passing the 2 steps of diagnostic procedure; aged > 18 years Exclusion criteria: pregnancy, medical conditions of clinical importance, direct organic explanation of symptoms, a diagnosis of another mental disorder, use of psychotropic drugs endowed with an analgesic effect (e.g. amitriptyline) and anti‐inflammatory medications (were suspended in 1‐week washout phase before randomisation) Ageb: mean (± SD) 53.64 ± 15.79 years, range 18‐77 years; sexb: 72.4% women; mean length of time since diagnosis of a somatoform disorder: ns; country: Italy; setting: outpatient | |
| Interventions | Citalopram (n = 17; SSRI; mean dose = 40 mg/day, max dose = 40 mg/day; 1 tablet twice/day) Reboxetine (n = 18; SNRI; mean dose = 8 mg/day, max dose = 8 mg/day; 1 tablet twice/day) Treatment duration: 56 days | |
| Outcomes | Primary outcome: McGill Pain Questionnaire ‐ Present Pain Intensity, Pain Rating Index (self rated): baseline, week 2, 4, 8 Zung Self‐Rating Depression Scale (self rated): baseline, week 2, 4, 8 All‐cause drop‐outs: n = 6 (citalopram), n = 9 (reboxetine) Drop‐outs due to adverse effects: n = 2 (citalopram), n = 4 (reboxetine) Reported drug‐related adverse effects: Citalopram: dry mouth (n = 2, 11.7%); somnolence (n = 6, 35.3%); insomnia (n = 4, 23.5%); tremor (n = 5, 29.4%); tachycardia (n = 2, 11.7%); increased motor activity (n = 5, 29.4%); nausea (n = 2, 11.7%); blurred vision (n = 2, 11.7%); dizziness (n = 1, 5.8%); diarrhoea (n = 2, 11.7%) Reboxetine: dry mouth (n = 9, 50.0%); somnolence (n = 4, 22.2%); insomnia (n = 6, 33.3%); tremor (n = 4, 22.2%); tachycardia (n = 7, 38.8%); increased motor activity (n = 2, 11.1%); nausea (n = 3, 16.6%); blurred vision (n = 3, 16.6%); dizziness (n = 4, 22.2%); diarrhoea (n = 1, 5.5%); sweating (n = 2, 11.1%) 100% of people in both groups reported adverse effects. Both treatments were similarly tolerated | |
| Notes | Funding: no information provided Ethics approval: obtained Underlined outcome measures and time points were considered in the meta‐analytical part of the review | |
| Risk of bias | ||
| Bias | Authors' judgement | Support for judgement |
| Random sequence generation (selection bias) | Low risk | "Patients were randomly assigned (by random tables)" (p. 35) |
| Allocation concealment (selection bias) | Unclear risk | No information about methods of allocation concealment provided |
| Blinding of participants and personnel (performance bias) | Unclear risk | "Under double‐blind conditions" (p. 35); insufficient information provided about who was and was not blinded |
| Blinding of outcome assessment (detection bias) | Unclear risk | No information about methods of blinding outcome assessment provided; only self rating scales were used; however, it was not clear who was and was not blinded in this trial |
| Incomplete outcome data (attrition bias) | High risk | Drop‐out rate in total sample: 42.9%; only participants who received at least 1 outcome assessment were included in the ITT sample: originally, 35 participants were randomised (citalopram: n = 17; reboxetine: n = 18), 6 participants abandoned treatment before the first outcome assessment and were excluded from ITT sample (n = 29) that was used for statistical analyses; although reasons for missing outcome data were partly likely to be related to true outcome, missing outcome data were balanced in number across interventions with similar reasons for missing data across groups; LOCF was used to replace missing values for statistical analyses (p. 35) |
| Selective reporting (reporting bias) | Unclear risk | No protocol available; generally accepted outcomes were used |
| Other bias | Low risk | No significant differences were found in the baseline demographic or clinical characteristics between groups; participants who had previously used psychotropic/analgesic drugs were similarly distributed in the 2 groups |
| Methods | Randomised, parallel‐group, double‐blind, fixed‐dose trial | |
| Participants | n(randomised/ITT) = 70 Diagnosis: idiopathic pain syndrome according to the definition by Williams 1982 (comparable to psychogenic pain disorder of the DSM‐III‐TR) Inclusion criteria: no further inclusion criteria Exclusion criteria: severe somatic disease, MDD (DSM‐III‐TR), other psychiatric illnesses, clinically relevant contraindications towards the use of antidepressive agents, antidepressive treatment for the previous 3 months, intake of other CNS active drug, abuse of drugs Age: mean (± SD) 50.29 ± 12.60 years, range 21‐73 years; sex: 72.9% women; mean (± SD) length of time since diagnosis of a somatoform disorder: 60.0 ± 67.11 months; country: Sweden; setting: outpatient | |
| Interventions | Maprotiline (n = 30; TCA; mean dose = 100 mg/day, max dose = 150 mg/day; 1 tablet twice/day) Clomipramine (n = 40; TeCA; mean dose = 97.2 mg/day, max dose = 150 mg/day; 1 tablet twice/day) Treatment duration: 42 days | |
| Outcomes | Primary outcomes: 2 VAS on pain and on bodily discomfort (Johansson 1982) (self rating): week 2, 6, month 3, 6, 12 Secondary outcomes: Depressive SCL (clinician‐rated): baseline, week 6, month 3, 6, 12 Spontaneously reported side effects: baseline, week 1, 2, 4, 6 All‐cause drop‐outs: n = 5 (maprotiline), n = 13 (clomipramine) Drop‐outs due to adverse effects: n = 1 (maprotiline), n = 8 (clomipramine) Reported drug‐related adverse effects: Maprotiline: tremor (n = 3, 10.0%), tachycardia (n = 3, 10.0%), headache (n = 1, 3.3%), dry mouth (n = 7, 60.0%), sweating (n = 7, 23.3%), micturition disturbances (n = 4, 13.3%), constipation (n = 5, 16.7%), asthenia (n = 2, 6.7%), dizziness (n = 2, 6.7%), orthosatism (n = 4, 13.3%), sedation (n = 1, 3.3%) Clomipramine: tremor (n = 12, 30.0%), tachycardia (n = 2, 5.0%), headache (n = 2, 5.0%), dry mouth (n = 20, 50.0%), sweating (n = 12, 30.0%), micturition disturbances (n = 4, 10.0%), constipation (n = 10, 25.0%), asthenia (n = 7, 17.5%), dizziness (n = 2, 5.0%), orthosatism (n = 3, 7.5%), sedation (n = 1, 2.5%), vertigo (n = 4, 10%), gastritis (n = 1, 2.5%) No information about the total rate of participants with drug‐related adverse events was provided or if both treatment groups differed in the number of adverse effects | |
| Notes | Funding: medication in both study groups was provided by the Ciba‐Geigy AG Ethics approval: obtained Underlined outcome measures and time points were considered in the meta‐analytical part of the review | |
| Risk of bias | ||
| Bias | Authors' judgement | Support for judgement |
| Random sequence generation (selection bias) | Unclear risk | "Randomized, double‐blind multicenter study" (p. 27); no information provided about the random sequence generation |
| Allocation concealment (selection bias) | Unclear risk | No information about methods of allocation concealment provided |
| Blinding of participants and personnel (performance bias) | Low risk | "Randomized, double‐blind multicenter study" (p. 27); "Both drugs were given in 25‐mg tablets of identical shape, taste, and color" (p. 29) |
| Blinding of outcome assessment (detection bias) | Unclear risk | No information about methods of blinding outcome assessment provided |
| Incomplete outcome data (attrition bias) | High risk | Drop‐out rate in total sample: 25.7%; reasons for missing outcome data were partly likely to be related to true outcome. Furthermore, missing outcome data were not balanced in number across interventions. More participants dropped out of the clomipramine than of the maprotiline group because of adverse effects; missing values were not replaced, statistical analyses were based only on the sample of participants who complied with the protocol; "patients did not complete at least 2 weeks of treatment […] were not included in the efficacy analysis" (p. 32). However, it was not clear how many participants were excluded for this reason |
| Selective reporting (reporting bias) | Unclear risk | No protocol available; generally accepted outcomes were used |
| Other bias | Low risk | Clients who were recruited in a pain clinic or in a psychiatric clinic were compared with the rest of the participants who were recruited from general practitioner practices "with regard to sex, age, duration of illness, and to treatment outcome and no special trends were found" (p. 27). "The two treatment groups were compared as concerns age, sex, and duration of symptoms. No significant differences emerged" (p. 28) |
| Methods | Randomised, parallel‐group, flexible‐dose trial | |
| Participants | n(randomised) = 95; n(ITT) = 77 Diagnosis: undifferentiated somatoform disorder (DSM‐IV) Inclusion criteria: aged ≥ 18 years; somatic symptoms almost every day for ≥ 6 months, not taking any active prescription medications to control somatic symptoms (non‐prescription medications, e.g. paracetamol (acetaminophen) 2 g/day or ibuprofen 1.2 g/day were allowed), women of reproductive age had to agree to use adequate contraception Exclusion criteria: history of (or current, or both) psychotic disorders (such as schizophrenia, schizoaffective disorder, and bipolar disorder); current DSM Axis I disorders that could possibly account for the somatic symptoms (e.g. MDD, anxiety disorders, factitious disorder, malingering or another somatoform disorder such as somatisation disorder), substance abuse or dependence in the previous 12 months, history of hypersensitivity to venlafaxine or mirtazapine, people currently treated with any psychotropic medication; participation in any clinical trials in the previous 30 days; people involved in workers' compensation, disability or related litigation, breast‐feeding or pregnant women Age: mean (± SD) 45.20 ± 12.59 years, range ns; sex: 61.1% women; mean (± SD) length of time since diagnosis of a somatoform disorder: 32.5 ± 22.5 months; country: South Korea; setting: no information provided, but outpatient setting was assumed due to affiliations of study authors | |
| Interventions | Mirtazapine (n = 50; NaSSA; mean dose = 31.70 mg/day, max dose = 60 mg/day; no information regarding mode/frequency of administration provided) Venlafaxine (n = 45; SNRI; mean dose = 105.50 mg/day, max dose = 225 mg/day; no information regarding mode/frequency of administration provided) Treatment duration: 84 days | |
| Outcomes | Primary outcome: PHQ‐15 (self rated): baseline, week 1, 2, 4, 8, 12 Secondary outcomes: Beck Depression Inventory (self rated): baseline, week 1, 2, 4, 8, 12 All‐cause drop‐outs: n = 11 (mirtazapine), n = 13 (venlafaxine) Drop‐outs due to adverse effects: n = 3 (mirtazapine), n = 4 (venlafaxine) Reported drug‐related adverse effects: Mirtazapine: nausea (n = 2, 4.0%), vomiting (n = 1, 2.0%), somnolence (n = 4, 8.0%), dry mouth (n = 5, 10.0%), anorexia (n = 1, 2.0%), yawning (n = 3, 6.0%), sweating (n = 2, 4.0%), dizziness (n = 3, 6.0%), headache (n = 1, 2.0%) Venlafaxine: nausea (n = 4, 8.9%), vomiting (n = 2, 4.4%), somnolence (n = 1, 2.2%), dry mouth (n = 6, 13.3%), anorexia (n = 2, 4.4%), sweating (n = 1, 2.2%), insomnia (n = 2, 4.4%), dizziness (n = 2, 4.4%), headache (n = 1, 2.2%) Both treatments were well tolerated. No information about the total rate of participants with drug‐related adverse events was provided | |
| Notes | Funding: Dr Han: research support from Korea Research Foundation Grant (MOEHRD) (KRF‐2007‐013‐E00033), Korea University Neuropsychiatric Alumni Grant, member of speaker's bureaux of GlaxoSmithKline Korea, Janssen Pharmaceuticals Korea, and Otsuka Korea Ethics approval: obtained Underlined outcome measures and time points were considered in the meta‐analytical part of the review | |
| Risk of bias | ||
| Bias | Authors' judgement | Support for judgement |
| Random sequence generation (selection bias) | Low risk | "Computer‐generated randomization code" (p. 253) |
| Allocation concealment (selection bias) | Unclear risk | No information about methods of allocation concealment provided |
| Blinding of participants and personnel (performance bias) | High risk | "Observer bias should be considered" (p. 259); because the study report included no information about blinding procedures it is assumed that neither participants nor study personnel were blinded |
| Blinding of outcome assessment (detection bias) | High risk | "Observer bias should be considered" (p. 259); because the study report includes no information about blinding procedures it is assumed that outcome assessment was not blinded; only self report scales were used; however, it is not clear if participants were blinded to the treatment |
| Incomplete outcome data (attrition bias) | High risk | Drop‐out rate in total sample: 25.2%; only participants who received at least 1 dose of a study medication and had at least 1 post‐baseline visit assessment were included in the ITT sample: originally, 95 participants were randomised (citalopram: n = 17; reboxetine: n = 18), 6 participants abandoned treatment before the first outcome assessment and were excluded from ITT sample (n = 7) that was used for statistical analyses; although reasons for missing outcome data were partly likely to be related to true outcome, missing outcome data were balanced in number across intervention with similar reasons for missing data across groups; LOCF was applied for replacing missing values (p. 254) |
| Selective reporting (reporting bias) | High risk | SD for outcomes at post‐assessment were not provided. No protocol available; generally accepted outcomes were used |
| Other bias | Low risk | No significant differences were found in the baseline demographic or clinical characteristics between groups |
| Methods | Randomised, parallel‐group, flexible‐dose trial | |
| Participants | n(randomised/ITT) = 45 Diagnosis: undifferentiated somatoform disorder (DSM‐IV) Inclusion criteria: aged ≥ 18 years, somatic symptoms almost every day for ≥ 6 months, not taking any active prescription medications to control their somatic symptoms (non‐prescription medications, e.g. paracetamol (acetaminophen) 2 g/day or ibuprofen 1.2 g/day were allowed), women of reproductive age had to agree to use adequate contraception Exclusion criteria: history of (or current, or both) psychotic disorders (such as schizophrenia, schizoaffective disorder, and bipolar disorder); current DSM Axis I disorders that could possibly account for the somatic symptoms (e.g. MDD, anxiety disorders, factitious disorder, malingering or another somatoform disorder such as somatisation disorder); substance abuse or dependence in the previous 12 months; history of hypersensitivity to venlafaxine or mirtazapine; people currently treated with any psychotropic medication; participation in any clinical trials in the previous 30 days; people involved in workers' compensation, disability, or related litigation; breast‐feeding or pregnant women Age: mean (± SD) 37.64 ± 11.90 years, range ns; sex: 57.8% women; mean (± SD) length of time since diagnosis of a somatoform disorder: 38.9 ± 27.5 months; country: South Korea; setting: no information provided, but outpatient setting was assumed due to affiliations of study authors | |
| Interventions | Fluoxetine (n = 28; SSRI; mean dose = 36.10 mg/day, max dose = 60 mg/day; no information regarding mode/frequency of administration provided) Sertraline (n = 17; SSRI; mean dose = 167.70 mg/day, max dose = 350 mg/day; no information regarding mode/frequency of administration provided) Treatment duration: 84 days | |
| Outcomes | Primary outcome: PHQ‐15 (self rated): baseline, week 1, 2, 4, 8, 12 Secondary outcomes: Beck Depression Inventory (self rated): baseline, week 1, 2, 4, 8, 12 All‐cause drop‐outs: n = 8 (fluoxetine), n = 5 (sertraline) Drop‐outs due to adverse effects: n = 0 (fluoxetine), n = 0 (sertraline) Reported drug‐related adverse effects: Fluoxetine: nausea (n = 5, 17.9%), vomiting (n = 2, 7.1%), somnolence (n = 1, 3.6%), dry mouth (n = 3, 10.7%), anorexia (n = 3, 10.7%), sweating (n = 1, 3.6%), insomnia (n = 2, 7.1%), constipation (n = 1, 3.6%), dizziness (n = 1, 3.6%) Sertraline: nausea (n = 3, 17.6%), vomiting (n = 1, 5.9%), somnolence (n = 3, 17.6%), dry mouth (n = 2, 11.8%), anorexia (n = 1, 5.9%), constipation (n = 2, 11.8%), dizziness (n = 2, 11.8%) Both treatments were well tolerated. No information about the total rate of participants with drug‐related adverse events was provided | |
| Notes | Funding: Dr Han: research support from Korea Research Foundation Grant (MOEHRD) (KRF‐2007‐013‐E00033), Korea University Neuropsychiatric Alumni Grant Ethics approval: obtained Underlined outcome measures and time points were considered in the meta‐analytical part of the review | |
| Risk of bias | ||
| Bias | Authors' judgement | Support for judgement |
| Random sequence generation (selection bias) | Low risk | "Computer‐generated randomization code" (p. 438) |
| Allocation concealment (selection bias) | Unclear risk | No information about methods of allocation concealment provided |
| Blinding of participants and personnel (performance bias) | High risk | "Observer bias should be considered" (p. 442); because the study report included no information about blinding procedures it was assumed that neither participants nor study personnel were blinded |
| Blinding of outcome assessment (detection bias) | High risk | "Observer bias should be considered" (p. 259); because the study report included no information about blinding procedures it is assumed that outcome assessment was not blinded; only self report scales were used; however, it was not clear if participants were blinded to the treatment |
| Incomplete outcome data (attrition bias) | Low risk | Drop‐out rate in total sample: 28.9%; only participants who received at least 1 dose of a study medication and had at least 1 post‐baseline visit assessment were included in the ITT sample: originally, 45 participants were randomised (fluoxetine: n = 28; sertraline: n = 17), because all participants returned for at least 1 post‐baseline follow‐up visit in both treatment groups yielding an ITT sample of n = 45; although reasons for missing outcome data were partly likely to be related to true outcome, missing outcome data were balanced in number across intervention with similar reasons for missing data across groups; LOCF was applied for replacing missing values (p. 439) |
| Selective reporting (reporting bias) | High risk | SD for outcomes at post‐assessment were not provided; no protocol available; generally accepted outcomes were used |
| Other bias | Low risk | No significant differences were found in the baseline demographic or clinical characteristics between groups |
| Methods | Randomised, parallel‐group, fixed‐dose trial | |
| Participants | n(randomised/ITT) = 60 Diagnosis: somatisation disorder (F45.0), undifferentiated somatoform disorder (F45.1), SAD (F45.3) (ICD‐10) Inclusion criteria: duration of the disorder > 6 months, somatic subscore of HARS ≥ 12 and ≥ 5 points higher than the Psychic Subscore of the HARS, the SOMS‐7 score had to be ≥ 12 Exclusion criteria: 17‐item HDRS score ≥ 17, had other mental disorders (e.g. panic disorder, MDD, or substance abuse), exhibited a severe and unstable physical illness (e.g. epilepsy, severe renal or hepatic impairment, or cancer), pregnant or breast‐feeding women Age: mean (± SD) 44.40 ± 9.75 years, range ns; sex: 65.0% women; mean (± SD) length of time since diagnosis of a somatoform disorder: 30.9 ± 18.1 months; country: China; setting: no information provided, but outpatient setting was assumed due to affiliations of study authors | |
| Interventions | Citalopram + paliperidone (n = 30; SSRI + AP; mean dose citalopram = 20 mg/day, mean dose paliperidone = 3 mg/day, max dose citalopram = 20 mg/day, max dose paliperidone = 3 mg/day; no mode/frequency of administration provided) Citalopram (n = 30; SSRI; mean dose = 20 mg/day, max dose = 20 mg/day; no information regarding mode/frequency of administration provided) Treatment duration: 42 days | |
| Outcomes | Primary outcome: SOMS‐7 (self rated): baseline, week 2, 4, 6 Secondary outcomes: Response rate (50% reduction in SOMS‐7 score; SOMS‐7 score < 12): week 6 All‐cause drop‐outs: n = 9 (citalopram + paliperidone), n = 9 (citalopram) Drop‐outs due to adverse effects: n = 3 (citalopram), n = 5 (citalopram + paliperidone) Reported drug‐related adverse effects: Citalopram + paliperidone: drowsiness (n = 2, 6.7%), dry mouth (n = 6, 20.0%), somnolence (n = 4, 13.3%), constipation (n = 3, 10.0%), nasal obstruction (n = 1, 3.3%), sweating (n = 2, 3.3%), nausea or vomiting (n = 2, 6.7%), dizziness (n = 3, 10.0%), headache (n = 2, 6.7%), elevated prolactin (n = 1, 3.3%) Citalopram: drowsiness (n = 1, 3.3%), dry mouth (n = 4, 13.3%), somnolence (n = 1, 3.3%), constipation (n = 1, 3.3%), sweating (n = 1, 3.3%), nausea or vomiting (n = 2, 6.7%), dizziness (n = 1, 3.3%), headache (n = 1, 3.3%) 86.7% of the citalopram + paliperidone group and 40.0% of the citalopram group experienced adverse effects. Both groups did not differ statistically significant regarding the adverse effects | |
| Notes | Funding: no information provided. Authors state that there are no conflicts of interest Ethics approval: obtained Underlined outcome measures and time points were considered in the meta‐analytical part of the review | |
| Risk of bias | ||
| Bias | Authors' judgement | Support for judgement |
| Random sequence generation (selection bias) | Low risk | "The allocation of each medication was on the basis of a computer‐generated randomization code" (p. 152) |
| Allocation concealment (selection bias) | Low risk | "Each code was sealed in an envelope saved in the Clinical Research Center. In addition, another researcher who did not know the code helped with the process. Only when a patient fulfilled the inclusion criteria and was enrolled in the study was the corresponding coded envelope opened and the code of the group given" (p. 152) |
| Blinding of participants and personnel (performance bias) | High risk | "This is not a double‐blind study, but only a randomized study. But in order to ensure the reliability and validity of research results, we carried out the study in accordance with the requirements of a double‐blind study as much as possible. [...] Therefore, the patients were completely randomly assigned to receive citalopram plus paliperidone treatment or receive citalopram treatment alone." "Only when a patient met the inclusion criteria and was enrolled in the study was the corresponding coded envelope opened and the code of the group given." (p. 152); no means of blinding participants/study personnel after randomisation and opening the envelope were described; it was assumed that according to the statement of the trial authors the current trial was not double‐blinded and that, therefore, there was a high risk regarding blinding participants/study personnel after randomisation |
| Blinding of outcome assessment (detection bias) | Low risk | "The rater was blinded to the kind of treatment patients received" (p. 151); "The data management personnel and statistical analyst participating this study were not aware of the kind of treatment patients received" (p. 153) |
| Incomplete outcome data (attrition bias) | Low risk | Drop‐out rate in total sample: 30.0%; although reasons for missing outcome data were partly likely to be related to true outcome, missing outcome data were balanced in number across intervention with similar reasons for missing data across groups; missing values were replaced by LOCF (p. 153) |
| Selective reporting (reporting bias) | Unclear risk | No protocol available; generally accepted outcomes were used |
| Other bias | Low risk | "No statistically significant difference was observed between the two groups at the baseline" (p. 153); "We chose a moderate dose of 20 mg of citalopram as the FDA [Food and Drug Administration] and European Medicines Agency have recently advised against using 40 mg of citalopram because of concerns of cardiotoxicity (08/24/2011 ‐ Drug Safety Communication3 ‐ FDA http://www.fda.gov/Safety/ |
| Methods | Randomised, parallel‐group, flexible‐dose trial | |
| Participants | n(randomised/ITT) = 68 Diagnosis:somatoform disorder (CCMD‐III) Inclusion criteria: SCL‐90 Total Score ≥ 3, CGI ‐ Severity Scale ≥ 3, aged 18‐58 years, time since diagnosis of somatoform disorder > 6 months Exclusion criteria: drug dependence, severe psychosis, paranoia, organic brain disease, physical illness, pregnant or breastfeeding women, epilepsy Age: mean (± SD) 37.04 ± 10.40 years, range ns; sex: 67.7% women; mean (± SD) length of time since diagnosis of a somatoform disorder: 168.49 ± 97.92 months; country: China; setting: inpatient | |
| Interventions | Venlafaxine (n = 36; SNRI; mean dose = 105.0 mg/day, max dose = 200 mg/day; no information regarding mode/frequency of administration provided) Amitriptyline (n = 32; TCA; mean dose = 168.0 mg/day, max dose = 200 mg/day; no information regarding mode/frequency of administration provided) Treatment duration: 42 days | |
| Outcomes | Primary outcome: No primary outcome was assessed Secondary outcomes: CGI ‐ Severity Scale (clinician‐rated): baseline, week 1, 2, 4, 6 All‐cause drop‐outs: n = 0 (venlafaxine), n = 0 (amitriptyline) Drop‐outs due to adverse effects: n = 0 (venlafaxine), n = 0 (amitriptyline) Reported drug‐related adverse effects: Venlafaxine: nausea (n = 20; 55.6%), dizziness (n = 10, 27.8%), anxiety (n = 7, 19.4%), insomnia (n = 5, 13.9%) Amitriptyline: dry mouth (n = 21, 65.6%), constipation (n = 17, 53.1%), blurred vision (n = 14, 43.8%), dizziness (n = 12, 37.5%), tremor (n = 9, 28.1%), sweating (n = 8, 25.0%), micturition disturbances (n = 1, 3.1%), abnormalities on electrocardiograph (n = 2, 5.6%). In the amitriptyline group, statistically significantly more participants experienced adverse effects compared with the venlafaxine group in treatment weeks 1, 2, and 6. No information about the total rate of participants with drug‐related adverse events was provided | |
| Notes | Funding: no information provided Underlined outcome measures and time points were considered in the meta‐analytical part of the review | |
| Risk of bias | ||
| Bias | Authors' judgement | Support for judgement |
| Random sequence generation (selection bias) | Unclear risk | "Patients [...] were randomly assigned to receive venlafaxine or amitriptyline" (p. 1177); no information provided about the random sequence generation |
| Allocation concealment (selection bias) | Unclear risk | No information about methods of allocation concealment provided |
| Blinding of participants and personnel (performance bias) | Unclear risk | No information about methods of blinding participants/study personnel provided |
| Blinding of outcome assessment (detection bias) | Unclear risk | No information about methods of blinding outcome assessment provided |
| Incomplete outcome data (attrition bias) | Low risk | All participants completed the study and there were no losses to follow‐up and no treatment withdrawals |
| Selective reporting (reporting bias) | Unclear risk | No protocol available; generally accepted outcomes were used |
| Other bias | Low risk | There were no significant differences in gender, age, and duration of symptoms between groups (p. 1177) |
| Methods | Randomised, parallel‐group, flexible‐dose trial | |
| Participants | n(randomised/ITT) = 68 Diagnosis: somatisation disorder (CCMD‐III) Inclusion criteria: inpatient of Wutaishan Hospital of Yangzhou (Jiangsu, China) between May 2001 and January 2002; HARS ≥ 14 Exclusion criteria: psychotic symptoms, severe brain injury, substance abuse, pregnant and breast‐feeding women Age: mean (± SD) 41.75 ± 9.57 years, range ns; sex: 77.9% women; mean (± SD) length of time since diagnosis of a somatoform disorder: 154.8 ± 82.3 months; country: China; setting: inpatient | |
| Interventions | Venlafaxine (n = 34; SNRI; mean dose: ns, max dose = 150 mg/day; no information regarding mode/frequency of administration provided) Doxepin (n = 34; TCA; mean dose: ns, max dose = 150 mg/day; no information regarding mode/frequency of administration provided) Treatment duration: 42 days | |
| Outcomes | Primary outcome: No primary outcome was assessed Secondary outcomes: HDRS ‐ Total Score, responder rate (clinician‐rated): baseline, week 1, 2, 4, 6 Treatment Emergent Symptom Scale: week 1, 2, 4, 6 All‐cause drop‐outs: n = 0 (venlafaxine), n = 0 (doxepin) Drop‐outs due to adverse effects: n = 0 (venlafaxine), n = 0 (doxepin) Reported drug‐related adverse effects: Venlafaxine: headache (n = 5, 14.7%), dry mouth (n = 5, 14.7%), insomnia (n = 3, 8.8%) Doxepin: fatigue, headache, dry mouth, constipation (no information about the number of participants with each adverse effect provided), micturition disturbances (n = 1, 2.9%), irregularities on electrocardiograph (n = 3, 8.8%) In the doxepin group, statistically significantly more participants experienced adverse effects compared with the venlafaxine group. 29.4% of the venlafaxine group and 82.4% of the doxepin group experienced adverse effects | |
| Notes | Funding: no information provided Ethics approval: no information provided Underlined outcome measures and time points were considered in the meta‐analytical part of the review | |
| Risk of bias | ||
| Bias | Authors' judgement | Support for judgement |
| Random sequence generation (selection bias) | Unclear risk | "Randomly assigned to venlafaxine group and doxepin group" (p. 590); no information provided about the random sequence generation |
| Allocation concealment (selection bias) | Unclear risk | No information about methods of allocation concealment provided |
| Blinding of participants and personnel (performance bias) | Unclear risk | No information about methods of blinding participants/study personnel provided |
| Blinding of outcome assessment (detection bias) | Unclear risk | No information about methods of blinding outcome assessment provided |
| Incomplete outcome data (attrition bias) | Low risk | All participants completed the study and there were no losses to follow‐up and no treatment withdrawals |
| Selective reporting (reporting bias) | High risk | No protocol available; only 2 outcomes (depression, adverse effects) were assessed, important common primary outcomes (such as severity of MUPS) were neglected |
| Other bias | Low risk | No differences were found between groups regarding age and symptom duration at baseline (p. 590) |
| Methods | Randomised, parallel‐group, flexible‐dose trial | |
| Participants | n(randomised/ITT) = 60 Diagnosis:somatoform disorder (CCMD‐III) Inclusion criteria: aged 24‐71 years Exclusion criteria: somatic disorder that explains somatoform symptoms, people who used or stopped using a specific medication (anti‐anxiety drugs, antidepressants, AP medication) for ≥ 2 weeks before treatment started Age: mean (± SD) 48.50 ± 10.92 years, range 23‐70 years; sex: 48.3% women; mean length of time since diagnosis of a somatoform disorder: ns; country: China; setting: ns | |
| Interventions | Paroxetine (n = 15; SNRI; mean dose: ns, max dose = 50 mg/day; twice/day; no information regarding mode of administration provided) Amitriptyline (n = 15; TCA; mean dose: ns, max dose = 150 mg/day; 3 times/day; no information regarding mode administration provided) Open paroxetine (n = 30; no information regarding mean dose, max dose, and frequency/mode of administration provided) Treatment duration: 42 days | |
| Outcomes | Primary outcome: No primary outcome was assessed Secondary outcomes: HDRS ‐ Total Score; anxiety, de‐realisation, retardation, weight, sleep disturbance score; responder rate (clinician‐rated): baseline, week 1, 2, 4, 6 All‐cause drop‐outs: n = 0 (paroxetine), n = 0 (amitriptyline), n = 0 (open paroxetine) Drop‐outs due to adverse effects: n = 0 (paroxetine), n = 0 (amitriptyline), n = 0 (open paroxetine) Reported drug‐related adverse effects: Paroxetine: dry mouth (n = 4, 26.6%), constipation (n = 2, 13.3%), micturition disturbances (n = 2, 13.3%), headache + nausea (n = 3, 20.0%), blurred vision (n = 2, 13.3%), headache (n = 4, 26.6%), insomnia (n = 1, 6.6%), increased blood pressure (n = 1, 6.6%), increased motor activity (n = 3, 20.0%) Amitriptyline: dry mouth (n = 6, 40.0%), constipation (n = 5, 33.3%), headache + nausea (n = 4, 26.6%), blurred vision (n = 7, 46.6%), headache (n = 5, 33.3%), insomnia (n = 4, 26.6%), hypersomnia (n = 7, 46.6%), increased blood pressure (n = 4, 26.6%) Open paroxetine: dry mouth (n = 8, 26.6%), constipation (n = 3, 10.0%), micturition disturbances (n = 1, 3.3%), headache + nausea (n = 5, 16.6%), blurred vision (n = 3, 10.0%), headache (n = 5, 16.6%), insomnia (n = 4, 13.3%), hypersomnia (n = 2, 6.6%), increased blood pressure (n = 3, 10.0%), increased motor activity (n = 4, 13.3%) No information about the total rate of participants with drug‐related adverse events was provided or if both treatment groups differed in the number of adverse effects | |
| Notes | Funding: medication in all 3 study groups was provided by the Zhejiang Huahai Pharmaceutical Co., Ltd Ethics approval: no information provided Underlined outcome measures and time points were considered in the meta‐analytical part of the review | |
| Risk of bias | ||
| Bias | Authors' judgement | Support for judgement |
| Random sequence generation (selection bias) | Unclear risk | "Patients […] were randomly assigned" (p. 733); no information provided about the random sequence generation |
| Allocation concealment (selection bias) | Unclear risk | No information about methods of allocation concealment provided |
| Blinding of participants and personnel (performance bias) | High risk | Differences in the frequency of which medication was administered between the groups are described (p. 733), therefore, it is assumed that no blinding of participants/study personnel was given |
| Blinding of outcome assessment (detection bias) | Unclear risk | No information about methods of blinding outcome assessment provided |
| Incomplete outcome data (attrition bias) | Low risk | All participants completed the study and there were no losses to follow‐up and no treatment withdrawals. |
| Selective reporting (reporting bias) | High risk | No protocol available; generally accepted outcomes were used; however, important common primary outcomes (such as severity of MUPS) were neglected |
| Other bias | Low risk | In this multiple‐intervention trial data were presented separately for each of the groups to which participants were randomised |
| Methods | Randomised, placebo‐controlled, double‐blind, flexible‐dose trial | |
| Participants | n(randomised) = 117, n(ITT) = 112 Diagnosis: MSD (≥ 3 medically unexplained symptoms with a frequency or severity beyond that expected for a known medical condition, with > 1 of these symptoms present for at least 6 months); symptoms were defined as medically unexplained when they were, in the opinion of the evaluating physician, 1. idiopathic, and 2. a symptom characteristic of a known medical disorder but reported at a frequency or severity considered out of proportion to that expected for the known medical condition; the MSD corresponded to the criteria of an undifferentiated somatoform disorder according to the DSM‐IV or ICD‐10) Inclusion criteria: ≥ 18 years; DSM‐IV diagnostic criteria for MDD, GAD, SAD, or a combination were fulfilled; met clinical criteria for MSD measured by the PHQ‐15; HDRS‐17 Total Score ≥ 14 and a HARS Total Score of ≥ 12; ≤ 25% decrease in the HDRS‐17 Total Score or HARS Total Score from screening to randomisation Exclusion criteria: history of inability to tolerate/failure to respond to ≥ 2 antidepressants of sufficient dose/duration of administration for the treatment of symptoms present in the current illness (depressive or anxiety); current/past history of mania, bipolar disorder, schizophrenia, or other psychotic disorder; history of seizure disorder other than childhood febrile seizure; evidence of serious or clinically unstable medical illness or psychiatric condition; previous intolerance or hypersensitivity to (extended‐release) venlafaxine; use of any non‐psychopharmacological drug with psychotropic effects within 7 days of study randomisation, an MAOI of fluoxetine within 30 days of screening, or electroconvulsive therapy within 3 months of screening; chronic use of analgesics containing opiates for > 6 months or for ≥ consecutive weeks prior screening; known of suspected alcohol or drug abuse within 6 months of screening; use of triptans, psychoactive herbal medications, or any other psychoactive drugs; or a positive urine drug test at screening; pregnant or breastfeeding women or women who expected becoming pregnant during the course of study or were sexually active and were not using contraception Ageb: mean (± SD) 47.00 ± 12.06 years, range ns; sexb: 80.4% women; mean length of time since diagnosis of a somatoform disorderb: ns; country: USA; setting: outpatient | |
| Interventions | Venlafaxine (n = 55b; SNRI; mean dose = 177 mg/day, max dose = 225 mg/day; 1 tablet once/day) Placebo (n = 57b) Treatment duration: 84 days | |
| Outcomes | Primary outcome: PHQ‐15 ‐ Total Score, responder rate (PHQ‐15 score < 10) (self rated): baseline, week 4, 8, 12 Secondary outcomes: HDRS‐17 (clinician‐rated): baseline, week 2, 4, 8, 12 Medical Outcomes Study Short‐Form 36‐Item Questionnaire ‐ physical health, mental health, bodily pain (self rated): baseline, week 12 Adverse effects reported by participants: baseline, week 1, 2, 4, 8, 12, post‐taper All‐cause drop‐outsb: n = 21 (venlafaxine extended release), n = 22 (placebo) Drop‐outs due to adverse effectsb: n = 4 (venlafaxine extended release), n = 10 (placebo) Reported drug‐related adverse effectsb: Venlafaxine: nausea (n = 16, 29.1%), headache (n = 13, 23.6%), fatigue (n = 8, 14.5%), dizziness (n = 6, 10.9%), constipation (n = 6, 10.9%), tremor (n = 6, 10.9%), back pain (n = 5, 9.1%), contusion (n = 4, 7.3%), decreased appetite (n = 3, 5.5%), hypoaesthesia (n = 3, 5.5%), upper abdominal pain (n = 3, 5.5%), yawning (n = 3, 5.5%), nasopharyngitis (n = 2, 3.6%), migraine (n = 2, 3.6%), urinary tract infection (n = 2, 3.6%) Placebo: nausea (n = 9, 15.8%), headache (n = 7, 12.3%), fatigue (n = 1, 1.8%), dizziness (n = 3, 5.3%), constipation (n = 3, 5.3%), back pain (n = 1, 1.8%), decreased appetite (n = 1, 1.8%), nasopharyngitis (n = 1, 1.8%), migraine (n = 1, 1.8%), urinary tract infection (n = 1, 1.8%) No information about the total rate of participants with drug‐related adverse events was provided. There was a somewhat higher incidence of adverse effects in the venlafaxine compared with placebo | |
| Notes | Funding: Wyeth Research, Collegeville, PA. Drs. Benattia and Graepel and Mr. Musgnung are employees of Wyeth; Dr. Kroenke has received grant/research support from Wyeth, Eli Lilly, and Pfizer and has received honoraria from Wyeth, Pfizer, Eli Lilly, and Astra Zeneca. Dr. Messina has received grant/research support from Vista Medical Research Inc. Dr. Graepel is a major stock shareholder of Wyeth. Ethics approval: obtained Underlined outcome measures and time points were considered in the meta‐analytical part of the review | |
| Risk of bias | ||
| Bias | Authors' judgement | Support for judgement |
| Random sequence generation (selection bias) | Unclear risk | "Randomized, double‐blind, placebo‐controlled study" (p. 74); no information provided about the random sequence generation |
| Allocation concealment (selection bias) | Unclear risk | No information about methods of allocation concealment provided |
| Blinding of participants and personnel (performance bias) | Unclear risk | "Randomized, double‐blind, placebo‐controlled study" (p. 74); insufficient information provided about who was and was not blinded |
| Blinding of outcome assessment (detection bias) | Unclear risk | No information about methods of blinding outcome assessment provided |
| Incomplete outcome data (attrition bias) | High risk | Drop‐out rate in total sample: 41.0%; only participants who received at least 1 post‐baseline efficacy evaluation were included in the ITT sample: originally, 117 participants were randomised (information about sample sizes of treatment and control group are missing), 5 participants abandoned treatment before the first outcome assessment and were excluded from ITT sample (n = 112) that was used for statistical analyses; although reasons for missing outcome data were partly likely to be related to true outcome, missing outcome data were balanced in number across intervention with similar reasons for missing data across groups; LOCF was applied for replacing missing values (p. 75) |
| Selective reporting (reporting bias) | High risk | SD of post‐assessment not provided; baseline values were not reported for all outcomes for which baseline‐to‐endpoint changes were reported; no protocol available; generally accepted outcomes were used |
| Other bias | Low risk | "The proportion of patients in each group who took at least 1 concomitant medication was almost identical" (p. 74); "Patients who could not tolerate at least 75mg/d at any time during the study were withdrawn from the study" (p. 74); "Baseline characteristics were similar between groups" (p. 75); used dose range in the current study was "within the dose range recommended for venlafaxine ER's [extended release] U.S. Food and Drug Administration (FDA‐) approved indications for MDD, GAD, and SAD" (p. 78) |
| Methods | Randomised, parallel‐group, flexible‐dose trial | |
| Participants | n(randomised/ITT) = 58 Diagnosis: somatoform disorder (CCMD‐III) Inclusion criteria: SCL‐90 Somatisation Subscale ≥ 3; HDRS Total Score ≥ 20; if participants also had other mental problems, somatic complaints had to appear before them; somatoform symptoms could not be explained by a somatic disorder Exclusion criteria: ns Age: mean (± SD) 41.73 ± 12.34 years, range 20‐68 years; sex: 60.3% women; mean (± SD) length of time since diagnosis of a somatoform disorder: 84.60 ± 59.2 months; country: China; setting: no information provided, but inpatient setting was assumed due to affiliations of study authors | |
| Interventions | Paroxetine + quetiapine (n = 30; SSRI + AP; mean dose paroxetine = 26.7 mg/day, mean dose quetiapine = 403.3 mg/day, max dose paroxetine = 40 mg/day, max dose quetiapine = 600 mg/day; no information about mode/frequency of administration provided) Paroxetine (n = 28; SSRI; mean dose = 27.30 mg/day, max dose = 40 mg/day; no information about mode/frequency of administration provided) Treatment duration: 56 days | |
| Outcomes | Primary outcome: SCL‐90 ‐ Somatisation Subscore (self rated): baseline, week 2, 8 Secondary outcomes: SCL‐90 ‐ Depression Subscore, Anxiety Subscore (self rated): baseline, week 2, 8 Drop‐outs due to adverse effects: n = 0 (paroxetine + quetiapine), n = 0 (paroxetine) Reported drug‐related adverse effects: n = 0 (paroxetine + quetiapine), n = 2 (paroxetine) Reported drug‐related adverse effects: Paroxetine + quetiapine: fatigue (26.7%), nausea (23.3%), dry mouth (16.7%) Paroxetine: nausea (26.9%), dizziness (23.1%), dry mouth (19.2%) No information about the total rate of participants with drug‐related adverse events was provided or if treatment groups differed in the number of adverse effects | |
| Notes | Funding: no information provided Ethics approval: no information provided Underlined outcome measures and time points were considered in the meta‐analytical part of the review | |
| Risk of bias | ||
| Bias | Authors' judgement | Support for judgement |
| Random sequence generation (selection bias) | Low risk | Participants were randomly assigned to 1 study groups by coin tossing, if it was the coin's head participants were assigned to paroxetine + quetiapine group, if it was the coin's tail it was the paroxetine group (p. 598) |
| Allocation concealment (selection bias) | Unclear risk | No information about methods of allocation concealment provided |
| Blinding of participants and personnel (performance bias) | Unclear risk | No information about methods of blinding participants/study personnel assessment provided |
| Blinding of outcome assessment (detection bias) | Unclear risk | No information about methods of blinding outcome assessment provided |
| Incomplete outcome data (attrition bias) | Unclear risk | There were only 2 drop‐outs in the paroxetine group (drop‐out rate: 3.4%); missing values were not replaced; statistical analyses are based only on the sample of participants who complied with the protocol |
| Selective reporting (reporting bias) | Unclear risk | No protocol available. Generally accepted outcomes were used |
| Other bias | Unclear risk | No information is provided |
| Methods | Randomised, placebo‐controlled, double‐blind, fixed‐dose trial | |
| Participants | n(randomised/ITT) = 80 Diagnosis: persistent somatoform pain disorder (ICD‐10) Inclusion criteria: aged 18‐65 years; pain existed ≥ 6 months Exclusion criteria: co‐exist depressive symptoms occurred prior to pain with HDRS‐17 ≥ 17; positive family history of pain disorder or depressive episodes; severe and unstable physical illnesses; use of antidepressants for the treatment of pain or depression; pregnancy Age: mean (± SD) 40.96 ± 12.69 years, range ns; sex: 57.5% women; mean (± SD) length of time since diagnosis of a somatoform disorder: 21.02 ± 19.02 months; country: China; setting: outpatient | |
| Interventions | Fluoxetine (n = 40; SSRI; mean dose = 20 mg/day, max dose = 10 mg/day; mode of administration: tablet; no information about frequency of administration provided) Placebo (n = 40) Treatment duration: 56 days | |
| Outcomes | Primary outcome: Medical Outcomes Study Pain Measures (self rated): baseline, week 2, 4, 8 Secondary outcomes: HDRS‐17 (clinician‐rated): baseline, week 2, 4, 8 Drop‐outs due to adverse effects: it was stated that 2 participants quit the study due to adverse effects. However, it is not unclear how these adverse effect‐related drop‐out were distributed between groups Reported drug‐related adverse effects: Fluoxetine: drowsiness (n = 1, 2.5%), dry mouth (n = 2, 5.0%), constipation (n = 1, 2.5%), sweating (n = 1, 2.5%), nausea or vomiting (n = 10, 25.0%) Placebo: dry mouth (n = 2, 5.0%), nasal obstruction (n = 1, 2.5%), sweating (n = 1, 2.5%), nausea or vomiting (n = 4, 10.0%), dizziness (n = 1, 2.5%) 35.0% of the fluoxetine group and 22.5% of the placebo group reported adverse effects. There was no statistically significant difference between groups regarding the adverse effects | |
| Notes | Funding: Shanghai Science and Technology Committee Ethics approval: no information provided Underlined outcome measures and time points were considered in the meta‐analytical part of the review | |
| Risk of bias | ||
| Bias | Authors' judgement | Support for judgement |
| Random sequence generation (selection bias) | Unclear risk | "All patients were randomly allocated to either treatment group or control group" (p. 1523); no information provided about the random sequence generation |
| Allocation concealment (selection bias) | Unclear risk | No information about methods of allocation concealment provided |
| Blinding of participants and personnel (performance bias) | Low risk | "Double‐blind, placebo‐controlled, […] study" (p. 1523); "placebo capsules […] having the same color, weight, shape and taste like the fluoxetine capsules" (p. 1523) |
| Blinding of outcome assessment (detection bias) | Unclear risk | No information about methods of blinding outcome assessment provided |
| Incomplete outcome data (attrition bias) | Unclear risk | Insufficient information was provided for incomplete outcome data; it was only stated that "intention‐to‐treat (ITT) analysis was performed and last observation carry forward (LOCF) was used for missing values" (p. 1524), thus it can be concluded that there were no losses to follow‐up; the only information about drop‐outs stated that "2 patients quit the study due to" adverse effects (p. 1524); however, it is not clear how these 2 patients were distributed among the fluoxetine and placebo groups |
| Selective reporting (reporting bias) | High risk | No protocol available; generally accepted outcomes were used; however, treatment effects were only reported for the primary outcome and not for HDRS‐17 (depression) |
| Other bias | Low risk | "No statistically significant difference was observed between the fluoxetine and placebo group at the baseline" (p. 1523) |
| Methods | Combined randomised, placebo‐controlled, parallel‐group, double‐blind, fixed‐dose trial | |
| Participants | n(randomised/ITT) = 182 Diagnosis: somatisation disorder (F45.0), undifferentiated somatoform disorder (F45.1) (ICD‐10) Inclusion criteria: aged ≥ 18 years; symptom duration ≥ 6 months Exclusion criteria: pregnancy or lactation; known allergies to trial medication; alcohol, drug, or medication abuse; concomitant participation in another clinical trial or < 4 weeks ago; historically known or clinical indication of: inflammatory or non‐inflammatory neurological disease, endocrinological disorders, inflammatory bowel disease, psychiatric disorders, rheumatic diseases, bronchial asthma, infectious diseases, serious conditions such as cancer/uncontrolled hypertension/heart failure/endocarditis, myocarditis/primary cardiomyopathies or severe cardiac dysrhythmias/severe hepatic diseases/renal insufficiency (creatinine > 3 mg/dL) or anaemia (haemoglobin < 9 g/dL)/severe nutritional disorders or vitamin deficiency illnesses Age: mean (± SD) 41.64 ± 14.79 years, range ns; sex: 57.5% women; mean length of time since diagnosis of a somatoform disorder: ns; nationality: Germany; country: no information provided, but outpatient setting was assumed due to information about recruitment source | |
| Interventions | Ze 185 4‐combination: butterbur root, valerian root, passionflower herb, lemon balm leaf (n = 53; NP; mean dose Ze 185 4‐combination = 330 mg/day, max dose Ze 185 4‐combination = 330 mg/day; 1 tablet 3 times/day) Ze 185 3‐combination: root, valerian root, passionflower herb, lemon balm leaf (n = 58; NP; mean dose Ze 185 3‐combination = 330 mg/day, max dose Ze 185 3‐combination = 330 mg/day; 1 tablet 3 times/day) Placebo (n = 61) Treatment duration: 14 days | |
| Outcomes | Primary outcome: Pain diary (self rated): days 1‐14 VAS anxiety (Rickels 1994) (self rated): baseline, day 14 Participant's rating of treatment efficacy: day 14 All‐cause drop‐outs: n = 4 (Ze 185 4‐combination), n = 6 (Ze 185 3‐combination), n = 5 (placebo) Drop‐outs due to adverse effects: n = 0 (Ze 185 4‐combination), n = 2 (Ze 185 3‐combination), n = 1 (placebo) Reported drug‐related adverse effects: Ze 185 4‐combination: vomiting (n = 1, 1.6%), flatulence (n = 1, 1.6%) Ze 185 3‐combination: nausea (n = 2, 3.4%), constipation (n = 1, 1.7%) Placebo: nausea (n = 1, 1.6%) 3.2% of the Ze 185 4‐combination group, 5.2% of the Ze 185 3‐combination, and 1.6% of the placebo group reported adverse effects. The distribution of adverse events did not differ significantly between groups | |
| Notes | Funding: study medication was supplied by Zeller AG (sponsor). Every investigator received a grant from the sponsor. The sponsor covered the costs for monitoring and data management (contract research organisation) as well as for the auditing (Chair of Medical Informatics, University of Giessen, Germany) Ethics approval: obtained Underlined outcome measures and time points were considered in the meta‐analytical part of the review | |
| Risk of bias | ||
| Bias | Authors' judgement | Support for judgement |
| Random sequence generation (selection bias) | Low risk | "The allocation to the respective treatment group was carried out based on a computer‐generated randomization list" (p. 1305); "Stratification was carried out using the computer program STATXACT" (p. 1305) |
| Allocation concealment (selection bias) | Unclear risk | "Patients were assigned a patient number and the corresponding numbered medication box in the order of their admission into the trial" (p. 1305); insufficient information about methods of allocation concealment provided |
| Blinding of participants and personnel (performance bias) | Low risk | "Tablets of all three treatment groups were identical in color, odor, and consistency" (p.1304); "The double‐blind nature of the trial was guaranteed by adherence to standard procedures and audits" (p. 1305) |
| Blinding of outcome assessment (detection bias) | Unclear risk | No information about methods of blinding outcome assessment provided |
| Incomplete outcome data (attrition bias) | Low risk | Drop‐out rate in total sample: 8.2%; "The ITT population included all randomized patients who used treatment at least once and had a postbaseline value for comparison" (p. 1305), however, it was unclear if and how many participants were not included to the ITT sample for this reason, in Table 2 (p. 1305). The difference between the sample of randomised participants and the ITT sample was explained only by justifications such as withdrawal of consent or adverse events; although reasons for missing outcome data were partly likely to be related to true outcome, missing outcome data were balanced in number across intervention with similar reasons for missing data across groups; LOCF was used to replace missing values (p. 1305) |
| Selective reporting (reporting bias) | High risk | No protocol available; treatment effects are only reported for the secondary outcomes such as depression and anxiety; important primary outcomes such as severity of physical symptoms were not assessed |
| Other bias | Low risk | At baseline, there were no significant differences between groups regarding demographic or clinical characteristics (p. 1305); "At the end of the trial, 99% of patients had taken at least 75% of the medication" (p. 1305); in this multiple‐intervention trial data were presented separately for each of the groups to which participants were randomised |
| Methods | Randomised, placebo‐controlled, double‐blind, flexible‐dose trial | |
| Participants | n(randomised/ITT) = 51 Diagnosis: MSD (bothersome medically unexplained ≥ 3 symptoms within the past month, together with a history of ≥ 1 somatoform symptoms for at ≥ 2 years; the MSD corresponded to the criteria of an undifferentiated somatoform disorder according to the DSM‐IV or ICD‐10) Inclusion criteria: ns Exclusion criteria: people with somatic symptoms that were judged to be secondary to a psychiatric disorder other than MSD, current or past psychotic disorder, significant suicidal risk, any serious unstable medical illness (as assessed by medical history, physical examination, and standard laboratory investigations), pregnancy or breastfeeding, use of recent or concomitant psychotropics, concurrent cognitive‐behavioural therapy Age: mean (± SD) 39.64 ± 9.75 years, range 18‐65 years; sex: 57.5% women; mean length of time since diagnosis of a somatoform disorder: ns; country: South Africa; setting: no information provided, but outpatient setting was assumed due to information about recruitment source | |
| Interventions | Escitalopram (n = 25; SSRI; mean dose = 14.4 mg/day, max dose = 20 mg/day; no information about mode/frequency of administration provided) Placebo (n = 26) Treatment duration: 84 days | |
| Outcomes | Primary outcomes: PHQ (self rated): baseline, week 2, 4, 6, 8, 12 PHQ ‐ responder rate (PHQ score < 10) (self rated): week 2, 4, 6, 8, 12 Visual Analogue Pain Rating Scale (Katz 1999) (self rated): baseline, week 4, 8, 12 CGI ‐ Improvement Scale (clinician‐rated): week 2, 4, 6, 8, 12 CGI ‐ Severity Scale ‐ remission rate (clinician‐rated): week 2, 4, 6, 8, 12 All‐cause drop‐outs: n = 1 (escitalopram), n = 0 (placebo) Drop‐outs due to adverse effects: n = 1 (escitalopram), n = 0 (placebo) Reported drug‐related adverse effects: Escitalopram: Week 0‐2: headache (n = 11, 44%), nausea (n = 10, 40%), abdominal discomfort (n = 3, 12%), insomnia (n = 3, 12%), yawning (n = 3, 12%), nasopharyngitis (n = 2, 8%), diarrhoea (n = 2, 8%), tremor/anxiety (n = 2, 8%), drowsiness (n = 2, 8%), dry mouth (n = 2, 8%) Placebo: Week 0‐2: headache (n = 7; 27%), nausea (n = 6; 23%), abdominal discomfort (n = 2; 8%), insomnia (n = 1; 4%), yawning (n = 1; 4%), nasopharyngitis (n = 4; 15%), diarrhoea (n = 3; 12%), tremor/anxiety (n = 1; 4%), drowsiness (n = 2; 8%), dry mouth (n = 1; 4%) No information about the total rate of participants with drug‐related adverse events was provided or if both treatment groups differed in the number of adverse effects | |
| Notes | Funding: H. Lundbeck A/S; at the time this study was conducted, Professor Stein, Professor Seedat, and Dr. Muller were funded by the Medical Research Council of South Africa Ethics approval: obtained Underlined outcome measures and time points were considered in the meta‐analytical part of the review | |
| Risk of bias | ||
| Bias | Authors' judgement | Support for judgement |
| Random sequence generation (selection bias) | Low risk | "Patients were randomly assigned (via computer‐generated randomization lists)" (p. 44) |
| Allocation concealment (selection bias) | Unclear risk | No information about methods of allocation concealment provided |
| Blinding of participants and personnel (performance bias) | Low risk | "Escitalopram and placebo medication were identical in appearance" (p. 44) |
| Blinding of outcome assessment (detection bias) | Unclear risk | No information about methods of blinding outcome assessment provided |
| Incomplete outcome data (attrition bias) | Low risk | Drop‐out rate in total sample: 2.0%; reasons for missing outcome data were very unlikely to be related to true outcome (there was only 1 participant withdrawn due to adverse events in the escitalopram group); missing outcome data were balanced in number across groups with similar reasons for missing data across groups; LOCF was be used to replace missing values (p. 45); trial authors stated that ITT included "all randomized patients with at least one valid post‐baseline efficacy measure" (p. 45). However, there was no difference in the number of randomised participants and the ITT sample. Therefore, it was concluded that all randomised participants had at least 1 valid post‐baseline efficacy measure |
| Selective reporting (reporting bias) | Low risk | No protocol available; generally accepted outcomes were used and data were reported for a broad variety of primary and secondary outcomes (self report and clinician‐rated scales) |
| Other bias | Low risk | "The trial consisted of a 2‐week screening phase for medication washout (if required) and for obtaining results of selected laboratory investigations" (p. 44); "no significant difference existed in the extent of comorbidity across the medication and placebo groups" (p. 45) |
| Methods | Randomised, placebo‐controlled, double‐blind fixed‐dose triala | |
| Participants | n(randomised) = 175, n(ITT) = 173 Diagnosis: somatisation disorder (F45.0), undifferentiated somatoform disorder (F45.1), persistent somatoform pain disorder (F45.3) (ICD‐10) Inclusion criteria: aged 18‐65 years; baseline HARS ‐ Somatisation Score ≥ 12; baseline HARS ‐ Psychic Subscore ≥ 5 and < HARS ‐ Somatisation Score; baseline HDRS ‐ Total Score ≤ 12; baseline SOMS‐2 score ≥ 4 (men) and ≥ 6 (women); SOMS‐7 score 12‐30; standardised good clinical practice criteria for study participation Exclusion criteria: people exhibiting a decrease in SOMS‐7 score of 6 during the placebo run‐in phase ("placebo responders"), current diagnoses of major depression, drug and alcohol abuse, epilepsy, organic mental disorder, any other serious unstable acute or chronic medical condition, current or anamnestic diagnosis of schizophrenia or schizoaffective disorder, use of psychotropic drugs 4 weeks before and during the study, concurrent psychotherapy, increased suicidal risk, need for concomitant treatment with phenprocoumon or cyclosporin (or both) Ageb: mean (± SD) 47.65 ± 11.35 years, range ns; sexb: 57.5% women; mean length of time since diagnosis of a somatoform disorder: ns; country: Germany; setting: outpatient | |
| Interventions | St. John's wort (n = 87b; NP; mean dose = 600 mg/day, max dose = 600 mg/day; 1 tablet twice/day) Placebo (n = 86b) Treatment duration: 42 days | |
| Outcomes | Primary outcomes: SOMS‐7 (self rated): baseline, week 2, 4, 6 Secondary outcomes: HARS ‐ Psychic Anxiety Score, Somatisation Score (clinician‐rated): baseline, week 2, 4, 6 CGI ‐ Improvement Scale (clinician‐rated): baseline, week 2, 4, 6 Responder rate (decrease of ≥ 50% of the SOMS‐7 and 'very much better'/'much better' rating on the CGI ‐ Improvement Scale): week 6 All‐cause drop‐outs: n = 5 (St. John's wort), n = 6 (placebo) Drop‐outs due to adverse effects: n = 0 (St. John's wort), n = 0 (placebo) Reported drug‐related adverse effects: St. John's wort: nightmares (n = 1, 1.1%) Placebo: no adverse effects Tolerability and safety of St. John's wort treatment was comparable to that of placebo. 1.1% of the St. John's wort and 0% of the placebo group reported adverse effects | |
| Notes | Funding: Medical Services, Berlin, Germany (Marcus Mannel); Lichtwer Pharma GmbH, Berlin, Germany (Harald Murck); data analysis and experimental design, Gauting, Germany (Volker W. Rahlfs); Study medications were provided by Lichtwer Pharma AG (Berlin, Germany) Ethics approval: obtained Underlined outcome measures and time points were considered in the meta‐analytical part of the review | |
| Risk of bias | ||
| Bias | Authors' judgement | Support for judgement |
| Random sequence generation (selection bias) | Low risk | "Randomized, placebo‐controlled […] trial" (p. 539); "Patients [...] were randomly assigned in a 1:1 ratio to receive either SJW [St. John's wort] or placebo" (p. 539); "Computer‐aided randomization and preparation of a coding list (Rancode; Wiedey, Konstanz, Germany) was performed in blocks of six" (p. 539) |
| Allocation concealment (selection bias) | Low risk | "Randomization […] was performed […] by the independent Quality Assurance Unit of the sponsor" (p. 539); "Blistered study medication and medication containers were labeled sequentially according to the coding list by the manufacturing department of the sponsor and provided to the investigators in blocks of six" (p. 539) |
| Blinding of participants and personnel (performance bias) | Low risk | "Double‐blind trial" (p. 539); "placebo tablets identical in shape, size, taste, and color were administered" (p. 541); "Tolerability ratings and adverse events of SJW LI 160 were indistinguishable from corresponding placebo figures. Therefore, both investigators and patients could not have been unblinded by recognizing a specific side effect pattern of SJW LI 160, which further validates the study results" (p. 543) |
| Blinding of outcome assessment (detection bias) | Low risk | All investigators, personnel of contracted partners and of the sponsor who were actively involved in the trial were blinded to group assignment until the code was broken at the end of the trial. Success of blinding was not been evaluated systematically in this trial, because experience from previous trials with identical formulations has revealed good results (p. 539) |
| Incomplete outcome data (attrition bias) | Low risk | Drop‐out rate in total sample: 7.5%; 175 participants were originally randomised (St. John's wort: n = 87, placebo: n = 88); however, due to loss of participant documentation for visits 1‐4 following a fire the ITT population comprises only 173 participants (St. John's wort: n = 87, placebo: n = 86); reasons for missing outcome data were very unlikely to be related to true outcome (no participant was withdrawn due to adverse events in either groups), missing outcome data were balanced in number with similar reasons for missing data across groups; "Results in the PP [treated per protocol] population were nearly identical, thereby corroborating the ITT results" (p. 542); "Missing values were handled conservatively according to the Last Value Carried Forward (LVCF)" (p. 541) |
| Selective reporting (reporting bias) | Unclear risk | No protocol available; generally accepted outcomes were used |
| Other bias | High risk | "Patients exhibiting a decrease in SOMS‐7 score 6 during the placebo run‐in phase ("placebo responders") were not to be included in the trial" (p. 539) this placebo run‐in phase was single‐blind, randomisation was conducted just after the placebo run‐in phase, 9 participants were excluded from the trial after this placebo run‐in phase; "Baseline demographics and clinical characteristics did not differ significantly between groups, except for small‐sized differences regarding sex ratio and CGI subscore "severity" " (p. 539); "It further remains open whether 600 mg of SJW [St. John's wort] daily is the optimal dose and if higher dosages may result in increased efficacy" (p. 545) |
| Methods | Randomised, parallel‐group, flexible‐dose trial | |
| Participants | n(randomised/ITT) = 80 Diagnosis: somatoform pain disorder (CCMD‐III) Inclusion criteria: ns Exclusion criteria: people whose pain was caused by depression, anxiety, schizophrenia, lung or physical illness Age: mean (± SD) 37.85 ± 9.71 years, range ns; sex: 58.8% women; mean (± SD) length of time since diagnosis of a somatoform disorder: 39.8 ± 7.10 months; country: China; setting: inpatient | |
| Interventions | Mirtazapine (n = 40; NaSSA; mean dose: ns, max dose = 275 mg/day; medication was administered twice/day; no information regarding mode of administration provided) Amitriptyline (n = 40; TCA; mean dose: ns, max dose: ns; medication was administered twice/day; no information regarding mode of administration provided) Treatment duration: 56 days | |
| Outcomes | Primary outcome: No primary outcome was assessed Secondary outcomes: HDRS ‐ Total Score, responder rate (clinician‐rated): baseline, week 1, 2, 4, 6, 8 All‐cause drop‐outs: n = 0 (mirtazapine), n = 0 (amitriptyline) Drop‐outs due to adverse effects: n = 0 (mirtazapine), n = 0 (amitriptyline) Reported drug‐related adverse effects: Mirtazapine: dry mouth, constipation, micturition disturbances, palpitation, sexual difficulty, electrocardiograph irregularities Amitriptyline: dizziness, hypersomnia, increased appetite, weight gain, limb swallow, hypertension In week 1 in the mirtazapine group, the Treatment Emergent Symptom Scale score was significantly higher than in amitriptyline group; in week 2, 4, 6, and 8 the score was significantly higher in amitriptyline compared with mirtazapine. No information about the total rate of participants with drug‐related adverse events was provided | |
| Notes | Funding: no information provided Ethics approval: no information provided Underlined outcome measures and time points were considered in the meta‐analytical part of the review | |
| Risk of bias | ||
| Bias | Authors' judgement | Support for judgement |
| Random sequence generation (selection bias) | Unclear risk | Trial authors stated that participants were randomly assigned to the 2 groups (p. 560); no information provided about random sequence generation |
| Allocation concealment (selection bias) | Unclear risk | No information about methods of allocation concealment provided |
| Blinding of participants and personnel (performance bias) | Unclear risk | No information about methods of blinding participants/study personnel provided |
| Blinding of outcome assessment (detection bias) | Unclear risk | No information about methods of blinding outcome assessment provided |
| Incomplete outcome data (attrition bias) | Low risk | All participants completed the study and there were no losses to follow‐up and no treatment withdrawals |
| Selective reporting (reporting bias) | High risk | No protocol available; generally accepted outcomes were used; however, treatment effects were only reported for the secondary outcomes such as depression, adverse effects, and general symptom improvement; important primary outcomes such as severity of physical symptoms were not assessed |
| Other bias | Low risk | There was no significant difference between groups regarding demographic variables; 1 week before treatment started participants were instructed to wash‐out other medication (p. 560); groups did not significantly differ in HDRS scores before treatment (p. 560) |
| Methods | Combined randomised, placebo‐controlled, parallel‐group, double‐blind, flexible‐dose trialc | |
| Participants | n(complete cases) = 50 Diagnosis: somatoform pain disorder (DSM‐III‐R) Inclusion criteria: pain for ≥ 1 month that was not responding adequately to appropriate treatment; absence of objective evidence for the presence of any significant organic disease sufficient to explain the presence or severity of the pain experience and degree of disability; impairment of functioning by at least 25% taking into account biological, personal, social, occupational, and recreational aspects; absence of a psychotic illness (including major depressive syndrome), organic brain syndrome, or alcohol dependence; adequate comprehension of English; absence of any physical disorder contraindicating the use of a TCA Exclusion criteria: major depression Age: ns; sex: ns; mean length of time since diagnosis of a somatoform disorder: ns; country: Australia; setting: outpatient | |
| Interventions | Amitriptyline + support (n: ns; TCA; mean dose: ns, max dose: ns; medication was administered as tablets; no information regarding frequency of administration provided) Placebo (n: ns) Treatment duration: 84 days | |
| Outcomes | Primary outcomes (all primary outcome measures were assessed at baseline, week 4, 8, 12, month 3, 6, 12) Global pain assessment over the last week (location, intensity, character, distribution, chronicity, tune relationship) (self rated) McGill Pain Questionnaire (self rated) Pain diary (VAS over 2 weeks) Secondary outcomes (all secondary outcome measures were assessed at baseline, week 4, 8, 12, month 3, 6, 12): VAS‐productivity (self rated) VAS on mean intensity of pain, amount of pain, and degree of impairment or 'productivity' (self rated) Reported drug‐related adverse effects: no information provided | |
| Notes | Funding: financial support for the study by National Health and Medical Research Council Ethics approval: obtained Underlined outcome measures and time points were considered in the meta‐analytical part of the review | |
| Risk of bias | ||
| Bias | Authors' judgement | Support for judgement |
| Random sequence generation (selection bias) | Low risk | Participants were "allocated to 1 of 4 treatment groups with the use of a table of random numbers" (p. 6) |
| Allocation concealment (selection bias) | Unclear risk | No information about methods of allocation concealment provided |
| Blinding of participants and personnel (performance bias) | Unclear risk | "At the end of therapy, i.e., after 12 weeks, the therapist broke the code to establish whether the patient had been on the active or inert preparation and wrote a summary of the treatment and progress with a recommendation concerning further management" (p. 6); insufficient information about blinding of participants provided |
| Blinding of outcome assessment (detection bias) | Low risk | "Patients were followed up […] by one of the research assistants who had not carried out the baseline measures and who was also blind to the drug treatment and, as far as possible, to the non‐drug treatment" (p. 7) |
| Incomplete outcome data (attrition bias) | High risk | In this study, the following 4 groups were examined: amitriptyline + psychotherapy (n = 26); amitriptyline + support (n = 26); placebo tablet + psychotherapy (n = 26); placebo tablet + support (n = 24). In the context of the current review, only results for amitriptyline + support vs. placebo tablet + support were considered, originally, 129 participants were randomised to the 4 study groups, 102 participants completed the trial, drop‐out rates for the single groups were given only as percentage (amitriptyline + support group: 25%, placebo + support group: 31%). Because ITT sample size in the single groups was not mentioned, percentages cannot be converted in absolute values. Trial authors only state that "There was no significant difference in dropout numbers between the 4 groups" (p. 9); no information was provided about how drop‐outs were distributed between the 4 study groups, therefore, no drop‐out rate can be estimated; statistical analyses were based only on the sample of participants who complied with the protocol |
| Selective reporting (reporting bias) | High risk | Study authors only evaluated outcome measures based on 3 ratings of the participants of improvement in well‐being, pain, activity, as well as the following 3 continuous variables (VAS): mean intensity of pain, amount of pain, and degree of impairment or 'productivity'; scores on validated scales such as McGill Pain Questionnaire, Pain diary, Zung Depression Scale, or Spielberger State‐Trait Anxiety Questionnaire were only assessed at baseline but were not used to evaluate the therapy efficacy, these variables were only used as predictors of therapy efficacy (p. 7); follow‐up month 3, 6, and 12 post treatment was reported in the study report but no follow‐up data were provided; no protocol available |
| Other bias | High risk | "Patients were offered treatments like transcutaneous nerve stimulation, physiotherapy, regional nerve blocks, to psychopharmacotherapy and psychotherapy, in each case, the treatment is offered for a finite period of time after which the patient returns to the panel for a review. Where it was thought that musculoligamentous or myofascial problems had not been adequately treated physiotherapeutically this was provided before patients were entered into the trial, even if considered suitable" (p. 5); participants who were admitted to the study were compared with people who were not: "Those admitted were more likely to be women, more highly educated, more likely to be employed, less likely to be on an invalidity pension and younger" (p. 8); "marked baseline differences" between the [study] groups regarding specific dependent variables were identified (p. 11); in this multiple‐intervention trial data were presented separately for each of the groups to which participants were randomised |
| Methods | Randomised, parallel‐group, flexible‐dose triale | |
| Participants | n(randomised/ITT) = 21 Diagnosis: pain disorder (DSM‐IV‐TR) Inclusion criteria: ns Exclusion criteria: ns Aged: mean (± SD) 48.17 ± 14.26 years, range ns; sexd: 58.8% women; mean length of time since diagnosis of a somatoform disorder: ns; country: Japan; setting: outpatient | |
| Interventions | Paroxetine (n = 11; SSRI; mean dose: ns, max dose = 40 mg/day; no information about mode/frequency of administration provided) Milnacipran (n = 10; SNRI; mean dose: ns, max dose = 150 mg/day; no information about mode/frequency of administration provided) Treatment duration: 56 days | |
| Outcomes | Primary outcome: Short‐Form McGill Pain Questionnaire ‐ Total Pain Rating Index, Present Pain Intensity, VAS (self rated): baseline, week 4, 8 Secondary outcomes: HDRS (clinician‐rated): baseline, week 4, 8 All‐cause drop‐outs: n = 3 (paroxetine), n = 5 (milnacipran) Drop‐outs due to adverse effects: n = 3 (paroxetine), n = 2 (milnacipran) Reported drug‐related adverse effects: no information provided | |
| Notes | Funding: no information provided Ethics approval: no information provided Underlined outcome measures and time points were considered in the meta‐analytical part of the review | |
| Risk of bias | ||
| Bias | Authors' judgement | Support for judgement |
| Random sequence generation (selection bias) | Unclear risk | "Patients were randomly assigned" (p. S543); no information provided about the random sequence generation |
| Allocation concealment (selection bias) | Unclear risk | No information about methods of allocation concealment provided |
| Blinding of participants and personnel (performance bias) | Unclear risk | No information about methods of blinding participants/study personnel provided |
| Blinding of outcome assessment (detection bias) | Unclear risk | No information about methods of blinding outcome assessment provided |
| Incomplete outcome data (attrition bias) | High risk | Drop‐out rate in total sample: 38.1%; although reasons for missing outcome data were partly likely to be related to true outcome, missing outcome data were balanced in number across intervention with similar reasons for missing data across groups; however, sample size was very small and the drop‐out rate was very high, therefore, the chance of a bias produced by incomplete data was high; statistical analyses were based only on the sample of participants who complied with the protocol |
| Selective reporting (reporting bias) | High risk | No protocol available; generally accepted outcomes were used; for this trial only a conference abstract was available in which data were only reported completely for 1 outcome (severity of pain) |
| Other bias | Unclear risk | No information was provided |
| Methods | Randomised, placebo‐controlled, double‐blind fixed‐dose triala | |
| Participants | n(randomised) = 208; n(ITT) = 200 Diagnosis: somatisation disorder (F45.0), undifferentiated somatoform disorder (F45.1), persistent somatoform pain disorder (F45.3) (ICD‐10) Inclusion criteria: aged 18‐76 years, no significant actual or history of other Axis I diagnoses (e.g. panic disorder, MDD, schizophrenia, substance abuse), no relevant concomitant diseases (e.g. epilepsy, severe renal or hepatic impairment, cancer), HARS ‐ Somatisation Score ≥ 12 and ≥ 5 points than HARS ‐ Psychic Score; HDRS ≤ 24 Exclusion criteria: pregnant or breastfeeding women, contraindication to the use of the study medication Ageb: mean (± SD) 45.61 ± 13.00 years, range ns; sexb: 63.5% women; mean length of time since diagnosis of a somatoform disorder: ns; country: Germany; setting: ns | |
| Interventions | Opipramol (n = 104; TCA; mean dose = 200 mg/day, max dose = 200 mg/day; 1 capsule twice/day) Placebo (n = 104) Treatment duration: 42 days | |
| Outcomes | Primary outcomes: SCL‐90‐R ‐ Somatic Subscore (self rated): day ‐7, 0, 7, 14, 28, 42 HARS ‐ Somatic Score (clinician‐rated): day ‐7, 0, 7, 14, 28, 42 Secondary outcomes: HARS ‐ Total Score, Psychic Score (clinician‐rated): day ‐7, 0, 7, 14, 28, 42 All‐cause drop‐outs: n = 14 (opipramol), n = 13 (placebo) Drop‐outs due to adverse effects: n = 3 (opipramol), n = 3 (placebo) Reported drug‐related adverse effects: Opipramol:single adverse effects with a frequency of ≥5%: tiredness (n = 9, 9.1%), dizziness (n = 5, 5.1%), nausea (n = 3, 3.0%), back pain (n = 5, 5.1%); sum of adverse effects in 1 category with a frequency of ≥5%: body as whole (n = 12, 12.1%), central or peripheral nervous system (n = 7, 7.1%), gastrointestinal system (n = 6, 6.1%), skeletomuscular system (n = 14, 14.1%) Placebo:single adverse effects with a frequency of ≥5%: tiredness (n = 2, 2.0%), dizziness (n = 8, 7.9%), gastroenteritis (n = 6, 5.9%), nausea (n = 6, 5.9%), back pain (n = 3, 3.0%); sum of adverse effects in 1 category with a frequency of ≥5%: body as whole (n = 4, 4.0%), central or peripheral nervous system (n = 13, 12.9%), gastrointestinal system (n = 21, 20.8%), skeletomuscular system (n = 7, 6.9%) 37.0% of the opipramol group and 38.0% of the placebo group reported adverse effects. No information if treatment groups differed in the number of adverse effects was provided | |
| Notes | Funding: Novartis Pharma GmbH, Nürnberg, Germany, was involved in the trial (Klaus Dieter Stoll is employee of Novartis Pharma GmbH); however, it was not stated how Ethics approval: obtained Underlined outcome measures and time points were considered in the meta‐analytical part of the review | |
| Risk of bias | ||
| Bias | Authors' judgement | Support for judgement |
| Random sequence generation (selection bias) | Unclear risk | "Randomized, placebo‐controlled trial" (p. 214); no information provided about the random sequence generation |
| Allocation concealment (selection bias) | Unclear risk | No information about methods of allocation concealment provided |
| Blinding of participants and personnel (performance bias) | Unclear risk | "Double‐bind treatment phase" (p. 212); no sufficient information provided about who was and was not blinded |
| Blinding of outcome assessment (detection bias) | Unclear risk | No information about methods of blinding outcome assessment provided |
| Incomplete outcome data (attrition bias) | High risk | Drop‐out rate in total sample: 13.0%; originally, 208 participants were randomised (opipramol group: n = 104, placebo group: n = 104), according to the trial authors' definition of the ITT sample (no further information about this definition provided) 8 participants were excluded from ITT sample (n = 200) that was used for statistical analyses; although reasons for missing outcome data were partly likely to be related to true outcome, missing outcome data were balanced in number across intervention with similar reasons for missing data across groups; "The last observation was carried forward (LOCF)" (p. 213) was used to replace missing values |
| Selective reporting (reporting bias) | Low risk | No protocol available; generally accepted outcomes were used and data were reported for a broad variety of primary and secondary outcomes |
| Other bias | High risk | "Compliance was assessed by immediate pill‐count at visits as well as by the results of opipramol plasma concentration measurements integrated into the data set when the whole monitoring procedures were terminated" (p. 212); "There were no relevant differences between the treatment groups" for initial symptom severity (p. 214); "[…] patients underwent a 7‐day, single blind, washout period with four placebo capsules per day […]. After this 7‐day period, placebo responders (HAMA [HARS]‐SOM decrease of more than 4 points) had to be excluded" (p. 212); the randomisation took place after the placebo run‐in phase; however, it is unclear how many participants were excluded after this placebo run‐in phase |
| Methods | Randomised, placebo‐controlled, double‐blind fixed‐dose triala | |
| Participants | n(randomised) = 151; n(ITT) = 149 Diagnosis: somatisation disorder (F45.0), undifferentiated somatoform disorder (F45.1), persistent somatoform pain disorder (F45.3) (ICD‐10) Inclusion criteria: aged 18‐65 years; HARS ‐ Somatic Scale ≥ 12 and ≥ 5 points than HARS ‐ Psychic Scale; HDRS ≤ 24 Exclusion criteria: additional diagnosis of depression, schizophrenia, schizo‐affective disorder, dementia; pregnancy; nursing mothers; concomitant treatment with psychopharmacological active compounds and relevant physical diseases (i.e. severe cardiac, renal or hepatic dysfunction or disease, underlying malignant disease, bone‐marrow depression or dyscrasia, clinically manifest liver dysfunction, renal insufficiency [serum creatinine > 2.0 mg/dL], non‐compensated cardiac insufficiency, epilepsy, or organic brain disease), and laboratory value deviations (i.e. > 10% deviation from the upper/lower normal ranges of erythrocytes, haemoglobin, and haematocrit, leukocytopenia (< 2500 cells/mm3), granulocytopenia (< 1500 cells/mm3), thrombocytopenia (< 100,000 cells/mm3), GOT > 90 IU/L, bilirubin > 1.5 mg/dL) Ageb: mean (± SD) 47.74 ± 12.00 years, range ns; sexb: 62.0% women; mean length of time since diagnosis of a somatoform disorder: ns; country: Germany; setting: outpatient | |
| Interventions | St. John's wort extract LI160 (n = 75; NP; mean dose = 600 mg/day, max dose = 600 mg/day; 1 capsules twice/day) Placebo (n = 74) Treatment duration: 42 days | |
| Outcomes | Primary outcomes: SCL‐90‐R ‐ Somatic Subscore (self rated): day ‐7, 0, 14, 28, 42 HARS ‐ Somatic Score (clinician‐rated): day ‐7, 0, 14, 28, 42 Secondary outcomes: HARS ‐ Total Score, Psychic Score (clinician‐rated): day ‐7, 0, 14, 28, 42 CGI ‐ Severity Scale (clinician‐rated): 0, 14, 28, 42 All‐cause drop‐outs: n = 14 (St. John's wort extract), n = 13 (placebo) Drop‐outs due to adverse effects: n = 0 (St. John's wort extract), n = 2 (placebo) Reported drug‐related adverse effects: St. John's wort extract: abdominal pain (n = 1, 1.3%), arthritis (n = 1, 1.3%), arrhythmia (n = 1, 1.3%), bronchitis (n = 2, 2.7%), cystitis (n = 1, 1.3%), headache (n = 2, 2.7%), neuralgia (n = 1, 1.3%) Placebo: back pain (n = 3, 3.9%), gastroenteritis (n = 1, 1.3%), influenza‐like symptoms (n = 1, 1.3%) 10.7% of the St. John's wort extract group and 5.4% of the placebo group reported adverse effects. No information if treatment groups differed in the number of adverse effects was provided. No statistically significant differences between groups were found regarding the physicians' and participants' ratings of the tolerability of treatments | |
| Notes | Funding: Lichtwer Pharma AG, Berlin, Germany, was involved in the trial (Hans Murck is employee of Lichtwer Pharma AG); however, it was not stated how Ethics approval: obtained Underlined outcome measures and time points were considered in the meta‐analytical part of the review | |
| Risk of bias | ||
| Bias | Authors' judgement | Support for judgement |
| Random sequence generation (selection bias) | Unclear risk | "Randomised treatment phase" (p. 295); no information provided about random sequence |
| Allocation concealment (selection bias) | Unclear risk | No information about methods of allocation concealment provided |
| Blinding of participants and personnel (performance bias) | Unclear risk | "Double blind, randomised treatment phase" (p. 295); insufficient information provided about who was and was not blinded |
| Blinding of outcome assessment (detection bias) | Unclear risk | No information about methods of blinding outcome assessment provided |
| Incomplete outcome data (attrition bias) | Low risk | Drop‐out rate in total sample: 17.9%; originally, 151 participants were randomised; only participants who received at least 1 outcome assessment were included in the ITT sample: no information was provided how the original 151 participants were distributed between the 2 groups, 2 participants abandoned treatment before the first outcome assessment and were excluded from ITT sample (n = 149) that was used for statistical analyses; "During the double‐blind treatment phase, no participant was excluded in the LI160 group, two drop‐outs occurred in the placebo group [one due to a serious adverse event (apoplexy), the other due to an adverse event (swelling and burning underneath the eyes)] (p. 296); reasons for missing outcome data were very unlikely to be related to true outcome (only 2 participants withdrew due to adverse events in the placebo group); "The last observation was carried forward" (p. 296) was used to replace missing values |
| Selective reporting (reporting bias) | Low risk | No protocol available; generally accepted outcomes were used and data were reported for a broad variety of primary and secondary outcomes |
| Other bias | High risk | "Patient population underwent a 7‐day, single blind placebo run‐in period, receiving one placebo capsule in the morning and one in the evening. At the end of this period, placebo responders, defined as those patients exhibiting a HDRS‐SOM decrease of more than four points, were excluded from the further trial" (p. 295), single‐blind placebo run‐in phase was conducted before the randomisation; however, no participant had to be excluded in this placebo run‐in phase; "Compliance was assessed by immediate pill count at visits. The compliance ranged from 85.7 to 110.1% and was therefore well in the predefined range of 75‐125%" (p. 295); for initial symptom severity "there were no relevant differences between the treatment groups" (p. 296) |
| Methods | Randomised, parallel‐group, double‐blind, fixed‐dose trial | |
| Participants | n(randomised/ITT) = 140 Diagnosis: persistent somatoform pain disorder (ICD‐10) Inclusion criteria: HDRS score > 17; pain continued over the last 6 months at least 5 days/week and 30 minutes/day Exclusion criteria: depressed, suicidal, and chronically ill people Age: mean (± SD) 44.50 ± 21.16 years, range ns; sex: 47.1% women; mean (± SD) length of time since diagnosis of a somatoform disorder: 7.2 ± 5.3 months; country: China; setting: inpatient | |
| Interventions | Trazodone (n = 70; SARI; mean dose = 100 mg/day, max dose = 100 mg/day; 1 capsule twice/day) Ibuprofen (n = 70; NSAID; mean dose = 400 mg/day, max dose = 400 mg/day; 1 capsule twice/day) Treatment duration: 28 days | |
| Outcomes | Primary outcome: Effectiveness rate concerning reduction of pain (defined by authors, no further information about that measure provided) (clinician‐rated): week 4 Secondary outcomes: HDRS (clinician‐rated): baseline, week 4 All‐cause drop‐outs: n = 0 (trazodone), n = 0 (ibuprofen) Drop‐outs due to adverse effects: n = 0 (trazodone), n = 0 (ibuprofen) Reported drug‐related adverse effects: Trazodone: hypersomnia, nausea, poor appetite, lethargy Ibuprofen: reduced white blood cells (n = 3), allergy (n = 1), stomach irritation (n = 10) No information about the total rate of participants with drug‐related adverse events was provided. The groups differed significantly with regard to the Treatment Emergent Symptom Scale ‐ Total Score | |
| Notes | Funding: no information was provided Ethics approval: no information provided Underlined outcome measures and time points were considered in the meta‐analytical part of the review | |
| Risk of bias | ||
| Bias | Authors' judgement | Support for judgement |
| Random sequence generation (selection bias) | Unclear risk | "Randomly divided into two groups" (p. 70); no information provided about random sequence |
| Allocation concealment (selection bias) | Unclear risk | No information about methods of allocation concealment provided |
| Blinding of participants and personnel (performance bias) | Low risk | "The clinical effects and side‐effects were double‐blind evaluated" (p. 70); trial authors stated that the trial pharmacist put the trazodone and the placebo in similar capsules, both participants and physicians did not know the treatment condition until the end of the treatment (p. 71) |
| Blinding of outcome assessment (detection bias) | Unclear risk | No information about methods of blinding outcome assessment provided |
| Incomplete outcome data (attrition bias) | Low risk | All participants completed the study and there were no losses to follow‐up and no treatment withdrawals |
| Selective reporting (reporting bias) | High risk | No protocol available; generally accepted outcomes were used; however, treatment effects were assessed with validated scales only for secondary outcomes such as depression and adverse effects; important primary outcome was assessed with non‐validated clinician‐rated scale that was constructed by the study authors |
| Other bias | Low risk | No significant differences between groups regarding gender, age, duration of symptoms, and diagnosis (p. 71); there were no significant differences between groups in the HDRS at baseline (p. 71) |
| Methods | Randomised, parallel‐group, flexible‐dose trial | |
| Participants | n(randomised/ITT) = 70 Diagnosis: somatoform pain disorder (CCMD‐III) Inclusion criteria: pain symptom presentation of ≥ 6 months; the pain that the participants experience from onset and over the course of disorder was related to the emotional stability or to psychosocial problems Exclusion criteria: pain explained by a somatic disorder Age: mean 52 years, range 26‐73 years; sex: 60.0% women; mean length of time since diagnosis of a somatoform disorder: 10.65 months; country: China; setting: outpatient | |
| Interventions | Venlafaxine (n = 35; SNRI; mean dose = 132.4 mg/day, max dose = 150 mg/day; 1 capsule twice/day) Amitriptyline (n = 35; TCA; mean dose = 127.3 mg/day, max dose = 150 mg/day; 2 capsules twice/day) Treatment duration: 28 days | |
| Outcomes | Primary outcome: No primary outcome was assessed Secondary outcomes: Treatment effectiveness score based on rating of degree of pain, frequency how often they felt the pain, improvement of the activity daily living quality (no further information about that measure provided) (clinician‐rated): baseline, day 4, week 1, 2, 4 All‐cause drop‐outs: n = 0 (venlafaxine), n = 0 (amitriptyline) Drop‐outs due to adverse effects: n = 0 (venlafaxine), n = 2 (amitriptyline) Reported drug‐related adverse effects: Venlafaxine: dry mouth (n = 4, 11.4%), constipation (n = 5, 14.3%), blurred vision (n = 4, 11.4%), increased heart rate (n = 2, 5.7%), hypersomnia (n = 3, 8.6%), headache (n = 2, 5.7%), dizziness (n = 3, 8.6%), nausea (n = 5, 14.3%) Amitriptyline: dry mouth (n = 20, 57.1%), constipation (n = 18, 51.4%), blurred vision (n = 17, 48.6%), increased heart rate (n = 15, 42.9%), hypersomnia (n = 21, 60.0%), headache (n = 5, 14.3%), dizziness (n = 7, 20.0%), nausea (n = 7, 20.0%). With the exception of dizziness and nausea, all mentioned adverse effects appeared significantly more often in the amitriptyline compared with venlafaxine. No information about the total rate of participants with drug‐related adverse events was provided | |
| Notes | Funding: Southwest Pharmaceutical Co., Ltd., Chengdu, Sichuan (venlafaxine); Hunan Dongting Pharmaceutical Co., Deshan, Changde City, Hunan (amitriptyline) Ethics approval: no information provided | |
| Risk of bias | ||
| Bias | Authors' judgement | Support for judgement |
| Random sequence generation (selection bias) | Unclear risk | "70 […] outpatients […] were randomly divided" (p. 397); no information provided about random sequence |
| Allocation concealment (selection bias) | Unclear risk | No information about methods of allocation concealment provided |
| Blinding of participants and personnel (performance bias) | Unclear risk | No information about methods of blinding participants and study personnel provided |
| Blinding of outcome assessment (detection bias) | Unclear risk | No information about methods of blinding outcome assessment provided |
| Incomplete outcome data (attrition bias) | Low risk | All participants completed the study and there were no losses to follow‐up and no treatment withdrawals |
| Selective reporting (reporting bias) | High risk | No protocol available; generally accepted outcomes were used; however, only clinician‐rated and no participant self rated measures were used. Furthermore, only non‐validated scales defined by the trial authors were administered |
| Other bias | High risk | Significant differences between groups regarding sex, age, duration of symptoms, occupational status, and pain regions at baseline were identified (p. 398) |
| Methods | Randomised, parallel‐group trial (unclear if this study was a fixed‐ or flexible‐dose trial) | |
| Participants | n(randomised/ITT) = 70 Diagnosis: somatoform disorder (CCMD‐III) Inclusion criteria: inpatients of the Kangning Hospital of Chaoyang City Exclusion criteria: no information provided Age: mean 41.60 years, range 20‐72 years; sex: 70.0% women; mean length of time since diagnosis of a somatoform disorder: 3‐144 months; 61.4% were 12‐36 months; country: China; setting: inpatient | |
| Interventions | Venlafaxine (n = 35; SNRI; mean dose: ns, max dose: ns; no information about mode/frequency of administration provided) Amitriptyline (n = 35; TCA; mean dose = 127.3 mg/day, max dose = 150 mg/day; no information about mode/frequency of administration provided) Treatment duration: 42 days | |
| Outcomes | Primary outcome: No primary outcome was assessed Secondary outcomes: HDRS ‐ Total Score, responder rate (clinician‐rated): baseline, week 1, 2, 4, 6 No information provided how adverse effects were assessed All‐cause drop‐outs: n = 0 (venlafaxine), n = 0 (amitriptyline) Drop‐outs due to adverse effects: n = 0 (venlafaxine), n = 2 (amitriptyline) Reported drug‐related adverse effects: Venlafaxine: poor digestion (n = 12, 23.3%), insomnia (n = 3, 8.6%), headache (n = 3, 8.6%), sweating (n = 5, 14.3%), hypertension (n = 2, 5.7%) Amitriptyline: dry mouth (n = 10, 28.6%), nervousness/alertness (n = 10, 28.6%), constipation (n = 10, 28.6%), increased heart rate (n = 3, 8.6%), blurred vision (n = 6, 17.1%), whole body did not feel well (n = 3, 8.6%) No information about the total rate of participants with drug‐related adverse events was provided or if both treatment groups differed in the number of adverse effects | |
| Notes | Ethics approval: no information provided Funding: no information provided Underlined outcome measures and time points were considered in the meta‐analytical part of the review | |
| Risk of bias | ||
| Bias | Authors' judgement | Support for judgement |
| Random sequence generation (selection bias) | Unclear risk | "70 patients […] were randomly assigned" (p. 262); no information provided about random sequence |
| Allocation concealment (selection bias) | Unclear risk | No information about methods of allocation concealment provided |
| Blinding of participants and personnel (performance bias) | Unclear risk | No information about methods of blinding participants and study personnel provided |
| Blinding of outcome assessment (detection bias) | Unclear risk | No information about methods of blinding outcome assessment provided |
| Incomplete outcome data (attrition bias) | Low risk | All participants completed the study and there were no losses to follow‐up and no treatment withdrawals |
| Selective reporting (reporting bias) | High risk | No protocol available; generally accepted outcomes were used; however, treatment effects were only reported for the secondary outcomes such as depression, anxiety, and adverse effects; important primary outcomes such as severity of physical symptoms were not assessed |
| Other bias | Low risk | There was no significant difference between groups in age, gender, duration of symptoms, or HARS and HDRS scores at baseline (p. 262) |
| Methods | Randomised, parallel‐group, flexible‐dose trial | |
| Participants | n(randomised/ITT) = 70 Diagnosis: somatisation disorder (CCMD‐III) Inclusion criteria: aged 18‐65 years Exclusion criteria: people with diabetes; history of any liver, lung, kidney, or related diseases; people with any type of drug dependence; pregnant or breastfeeding women; people who used MAOIs and other antidepressants in the 2 week before treatment started Age: mean (± SD) 43.50 ± 10.0 years, range ns; sex: 72.9% women; mean (± SD) length of time since diagnosis of a somatoform disorder: 7.5 ± 5.7 months; country: China; setting: ns | |
| Interventions | Mirtazapine (n = 35; NaSSA; mean dose: ns, max dose = 45 mg/day; medication was administered as pills; no information about frequency of administration provided) Clomipramine (n = 35; TCA; mean dose: ns, max dose = 150 mg/day; medication was administered as pills; no information about frequency of administration provided) Treatment duration: 56 days | |
| Outcomes | Primary outcome: SCL‐90‐Somatisation Subscore (self rated): baseline, week 2, 4, 8 Secondary outcomes: SCL‐90 ‐ Interpersonal Sensitivity, Obsessive‐compulsive, Depression, Anxiety, Hostility, Phobic Anxiety, Paranoid Ideation, Psychoticism Subscore (self rated): baseline, week 2, 4, 8 CGI ‐ Improvement Scale (clinician‐rated): week 8 Treatment Emergent Symptom Scale: week 2, 4, 8 All‐cause drop‐outs: n = 2 (mirtazapine), n = 3 (clomipramine) Drop‐outs due to adverse effects: n = 2 (mirtazapine), n = 2 (clomipramine) Reported drug‐related adverse effects: Mirtazapine: dry mouth (n = 4, 11.4%), constipation (n = 3, 8.6%), increased heart rate (n = 1, 2.9%), blurred vision (n = 1, 2.9%), headache (n = 4, 11.4%), fatigue (n = 3, 8.6%), increased body weight (n = 6, 17.1%) Clomipramine: dry mouth (n = 17, 48.6%), constipation (n = 9, 25.7%), nausea, (n = 7, 20.0%), loss of appetite (n = 6, 17.1%), increased heart rate (n = 13, 37.1%), hypotension (n = 6, 17.1%), blurred vision (n = 18, 51.4%), tremor (n = 7, 20%), micturition disturbances (n = 9, 25.7%), headache (n = 6, 17.1%), fatigue (n = 5, 14.3%), increased body weight (n = 9, 25.7%) Dry mouth, constipation, increased heart rate, and blurred vision appeared statistically more often in the mirtazapine group than in the clomipramine group. Dry mouth, constipation, nausea, loss of appetite, increased heart rate, hypotension, blurred vision, tremor, and micturition disturbances appeared statistically more often in the clomipramine group than in the mirtazapine group. No information about the total rate of participants with drug‐related adverse events was provided | |
| Notes | Funding: no information provided Ethics approval: no information provided Underlined outcome measures and time points were considered in the meta‐analytical part of the review | |
| Risk of bias | ||
| Bias | Authors' judgement | Support for judgement |
| Random sequence generation (selection bias) | Unclear risk | "Seventy patients […] were randomly divided into two groups" (p. 14); no information provided about random sequence |
| Allocation concealment (selection bias) | Unclear risk | No information about methods of allocation concealment provided |
| Blinding of participants and personnel (performance bias) | Unclear risk | No information about methods of blinding participants and study personnel provided |
| Blinding of outcome assessment (detection bias) | Unclear risk | No information about methods of blinding outcome assessment provided |
| Incomplete outcome data (attrition bias) | High risk | Drop‐out rate in total sample: 7.1%; although reasons for missing outcome data were partly likely to be related to true outcome, missing outcome data were balanced in number with similar reasons for missing data across groups; missing values were not replaced, statistical analyses were based only on the sample of participants who complied with the protocol |
| Selective reporting (reporting bias) | Unclear risk | No protocol available; generally accepted outcomes were used |
| Other bias | Low risk | There were no statistical significant differences between groups regarding sex, age, and mean duration of somatoform symptoms (p. 14) |
| Methods | Randomised, parallel‐group, double‐blind, flexible‐dose trial | |
| Participants | n(randomised/ITT) = 60 Diagnosis: somatisation disorder (CCMD‐III) Inclusion criteria: no further information provided Exclusion criteria: other mental disorders, history of physical illnesses, drug dependence, pregnant or breastfeeding (or both) women; taking MAOI or other antidepressants during the first 2 weeks of treatment Age: mean (± SD) 38.15 ± 7.58 years, range 25‐51 years; sex: 68.3% women; mean (± SD) length of time since diagnosis of a somatoform disorder: 61.8 ± 39 months; country: China; setting: inpatient | |
| Interventions | Mirtazapine (n = 30; NaSSA; mean dose = 40 mg/day, max dose = 45 mg/day; medication was administered as capsules; no information about frequency of administration provided) Amitriptyline (n = 30; TCA; mean dose = 116.3 mg/day, max dose = 200 mg/day; medication was administered as capsules; no information about frequency of administration provided) Treatment duration: 56 days | |
| Outcomes | Primary outcome: SCL‐90 ‐ Somatisation Subscore (self rated): baseline, week 2, 4, 8 Secondary outcomes: SCL‐90 ‐ Interpersonal Sensitivity, Obsessive‐compulsive, Depression, Anxiety, Hostility, Phobic Anxiety, Paranoid Ideation, Psychoticism Subscore (self rated): baseline, week 2, 4, 8 CGI ‐ Improvement Scale: week 8 All‐cause drop‐outs: 7 participants dropped out; however, it was unclear how they were distributed among groups Drop‐outs due to adverse effects: no information provided Reported drug‐related adverse effects: Mirtazapine: weight gain (n = 14, 46.7%), hypersomnia (n = 3, 10.0%), hyperventilation (n = 4, 13.3%), hypotension (n = 2, 6.7%), blurred vision (n = 1, 3.3%), headache (n = 8, 26.7%), constipation (n = 10, 33.3%), nausea (n = 6, 20.0%) Amitriptyline: weight gain (n = 2, 6.7%), hypersomnia (n = 15, 50.0%), hyperventilation (n = 15, 50.0%), hypotension (n = 12, 40.0%), blurred vision (n = 17, 56.7%), micturition disturbances (n = 7, 23.3%), headache (n = 7, 23.3%), constipation (n = 12, 40.0%), nausea (n = 7, 23.3%) Weight gain appeared statistically more often in the mirtazapine group than in the amitriptyline group. Hypersomnia, hyperventilation, hypotension, blurred vision, micturition disturbances, headache, constipation, and nausea appeared statistically more often in the clomipramine group than in the mirtazapine group. No information about the total rate of participants with drug‐related adverse events was provided | |
| Notes | Funding: no information provided Ethics approval: no information provided Underlined outcome measures and time points were considered in the meta‐analytical part of the review | |
| Risk of bias | ||
| Bias | Authors' judgement | Support for judgement |
| Random sequence generation (selection bias) | Unclear risk | "60 patients […] were randomly divided" (p. 175); no information provided about random sequence |
| Allocation concealment (selection bias) | Unclear risk | No information about methods of allocation concealment provided |
| Blinding of participants and personnel (performance bias) | Low risk | Trial authors stated that it was a double‐blind study (p. 175); both medications were administered in identical capsules (p. 175) |
| Blinding of outcome assessment (detection bias) | Unclear risk | No information about methods of blinding outcome assessment provided |
| Incomplete outcome data (attrition bias) | Unclear risk | 7 drop‐outs (drop‐out rate in total sample: 11.7%) but no information about the reason for drop‐out and how drop‐outs were distributed among the 2 trial arms was provided; no information about how and if missing values were replaced in the statistical analyses was provided; in the result tables the number of originally randomised participants was depicted, therefore, it can be concluded that an ITT analysis with replaced missing values was conducted |
| Selective reporting (reporting bias) | Unclear risk | No protocol available; generally accepted outcomes were used |
| Other bias | Low risk | There were no significant differences in demographics and the duration of the symptoms between groups at baseline (p. 175) |
| Methods | Randomised, parallel‐group, cross‐over, double‐blind, fixed‐dose trial | |
| Participants | n(randomised/ITT) = 45 Diagnosis: psychogenic pain disorder (307.80) (DSM‐III‐R) Inclusion criteria: aged 30‐60 years Exclusion criteria: serious psychiatric disease necessitating immediate treatment; alcohol or illicit drug dependence; renal, hepatic, or cardiac disorders; epilepsy; glaucoma; hypertension; prostate dysfunction; intake of medication consisting of enzyme‐inducing drugs; use of antidepressants or neuroleptic drugs (or both) during the previous year Aged: mean (± SD) 41.20 ± 11.00 years, range ns; sexd: 61.1% women; mean (± SD) length of time since diagnosis of a somatoform disordere : 113.4 ± 111.6 months; country: The Netherlands; setting: outpatient | |
| Interventions | Amitriptyline + flupentixol (n = 16d; TCA + AP; mean dose amitriptyline = 75.0 mg/day, mean dose flupentixol = 3.0 mg/day, max dose amitriptyline = 75 mg/day, max dose flupentixol = 3 mg/day; medication was administered as capsules; no information about frequency of administration provided) Amitriptyline alone (n = 18d; TCA; mean dose = 116.3 mg/day, max dose = 200 mg/day; medication was administered as capsules; no information about frequency of administration provided) Treatment duration: 35 days | |
| Outcomes | Primary outcomes: Participant's estimation of the amount of pain felt at that time as a percentage of the pain on day 1 (self rated): first day of week 3, 5, 8, 10, 12, 15, 17 Pain diaries (numerical scale for rating pain intensity and the trouble the pain caused) (self rating): baseline, week 5, 7, 9, 12, 14, 16 Secondary outcomes: Zung Depression Scale (self rated): first day of week 1, 3, 5, 8, 10, 12, 15, 17 All‐cause drop‐outs: 9 participants dropped out; however, it was not clear how they were distributed among groups Drop‐outs due to adverse effects: no information provided Reported drug‐related adverse effects: It was only mentioned that the adverse effect dry mouth became significantly more serious during the treatment in the amitriptyline as well as in the amitriptyline + flupentixol groups. Withdrawal symptoms of antidepressants and neuroleptics were included in the checklist, but no statistically significant increase in the severity of these symptoms was observed. Regarding the extrapyramidal side effects scored on the Abnormal Involuntary Movement Scale and the EPS, there was no statistically significant difference between groups. The mean scores were very low. On the Abnormal Involuntary Movement Scale (range 0‐42) they were 0.13‐0.67, and on the EPS all participants scored 0 | |
| Notes | Funding: H. Lundbeck A/S, Copenhagen supplied the medication and financial support for the trial Ethics approval: obtained Underlined outcome measures and time points were considered in the meta‐analytical part of the review | |
| Risk of bias | ||
| Bias | Authors' judgement | Support for judgement |
| Random sequence generation (selection bias) | Unclear risk | "Randomized [...] crossover trial" (p. 26); "there were 2 treatment schemes to which the patients were randomly assigned" (p. 26); no information provided about random sequence |
| Allocation concealment (selection bias) | Unclear risk | No information about methods of allocation concealment provided |
| Blinding of participants and personnel (performance bias) | Low risk | "Double‐blind crossover trial" (p. 26); "Four types of tablets were used: 25mg AT [amitriptyline], 1 mg FP [flupentixol], placebo tablets looking identical to AT tablets (ATpi) and placebo tablets looking identical to FP tablets (FPpl)" (p. 26) |
| Blinding of outcome assessment (detection bias) | Unclear risk | No information about methods of blinding outcome assessment provided |
| Incomplete outcome data (attrition bias) | High risk | Reasons for missing outcome data and distribution of drop‐outs were not provided. For this reason, we could not judge if missing outcome data were balanced in number across intervention with similar reasons for missing data across groups. Total sample size was very small and the total drop‐out rate was relatively high (20.0%). Therefore, the chance of a bias produced by incomplete data was high. Missing values were not replaced, statistical analyses were based only on the sample of participants who complied with the protocol (p. 27) |
| Selective reporting (reporting bias) | Unclear risk | No protocol available; generally accepted outcomes were used |
| Other bias | Low risk | "The 2 groups to which the patients had been randomly assigned did not show statistically significant differences with respect to demographic variables (sex, age, marital status, level of education) or to pain variables (localization and duration of pain, baseline pain intensity and pain trouble)" (p. 27); "is questioned if a higher dose of flupentixol [would have] have yielded better analgesic effects" (p. 29); in this cross‐over trial, the order receiving a treatment was randomised: "there were 2 treatment schemes to which the patients were randomly assigned" (p. 26), in addition, the means/SD for pain intensity/burden and depression in Table 1 and 3 were given separately for group 1 and 2 for day 15/29/50/64/78/99/113 |
AP: antipsychotic; CCMD: Chinese Classification of Mental Disorders; CGI: Clinical Global Impression Scale; DSM: Diagnostic and Statistical Manual of Mental Disorders; EPS: Extrapyramidal Side Effects; GAD: generalised anxiety disorder; HARS: Hamilton Anxiety Rating Scale; HDRS: Hamilton Depression Rating Scale; ICD: International Classification of Diseases; ITT: intention to treat; LOCF: last observation carried forward; MAOI: monoamine oxidase inhibitor; max: maximum; MDD: major depressive disorder; MSD: multisomatoform disorder; MUPS: medically unexplained physical symptoms; n: number; NaSSA: noradrenergic and specific serotonergic antidepressant; NP: natural product; ns: not specified; NSAID: non‐steroidal anti‐inflammatory drug; PHQ: Patient Health Questionnaire; SAD: somatoform autonomic dysfunction; SCL: Symptom Checklist; SD: standard deviation; SNRI: serotonin noradrenaline reuptake inhibitor; SOMS: Screening for Somatoform Symptoms; SSRI: selective serotonin reuptake inhibitor; TCA: tricyclic antidepressant; TeCA: tetracyclic antidepressant; VAS: visual analogue scale.
Notes: percentages, numbers, and mean values/SDs regarding age, sex, length of time since the diagnosis of somatoform disorder, dose, drop‐outs, and adverse effects relate to the originally randomised sample. Deviations from this rule are indicated with a footnote.
aStudy design included a single‐blind placebo run‐in phase after which 'placebo‐responders' were excluded from the further trial.
bValues refer to the ITT sample that was not the same as the originally randomised sample. Usually participants abandoned before the first outcome assessment or before they received at least 1 dose of a study medication were excluded from the ITT sample.
cThe trial originally involved 4 study groups: group A: amitriptyline + psychotherapy, group B: amitriptyline + support, group C: placebo + psychotherapy, group D: placebo + support. The following study‐related information referred only to the comparison between group B and D.
dMean values/SDs and percentages relate to the completer‐sample.
eFor this study, only a conference abstract was available. Authors were contacted in order to obtain more information about the study; however, we received no reply.
fThe study was included in the narrative but not in the meta‐analytical part of the review.
Characteristics of excluded studies [ordered by study ID]
| Study | Reason for exclusion |
| No randomisation (we contacted the authors because the article included no information about randomisation) | |
| People with hysteria and anxiety neurosis (focus on conversion symptoms) | |
| People with neurosis | |
| People with hysteria | |
| People with a specific functional syndromes (non‐ulcer dyspepsia) | |
| Efficacy of quetiapine fumarate as a adjunctive therapy to current pain treatment of participants was examined | |
| People with psychosomatic symptoms (primary diagnoses: depression, anxiety, somatic disorders) | |
| People psychosomatic disease and neurosis | |
| People with symptoms of anxious neurosis and somatoform disorders, no information provided how participants were diagnosed and how long participants' symptoms had to persist | |
| Case report | |
| Anti‐stress effect of Korean red ginseng in a general population with various stress‐related somatic symptoms was examined | |
| People fulfilling CCMD‐III criteria of a depressive disorder with a co‐morbid somatic diagnosis were included | |
| 45.1% of the participants had tension headache (not classified as somatoform disorder) | |
| Cross‐over design applied but no data for the first study phase available | |
| People with functional physical symptoms in combination with anxious, depressive mood; functional physical symptoms included predominantly different heart sensations, circulation problems or tension headache | |
| People with reactive depression | |
| Anxious somatising neurotic medical clinic participants; no information provided how participants were diagnosed and how long participants' symptoms had to persisted | |
| People with psychoneurotic anxiety with/without depressive symptoms | |
| People with cardioneurotic disease with an anxiety disorder (agoraphobia, generalised anxiety disorder, panic disorder) and a somatoform disorder (somatisation disorder, hypochondriasis) | |
| People with specific functional syndromes (irritable bowel syndrome, non‐ulcer dyspepsia) | |
| People with a disorder in the field of internal medicine (psychosomatic medicine), geriatric medicine (focus on various sleeping problems with the frequency of symptoms of ≥ 4 times/week) | |
| People with a disorder in the field of internal medicine (psychosomatic medicine), geriatric medicine (focus on various sleeping problems with the frequency of symptoms of ≥ 4 times/week) | |
| People with a disorder in the field of internal medicine (psychosomatic medicine), geriatric medicine (focus on various sleeping problems with the frequency of symptoms of 4 times or more per week) | |
| People with a disorder in the field of internal medicine (psychosomatic medicine), geriatric medicine (focus on various sleeping problems with the frequency of symptoms of ≥ 4 times/week) | |
| People with a disorder in the field of internal medicine (psychosomatic medicine) and geriatric medicine (focus on insomnia) | |
| People with 1 specific functional syndrome (prostatodynia) | |
| Interventions: paroxetine vs. acupuncture (no placebo or other medication group) | |
| People fulfilling diagnostic criteria of neurosis defined by the Chinese Neuropsychiatric Committee in October 1985 (these criteria do not correspond to the inclusion criteria of the review regarding the diagnosis) | |
| People with neurosis (included anxiety, phobia, somatisation, and compulsion) and depression | |
| People with chronic pain of various origins (only 35.9% fulfilled criteria of psychogenic pain disorder) |
CCMD: Chinese Classification of Mental Disorders.
Characteristics of ongoing studies [ordered by study ID]
| Trial name or title | Imipramine Treatment for Patients with Multi‐Organ Bodily Distress Syndrome (STreSS‐3) |
| Methods | Randomised, placebo‐controlled, double‐blind, flexible‐dose trial |
| Participants | n = 140 Diagnosis: bodily distress syndrome multi‐organ type with symptoms for more than 3 of 4 symptom categories (resembles somatisation disorder in ICD‐10) Inclusion criteria: moderate or severe impact on daily life; symptoms lasting for at least 2 years; aged 20‐50 years; born in Denmark or have Danish parents; participant understands, speaks, writes, and reads Danish Exclusion criteria: presence of other physical of psychiatric condition; continuous antidepressant treatment because of moderate or severe depression; other severe psychiatric disorder that demands treatment or suicidality; lifetime diagnosis of psychoses, mania, or depression with psychotic symptoms (International Classification of Diseases‐10: F20‐29, F30‐31, F32.3, F33.3); abuse of alcohol, narcotics, or drugs; pregnancy, breastfeeding, or current pregnancy wish; fertile women must use effective contraception; treatment with all pain‐modulating drugs, e.g. all analgesics, antidepressants, antiepileptics, and other types of medication with pain‐relieving properties must be discontinued at least 2 weeks before the treatment phase; imipramine treatment in sufficient dosage within the last year, i.e. 25 mg daily continuously for at least 8 weeks; allergy to study medication or excipients in study medication; people with previous myocardial infarction, congestive heart failure, signs of conduction defects or abnormalities on electrocardiograph, narrow‐angle glaucoma, porphyria, inherited galactose intolerance, epilepsy, hepatic insufficiency, and severe renal impairment; simultaneous use of: antipsychotics, oral anticoagulants, diuretics, sympathomimetics and central nervous system‐stimulating drugs (amphetamine‐like drugs), all serotonergic drugs, e.g. selective serotonin reuptake inhibitor, serotonin noradrenaline reuptake inhibitor, and tricyclic antidepressant, the dietary supplement hypericum perforatum, non‐selective, irreversible, or selective reversible monoamine oxidase inhibitors, triptans, tramadol, pethidine and tryptophan, cimetidine, quinidine, clonidine, fluconazole (antimycotics), clindamycin, clarithromycin, erythromycin, droperidol, levodopa, mefloquine, phenytoin, barbiturates, carbamazepine, bupropion, celecoxib, cinacalcet, duloxetine, fluphenazine, fluoxetine, gefitinib, moclobemide, paroxetine, sertraline, terbinafine, yohimbine, fluvoxamine, ciprofloxacin, or enoxacin |
| Interventions | Imipramine (n = 70, 25‐75 mg/day, medication administered as tablets) Placebo (n = 70) Treatment duration: 133 days (19 weeks) |
| Outcomes | Primary outcomes: CGI ‐ Improvement Scale (clinician‐rated): week 13 Participant‐rated improvement of health since the beginning of the study: week 13 Secondary outcomes: Medical Outcomes Study Short‐Form 36‐Item Questionnaire (participant‐rated): week 1, 13 |
| Starting date | January 2012 (estimated study completion date: December 2014) |
| Contact information | Per K Fink, Dr. med; telephone: +4578464310; email: [email protected] Johanne L Agger, M.D.; telephone: +4578464344; email: [email protected] Research Clinic for Functional Disorders Recruiting |
| Notes | Funding: Aarhus University Hospital |
n: number.
Data and analyses
| Outcome or subgroup title | No. of studies | No. of participants | Statistical method | Effect size |
| 1 Severity/intensity of medically unexplained physical symptoms (post‐treatment score on self report scales) Show forest plot | 7 | Std. Mean Difference (IV, Random, 95% CI) | Subtotals only | |
| Analysis 1.1  Comparison 1 Pharmacotherapy versus placebo, Outcome 1 Severity/intensity of medically unexplained physical symptoms (post‐treatment score on self report scales). | ||||
| 1.1 Tricyclic antidepressants versus placebo | 2 | 239 | Std. Mean Difference (IV, Random, 95% CI) | ‐0.13 [‐0.39, 0.13] |
| 1.2 New‐generation antidepressants (serotonin noradrenaline reuptake inhibitor (SNRI), selective serotonin reuptake inhibitor (SSRI)) versus placebo | 3 | 243 | Std. Mean Difference (IV, Random, 95% CI) | ‐0.91 [‐1.36, ‐0.46] |
| 1.3 Natural products (St. John's wort LI 160) versus placebo | 2 | 322 | Std. Mean Difference (IV, Random, 95% CI) | ‐0.74 [‐0.97, ‐0.51] |
| 2 Acceptability Show forest plot | 6 | Risk Ratio (M‐H, Random, 95% CI) | Subtotals only | |
| Analysis 1.2  Comparison 1 Pharmacotherapy versus placebo, Outcome 2 Acceptability. | ||||
| 2.1 Tricyclic antidepressant versus placebo | 1 | 208 | Risk Ratio (M‐H, Random, 95% CI) | 1.08 [0.53, 2.18] |
| 2.2 New‐generation antidepressants (SNRI, SSRI) versus placebo | 2 | 163 | Risk Ratio (M‐H, Random, 95% CI) | 1.01 [0.64, 1.61] |
| 2.3 Natural products (St. John's wort LI 160, Ze 185 3‐/4‐combination) versus placebo | 3 | 506 | Risk Ratio (M‐H, Random, 95% CI) | 0.85 [0.40, 1.78] |
| 3 Anxiety (post‐treatment score on self report and clinician‐rated scales) Show forest plot | 5 | Std. Mean Difference (IV, Random, 95% CI) | Subtotals only | |
| Analysis 1.3  Comparison 1 Pharmacotherapy versus placebo, Outcome 3 Anxiety (post‐treatment score on self report and clinician‐rated scales). | ||||
| 3.1 Tricyclic antidepressants versus placebo | 1 | 200 | Std. Mean Difference (IV, Random, 95% CI) | ‐0.01 [‐0.29, 0.26] |
| 3.2 New‐generation antidepressants (SNRI, SSRI) versus placebo | 2 | 163 | Std. Mean Difference (IV, Random, 95% CI) | ‐0.88 [‐1.81, 0.05] |
| 3.3 Natural products (St. John's wort LI 160, Ze 185 3‐/4‐combination) versus placebo | 2 | 321 | Std. Mean Difference (IV, Random, 95% CI) | ‐0.83 [‐1.13, ‐0.52] |
| 4 Depression (post‐treatment score on self report and clinician‐rated scales) Show forest plot | 5 | Std. Mean Difference (IV, Random, 95% CI) | Subtotals only | |
| Analysis 1.4  Comparison 1 Pharmacotherapy versus placebo, Outcome 4 Depression (post‐treatment score on self report and clinician‐rated scales). | ||||
| 4.1 Tricyclic antidepressant versus placebo | 1 | 200 | Std. Mean Difference (IV, Random, 95% CI) | ‐0.27 [‐0.55, 0.01] |
| 4.2 New‐generation antidepressants (SSRI, SNRI) versus placebo | 2 | 163 | Std. Mean Difference (IV, Random, 95% CI) | ‐0.56 [‐0.88, ‐0.25] |
| 4.3 Natural products (St. John's wort, Ze 185) versus placebo | 2 | 321 | Std. Mean Difference (IV, Random, 95% CI) | ‐0.64 [‐0.87, ‐0.41] |
| 5 Dysfunctional cognitions, emotions, and behaviours (post‐treatment score on self report scales) Show forest plot | 1 | Std. Mean Difference (IV, Random, 95% CI) | Subtotals only | |
| Analysis 1.5  Comparison 1 Pharmacotherapy versus placebo, Outcome 5 Dysfunctional cognitions, emotions, and behaviours (post‐treatment score on self report scales). | ||||
| 5.1 New‐generation antidepressants (SSRI) versus placebo | 1 | 51 | Std. Mean Difference (IV, Random, 95% CI) | 0.26 [‐0.29, 0.81] |
| 6 Adverse effects Show forest plot | 6 | Risk Ratio (M‐H, Random, 95% CI) | Subtotals only | |
| Analysis 1.6  Comparison 1 Pharmacotherapy versus placebo, Outcome 6 Adverse effects. | ||||
| 6.1 Tricyclic antidepressant versus placebo | 1 | 208 | Risk Ratio (M‐H, Random, 95% CI) | 1.0 [0.21, 4.84] |
| 6.2 New‐generation antidepressants (SNRI, SSRI) versus placebo | 2 | 163 | Risk Ratio (M‐H, Random, 95% CI) | 2.26 [0.52, 9.81] |
| 6.3 Natural products (St. John's wort LI 160, Ze 185 3‐/4‐combination) versus placebo | 3 | 506 | Risk Ratio (M‐H, Random, 95% CI) | 0.54 [0.08, 3.50] |
| 7 Treatment response (post‐treatment score on self report and clinician‐rated scales) Show forest plot | 5 | Risk Ratio (M‐H, Random, 95% CI) | Subtotals only | |
| Analysis 1.7  Comparison 1 Pharmacotherapy versus placebo, Outcome 7 Treatment response (post‐treatment score on self report and clinician‐rated scales). | ||||
| 7.1 Tricyclic antidepressant versus placebo | 1 | 208 | Risk Ratio (M‐H, Random, 95% CI) | 1.29 [0.95, 1.73] |
| 7.2 New‐generation antidepressants (SNRI, SSRI) versus placebo | 2 | 163 | Risk Ratio (M‐H, Random, 95% CI) | 2.00 [0.90, 4.43] |
| 7.3 Natural products (St. John's wort LI 160) versus placebo | 2 | 324 | Risk Ratio (M‐H, Random, 95% CI) | 1.77 [1.34, 2.34] |
| 8 Functional disability and quality of life (post‐treatment score on self report scales) Show forest plot | 3 | Std. Mean Difference (IV, Random, 95% CI) | Subtotals only | |
| Analysis 1.8 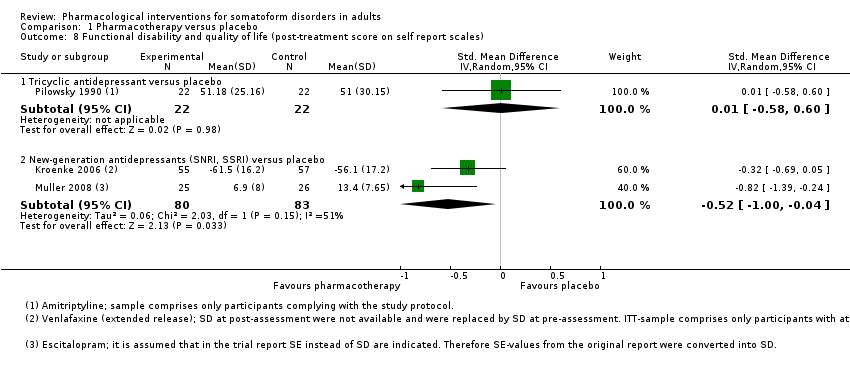 Comparison 1 Pharmacotherapy versus placebo, Outcome 8 Functional disability and quality of life (post‐treatment score on self report scales). | ||||
| 8.1 Tricyclic antidepressant versus placebo | 1 | 44 | Std. Mean Difference (IV, Random, 95% CI) | 0.01 [‐0.58, 0.60] |
| 8.2 New‐generation antidepressants (SNRI, SSRI) versus placebo | 2 | 163 | Std. Mean Difference (IV, Random, 95% CI) | ‐0.52 [1.00, ‐0.04] |
| Outcome or subgroup title | No. of studies | No. of participants | Statistical method | Effect size |
| 1 Severity/intensity of medically unexplained physical symptoms (post‐treatment score on self report scales) Show forest plot | 3 | Std. Mean Difference (IV, Random, 95% CI) | Subtotals only | |
| Analysis 2.1  Comparison 2 Tricyclic antidepressants versus another medication, Outcome 1 Severity/intensity of medically unexplained physical symptoms (post‐treatment score on self report scales). | ||||
| 1.1 Tricyclic antidepressants versus new‐generation antidepressants (noradrenergic and specific serotonergic antidepressant (NaSSA), tetracyclic antidepressant (TeCA)) | 3 | 177 | Std. Mean Difference (IV, Random, 95% CI) | ‐0.16 [‐0.55, 0.23] |
| 2 Acceptability Show forest plot | 8 | Risk Ratio (M‐H, Random, 95% CI) | Subtotals only | |
| Analysis 2.2 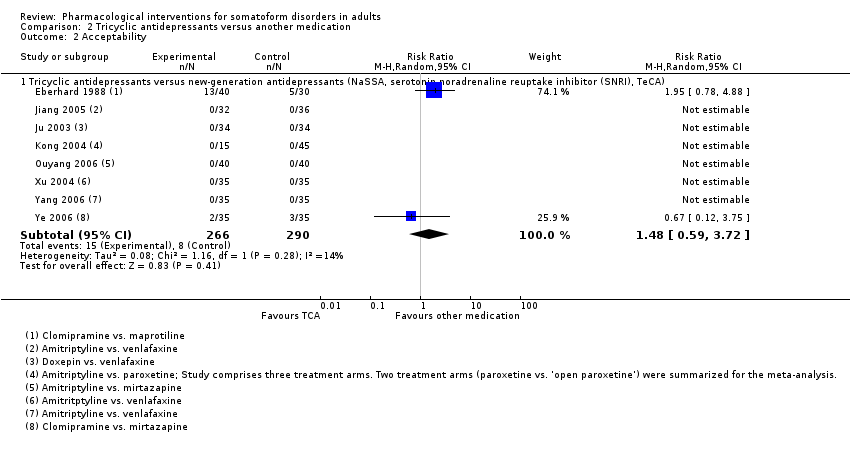 Comparison 2 Tricyclic antidepressants versus another medication, Outcome 2 Acceptability. | ||||
| 2.1 Tricyclic antidepressants versus new‐generation antidepressants (NaSSA, serotonin noradrenaline reuptake inhibitor (SNRI), TeCA) | 8 | 556 | Risk Ratio (M‐H, Random, 95% CI) | 1.48 [0.59, 3.72] |
| 3 Anxiety (post‐treatment score on self report and clinician‐rated scales) Show forest plot | 4 | Std. Mean Difference (IV, Random, 95% CI) | Subtotals only | |
| Analysis 2.3  Comparison 2 Tricyclic antidepressants versus another medication, Outcome 3 Anxiety (post‐treatment score on self report and clinician‐rated scales). | ||||
| 3.1 Tricyclic antidepressants versus new‐generation antidepressants (NaSSA, SNRI, SSRI) | 4 | 255 | Std. Mean Difference (IV, Random, 95% CI) | 0.37 [‐0.21, 0.95] |
| 4 Depression (post‐treatment score on self report and clinician‐rated scales) Show forest plot | 6 | Std. Mean Difference (IV, Random, 95% CI) | Subtotals only | |
| Analysis 2.4  Comparison 2 Tricyclic antidepressants versus another medication, Outcome 4 Depression (post‐treatment score on self report and clinician‐rated scales). | ||||
| 4.1 Tricyclic antidepressants versus new‐generation antidepressants (NaSSA, SNRI, TeCA) | 6 | 395 | Std. Mean Difference (IV, Random, 95% CI) | 0.17 [‐0.07, 0.40] |
| 5 Adverse effects Show forest plot | 8 | Risk Ratio (M‐H, Random, 95% CI) | Subtotals only | |
| Analysis 2.5  Comparison 2 Tricyclic antidepressants versus another medication, Outcome 5 Adverse effects. | ||||
| 5.1 Tricyclic antidepressant versus new‐generation antidepressants (NaSSA, SNRI, TeCA) | 8 | 556 | Risk Ratio (M‐H, Random, 95% CI) | 2.37 [0.39, 14.28] |
| 6 Treatment response (post‐treatment score on self report and clinician‐rated scales) Show forest plot | 2 | Risk Ratio (M‐H, Random, 95% CI) | Subtotals only | |
| Analysis 2.6 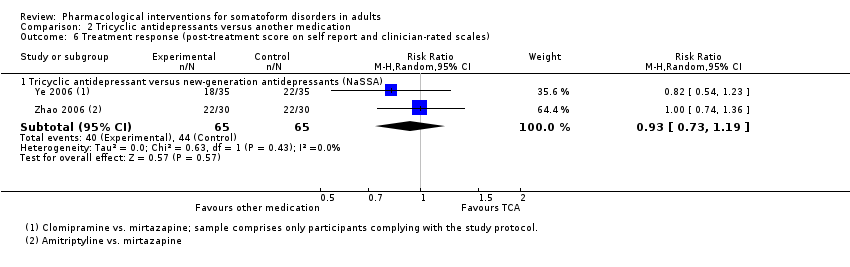 Comparison 2 Tricyclic antidepressants versus another medication, Outcome 6 Treatment response (post‐treatment score on self report and clinician‐rated scales). | ||||
| 6.1 Tricyclic antidepressant versus new‐generation antidepressants (NaSSA) | 2 | 130 | Risk Ratio (M‐H, Random, 95% CI) | 0.93 [0.73, 1.19] |
| Outcome or subgroup title | No. of studies | No. of participants | Statistical method | Effect size |
| 1 Severity/intensity of medically unexplained physical symptoms (post‐treatment score on self report scales) Show forest plot | 4 | Std. Mean Difference (IV, Random, 95% CI) | Subtotals only | |
| Analysis 3.1  Comparison 3 New‐generation antidepressants (SARI, NaSSA, SSRI) versus another medication, Outcome 1 Severity/intensity of medically unexplained physical symptoms (post‐treatment score on self report scales). | ||||
| 1.1 New‐generation antidepressants (noradrenergic and specific serotonergic antidepressant (NaSSA), selective serotonin reuptake inhibitor (SSRI)) versus other new‐generation antidepressants (noradrenaline reuptake inhibitor (NRI), serotonin noradrenaline reuptake inhibitor (SNRI), SSRI) | 4 | 182 | Std. Mean Difference (IV, Random, 95% CI) | ‐0.16 [‐0.45, 0.14] |
| 2 Acceptability Show forest plot | 4 | Risk Ratio (M‐H, Random, 95% CI) | Subtotals only | |
| Analysis 3.2  Comparison 3 New‐generation antidepressants (SARI, NaSSA, SSRI) versus another medication, Outcome 2 Acceptability. | ||||
| 2.1 New‐generation antidepressants (NaSSA, SSRI) versus other new‐generation antidepressants (NRI, SNRI, SSRI) | 4 | 196 | Risk Ratio (M‐H, Random, 95% CI) | 0.92 [0.60, 1.40] |
| 3 Depression (post‐treatment score on self report and clinician‐rated scales) Show forest plot | 4 | Std. Mean Difference (IV, Random, 95% CI) | Subtotals only | |
| Analysis 3.3 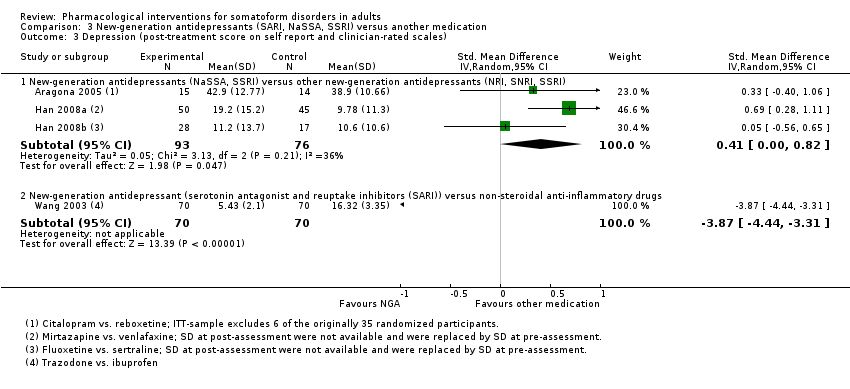 Comparison 3 New‐generation antidepressants (SARI, NaSSA, SSRI) versus another medication, Outcome 3 Depression (post‐treatment score on self report and clinician‐rated scales). | ||||
| 3.1 New‐generation antidepressants (NaSSA, SSRI) versus other new‐generation antidepressants (NRI, SNRI, SSRI) | 3 | 169 | Std. Mean Difference (IV, Random, 95% CI) | 0.41 [0.00, 0.82] |
| 3.2 New‐generation antidepressant (serotonin antagonist and reuptake inhibitors (SARI)) versus non‐steroidal anti‐inflammatory drugs | 1 | 140 | Std. Mean Difference (IV, Random, 95% CI) | ‐3.87 [‐4.44, ‐3.31] |
| 4 Adverse effects Show forest plot | 4 | Risk Ratio (M‐H, Random, 95% CI) | Subtotals only | |
| Analysis 3.4  Comparison 3 New‐generation antidepressants (SARI, NaSSA, SSRI) versus another medication, Outcome 4 Adverse effects. | ||||
| 4.1 New‐generation antidepressants (NaSSA, SSRI) versus other new‐generation antidepressants (NRI, SNRI, SSRI) | 4 | 196 | Risk Ratio (M‐H, Random, 95% CI) | 0.84 [0.35, 2.03] |
| Outcome or subgroup title | No. of studies | No. of participants | Statistical method | Effect size |
| 1 Severity/intensity of medically unexplained physical symptoms (post‐treatment score on self report scales) Show forest plot | 3 | Std. Mean Difference (IV, Random, 95% CI) | Subtotals only | |
| Analysis 4.1  Comparison 4 Pharmacotherapy versus a combination of medications, Outcome 1 Severity/intensity of medically unexplained physical symptoms (post‐treatment score on self report scales). | ||||
| 1.1 Tricyclic antidepressant versus tricyclic antidepressant + antipsychotic | 1 | 34 | Std. Mean Difference (IV, Random, 95% CI) | 0.26 [‐0.42, 0.94] |
| 1.2 Selective serotonin reuptake inhibitor versus selective serotonin reuptake inhibitor + antipsychotic | 2 | 107 | Std. Mean Difference (IV, Random, 95% CI) | 0.77 [0.32, 1.22] |
| 2 Acceptability Show forest plot | 2 | Risk Ratio (M‐H, Random, 95% CI) | Subtotals only | |
| Analysis 4.2  Comparison 4 Pharmacotherapy versus a combination of medications, Outcome 2 Acceptability. | ||||
| 2.1 Selective serotonin reuptake inhibitor versus selective serotonin reuptake inhibitor + antipsychotic | 2 | 118 | Risk Ratio (M‐H, Random, 95% CI) | 0.80 [0.25, 2.52] |
| 3 Anxiety (post‐treatment score on self report and clinician‐rated scales) Show forest plot | 2 | Std. Mean Difference (IV, Random, 95% CI) | Subtotals only | |
| Analysis 4.3  Comparison 4 Pharmacotherapy versus a combination of medications, Outcome 3 Anxiety (post‐treatment score on self report and clinician‐rated scales). | ||||
| 3.1 Selective serotonin reuptake inhibitor versus selective serotonin reuptake inhibitor + antipsychotic | 2 | 107 | Std. Mean Difference (IV, Random, 95% CI) | 0.95 [‐0.91, 2.82] |
| 4 Depression (post‐treatment score on self report and clinician‐rated scales) Show forest plot | 3 | Std. Mean Difference (IV, Random, 95% CI) | Subtotals only | |
| Analysis 4.4  Comparison 4 Pharmacotherapy versus a combination of medications, Outcome 4 Depression (post‐treatment score on self report and clinician‐rated scales). | ||||
| 4.1 Tricyclic antidepressant versus tricyclic antidepressant + antipsychotic | 1 | 34 | Std. Mean Difference (IV, Random, 95% CI) | 0.79 [0.09, 1.49] |
| 4.2 Selective serotonin reuptake inhibitor versus selective serotonin reuptake inhibitor + antipsychotic | 2 | 107 | Std. Mean Difference (IV, Random, 95% CI) | 0.58 [‐0.33, 1.48] |
| 5 Adverse effects Show forest plot | 2 | Risk Ratio (M‐H, Random, 95% CI) | Subtotals only | |
| Analysis 4.5  Comparison 4 Pharmacotherapy versus a combination of medications, Outcome 5 Adverse effects. | ||||
| 5.1 Selective serotonin reuptake inhibitor versus selective serotonin reuptake inhibitor + antipsychotic | 2 | 118 | Risk Ratio (M‐H, Random, 95% CI) | 0.6 [0.16, 2.29] |
| 6 Treatment response (post‐treatment score on self report and clinician‐rated scales) Show forest plot | 1 | Risk Ratio (M‐H, Random, 95% CI) | Subtotals only | |
| Analysis 4.6  Comparison 4 Pharmacotherapy versus a combination of medications, Outcome 6 Treatment response (post‐treatment score on self report and clinician‐rated scales). | ||||
| 6.1 Selective serotonin reuptake inhibitor versus selective serotonin reuptake inhibitor + antipsychotic | 1 | 60 | Risk Ratio (M‐H, Random, 95% CI) | 1.7 [0.94, 3.08] |
| Outcome or subgroup title | No. of studies | No. of participants | Statistical method | Effect size |
| 1 Severity/intensity of medically unexplained physical symptoms (post‐treatment score on self report scales) Show forest plot | 4 | Std. Mean Difference (IV, Random, 95% CI) | Subtotals only | |
| Analysis 5.1  Comparison 5 Subgroup analysis 1: Co‐morbidity (based on the comparison pharmacotherapy versus placebo), Outcome 1 Severity/intensity of medically unexplained physical symptoms (post‐treatment score on self report scales). | ||||
| 1.1 Co‐morbid mental disorders | 3 | 243 | Std. Mean Difference (IV, Random, 95% CI) | ‐0.91 [‐1.36, ‐0.46] |
| 1.2 No co‐morbid mental disorders | 1 | 200 | Std. Mean Difference (IV, Random, 95% CI) | ‐0.07 [‐0.35, 0.21] |
| 2 Acceptability Show forest plot | 4 | Risk Ratio (M‐H, Random, 95% CI) | Subtotals only | |
| Analysis 5.2  Comparison 5 Subgroup analysis 1: Co‐morbidity (based on the comparison pharmacotherapy versus placebo), Outcome 2 Acceptability. | ||||
| 2.1 Co‐morbid mental disorder | 2 | 163 | Risk Ratio (M‐H, Random, 95% CI) | 1.01 [0.64, 1.61] |
| 2.2 No co‐morbid mental disorder | 2 | 390 | Risk Ratio (M‐H, Random, 95% CI) | 1.05 [0.59, 1.89] |
| Outcome or subgroup title | No. of studies | No. of participants | Statistical method | Effect size |
| 1 Severity/intensity of medically unexplained physical symptoms (post‐treatment score on self report scales) Show forest plot | 7 | 804 | Std. Mean Difference (IV, Random, 95% CI) | ‐0.66 [‐0.97, ‐0.36] |
| Analysis 6.1  Comparison 6 Subgroup analysis 2: Source of funding (based on the comparison pharmacotherapy versus placebo), Outcome 1 Severity/intensity of medically unexplained physical symptoms (post‐treatment score on self report scales). | ||||
| 1.1 Funding by pharmaceutical industry | 5 | 685 | Std. Mean Difference (IV, Random, 95% CI) | ‐0.64 [‐1.02, ‐0.27] |
| 1.2 No funding by pharmaceutical industry | 2 | 119 | Std. Mean Difference (IV, Random, 95% CI) | ‐0.75 [‐1.29, ‐0.21] |
| 2 Acceptability Show forest plot | 6 | Risk Ratio (M‐H, Random, 95% CI) | Subtotals only | |
| Analysis 6.2 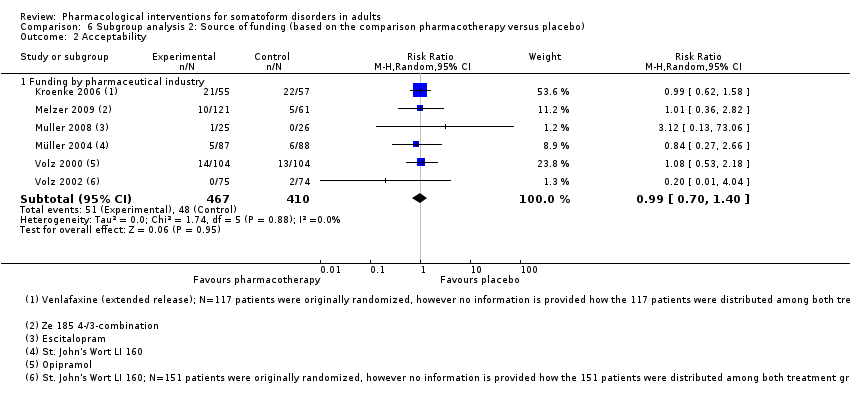 Comparison 6 Subgroup analysis 2: Source of funding (based on the comparison pharmacotherapy versus placebo), Outcome 2 Acceptability. | ||||
| 2.1 Funding by pharmaceutical industry | 6 | 877 | Risk Ratio (M‐H, Random, 95% CI) | 0.99 [0.70, 1.40] |
| Outcome or subgroup title | No. of studies | No. of participants | Statistical method | Effect size |
| 1 Severity/intensity of medically unexplained physical symptoms (post‐treatment score) Show forest plot | 7 | 1377 | Std. Mean Difference (IV, Random, 95% CI) | ‐0.75 [‐1.00, ‐0.49] |
| Analysis 7.1  Comparison 7 Subgroup analysis 3: Source outcome rating (based on the comparison pharmacotherapy versus placebo), Outcome 1 Severity/intensity of medically unexplained physical symptoms (post‐treatment score). | ||||
| 1.1 Self report scales | 7 | 804 | Std. Mean Difference (IV, Random, 95% CI) | ‐0.66 [‐0.97, ‐0.36] |
| 1.2 Clinician‐rated scales | 4 | 573 | Std. Mean Difference (IV, Random, 95% CI) | ‐0.91 [‐1.42, ‐0.40] |
| Outcome or subgroup title | No. of studies | No. of participants | Statistical method | Effect size |
| 1 Treatment response (post‐treatment score on self report and clinician‐rated scales) Show forest plot | 2 | Risk Ratio (M‐H, Random, 95% CI) | Subtotals only | |
| Analysis 8.1  Comparison 8 Best‐case/worst‐case analysis (based on comparison 'new‐generation antidepressants versus placebo'), Outcome 1 Treatment response (post‐treatment score on self report and clinician‐rated scales). | ||||
| 1.1 Complete‐case analysis | 2 | 119 | Risk Ratio (M‐H, Random, 95% CI) | 2.02 [0.82, 4.97] |
| 1.2 Best‐case analysis | 2 | 163 | Risk Ratio (M‐H, Random, 95% CI) | 2.59 [1.90, 3.53] |
| 1.3 Worst‐case analysis | 2 | 163 | Risk Ratio (M‐H, Random, 95% CI) | 1.41 [0.30, 6.63] |
| Outcome or subgroup title | No. of studies | No. of participants | Statistical method | Effect size |
| 1 Treatment response (post‐treatment score on self report and clinician‐rated scales) Show forest plot | 2 | Risk Ratio (M‐H, Random, 95% CI) | Subtotals only | |
| Analysis 9.1  Comparison 9 Best‐case/worst‐case analysis (based on comparison 'natural products versus placebo'), Outcome 1 Treatment response (post‐treatment score on self report and clinician‐rated scales). | ||||
| 1.1 Complete‐case analysis | 2 | 311 | Risk Ratio (M‐H, Random, 95% CI) | 1.75 [1.29, 2.36] |
| 1.2 Best‐case analysis | 2 | 324 | Risk Ratio (M‐H, Random, 95% CI) | 1.92 [1.26, 2.94] |
| 1.3 Worst‐case analysis | 2 | 324 | Risk Ratio (M‐H, Random, 95% CI) | 1.57 [1.27, 1.93] |

PRISMA study flow diagram.
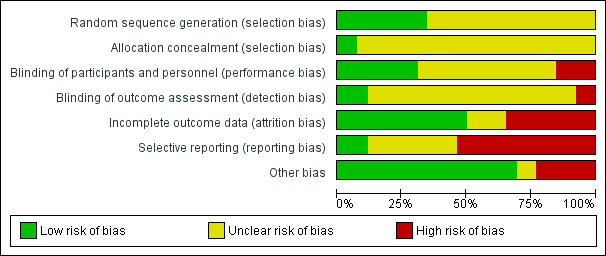
Risk of bias graph: review authors' judgements about each risk of bias item presented as percentages across all included studies.

Risk of bias summary: review authors' judgements about each risk of bias item for each included study.

Forest plot of comparison: 1 Pharmacotherapy versus placebo, outcome: 1.1 Severity/intensity of medically unexplained physical symptoms (post‐treatment score on self report scales).
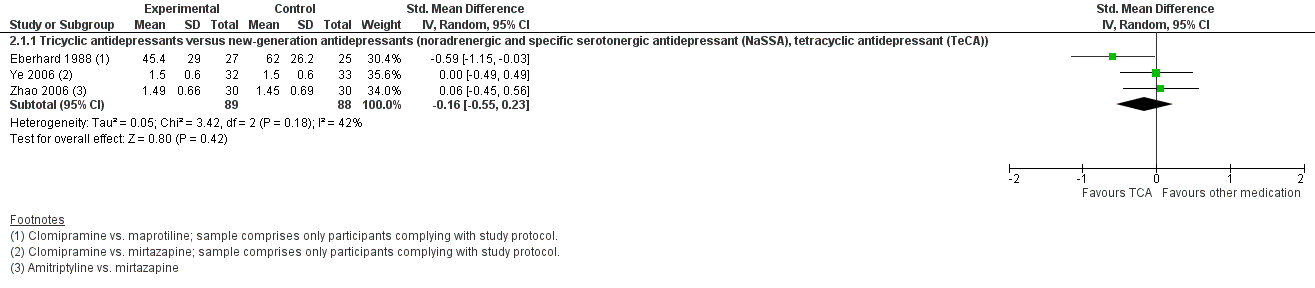
Forest plot of comparison: 2 Tricyclic antidepressants versus new‐generation antidepressants, outcome: 2.1 Reduction of the level of severity/intensity of medically unexplained physical symptoms (post‐treatment score on self report scales).

Forest plot of comparison: 3 New‐generation antidepressants (serotonin antagonist and reuptake inhibitors (SARI), noradrenergic and specific serotonergic antidepressant (NaSSA), selective serotonin reuptake inhibitor (SSRI)) versus other new‐generation antidepressants, outcome: 3.1 Reduction of the level of severity/intensity of medically unexplained physical symptoms (post‐treatment score on self report scales).

Comparison 1 Pharmacotherapy versus placebo, Outcome 1 Severity/intensity of medically unexplained physical symptoms (post‐treatment score on self report scales).
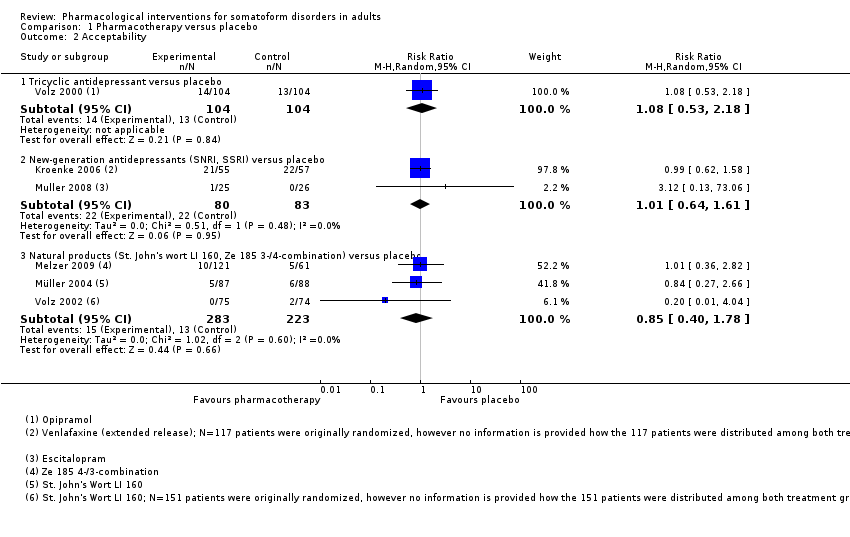
Comparison 1 Pharmacotherapy versus placebo, Outcome 2 Acceptability.

Comparison 1 Pharmacotherapy versus placebo, Outcome 3 Anxiety (post‐treatment score on self report and clinician‐rated scales).
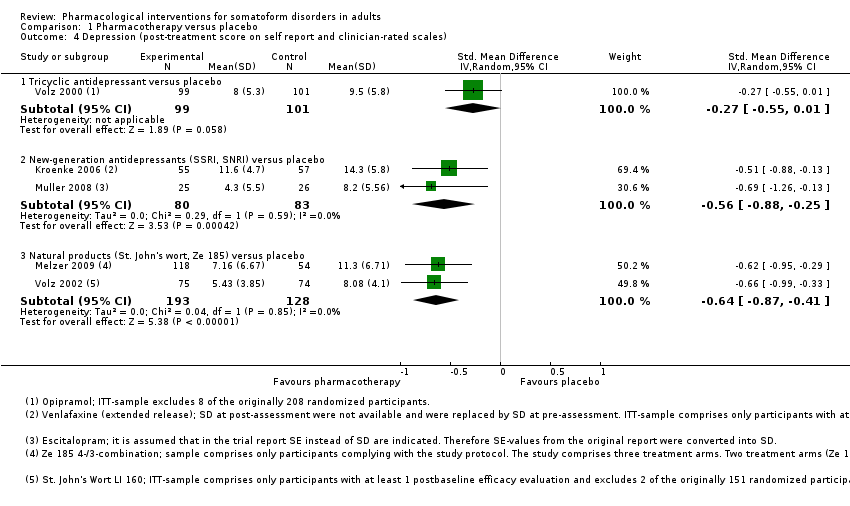
Comparison 1 Pharmacotherapy versus placebo, Outcome 4 Depression (post‐treatment score on self report and clinician‐rated scales).
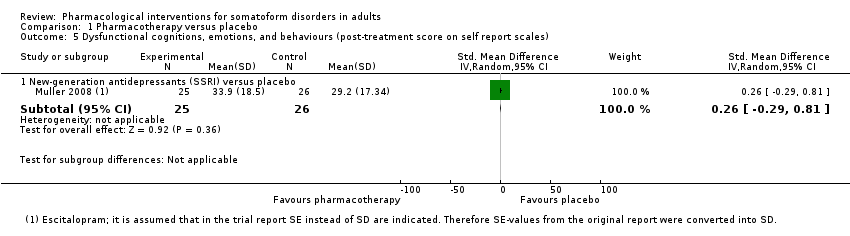
Comparison 1 Pharmacotherapy versus placebo, Outcome 5 Dysfunctional cognitions, emotions, and behaviours (post‐treatment score on self report scales).
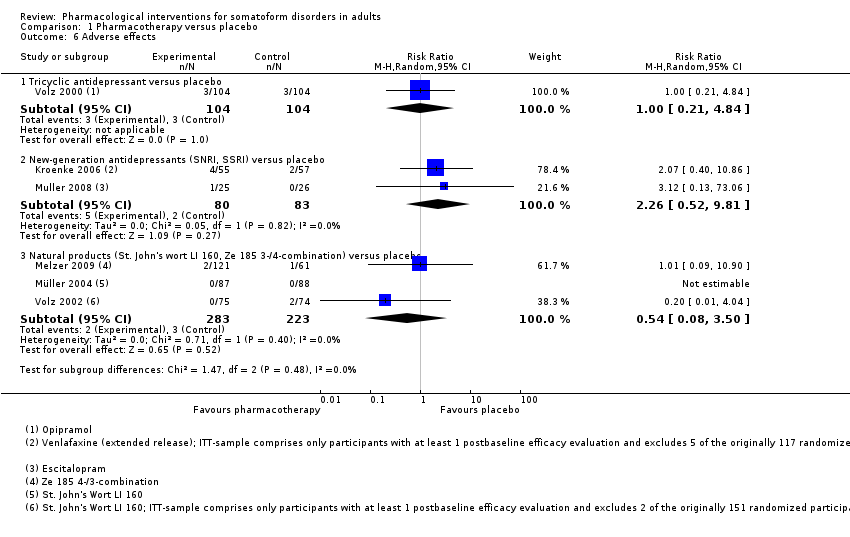
Comparison 1 Pharmacotherapy versus placebo, Outcome 6 Adverse effects.

Comparison 1 Pharmacotherapy versus placebo, Outcome 7 Treatment response (post‐treatment score on self report and clinician‐rated scales).

Comparison 1 Pharmacotherapy versus placebo, Outcome 8 Functional disability and quality of life (post‐treatment score on self report scales).

Comparison 2 Tricyclic antidepressants versus another medication, Outcome 1 Severity/intensity of medically unexplained physical symptoms (post‐treatment score on self report scales).

Comparison 2 Tricyclic antidepressants versus another medication, Outcome 2 Acceptability.

Comparison 2 Tricyclic antidepressants versus another medication, Outcome 3 Anxiety (post‐treatment score on self report and clinician‐rated scales).
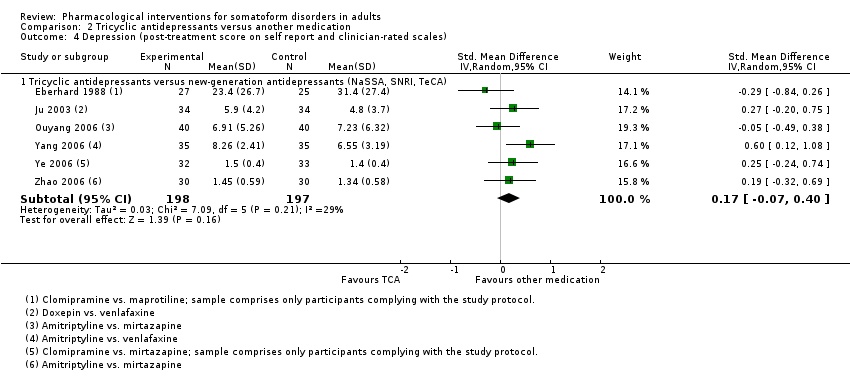
Comparison 2 Tricyclic antidepressants versus another medication, Outcome 4 Depression (post‐treatment score on self report and clinician‐rated scales).

Comparison 2 Tricyclic antidepressants versus another medication, Outcome 5 Adverse effects.

Comparison 2 Tricyclic antidepressants versus another medication, Outcome 6 Treatment response (post‐treatment score on self report and clinician‐rated scales).
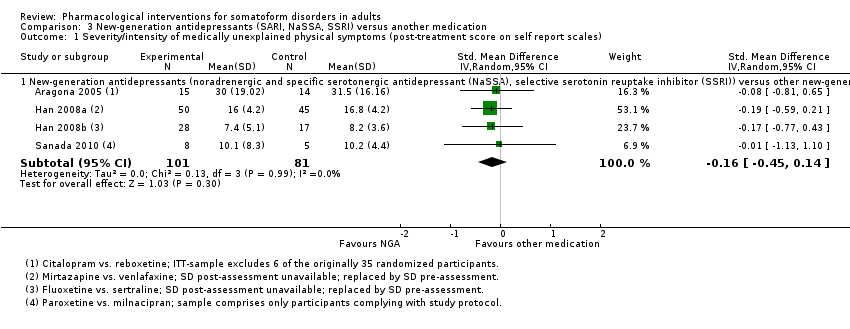
Comparison 3 New‐generation antidepressants (SARI, NaSSA, SSRI) versus another medication, Outcome 1 Severity/intensity of medically unexplained physical symptoms (post‐treatment score on self report scales).
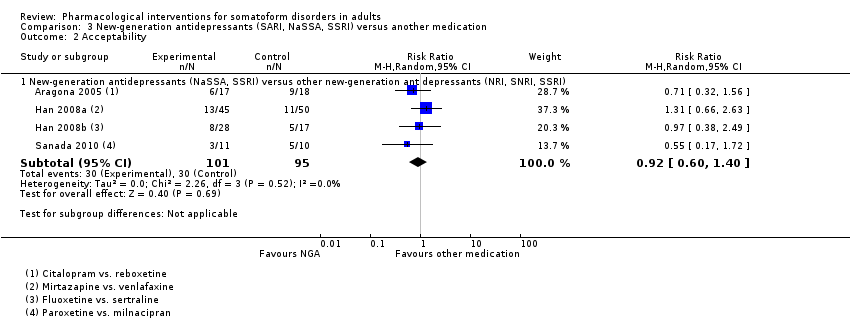
Comparison 3 New‐generation antidepressants (SARI, NaSSA, SSRI) versus another medication, Outcome 2 Acceptability.

Comparison 3 New‐generation antidepressants (SARI, NaSSA, SSRI) versus another medication, Outcome 3 Depression (post‐treatment score on self report and clinician‐rated scales).
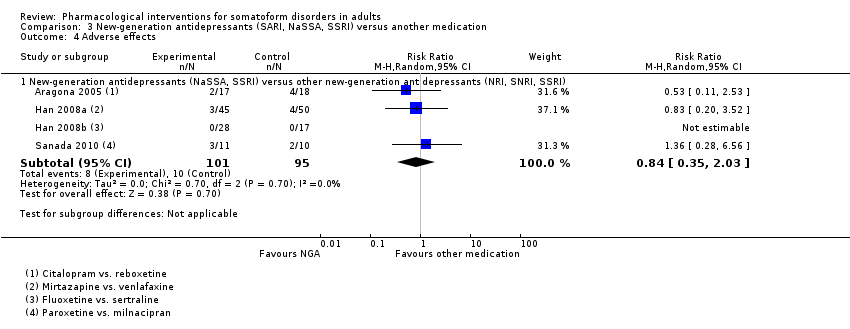
Comparison 3 New‐generation antidepressants (SARI, NaSSA, SSRI) versus another medication, Outcome 4 Adverse effects.
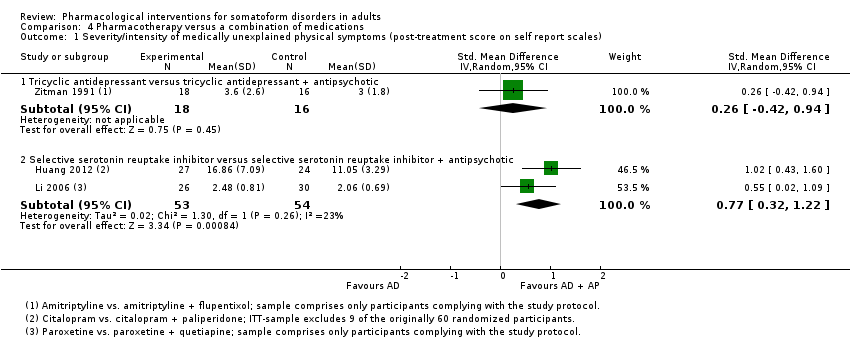
Comparison 4 Pharmacotherapy versus a combination of medications, Outcome 1 Severity/intensity of medically unexplained physical symptoms (post‐treatment score on self report scales).
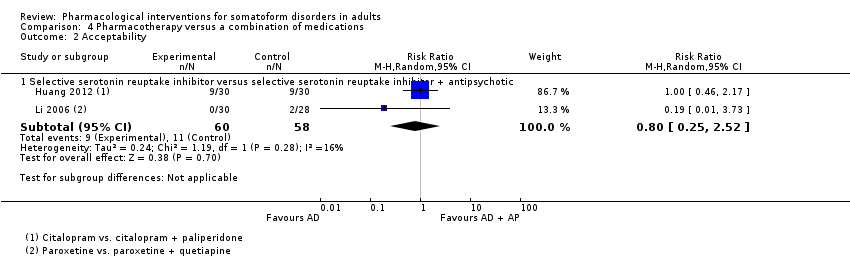
Comparison 4 Pharmacotherapy versus a combination of medications, Outcome 2 Acceptability.

Comparison 4 Pharmacotherapy versus a combination of medications, Outcome 3 Anxiety (post‐treatment score on self report and clinician‐rated scales).

Comparison 4 Pharmacotherapy versus a combination of medications, Outcome 4 Depression (post‐treatment score on self report and clinician‐rated scales).
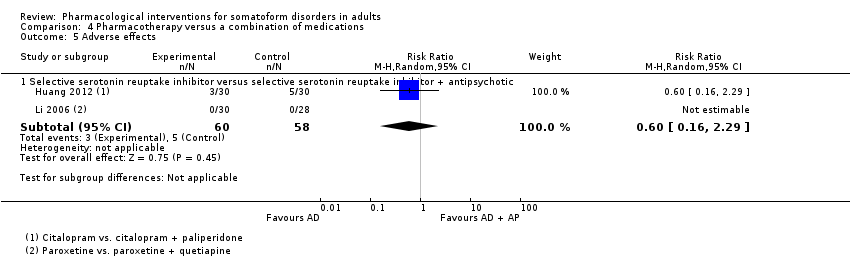
Comparison 4 Pharmacotherapy versus a combination of medications, Outcome 5 Adverse effects.

Comparison 4 Pharmacotherapy versus a combination of medications, Outcome 6 Treatment response (post‐treatment score on self report and clinician‐rated scales).
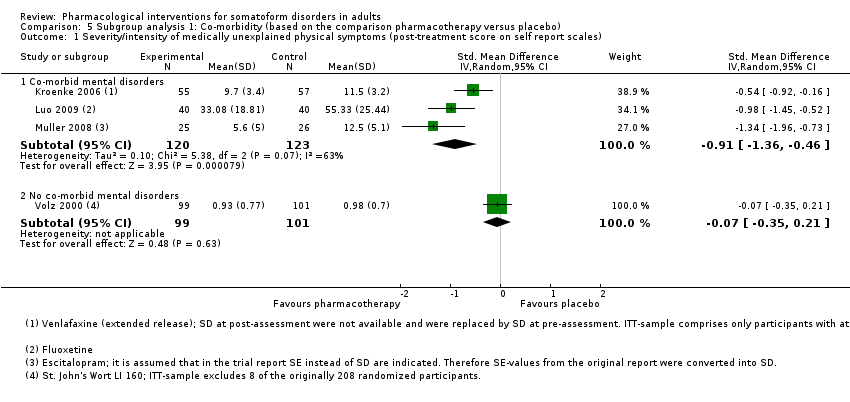
Comparison 5 Subgroup analysis 1: Co‐morbidity (based on the comparison pharmacotherapy versus placebo), Outcome 1 Severity/intensity of medically unexplained physical symptoms (post‐treatment score on self report scales).

Comparison 5 Subgroup analysis 1: Co‐morbidity (based on the comparison pharmacotherapy versus placebo), Outcome 2 Acceptability.

Comparison 6 Subgroup analysis 2: Source of funding (based on the comparison pharmacotherapy versus placebo), Outcome 1 Severity/intensity of medically unexplained physical symptoms (post‐treatment score on self report scales).

Comparison 6 Subgroup analysis 2: Source of funding (based on the comparison pharmacotherapy versus placebo), Outcome 2 Acceptability.

Comparison 7 Subgroup analysis 3: Source outcome rating (based on the comparison pharmacotherapy versus placebo), Outcome 1 Severity/intensity of medically unexplained physical symptoms (post‐treatment score).

Comparison 8 Best‐case/worst‐case analysis (based on comparison 'new‐generation antidepressants versus placebo'), Outcome 1 Treatment response (post‐treatment score on self report and clinician‐rated scales).

Comparison 9 Best‐case/worst‐case analysis (based on comparison 'natural products versus placebo'), Outcome 1 Treatment response (post‐treatment score on self report and clinician‐rated scales).
| Tricyclic antidepressants versus placebo for somatoform disorders in adults | ||||||
| Patient or population: somatoform disorders in adults | ||||||
| Outcomes | Illustrative comparative risks* (95% CI) | Relative effect | No of participants | Quality of the evidence | Comments | |
| Assumed risk | Corresponding risk | |||||
| Control | Tricyclic antidepressants versus placebo | |||||
| Severity/intensity of MUPS (post‐treatment score on self report scales) | ‐ | The mean severity/intensity of MUPS (post‐treatment score on self report scales) in the intervention groups was | ‐ | 239 | ⊕⊕⊝⊝ | SMD ‐0.13 (95% CI ‐0.39 to 0.13) |
| Acceptability (all‐cause drop‐outs) | No data available | |||||
| Anxiety (post‐treatment score on self report and clinician‐rated scales) | No data available | |||||
| Depression (post‐treatment score on self report and clinician‐rated scales) | No data available | |||||
| Adverse effects (drop‐outs due to adverse effects) | No data available | |||||
| Treatment response (post‐treatment score on self report and clinician‐rated scales) | No data available | |||||
| Functional disability and quality of life (post‐treatment score on self report and clinician‐rated scales) | No data available | |||||
| *The basis for the assumed risk (e.g. the median control group risk across studies) is provided in footnotes. The corresponding risk (and its 95% confidence interval) is based on the assumed risk in the comparison group and the relative effect of the intervention (and its 95% CI). | ||||||
| GRADE Working Group grades of evidence | ||||||
| 1 SCL‐90‐R and VAS: high scale scores correspond to a negative outcome. | ||||||
| New‐generation antidepressants versus placebo for somatoform disorders in adults | ||||||
| Patient or population: somatoform disorders in adults | ||||||
| Outcomes | Illustrative comparative risks* (95% CI) | Relative effect | No of participants | Quality of the evidence | Comments | |
| Assumed risk | Corresponding risk | |||||
| Control | New‐generation antidepressants versus placebo | |||||
| Severity/intensity of MUPS (post‐treatment score on self report scales) | ‐ | The mean severity/intensity of MUPS in the intervention groups was | ‐ | 243 | ⊕⊝⊝⊝ | SMD ‐0.91 (95% CI ‐1.36 to ‐0.46) |
| Acceptability (all‐cause drop‐outs)5 | Study population | RR 1.01 | 163 | ⊕⊕⊝⊝ | ‐ | |
| 265 per 1000 | 268 per 1000 | |||||
| Moderate | ||||||
| 193 per 1000 | 195 per 1000 | |||||
| Anxiety (post‐treatment score on self report and clinician‐rated scales) | ‐ | The mean anxiety score in the intervention groups was | ‐ | 163 | ⊕⊝⊝⊝ | SMD ‐0.88 (95% CI ‐1.81 to 0.05) |
| Depression (post‐treatment score on self report and clinician‐rated scales) | ‐ | The mean depression score in the intervention groups was | ‐ | 163 | ⊕⊝⊝⊝ | SMD ‐0.56 (95% CI ‐0.88 to ‐0.25) |
| Adverse effects (drop‐outs due to adverse effects)5 | Study population | RR 2.26 | 163 | ⊕⊕⊝⊝ | ‐ | |
| 24 per 1000 | 54 per 1000 | |||||
| Moderate | ||||||
| 18 per 1000 | 41 per 1000 | |||||
| Treatment response (post‐treatment score on self report and clinician‐rated scales) | Study population | RR 2 | 163 | ⊕⊝⊝⊝ | ‐ | |
| 337 per 1000 | 675 per 1000 | |||||
| Moderate | ||||||
| 319 per 1000 | 638 per 1000 | |||||
| Functional disability and quality of life (post‐treatment score on self report scales) | ‐ | The mean functional disability score/quality of life score in the intervention groups was | ‐ | 163 | ⊕⊝⊝⊝ | SMD ‐0.52 (95% CI ‐1 to ‐0.04) |
| *The basis for the assumed risk (e.g. the median control group risk across studies) is provided in footnotes. The corresponding risk (and its 95% confidence interval) is based on the assumed risk in the comparison group and the relative effect of the intervention (and its 95% CI). | ||||||
| GRADE Working Group grades of evidence | ||||||
| 1 PHQ‐15 and MOSPM: high scale scores correspond to a negative outcome. | ||||||
| Natural products versus placebo for somatoform disorders in adults | ||||||
| Patient or population: somatoform disorders in adults | ||||||
| Outcomes | Illustrative comparative risks* (95% CI) | Relative effect | No of participants | Quality of the evidence | Comments | |
| Assumed risk | Corresponding risk | |||||
| Control | Natural products versus placebo | |||||
| Severity/intensity of MUPS (post‐treatment score on self report scales) | ‐ | The mean severity/intensity of MUPS in the intervention groups was | ‐ | 322 | ⊕⊕⊝⊝ | SMD ‐0.74 (95% CI ‐0.97 to ‐0.51) |
| Acceptability (all‐cause drop‐outs4) | Study population | RR 0.85 | 506 | ⊕⊕⊝⊝ | ‐ | |
| 58 per 1000 | 50 per 1000 | |||||
| Moderate | ||||||
| 68 per 1000 | 58 per 1000 | |||||
| Anxiety (post‐treatment score on self report and clinician‐rated scales) | ‐ | The mean anxiety score in the intervention groups was | ‐ | 321 | ⊕⊕⊝⊝ | SMD ‐0.83 (95% CI ‐1.13 to ‐0.52) |
| Depression (post‐treatment score on self report and clinician‐rated scales) | ‐ | The mean depression score in the intervention groups was | ‐ | 321 | ⊕⊕⊝⊝ | SMD ‐0.64 (95% CI ‐0.87 to ‐0.41) |
| Adverse effects (drop‐outs due to adverse effects4) | Study population | RR 0.54 | 506 | ⊕⊕⊝⊝ | ‐ | |
| 13 per 1000 | 7 per 1000 | |||||
| Moderate | ||||||
| 16 per 1000 | 9 per 1000 | |||||
| Treatment response (post‐treatment score on self report and clinician‐rated scales) | Study population | RR 1.77 | 324 | ⊕⊝⊝⊝ | ‐ | |
| 340 per 1000 | 601 per 1000 | |||||
| Moderate | ||||||
| 352 per 1000 | 623 per 1000 | |||||
| Functional disability and quality of life (post‐treatment score on self report scales) | No data available | |||||
| *The basis for the assumed risk (e.g. the median control group risk across studies) is provided in footnotes. The corresponding risk (and its 95% confidence interval) is based on the assumed risk in the comparison group and the relative effect of the intervention (and its 95% CI). | ||||||
| GRADE Working Group grades of evidence | ||||||
| 1 SOMS‐7 and SCL‐90‐R: high scale scores correspond to a negative outcome. | ||||||
| Tricyclic antidepressants versus another medication for somatoform disorders in adults | ||||||
| Patient or population: somatoform disorders in adults | ||||||
| Outcomes | Illustrative comparative risks* (95% CI) | Relative effect | No of participants | Quality of the evidence | Comments | |
| Assumed risk | Corresponding risk | |||||
| Control | Tricyclic antidepressants versus another medication | |||||
| Severity/intensity of MUPS (post‐treatment score on self report scales) | ‐ | The mean severity/intensity of MUPS in the intervention groups was | ‐ | 177 | ⊕⊕⊝⊝ | SMD ‐0.16 (95% CI ‐0.55 to 0.23) |
| Acceptability (all‐cause drop‐outs4) | Study population | RR 1.48 | 556 | ⊕⊕⊝⊝ | ‐ | |
| 28 per 1000 | 41 per 1000 | |||||
| Moderate | ||||||
| 0 per 1000 | 0 per 1000 | |||||
| Anxiety (post‐treatment score on self report and clinician‐rated scales) | ‐ | The mean anxiety score in the intervention groups was | ‐ | 255 | ⊕⊝⊝⊝ | SMD 0.37 (95% CI ‐0.21 to 0.95) |
| Depression (post‐treatment score on self report and clinician‐rated scales) | ‐ | The mean depression score in the intervention groups was | ‐ | 395 | ⊕⊕⊝⊝ | SMD 0.17 (95% CI ‐0.07 to 0.4) |
| Adverse effects (drop‐outs due to adverse effects4) | Study population | RR 2.37 | 556 | ⊕⊕⊝⊝ | ‐ | |
| 10 per 1000 | 25 per 1000 | |||||
| Moderate | ||||||
| 0 per 1000 | 0 per 1000 | |||||
| Treatment response (post‐treatment score on self report and clinician‐rated scales) | Study population | RR 0.93 | 130 | ⊕⊕⊝⊝ | ‐ | |
| 677 per 1000 | 630 per 1000 | |||||
| Moderate | ||||||
| 681 per 1000 | 633 per 1000 | |||||
| Functional disability and quality of life | No data available | |||||
| *The basis for the assumed risk (e.g. the median control group risk across studies) is provided in footnotes. The corresponding risk (and its 95% confidence interval) is based on the assumed risk in the comparison group and the relative effect of the intervention (and its 95% CI). | ||||||
| GRADE Working Group grades of evidence | ||||||
| 1 VAS ‐ Pain and SCL‐90‐R: high scale scores correspond to a negative outcome. | ||||||
| Antidepressants versus a combination of medications for somatoform disorders in adults | ||||||
| Patient or population: somatoform disorders in adults | ||||||
| Outcomes | Illustrative comparative risks* (95% CI) | Relative effect | No of participants | Quality of the evidence | Comments | |
| Assumed risk | Corresponding risk | |||||
| Control | Pharmacotherapy versus a combination of medications | |||||
| Severity/intensity of MUPS (post‐treatment score on self report scales) | ‐ | The mean severity/intensity of MUPS in the intervention groups was | ‐ | 107 | ⊕⊕⊝⊝ | SMD 0.77 (95% CI 0.32 to 1.22) |
| Acceptability (all‐cause drop‐outs4) | Study population | RR 0.8 | 118 | ⊕⊕⊝⊝ | ‐ | |
| 190 per 1000 | 152 per 1000 | |||||
| Moderate | ||||||
| 186 per 1000 | 149 per 1000 | |||||
| Anxiety (post‐treatment score on self report and clinician‐rated scales) | ‐ | The mean anxiety in the intervention groups was | ‐ | 107 | ⊕⊝⊝⊝ | SMD 0.95 (95% CI ‐0.91 to 2.82) |
| Depression (post‐treatment score on self report and clinician‐rated scales) | ‐ | The mean depression in the intervention groups was | ‐ | 107 | ⊕⊝⊝⊝ | SMD 0.58 (95% CI ‐0.33 to 1.48) |
| Adverse effects (drop‐outs due to adverse effects) | No data available | |||||
| Treatment response (post‐treatment score on self report and clinician‐rated scales) | No data available | |||||
| Functional disability and quality of life | No data available | |||||
| *The basis for the assumed risk (e.g. the median control group risk across studies) is provided in footnotes. The corresponding risk (and its 95% confidence interval) is based on the assumed risk in the comparison group and the relative effect of the intervention (and its 95% CI). | ||||||
| GRADE Working Group grades of evidence | ||||||
| 1 SOMS‐7 and SCL‐90 Somatisation Score: high scale scores correspond to a negative outcome. | ||||||
| Diagnostic category | Eligible for the current review? | ||
| DSM‐IV | ICD‐10 | yes | no |
| Somatisation disorder (300.81) | Somatisation disorder (F45.0) | x | ‐ |
| Undifferentiated somatoform disorder (300.82) | Undifferentiated somatoform disorder (F45.1) | x | ‐ |
| ‐ | Somatoform autonomic dysfunction (F45.3) | x | ‐ |
| Pain disorder (307.8) | Persistent somatoform pain disorder (F45.4) | x | ‐ |
| Hypochondriasis (300.7) | Hypochondriacal disorder (F45.2) | ‐ | x |
| ‐ | Other somatoform disorders (F45.8) | ‐ | x |
| Somatoform disorders, unspecified (300.82) | Somatoform disorders, unspecified (F45.9) | ‐ | x |
| Body dysmorphic disorder (300.7) | Body dysmorphic disorder (F45.2) | ‐ | x |
| Conversion disorder (300.11) | Dissociative and conversion disorders (F44)* | ‐ | x |
| DSM‐IV: Diagnostic and Statistical Manual of Mental Disorders; ICD‐10: International Classification of Diseases. Note. *Conversion disorder is not classified as a somatoform disorder in ICD‐10 but is a separate diagnostic category. | |||
| Trial ID | Experimental treatment group ‐ medication class | Control treatment group ‐ medication class | Co‐morbid mental disorders? Yes/no/ns | Detailed information about co‐morbid diagnoses in participants or exclusion of participants with co‐morbid diagnoses (for studies that do not provide details about co‐morbid conditions) | Detailed information about the exclusion of participants with co‐morbid diagnoses |
| SNRI | ‐ | Yes | Major depression, generalised anxiety disorder, social anxiety disorder | People with current/past history of mania, bipolar disorder, schizophrenia, or other psychotic disorder; history of serious or clinically unstable psychiatric condition; known or suspected alcohol or drug abuse within 6 months of screening | |
| SSRI | ‐ | Yes | 38/80 participants had depression (17 item‐HDRS ≥ 17) | People with co‐exist depressive symptoms occurred prior to pain with HDRS ‐ Total Score ≥ 17 | |
| NP | ‐ | No | ‐ | People with historically known or clinical indication of a psychiatric disorder | |
| NP | ‐ | ns | ‐ | People with co‐morbid depression, drug/alcohol abuse, schizophrenia, or schizo‐affective disorder | |
| SSRI | ‐ | Yes | Dysthymia (27.5%); major depressive episode (2.0%); anxiety disorder (panic disorder/agoraphobia/social anxiety disorder/generalised anxiety disorder) (52.9%) | People with somatic symptoms that were judged to be secondary to a psychiatric disorder other than MDS; current or past psychotic disorder; significant suicidal risk | |
| TCA | ‐ | ns | ‐ | People with psychotic illness (including MDS), organic brain syndrome, or alcohol dependence | |
| TCA | ‐ | No | ‐ | People with other significant Axis I diagnoses (e.g. panic disorder, major depressive disorder, substance abuse) | |
| NP | ‐ | ns | ‐ | People with an additional diagnosis of depression, schizophrenia, schizo‐affective disorder, or dementia | |
| AP | AP | Yes | Dysthymia (n = 27), anxiety disorder NOS (n = 6) | ns | |
| SSRI | NRI | No | ‐ | People with a diagnosis of another mental disorder | |
| TeCA | TCA | ns | ‐ | People with major depressive disorder, abuse of drugs, and other psychiatric illnesses | |
| SSRI | SSRI | ns | ‐ | People with history of or current (or both) psychotic disorders (such as schizophrenia, schizoaffective disorder, and bipolar disorder); current DSM Axis I disorders that could possibly account for the somatic symptoms (e.g. MDD, anxiety disorders, factitious disorder, malingering, or another somatoform disorder such as somatisation disorder); substance abuse of dependence in the previous 12 months; effect of co‐morbid psychiatric disorders on the effects of the antidepressants cannot be excluded because of the absence of a structured clinical interview, although participants were rigorously evaluated according to DSM‐IV criteria | |
| SSRI + AP | SSRI | no | ‐ | People with a diagnosis of another mental disorder (e.g. panic disorder, MDD, or substance abuse) | |
| SNRI | TCA | ns | ‐ | People with drug dependence, severe psychosis, or paranoia | |
| SNRI | TCA | ns | ‐ | People with psychotic symptoms, severe brain injury, or substance abuse | |
| SSRI | TCA | ns | ‐ | ns | |
| SSRI + AP | SSRI | ns | ‐ | ns | |
| NaSSA | TCA | Yes | 38/80 participants had depression (17 item‐HDRS ≥ 17). No information about other co‐morbidities in the sample was provided | People whose pain was caused by depression, anxiety, or schizophrenia | |
| SSRI | SNRI | ns | ‐ | ns | |
| SARI | NSAID | Yes | Based on diagnostic criteria in CCMD‐3: depression (n = 46), dysthymia (n = 50), hypochondriasis (n = 20) | Severely depressed, suicidal people | |
| SNRI | TCA | ns | ‐ | ns | |
| NaSSA | TCA | ns | ns | People with any type of drug dependence | |
| SNRI | TCA | ns | ‐ | ns | |
| NaSSA | TCA | no | ‐ | People with other mental disorders | |
| TCA + AP | TCA | yes | Atypical depression (n = 1), dysthymic disorder (n = 1), panic disorder (n = 1), nicotine abuse (n = 1), tea abuse (n = 1), benzodiazepine abuse (n = 1) | People with a serious psychiatric disease necessitating immediate treatment; or who were alcohol or illicit drug dependent | |
| Anxiety disorder NOS: anxiety disorder not otherwise specified; AP: antipsychotic; CCMD: Chinese Classification of Mental Disorders; SARI: serotonin antagonist and reuptake inhibitor; DSM: Diagnostic and Statistical Manual of Mental Disorders; HDRS: Hamilton Depression Rating Scale; ID: identification; ns: not specified; MDD: major depressive disorder; MDS: major depressive syndrome; n: number; NaSSA: noradrenergic specific serotonergic antidepressant; NP: natural product; NRI: noradrenaline reuptake inhibitor; NSAID: non‐steroidal anti‐inflammatory drug; SNRI: serotonin noradrenaline reuptake inhibitor; SSRI: selective serotonin reuptake inhibitor; TCA: tricyclic antidepressant; TeCA: tetracyclic antidepressant. | |||||
| Trial ID | Experimental treatment group ‐ medication class | Control treatment group ‐ medication class | Detailed information about the exclusion of or permission of concomitant treatments | Detailed information about concomitant treatments |
| SNRI | ‐ | ‐ Exclusion: use of triptans, psychoactive herbal medications, or any other psychoactive drugs or having a positive urine drug test at screening ‐ Permitted: zaleplon, zopiclone (1 dose nightly) as needed for insomnia for up to 6 nights during the 14 days immediately following randomisation and short‐term treatments for symptoms of allergies, colds, or influenza (without psychotropic effects) | ‐ Proportion of participants who took at least 1 concomitant medication in venlafaxine ER groups vs. placebo were 63.6% vs. 63.3%; for NSAIDs 10% vs. 13%; for paracetamol (acetaminophen) 7% vs. 9%; for COX‐2 inhibitors 8% vs. 3%; and for salicylates 4% vs. 4% | |
| SSRI | ‐ | ‐ Exclusion: use of antidepressants for the treatment of pain or depression | ‐ | |
| NP | ‐ | ‐ Exclusion: psychotherapy, physiotherapy, acupuncture, or using psychoactive drugs including central stimulants and α‐/β‐blockers were excluded ‐ Permitted: in case of sleeping disorders, chloral hydrate was allowed up to 3 g/day | ‐ | |
| NP | ‐ | ‐ Exclusion: use of psychotropic drugs 4 weeks before and during the study, concomitant psychotherapy, and concomitant treatment with phenprocoumon or cyclosporin (or both) | ‐ | |
| SSRI | ‐ | ‐ Exclusion: use of psychotropics or cognitive‐behavioural therapy | ‐ | |
| TCA | ‐ | ‐ | ‐ | |
| TCA | ‐ | ‐ | ‐ | |
| NP | ‐ | ‐ Exclusion: concomitant treatment with psychopharmacological active compounds | ‐ | |
| AP | AP | ‐ | ‐ | |
| SSRI | NRI | ‐ Exclusion: psychotropic drugs endowed with an analgesic action (e.g. amitriptyline) ‐ Permitted: benzodiazepines at low doses for people with sleep disturbances ‐ Because people with other mental disorders were excluded, participants did not take any other type of psychotropic drugs | ‐ | |
| TeCA | TCA | ‐ Exclusion: other central nervous system‐active drugs | ‐ | |
| NaSSA | ‐ | ‐ Exclusion: other psychotropic medications; use of prescription analgesics, muscle relaxants, and corticosteroids ‐ Permitted: hypnosedatives and benzodiazepines only for temporary control of insomnia or anxiety; concomitant medications such as non‐prescription paracetamol were allowed only on an as‐needed basis | ‐ Mirtazapine group: 46% lorazepam, 10% alprazolam ‐ Venlafaxine group: 32% lorazepam, 29% alprazolam | |
| SSRI | SSRI | ‐ Exclusion: other psychotropic medications; use of prescription analgesics, muscle relaxants, and corticosteroids ‐ Permitted: hypnosedatives and benzodiazepines only for temporary control of insomnia or anxiety; concomitant medications such as non‐prescription paracetamol were allowed only on an as‐needed basis | ‐ Fluoxetine group: 32.1% lorazepam, 7.1% alprazolam ‐ Sertraline group: 35.3% lorazepam, 17.6% alprazolam | |
| SSRI + AP | SSRI | ‐ Exclusion: other psychotropic medications ‐ Permitted: benzodiazepines for insomnia, only for temporary control of the symptoms | ‐ | |
| SNRI | TCA | ‐ Permitted: treatment of adverse effects insomnia/anxiety with benzodiazepines and nausea with vitamin B6 | ‐ | |
| SNRI | TCA | ‐ Exclusion: antidepressant and AP medication ‐ Permitted: sleep medication alprazolam (0.4‐0.8 mg/day) | ‐ | |
| SSRI | TCA | ‐ Permitted: alprazolam of a maximum dose of 0.8 mg/day | ‐ | |
| SSRI + AP | SSRI | ‐ | ‐ | |
| NaSSA | TCA | ‐ Exclusion: any other medication ‐ Permitted: exception of benzodiazepines for participants with sleep difficulties | ‐ | |
| SSRI | SNRI | ‐ | ‐ | |
| DAS | NSAID | ‐ Exclusion: any other medication | ‐ | |
| SNRI | TCA | ‐ | ‐ | |
| SNRI | TCA | ‐ Permitted: alprazolam (0.4‐0.8 mg/day) for participants with sleep difficulties | ‐ | |
| NaSSA | TCA | ‐ Permitted: zolpidem for participants with sleep difficulties | ‐ | |
| NaSSA | TCA | ‐ Exclusion: use of MAOI or other antidepressants during the first 2 weeks of treatment; use of other medication such as antidepressants, mood stabiliser, antipsychotic medication, or electroconvulsive therapy during the 8 treatment weeks ‐ Permitted: benzodiazepines were allowed for participants with insomnia. Benzhexol was allowed for participants with extrapyramidal adverse effects | ‐ | |
| TCA + AP | TCA | ‐ Permitted: benzodiazepines and non‐narcotic analgesics could be continued during the trial, but the participants were asked to keep the dose as low as possible | ‐ | |
| AP: antipsychotic; COX: cyclo‐oxygenase; DAS: ; ER: extended release; ID: identification; MAOI: monoamine oxidase inhibitors; NaSSA: noradrenergic specific serotonergic antidepressant; NP: natural product; NRI: noradrenaline reuptake inhibitor; NSAID: non‐steroidal anti‐inflammatory drug; SNRI: serotonin noradrenaline reuptake inhibitor; SSRI: selective serotonin reuptake inhibitor; TCA: tricyclic antidepressant; TeCA: tetracyclic antidepressant. | ||||
| Trial ID | Experimental treatment | Placebo | Control treatment | ||||||||||
| Medication class | Chemical agent | Attrition | Total | % attrition | Attrition | Total | % attrition | Medication class | Chemical agent | Attrition | Total | % attrition | |
| TCA | Amitriptyline | ns | 26 | 25.0 | ns | 24 | 31.0 | ‐ | ‐ | ‐ | ‐ | ‐ | |
| TCA | Amitriptyline | 0 | 15 | 0 | ‐ | ‐ | ‐ | SSRI | Paroxetinea | 0 | 45 | 0 | |
| TCA | Amitriptyline | 0 | 32 | 0 | ‐ | ‐ | ‐ | SNRI | Venlafaxine | 0 | 36 | 0 | |
| TCA | Amitriptyline | 0 | 35 | 0 | ‐ | ‐ | ‐ | SNRI | Venlafaxine | 0 | 35 | 0 | |
| TCA | Amitriptyline | 0 | 35 | 0 | ‐ | ‐ | ‐ | SNRI | Venlafaxine | 0 | 35 | 0 | |
| TCA | Amitriptyline | 0 | 40 | 0 | ‐ | ‐ | ‐ | NaSSA | Mirtazapine | 0 | 40 | 0 | |
| TCA | Amitriptyline | ns | 30 | ne | ‐ | ‐ | ‐ | NaSSA | Mirtazapine | ns | 30 | ne | |
| TCA | Amitriptyline | ns | ns | ne | ‐ | ‐ | ‐ | TCA + AP | Amitriptyline + flupentixol | ns | ns | ne | |
| TCA | Clomipramine | 2 | 35 | 5.7 | ‐ | ‐ | ‐ | NaSSA | Mirtazapine | 2 | 35 | 5.7 | |
| TCA | Clomipramine | 13 | 40 | 32.5 | ‐ | ‐ | ‐ | TeCA | Maprotiline | 5 | 30 | 16.7 | |
| TCA | Doxepin | 0 | 34 | 0 | ‐ | ‐ | ‐ | SNRI | Venlafaxine | 0 | 34 | 0 | |
| TCA | Opipramol | 14 | 104 | 13.5 | 13 | 104 | 12.4 | ‐ | ‐ | ‐ | ‐ | ‐ | |
| TCA + AP | Amitriptyline + flupentixol | ns | ns | ne | ‐ | ‐ | ‐ | TCA | Amitriptyline | ns | ns | ne | |
| SSRI | Paroxetinea | 0 | 45 | 0 | ‐ | ‐ | ‐ | TCA | Amitriptyline | 0 | 15 | 0 | |
| SSRI | Paroxetine | 0 | 30 | 0 | ‐ | ‐ | ‐ | SSRI + AP | Paroxetine + quetiapine | 2 | 28 | 7.1 | |
| SSRI | Paroxetine | 3 | 11 | 27.3 | ‐ | ‐ | ‐ | SNRI | Milnacipran | 5 | 10 | 50.0 | |
| SSRI | Fluoxetine | ns | 40 | ne | ns | 40 | ne | ‐ | ‐ | ‐ | ‐ | ‐ | |
| SSRI | Fluoxetine | 8 | 28 | 28.6 | ‐ | ‐ | ‐ | SSRI | Sertraline | 5 | 17 | 29.4 | |
| SSRI | Citalopram | 9 | 30 | 30.0 | ‐ | ‐ | ‐ | SSRI + AP | Citalopram + paliperidone | 9 | 30 | 30.0 | |
| SSRI | Citalopram | 6 | 17 | 35.3 | ‐ | ‐ | ‐ | NRI | Reboxetine | 9 | 18 | 50.0 | |
| SSRI | Escitalopram | 1 | 25 | 4.0 | 0 | 26 | 0 | ‐ | ‐ | ‐ | ‐ | ‐ | |
| SSRI | Sertraline | 5 | 17 | 29.41 | ‐ | ‐ | ‐ | SSRI | Fluoxetine | 8 | 28 | 28.6 | |
| SSRI + AP | Citalopram + paliperidone | 9 | 30 | 30.0 | ‐ | ‐ | ‐ | SSRI | Citalopram | 9 | 30 | 30.00 | |
| SSRI + AP | Paroxetine + quetiapine | 0 | 30 | 0 | ‐ | ‐ | ‐ | SSRI | Paroxetine | 2 | 28 | 7.1 | |
| SNRI | Venlafaxine (extended release) | 21 | 55 | 38.2 | 22 | 57 | 38.6 | ‐ | ‐ | ‐ | ‐ | ‐ | |
| SNRI | Venlafaxine | 0 | 36 | 0 | ‐ | ‐ | ‐ | TCA | Amitriptyline | 0 | 32 | 0 | |
| SNRI | Venlafaxine | 0 | 35 | 0 | ‐ | ‐ | ‐ | TCA | Amitriptyline | 0 | 35 | 0 | |
| SNRI | Venlafaxine | 0 | 35 | 0 | ‐ | ‐ | ‐ | TCA | Amitriptyline | 0 | 35 | 0 | |
| SNRI | Venlafaxine | 0 | 34 | 0 | ‐ | ‐ | ‐ | TCA | Doxepin | 0 | 34 | 0 | |
| SNRI | Venlafaxine | 13 | 45 | 28.9 | ‐ | ‐ | ‐ | NaSSA | Mirtazapine | 11 | 50 | 22.0 | |
| SNRI | Milnacipran | 5 | 10 | 50.0 | ‐ | ‐ | ‐ | SSRI | Paroxetine | 3 | 11 | 27.3 | |
| NaSSA | Mirtazapine | 0 | 40 | 0 | ‐ | ‐ | ‐ | TCA | Amitriptyline | 0 | 40 | 0 | |
| NaSSA | Mirtazapine | 2 | 35 | 5.7 | ‐ | ‐ | ‐ | TCA | Clomipramine | 2 | 35 | 5.7 | |
| NaSSA | Mirtazapine | ns | 30 | ne | ‐ | ‐ | ‐ | TCA | Amitriptyline | ns | 30 | ne | |
| NaSSA | Mirtazapine | 11 | 50 | 22.0 | ‐ | ‐ | ‐ | SNRI | Venlafaxine | 13 | 45 | 28.9 | |
| TeCA | Maprotiline | 5 | 30 | 16.7 | ‐ | ‐ | ‐ | TCA | Clomipramine | 13 | 40 | 32.5 | |
| NRI | Reboxetine | 9 | 18 | 50.0 | ‐ | ‐ | ‐ | SSRI | Citalopram | 6 | 17 | 35.29 | |
| SARI | Traxodone | 0 | 70 | 0 | ‐ | ‐ | ‐ | NSAID | Ibuprofen | 0 | 70 | 0 | |
| AP | Levosulpride | 2 | 15 | 13.3 | ‐ | ‐ | ‐ | AP | Racemic sulpiride | 2 | 15 | 13.3 | |
| AP | Racemic sulpiride | 2 | 15 | 13.3 | ‐ | ‐ | ‐ | AP | Levosulpride | 2 | 15 | 13.3 | |
| NP | St. John's wort LI 160 | 5 | 87 | 5.8 | 6 | 88 | 6.8 | ‐ | ‐ | ‐ | ‐ | ‐ | |
| NP | St. John's wort LI 160 | 0 | 75 | 0.0 | 2 | 74 | 2.7 | ‐ | ‐ | ‐ | ‐ | ‐ | |
| NP | Ze 185 3‐/4‐combinationc | 10 | 121 | 8.3 | 5 | 61 | 8.2 | ‐ | ‐ | ‐ | ‐ | ‐ | |
| AP: antipsychotic; ID: identification; NaSSA: noradrenergic specific serotonergic antidepressant; ns: not specified; ne: not estimable; NP: natural product; NRI: noradrenaline reuptake inhibitor, SARI: serotonin antagonist and reuptake inhibitor; SNRI: serotonin noradrenaline reuptake inhibitor; SSRI: selective serotonin reuptake inhibitor; TCA: tricyclic antidepressant; TeCA: tetracyclic antidepressant. Total sample sizes and attrition rates refer to the total number of randomised participants. a Trial included 3 arms: paroxetine, open paroxetine, and placebo; we combined the attrition rate of paroxetine and open paroxetine. b 117 participants were originally randomised but information about sample sizes of treatment and control group were missing. However, study authors stated that in the intention‐to‐treat (ITT) population, they only included participants who had at least 1 post‐baseline efficacy evaluation yielding in an ITT sample of 112. No information was provided about how the 117 participants were distributed among treatment groups. Therefore, we calculated drop‐out rate based on the 112 sample. c Trial included 3 arms: Ze 185 4‐combination, Ze 185 3‐combination, and placebo; we combined the attrition rate of the Ze 185 3‐combination and 4‐combination. d Originally 151 participants were randomised. No participants were excluded after the placebo run‐in phase. However, study authors defined ITT population as a sample of all randomised participants with at least 1 assessment under trial medication. 2 participants had to be excluded from the analysis due to missing values for the primary efficacy variable after baseline. Therefore, the ITT sample included 149 participants. No information was provided how the original 151 participants were distributed among groups. Therefore, we calculated drop‐out rate based on the sample. | |||||||||||||
| Outcome or subgroup title | No. of studies | No. of participants | Statistical method | Effect size |
| 1 Severity/intensity of medically unexplained physical symptoms (post‐treatment score on self report scales) Show forest plot | 7 | Std. Mean Difference (IV, Random, 95% CI) | Subtotals only | |
| 1.1 Tricyclic antidepressants versus placebo | 2 | 239 | Std. Mean Difference (IV, Random, 95% CI) | ‐0.13 [‐0.39, 0.13] |
| 1.2 New‐generation antidepressants (serotonin noradrenaline reuptake inhibitor (SNRI), selective serotonin reuptake inhibitor (SSRI)) versus placebo | 3 | 243 | Std. Mean Difference (IV, Random, 95% CI) | ‐0.91 [‐1.36, ‐0.46] |
| 1.3 Natural products (St. John's wort LI 160) versus placebo | 2 | 322 | Std. Mean Difference (IV, Random, 95% CI) | ‐0.74 [‐0.97, ‐0.51] |
| 2 Acceptability Show forest plot | 6 | Risk Ratio (M‐H, Random, 95% CI) | Subtotals only | |
| 2.1 Tricyclic antidepressant versus placebo | 1 | 208 | Risk Ratio (M‐H, Random, 95% CI) | 1.08 [0.53, 2.18] |
| 2.2 New‐generation antidepressants (SNRI, SSRI) versus placebo | 2 | 163 | Risk Ratio (M‐H, Random, 95% CI) | 1.01 [0.64, 1.61] |
| 2.3 Natural products (St. John's wort LI 160, Ze 185 3‐/4‐combination) versus placebo | 3 | 506 | Risk Ratio (M‐H, Random, 95% CI) | 0.85 [0.40, 1.78] |
| 3 Anxiety (post‐treatment score on self report and clinician‐rated scales) Show forest plot | 5 | Std. Mean Difference (IV, Random, 95% CI) | Subtotals only | |
| 3.1 Tricyclic antidepressants versus placebo | 1 | 200 | Std. Mean Difference (IV, Random, 95% CI) | ‐0.01 [‐0.29, 0.26] |
| 3.2 New‐generation antidepressants (SNRI, SSRI) versus placebo | 2 | 163 | Std. Mean Difference (IV, Random, 95% CI) | ‐0.88 [‐1.81, 0.05] |
| 3.3 Natural products (St. John's wort LI 160, Ze 185 3‐/4‐combination) versus placebo | 2 | 321 | Std. Mean Difference (IV, Random, 95% CI) | ‐0.83 [‐1.13, ‐0.52] |
| 4 Depression (post‐treatment score on self report and clinician‐rated scales) Show forest plot | 5 | Std. Mean Difference (IV, Random, 95% CI) | Subtotals only | |
| 4.1 Tricyclic antidepressant versus placebo | 1 | 200 | Std. Mean Difference (IV, Random, 95% CI) | ‐0.27 [‐0.55, 0.01] |
| 4.2 New‐generation antidepressants (SSRI, SNRI) versus placebo | 2 | 163 | Std. Mean Difference (IV, Random, 95% CI) | ‐0.56 [‐0.88, ‐0.25] |
| 4.3 Natural products (St. John's wort, Ze 185) versus placebo | 2 | 321 | Std. Mean Difference (IV, Random, 95% CI) | ‐0.64 [‐0.87, ‐0.41] |
| 5 Dysfunctional cognitions, emotions, and behaviours (post‐treatment score on self report scales) Show forest plot | 1 | Std. Mean Difference (IV, Random, 95% CI) | Subtotals only | |
| 5.1 New‐generation antidepressants (SSRI) versus placebo | 1 | 51 | Std. Mean Difference (IV, Random, 95% CI) | 0.26 [‐0.29, 0.81] |
| 6 Adverse effects Show forest plot | 6 | Risk Ratio (M‐H, Random, 95% CI) | Subtotals only | |
| 6.1 Tricyclic antidepressant versus placebo | 1 | 208 | Risk Ratio (M‐H, Random, 95% CI) | 1.0 [0.21, 4.84] |
| 6.2 New‐generation antidepressants (SNRI, SSRI) versus placebo | 2 | 163 | Risk Ratio (M‐H, Random, 95% CI) | 2.26 [0.52, 9.81] |
| 6.3 Natural products (St. John's wort LI 160, Ze 185 3‐/4‐combination) versus placebo | 3 | 506 | Risk Ratio (M‐H, Random, 95% CI) | 0.54 [0.08, 3.50] |
| 7 Treatment response (post‐treatment score on self report and clinician‐rated scales) Show forest plot | 5 | Risk Ratio (M‐H, Random, 95% CI) | Subtotals only | |
| 7.1 Tricyclic antidepressant versus placebo | 1 | 208 | Risk Ratio (M‐H, Random, 95% CI) | 1.29 [0.95, 1.73] |
| 7.2 New‐generation antidepressants (SNRI, SSRI) versus placebo | 2 | 163 | Risk Ratio (M‐H, Random, 95% CI) | 2.00 [0.90, 4.43] |
| 7.3 Natural products (St. John's wort LI 160) versus placebo | 2 | 324 | Risk Ratio (M‐H, Random, 95% CI) | 1.77 [1.34, 2.34] |
| 8 Functional disability and quality of life (post‐treatment score on self report scales) Show forest plot | 3 | Std. Mean Difference (IV, Random, 95% CI) | Subtotals only | |
| 8.1 Tricyclic antidepressant versus placebo | 1 | 44 | Std. Mean Difference (IV, Random, 95% CI) | 0.01 [‐0.58, 0.60] |
| 8.2 New‐generation antidepressants (SNRI, SSRI) versus placebo | 2 | 163 | Std. Mean Difference (IV, Random, 95% CI) | ‐0.52 [1.00, ‐0.04] |
| Outcome or subgroup title | No. of studies | No. of participants | Statistical method | Effect size |
| 1 Severity/intensity of medically unexplained physical symptoms (post‐treatment score on self report scales) Show forest plot | 3 | Std. Mean Difference (IV, Random, 95% CI) | Subtotals only | |
| 1.1 Tricyclic antidepressants versus new‐generation antidepressants (noradrenergic and specific serotonergic antidepressant (NaSSA), tetracyclic antidepressant (TeCA)) | 3 | 177 | Std. Mean Difference (IV, Random, 95% CI) | ‐0.16 [‐0.55, 0.23] |
| 2 Acceptability Show forest plot | 8 | Risk Ratio (M‐H, Random, 95% CI) | Subtotals only | |
| 2.1 Tricyclic antidepressants versus new‐generation antidepressants (NaSSA, serotonin noradrenaline reuptake inhibitor (SNRI), TeCA) | 8 | 556 | Risk Ratio (M‐H, Random, 95% CI) | 1.48 [0.59, 3.72] |
| 3 Anxiety (post‐treatment score on self report and clinician‐rated scales) Show forest plot | 4 | Std. Mean Difference (IV, Random, 95% CI) | Subtotals only | |
| 3.1 Tricyclic antidepressants versus new‐generation antidepressants (NaSSA, SNRI, SSRI) | 4 | 255 | Std. Mean Difference (IV, Random, 95% CI) | 0.37 [‐0.21, 0.95] |
| 4 Depression (post‐treatment score on self report and clinician‐rated scales) Show forest plot | 6 | Std. Mean Difference (IV, Random, 95% CI) | Subtotals only | |
| 4.1 Tricyclic antidepressants versus new‐generation antidepressants (NaSSA, SNRI, TeCA) | 6 | 395 | Std. Mean Difference (IV, Random, 95% CI) | 0.17 [‐0.07, 0.40] |
| 5 Adverse effects Show forest plot | 8 | Risk Ratio (M‐H, Random, 95% CI) | Subtotals only | |
| 5.1 Tricyclic antidepressant versus new‐generation antidepressants (NaSSA, SNRI, TeCA) | 8 | 556 | Risk Ratio (M‐H, Random, 95% CI) | 2.37 [0.39, 14.28] |
| 6 Treatment response (post‐treatment score on self report and clinician‐rated scales) Show forest plot | 2 | Risk Ratio (M‐H, Random, 95% CI) | Subtotals only | |
| 6.1 Tricyclic antidepressant versus new‐generation antidepressants (NaSSA) | 2 | 130 | Risk Ratio (M‐H, Random, 95% CI) | 0.93 [0.73, 1.19] |
| Outcome or subgroup title | No. of studies | No. of participants | Statistical method | Effect size |
| 1 Severity/intensity of medically unexplained physical symptoms (post‐treatment score on self report scales) Show forest plot | 4 | Std. Mean Difference (IV, Random, 95% CI) | Subtotals only | |
| 1.1 New‐generation antidepressants (noradrenergic and specific serotonergic antidepressant (NaSSA), selective serotonin reuptake inhibitor (SSRI)) versus other new‐generation antidepressants (noradrenaline reuptake inhibitor (NRI), serotonin noradrenaline reuptake inhibitor (SNRI), SSRI) | 4 | 182 | Std. Mean Difference (IV, Random, 95% CI) | ‐0.16 [‐0.45, 0.14] |
| 2 Acceptability Show forest plot | 4 | Risk Ratio (M‐H, Random, 95% CI) | Subtotals only | |
| 2.1 New‐generation antidepressants (NaSSA, SSRI) versus other new‐generation antidepressants (NRI, SNRI, SSRI) | 4 | 196 | Risk Ratio (M‐H, Random, 95% CI) | 0.92 [0.60, 1.40] |
| 3 Depression (post‐treatment score on self report and clinician‐rated scales) Show forest plot | 4 | Std. Mean Difference (IV, Random, 95% CI) | Subtotals only | |
| 3.1 New‐generation antidepressants (NaSSA, SSRI) versus other new‐generation antidepressants (NRI, SNRI, SSRI) | 3 | 169 | Std. Mean Difference (IV, Random, 95% CI) | 0.41 [0.00, 0.82] |
| 3.2 New‐generation antidepressant (serotonin antagonist and reuptake inhibitors (SARI)) versus non‐steroidal anti‐inflammatory drugs | 1 | 140 | Std. Mean Difference (IV, Random, 95% CI) | ‐3.87 [‐4.44, ‐3.31] |
| 4 Adverse effects Show forest plot | 4 | Risk Ratio (M‐H, Random, 95% CI) | Subtotals only | |
| 4.1 New‐generation antidepressants (NaSSA, SSRI) versus other new‐generation antidepressants (NRI, SNRI, SSRI) | 4 | 196 | Risk Ratio (M‐H, Random, 95% CI) | 0.84 [0.35, 2.03] |
| Outcome or subgroup title | No. of studies | No. of participants | Statistical method | Effect size |
| 1 Severity/intensity of medically unexplained physical symptoms (post‐treatment score on self report scales) Show forest plot | 3 | Std. Mean Difference (IV, Random, 95% CI) | Subtotals only | |
| 1.1 Tricyclic antidepressant versus tricyclic antidepressant + antipsychotic | 1 | 34 | Std. Mean Difference (IV, Random, 95% CI) | 0.26 [‐0.42, 0.94] |
| 1.2 Selective serotonin reuptake inhibitor versus selective serotonin reuptake inhibitor + antipsychotic | 2 | 107 | Std. Mean Difference (IV, Random, 95% CI) | 0.77 [0.32, 1.22] |
| 2 Acceptability Show forest plot | 2 | Risk Ratio (M‐H, Random, 95% CI) | Subtotals only | |
| 2.1 Selective serotonin reuptake inhibitor versus selective serotonin reuptake inhibitor + antipsychotic | 2 | 118 | Risk Ratio (M‐H, Random, 95% CI) | 0.80 [0.25, 2.52] |
| 3 Anxiety (post‐treatment score on self report and clinician‐rated scales) Show forest plot | 2 | Std. Mean Difference (IV, Random, 95% CI) | Subtotals only | |
| 3.1 Selective serotonin reuptake inhibitor versus selective serotonin reuptake inhibitor + antipsychotic | 2 | 107 | Std. Mean Difference (IV, Random, 95% CI) | 0.95 [‐0.91, 2.82] |
| 4 Depression (post‐treatment score on self report and clinician‐rated scales) Show forest plot | 3 | Std. Mean Difference (IV, Random, 95% CI) | Subtotals only | |
| 4.1 Tricyclic antidepressant versus tricyclic antidepressant + antipsychotic | 1 | 34 | Std. Mean Difference (IV, Random, 95% CI) | 0.79 [0.09, 1.49] |
| 4.2 Selective serotonin reuptake inhibitor versus selective serotonin reuptake inhibitor + antipsychotic | 2 | 107 | Std. Mean Difference (IV, Random, 95% CI) | 0.58 [‐0.33, 1.48] |
| 5 Adverse effects Show forest plot | 2 | Risk Ratio (M‐H, Random, 95% CI) | Subtotals only | |
| 5.1 Selective serotonin reuptake inhibitor versus selective serotonin reuptake inhibitor + antipsychotic | 2 | 118 | Risk Ratio (M‐H, Random, 95% CI) | 0.6 [0.16, 2.29] |
| 6 Treatment response (post‐treatment score on self report and clinician‐rated scales) Show forest plot | 1 | Risk Ratio (M‐H, Random, 95% CI) | Subtotals only | |
| 6.1 Selective serotonin reuptake inhibitor versus selective serotonin reuptake inhibitor + antipsychotic | 1 | 60 | Risk Ratio (M‐H, Random, 95% CI) | 1.7 [0.94, 3.08] |
| Outcome or subgroup title | No. of studies | No. of participants | Statistical method | Effect size |
| 1 Severity/intensity of medically unexplained physical symptoms (post‐treatment score on self report scales) Show forest plot | 4 | Std. Mean Difference (IV, Random, 95% CI) | Subtotals only | |
| 1.1 Co‐morbid mental disorders | 3 | 243 | Std. Mean Difference (IV, Random, 95% CI) | ‐0.91 [‐1.36, ‐0.46] |
| 1.2 No co‐morbid mental disorders | 1 | 200 | Std. Mean Difference (IV, Random, 95% CI) | ‐0.07 [‐0.35, 0.21] |
| 2 Acceptability Show forest plot | 4 | Risk Ratio (M‐H, Random, 95% CI) | Subtotals only | |
| 2.1 Co‐morbid mental disorder | 2 | 163 | Risk Ratio (M‐H, Random, 95% CI) | 1.01 [0.64, 1.61] |
| 2.2 No co‐morbid mental disorder | 2 | 390 | Risk Ratio (M‐H, Random, 95% CI) | 1.05 [0.59, 1.89] |
| Outcome or subgroup title | No. of studies | No. of participants | Statistical method | Effect size |
| 1 Severity/intensity of medically unexplained physical symptoms (post‐treatment score on self report scales) Show forest plot | 7 | 804 | Std. Mean Difference (IV, Random, 95% CI) | ‐0.66 [‐0.97, ‐0.36] |
| 1.1 Funding by pharmaceutical industry | 5 | 685 | Std. Mean Difference (IV, Random, 95% CI) | ‐0.64 [‐1.02, ‐0.27] |
| 1.2 No funding by pharmaceutical industry | 2 | 119 | Std. Mean Difference (IV, Random, 95% CI) | ‐0.75 [‐1.29, ‐0.21] |
| 2 Acceptability Show forest plot | 6 | Risk Ratio (M‐H, Random, 95% CI) | Subtotals only | |
| 2.1 Funding by pharmaceutical industry | 6 | 877 | Risk Ratio (M‐H, Random, 95% CI) | 0.99 [0.70, 1.40] |
| Outcome or subgroup title | No. of studies | No. of participants | Statistical method | Effect size |
| 1 Severity/intensity of medically unexplained physical symptoms (post‐treatment score) Show forest plot | 7 | 1377 | Std. Mean Difference (IV, Random, 95% CI) | ‐0.75 [‐1.00, ‐0.49] |
| 1.1 Self report scales | 7 | 804 | Std. Mean Difference (IV, Random, 95% CI) | ‐0.66 [‐0.97, ‐0.36] |
| 1.2 Clinician‐rated scales | 4 | 573 | Std. Mean Difference (IV, Random, 95% CI) | ‐0.91 [‐1.42, ‐0.40] |
| Outcome or subgroup title | No. of studies | No. of participants | Statistical method | Effect size |
| 1 Treatment response (post‐treatment score on self report and clinician‐rated scales) Show forest plot | 2 | Risk Ratio (M‐H, Random, 95% CI) | Subtotals only | |
| 1.1 Complete‐case analysis | 2 | 119 | Risk Ratio (M‐H, Random, 95% CI) | 2.02 [0.82, 4.97] |
| 1.2 Best‐case analysis | 2 | 163 | Risk Ratio (M‐H, Random, 95% CI) | 2.59 [1.90, 3.53] |
| 1.3 Worst‐case analysis | 2 | 163 | Risk Ratio (M‐H, Random, 95% CI) | 1.41 [0.30, 6.63] |
| Outcome or subgroup title | No. of studies | No. of participants | Statistical method | Effect size |
| 1 Treatment response (post‐treatment score on self report and clinician‐rated scales) Show forest plot | 2 | Risk Ratio (M‐H, Random, 95% CI) | Subtotals only | |
| 1.1 Complete‐case analysis | 2 | 311 | Risk Ratio (M‐H, Random, 95% CI) | 1.75 [1.29, 2.36] |
| 1.2 Best‐case analysis | 2 | 324 | Risk Ratio (M‐H, Random, 95% CI) | 1.92 [1.26, 2.94] |
| 1.3 Worst‐case analysis | 2 | 324 | Risk Ratio (M‐H, Random, 95% CI) | 1.57 [1.27, 1.93] |