Topiramate untuk profilaksis migrain episodik pada orang dewasa
Appendices
Appendix 1. Search strategies for the previous review
For the identification of studies considered for the original review and the 2007 update (Chronicle 2004; Mulleners 2008), detailed search strategies were developed for each database searched. These were based on the search strategy for PubMed, but revised appropriately for each database. The search strategies combined the subject searches described below with the Cochrane highly sensitive search strategy for RCTs current at the time (Alderson 2004). The subject searches used a combination of controlled vocabulary and free‐text terms based on the search strategy for PubMed presented below.
Databases searched were:
-
Cochrane Pain, Palliative & Supportive Care Trials Register;
-
Cochrane Central Register of Controlled Trials (CENTRAL, The Cochrane Library 2005, Issue 3);
-
PubMed 1966 to 31 December 2005;
-
EMBASE 1974 to 31 December 2005.
Additional strategies for identifying trials included searching the reference lists of review articles and included studies, searching books related to headache and consulting experts in the field. Two journals, Headache and Cephalalgia, were handsearched in their entirety, through April 2006.
Detailed descriptions of the subject search strategies used for PubMed, EMBASE, and CENTRAL are given below.
PubMed
Phase 1
#1 (randomized controlled trial [pt] OR controlled clinical trial [pt] OR randomized controlled trials [mh] OR random allocation [mh] OR double‐blind method [mh] OR single‐blind method [mh] OR clinical trial [pt] OR clinical trials [mh] OR ("clinical trial" [tw]) OR ((singl* [tw] OR doubl* [tw] OR trebl* [tw] OR tripl* [tw]) AND (mask* [tw] OR blind* [tw])) OR (placebos [mh] OR placebo* [tw] OR random* [tw] OR research design [mh:noexp] OR comparative study [mh] OR evaluation studies [mh] OR follow‐up studies [mh] OR prospective studies [mh] OR control* [tw] OR prospectiv* [tw] OR volunteer* [tw]) NOT (animals [mh] NOT human [mh]) Limits: Humans
Phase 2
#2 HEADACHE Field: MeSH Terms, Limits: Humans
#3 HEADACHE DISORDERS Field: MeSH Terms, Limits: Humans
#4 headache* OR migrain* OR cephalgi* OR cephalalgi* Field: All Fields, Limits: Humans
#5 #2 OR #3 OR #4 Limits: Humans
Phase 3
#6 anticonvulsant* OR antiepileptic* OR acetazolamide OR carbamazepine OR chlormethiazole OR clobazam OR clonazepam OR clorazepate OR diazepam OR divalproex OR ethosuximide OR felbamate OR fosphenytoin OR gabapentin OR lamotrigine OR levetiracetam OR lidocaine OR lignocaine OR lorazepam OR mephobarbital OR methsuximide OR midazolam OR nitrazepam OR oxcarbazepine OR paraldehyde OR pentobarbital OR phenobarbital OR phenytoin OR primidone OR valproate OR tiagabine OR topiramate OR valproic OR vigabatrin OR zonisamide Field: All Fields, Limits: Humans
#7 #1 AND #5 AND #6
EMBASE
#1 'migraine'/exp AND [embase]/lim
#2 migrain* OR cephalgi* OR cephalalgi* AND [embase]/lim
#3 headache*:ti
#4 #1 OR #2 OR #3
#5 'anticonvulsive agent'/de AND [embase]/lim
#6 anticonvulsant* OR antiepileptic* OR 'acetazolamide'/de OR 'carbamazepine'/de OR 'chlormethiazole'/de OR 'clobazam'/de OR 'clonazepam'/de OR 'clorazepate'/de OR 'diazepam'/de OR 'divalproex'/de OR 'ethosuximide'/de OR 'felbamate'/de OR fosphenytoin OR 'gabapentin'/de OR 'lamotrigine'/de OR 'levetiracetam'/de OR 'lidocaine'/de OR 'lignocaine'/de OR 'lorazepam'/de OR 'mephobarbital'/de OR 'methsuximide'/de OR 'midazolam'/de OR 'nitrazepam'/de OR 'oxcarbazepine'/de OR 'paraldehyde'/de OR 'pentobarbital'/de OR 'phenobarbital'/de OR 'phenytoin'/de OR 'primidone'/de OR 'valproate'/de OR 'tiagabine'/de OR 'topiramate'/de OR valproic OR 'vigabatrin'/de OR 'zonisamide'/de AND [embase]/lim
#7 #5 OR #6
#8 #4 AND #7
#9 ((random*:ti,ab) OR (factorial*:ab,ti) OR (crossover*:ab,ti OR 'cross over':ab,ti OR 'cross over':ab,ti) OR (placebo*:ab,ti) OR ('double blind' OR 'double blind') OR ('single blind':ab,ti OR 'single blind':ab,ti) OR (assign*:ti,ab OR allocat*:ti,ab) OR (volunteer*:ab,ti) OR ('randomized controlled trial'/exp AND [embase]/lim) OR ('single blind procedure'/exp AND [embase]/lim) OR ('double blind procedure'/exp AND [embase]/lim) OR ('crossover procedure'/exp AND [embase]/lim)) NOT ((animal/ OR nonhuman/ OR 'animal'/de AND experiment/ AND [embase]/lim) NOT ((human/ AND [embase]/lim) AND (animal/ OR nonhuman/ OR 'animal'/de AND experiment/ AND [embase]/lim)) AND [embase]/lim) AND [embase]/lim
#10 #8 AND #9
CENTRAL
(migrain* OR headache*) AND (randomized controlled trial OR controlled clinical trial) Field: All Fields
Appendix 2. Search strategies for this update
CENTRAL
#1 MeSH descriptor: [Migraine Disorders] explode all trees
#2 (migrain* or cephalgi* or cephalalgi*)
#3 #1 or #2
#4 MeSH descriptor: [Anticonvulsants] explode all trees
#5 (anticonvulsant* or antiepileptic* or acetazolamide or carbamazepine or chlormethiazole or clobazam or clonazepam or clorazepate or diazepam or divalproex or ethosuximide or felbamate or fosphenytoin or gabapentin or lamotrigine or levetiracetam or lidocaine or lignocaine or lorazepam or mephobarbital or methsuximide or midazolam or nitrazepam or oxcarbazepine or paraldehyde or pentobarbital or phenobarbital or phenytoin or primidone or valproate or tiagabine or topiramate or valproic or vigabatrin or zonisamide or eslicarbazepine or lacosamide or perampanel or phenobarbitone or pregabalin or retigabine or rufinamide or stiripentol or *barbit*)
#6 #4 or #5
#7 #3 and #6
(search limited to years 2005‐2012)
MEDLINE and MEDLINE In‐Progress (via Ovid)
-
exp Migraine Disorders/
-
(migrain* or cephalgi* or cephalalgi*).tw.
-
or/1‐2
-
exp Anticonvulsants/
-
(anticonvulsant* or antiepileptic* or acetazolamide or carbamazepine or chlormethiazole or clobazam or clonazepam or clorazepate or diazepam or divalproex or ethosuximide or felbamate or fosphenytoin or gabapentin or lamotrigine or levetiracetam or lidocaine or lignocaine or lorazepam or mephobarbital or methsuximide or midazolam or nitrazepam or oxcarbazepine or paraldehyde or pentobarbital or phenobarbital or phenytoin or primidone or valproate or tiagabine or topiramate or valproic or vigabatrin or zonisamide or eslicarbazepine or lacosamide or perampanel or phenobarbitone or pregabalin or retigabine or rufinamide or stiripentol or $barbit$).tw.
-
or/4‐5
-
3 and 6
-
randomized controlled trial.pt.
-
controlled clinical trial.pt.
-
randomized.ab.
-
placebo.ab.
-
clinical trials as topic.sh.
-
randomly.ab.
-
trial.ti.
-
or/8‐14
-
exp animals/ not humans.sh.
-
15 not 16
-
7 and 17
For MEDLINE: limited 18 to yr="2005 ‐Current"
For MEDLINE In‐Process: searched current week on 15 January 2013
EMBASE (via Ovid)
-
exp Migraine/
-
(migrain* or cephalgi* or cephalalgi*).tw.
-
or/1‐2
-
exp Anticonvulsants/
-
(anticonvulsant* or antiepileptic* or acetazolamide or carbamazepine or chlormethiazole or clobazam or clonazepam or clorazepate or diazepam or divalproex or ethosuximide or felbamate or fosphenytoin or gabapentin or lamotrigine or levetiracetam or lidocaine or lignocaine or lorazepam or mephobarbital or methsuximide or midazolam or nitrazepam or oxcarbazepine or paraldehyde or pentobarbital or phenobarbital or phenytoin or primidone or valproate or tiagabine or topiramate or valproic or vigabatrin or zonisamide or eslicarbazepine or lacosamide or perampanel or phenobarbitone or pregabalin or retigabine or rufinamide or stiripentol or $barbit$).tw.
-
or/4‐5
-
3 and 6
-
random$.tw.
-
factorial$.tw.
-
crossover$.tw.
-
cross over$.tw.
-
cross‐over$.tw.
-
placebo$.tw.
-
(doubl$ adj blind$).tw.
-
(singl$ adj blind$).tw.
-
assign$.tw.
-
allocat$.tw.
-
volunteer$.tw.
-
Crossover Procedure/
-
double‐blind procedure.tw.
-
Randomized Controlled Trial/
-
Single Blind Procedure/
-
or/8‐22
-
(animal/ or nonhuman/) not human/
-
23 not 24
-
7 and 25
-
limit 26 to yr="2005 ‐Current"

'Risk of bias' graph: review authors' judgements about each risk of bias item presented as percentages across all included studies.

'Risk of bias' summary: review authors' judgements about each risk of bias item for each included study.
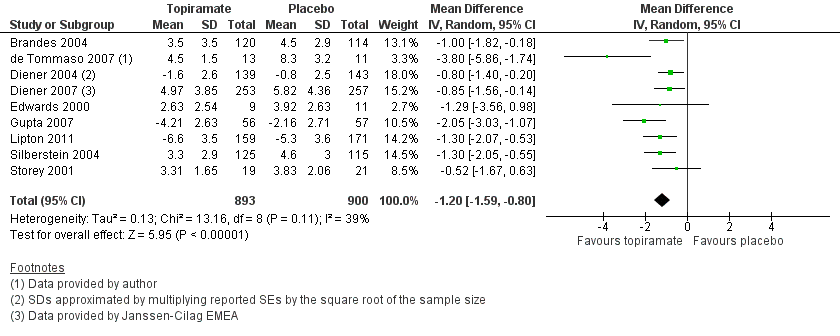
Forest plot of comparison: 1 Topiramate (combined analyses based on most relevant dose in each study) versus placebo, outcome: 1.1 Headache frequency (change from baseline to post‐treatment, or post‐treatment alone).

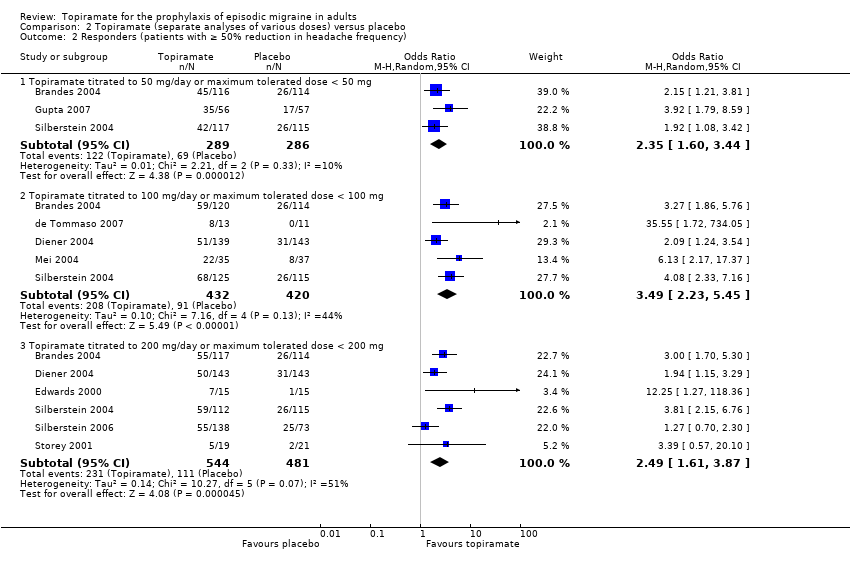
Forest plot of comparison: 2 Topiramate (separate analyses of various doses) versus placebo, outcome: 2.1 Headache frequency (change from baseline to post‐treatment, or post‐treatment alone).

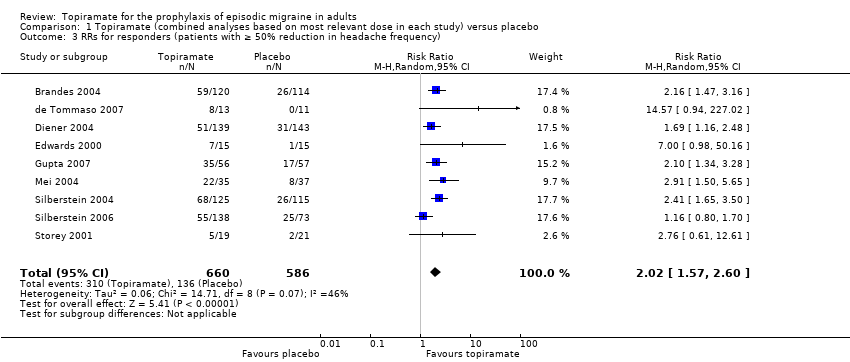
Forest plot of comparison: 1 Topiramate (combined analyses based on most relevant dose in each study) versus placebo, outcome: 1.3 RRs for responders (patients with ≥ 50% reduction in headache frequency).

Comparison 1 Topiramate (combined analyses based on most relevant dose in each study) versus placebo, Outcome 1 Headache frequency (change from baseline to post‐treatment, or post‐treatment alone).

Comparison 1 Topiramate (combined analyses based on most relevant dose in each study) versus placebo, Outcome 2 ORs for responders (patients with ≥ 50% reduction in headache frequency).
Comparison 1 Topiramate (combined analyses based on most relevant dose in each study) versus placebo, Outcome 3 RRs for responders (patients with ≥ 50% reduction in headache frequency).

Comparison 2 Topiramate (separate analyses of various doses) versus placebo, Outcome 1 Headache frequency (change from baseline to post‐treatment, or post‐treatment alone).
Comparison 2 Topiramate (separate analyses of various doses) versus placebo, Outcome 2 Responders (patients with ≥ 50% reduction in headache frequency).
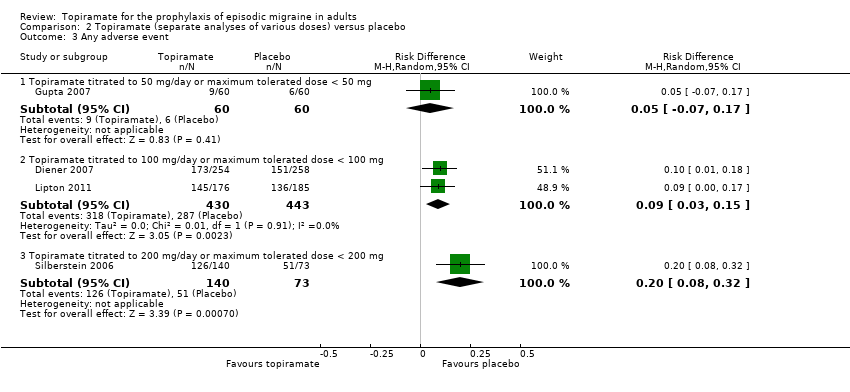
Comparison 2 Topiramate (separate analyses of various doses) versus placebo, Outcome 3 Any adverse event.

Comparison 2 Topiramate (separate analyses of various doses) versus placebo, Outcome 4 Anorexia.

Comparison 2 Topiramate (separate analyses of various doses) versus placebo, Outcome 5 Fatigue.
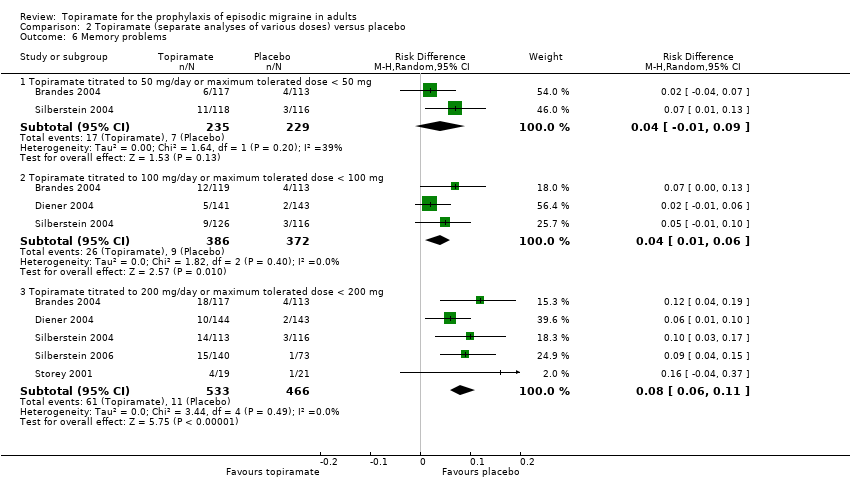
Comparison 2 Topiramate (separate analyses of various doses) versus placebo, Outcome 6 Memory problems.
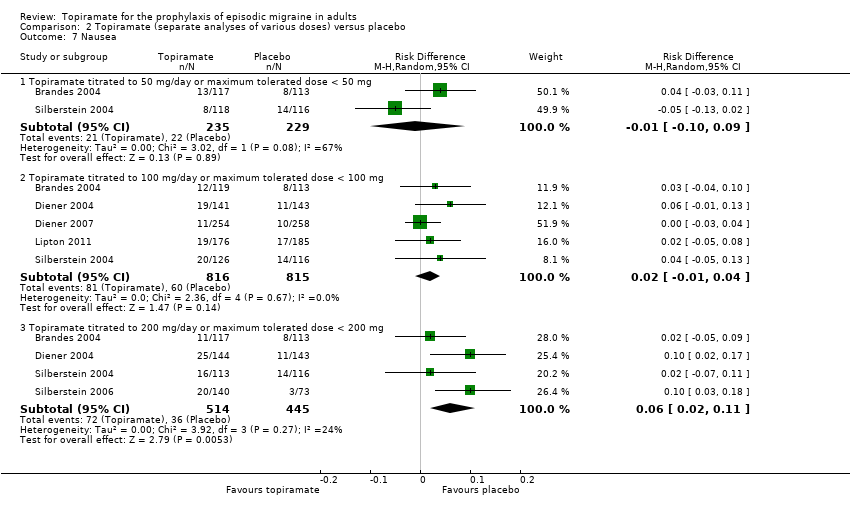
Comparison 2 Topiramate (separate analyses of various doses) versus placebo, Outcome 7 Nausea.
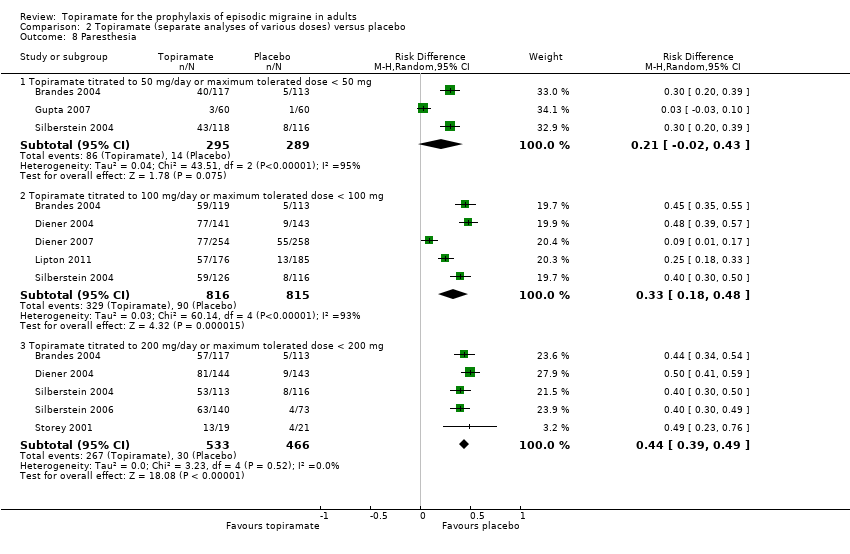
Comparison 2 Topiramate (separate analyses of various doses) versus placebo, Outcome 8 Paresthesia.
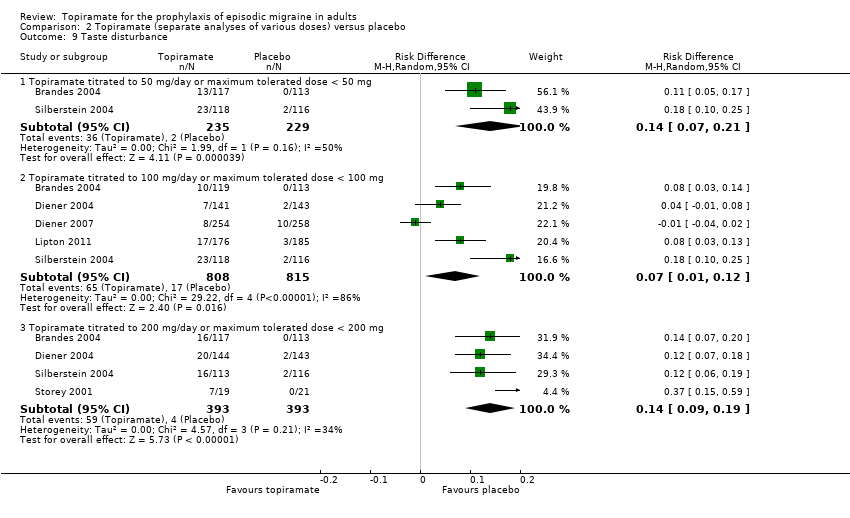
Comparison 2 Topiramate (separate analyses of various doses) versus placebo, Outcome 9 Taste disturbance.
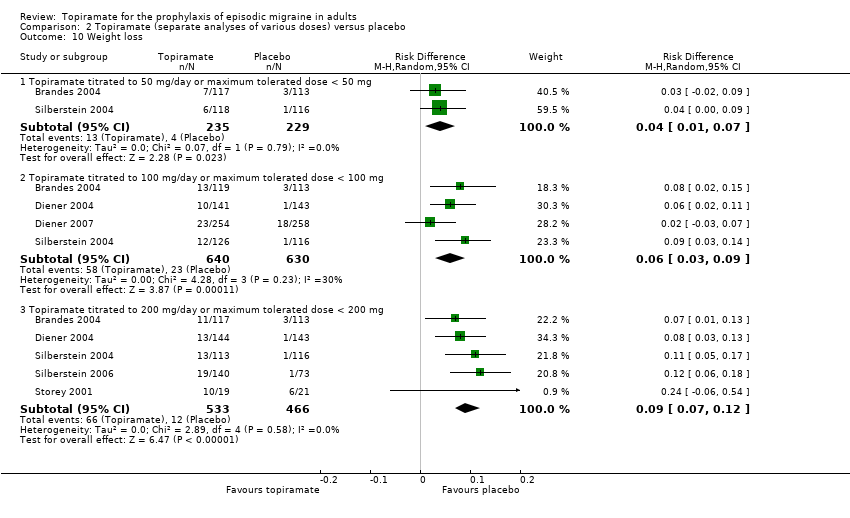
Comparison 2 Topiramate (separate analyses of various doses) versus placebo, Outcome 10 Weight loss.
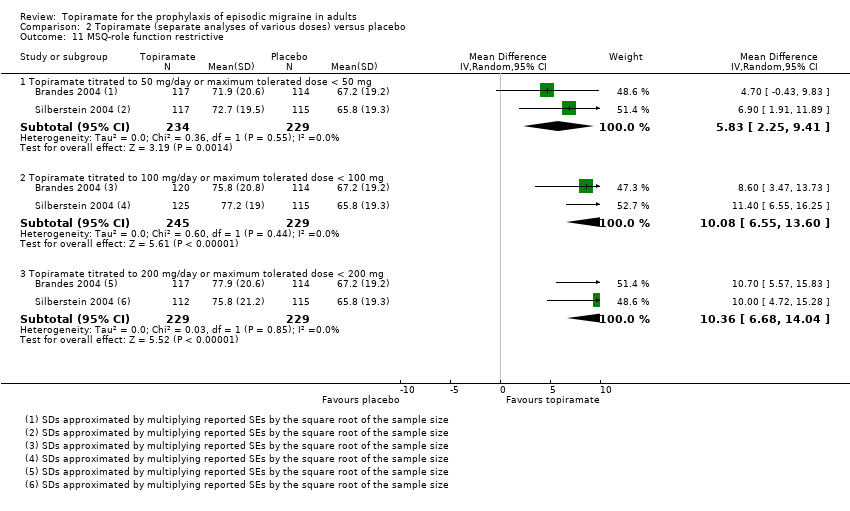
Comparison 2 Topiramate (separate analyses of various doses) versus placebo, Outcome 11 MSQ‐role function restrictive.

Comparison 2 Topiramate (separate analyses of various doses) versus placebo, Outcome 12 MSQ‐role function prevention.

Comparison 2 Topiramate (separate analyses of various doses) versus placebo, Outcome 13 MSQ‐emotional function.
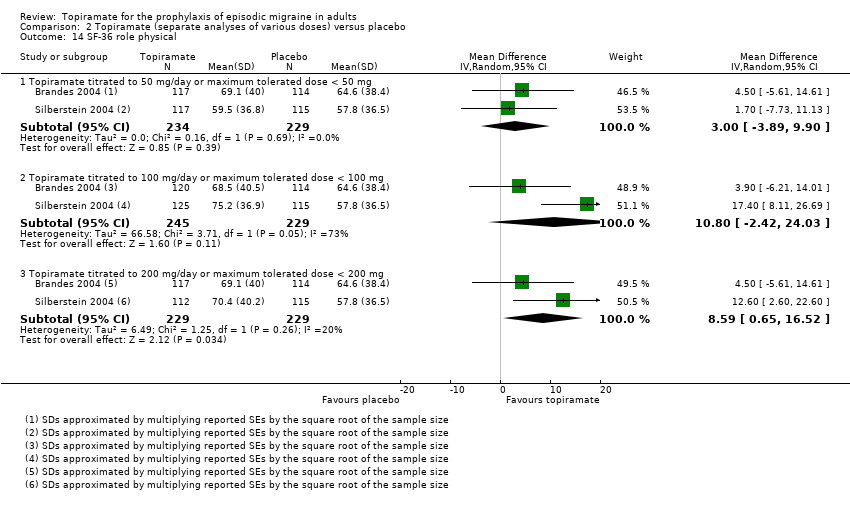
Comparison 2 Topiramate (separate analyses of various doses) versus placebo, Outcome 14 SF‐36 role physical.
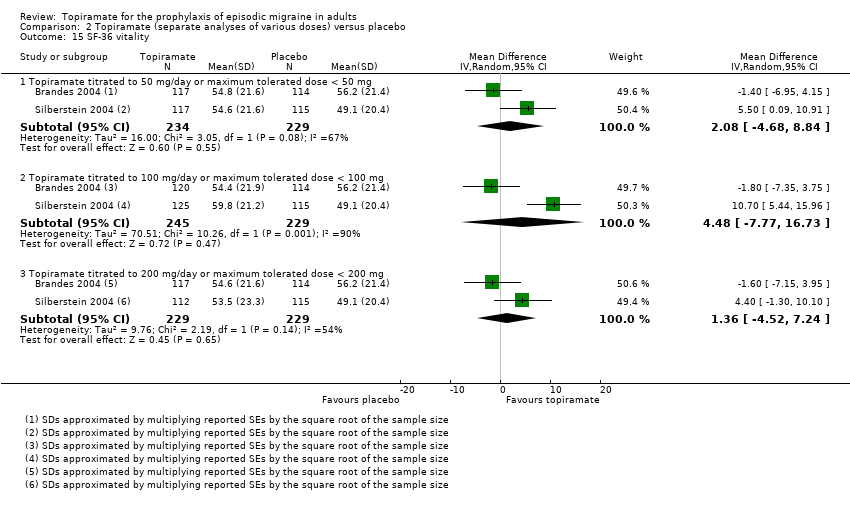
Comparison 2 Topiramate (separate analyses of various doses) versus placebo, Outcome 15 SF‐36 vitality.

Comparison 2 Topiramate (separate analyses of various doses) versus placebo, Outcome 16 SF‐36 physical functioning.

Comparison 2 Topiramate (separate analyses of various doses) versus placebo, Outcome 17 SF‐36 bodily pain.
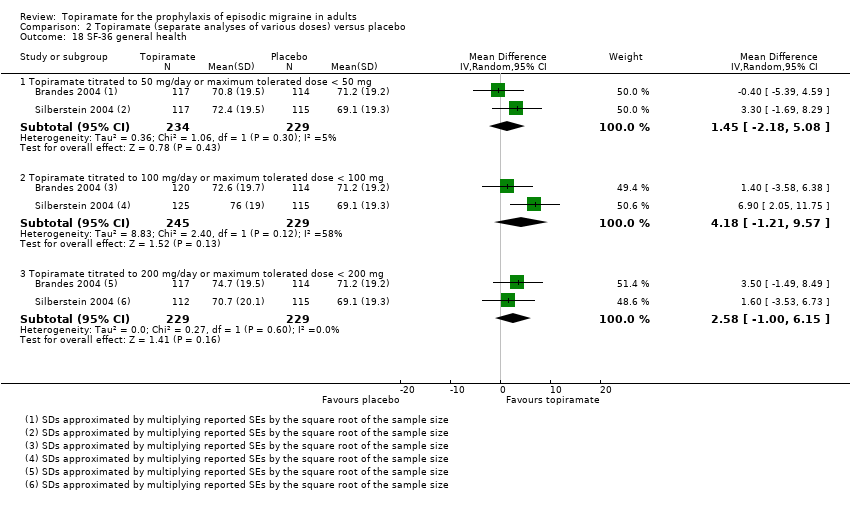
Comparison 2 Topiramate (separate analyses of various doses) versus placebo, Outcome 18 SF‐36 general health.
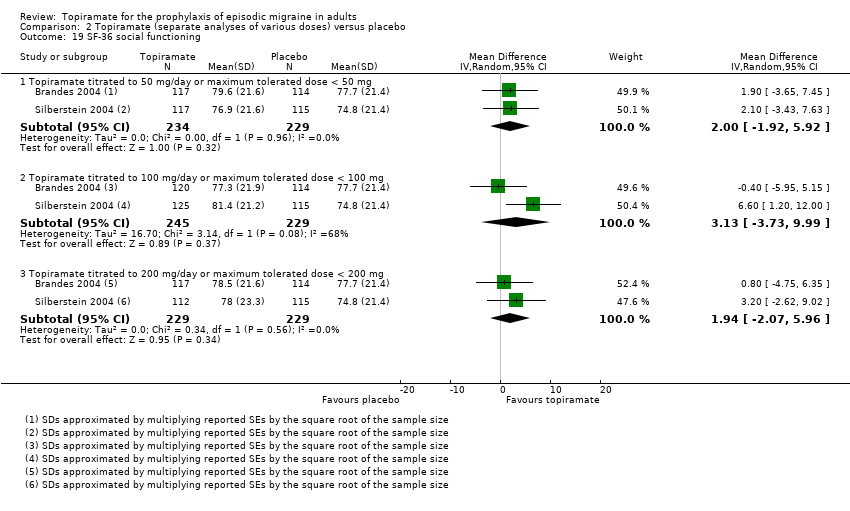
Comparison 2 Topiramate (separate analyses of various doses) versus placebo, Outcome 19 SF‐36 social functioning.
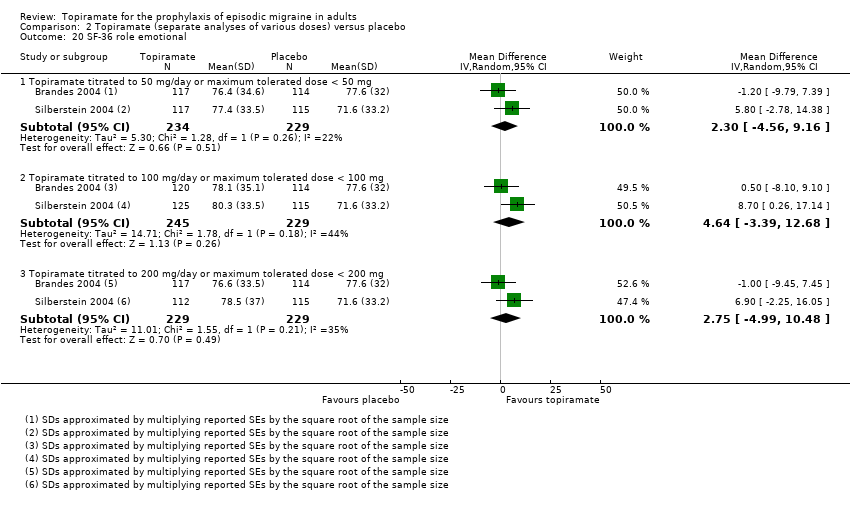
Comparison 2 Topiramate (separate analyses of various doses) versus placebo, Outcome 20 SF‐36 role emotional.

Comparison 2 Topiramate (separate analyses of various doses) versus placebo, Outcome 21 SF‐36 mental health.

Comparison 3 Topiramate direct dose comparisons, Outcome 1 Headache frequency (change from baseline to post‐treatment, or post‐treatment alone).

Comparison 3 Topiramate direct dose comparisons, Outcome 2 Responders (patients with ≥ 50% reduction in headache frequency).

Comparison 3 Topiramate direct dose comparisons, Outcome 3 MSQ‐role function restrictive.

Comparison 3 Topiramate direct dose comparisons, Outcome 4 MSQ‐role function prevention.

Comparison 3 Topiramate direct dose comparisons, Outcome 5 MSQ‐emotional function.

Comparison 3 Topiramate direct dose comparisons, Outcome 6 SF‐36 role physical.

Comparison 3 Topiramate direct dose comparisons, Outcome 7 SF‐36 vitality.

Comparison 3 Topiramate direct dose comparisons, Outcome 8 SF‐36 physical functioning.
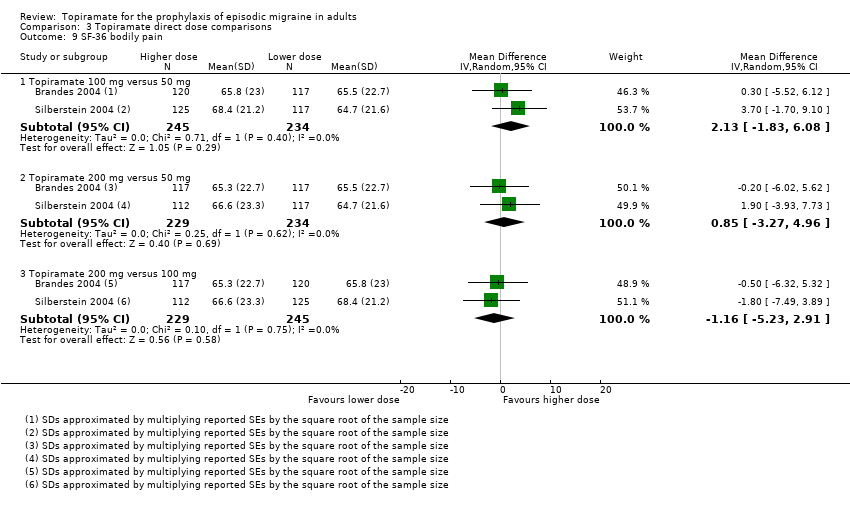
Comparison 3 Topiramate direct dose comparisons, Outcome 9 SF‐36 bodily pain.

Comparison 3 Topiramate direct dose comparisons, Outcome 10 SF‐36 general health.
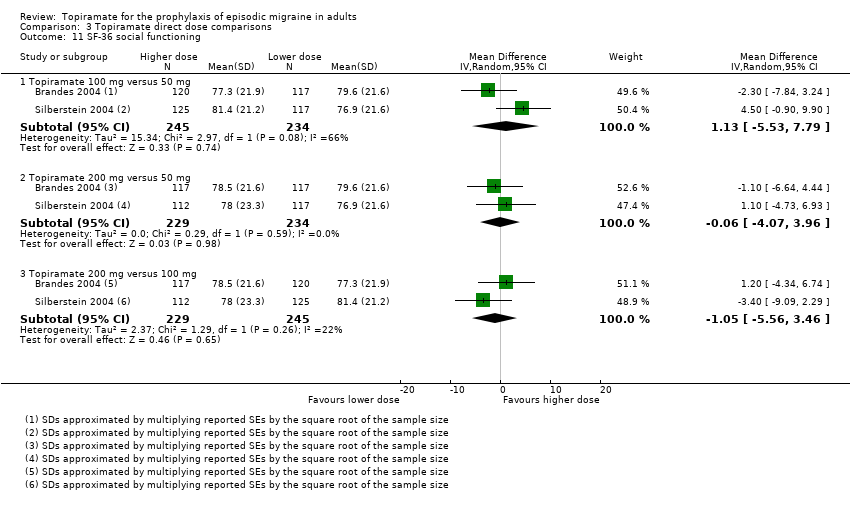
Comparison 3 Topiramate direct dose comparisons, Outcome 11 SF‐36 social functioning.

Comparison 3 Topiramate direct dose comparisons, Outcome 12 SF‐36 role emotional.

Comparison 3 Topiramate direct dose comparisons, Outcome 13 SF‐36 mental health.

Comparison 4 Topiramate versus amitriptyline, Outcome 1 Responders (patients with ≥ 50% reduction in headache frequency).
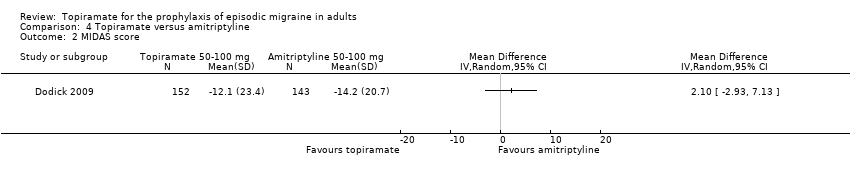
Comparison 4 Topiramate versus amitriptyline, Outcome 2 MIDAS score.
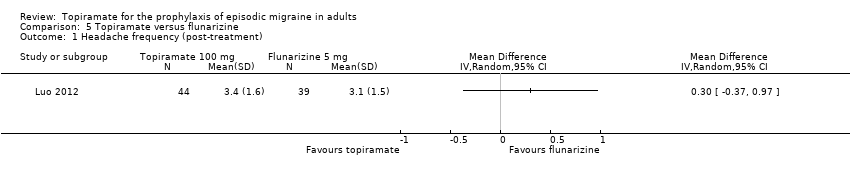
Comparison 5 Topiramate versus flunarizine, Outcome 1 Headache frequency (post‐treatment).

Comparison 5 Topiramate versus flunarizine, Outcome 2 Responders (patients with ≥ 50% reduction in headache frequency).

Comparison 6 Topiramate versus propranolol, Outcome 1 Headache frequency (change from baseline to post‐treatment, or post‐treatment alone).
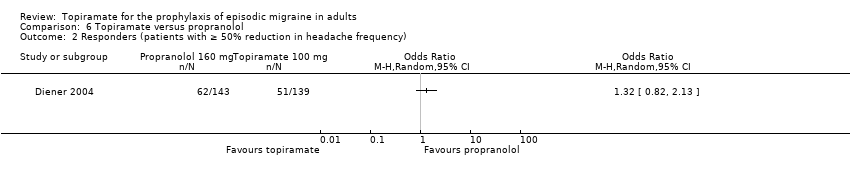
Comparison 6 Topiramate versus propranolol, Outcome 2 Responders (patients with ≥ 50% reduction in headache frequency).

Comparison 7 Topiramate versus sodium valproate, Outcome 1 Headache frequency (post‐treatment).
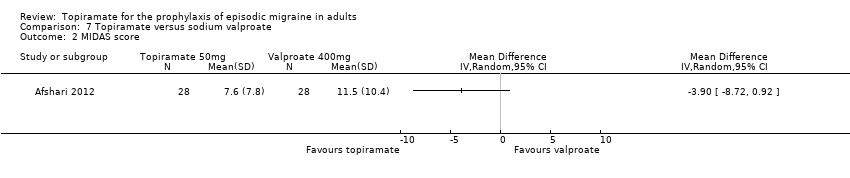
Comparison 7 Topiramate versus sodium valproate, Outcome 2 MIDAS score.

Comparison 8 Topiramate versus relaxation, Outcome 1 Headache frequency (change from baseline to post‐treatment).

Comparison 8 Topiramate versus relaxation, Outcome 2 Responders (patients with ≥ 50% reduction in headache frequency).
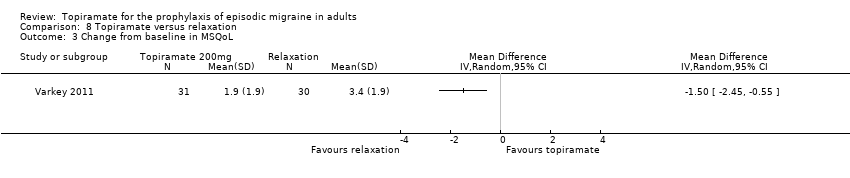
Comparison 8 Topiramate versus relaxation, Outcome 3 Change from baseline in MSQoL.
| Type of AE | 50 mg/day | 100 mg/day | 200 mg/day |
| Any AE | NNH not defined* | 11 (7 to 33) | 5 (3 to 12) |
| Anorexia | NNH not defined* | 17 (10 to 50) | 12 (8 to 20) |
| Fatigue | NNH not defined* | 25 (17 to 100) | 12 (8 to 25) |
| Memory problems | NNH not defined* | 25 (17 to 100) | 12 (9 to 17) |
| Nausea | NNH not defined* | NNH not defined* | 17 (9 to 50) |
| Paresthesia | NNH not defined* | 3 (2 to 6) | 2 (2 to 3) |
| Taste disturbance | 7 (5 to 14) | 14 (8 to 100) | 7 (5 to 11) |
| Weight loss | 25 (14 to 100) | 17 (11 to 33) | 11 (8 to 14) |
| Percentage of patients in active group withdrawing because of AEs | Afshari 2012: 5%; Ashtari 2008: 3%; Brandes 2004: 17%; Gupta 2007: 2%; Silberstein 2004: 17% | Brandes 2004: 26%; de Tommaso 2007: 8%; Diener 2004: 28%; Dodick 2009: 20%; Lipton 2011: 12%; Mei 2004: 29%; Silberstein 2004: 19% | Brandes 2004: 21%; Diener 2004: 44%; Edwards 2000: 27%; Silberstein 2004: 32%; Silberstein 2006: 15%; Storey 2001: 11%; Varkey 2011: 12% |
| * The 95% CI of the difference in AE rates between treatment and placebo arms (the risk difference, RD) crosses zero. Abbreviations: AE = adverse event; CI = confidence interval; NNH = number needed to harm | |||
| Outcome or subgroup title | No. of studies | No. of participants | Statistical method | Effect size |
| 1 Headache frequency (change from baseline to post‐treatment, or post‐treatment alone) Show forest plot | 9 | 1793 | Mean Difference (IV, Random, 95% CI) | ‐1.20 [‐1.59, ‐0.80] |
| 2 ORs for responders (patients with ≥ 50% reduction in headache frequency) Show forest plot | 9 | 1246 | Odds Ratio (M‐H, Random, 95% CI) | 3.18 [2.10, 4.82] |
| 3 RRs for responders (patients with ≥ 50% reduction in headache frequency) Show forest plot | 9 | 1246 | Risk Ratio (M‐H, Random, 95% CI) | 2.02 [1.57, 2.60] |
| Outcome or subgroup title | No. of studies | No. of participants | Statistical method | Effect size |
| 1 Headache frequency (change from baseline to post‐treatment, or post‐treatment alone) Show forest plot | 9 | Mean Difference (IV, Random, 95% CI) | Subtotals only | |
| 1.1 Topiramate titrated to 50 mg/day or maximum tolerated dose < 50 mg | 3 | 576 | Mean Difference (IV, Random, 95% CI) | ‐0.95 [‐1.95, 0.04] |
| 1.2 Topiramate titrated to 100 mg/day or maximum tolerated dose < 100 mg | 6 | 1620 | Mean Difference (IV, Random, 95% CI) | ‐1.15 [‐1.58, ‐0.71] |
| 1.3 Topiramate titrated to 200 mg/day or maximum tolerated dose < 200 mg | 5 | 804 | Mean Difference (IV, Random, 95% CI) | ‐0.94 [‐1.53, ‐0.36] |
| 2 Responders (patients with ≥ 50% reduction in headache frequency) Show forest plot | 9 | Odds Ratio (M‐H, Random, 95% CI) | Subtotals only | |
| 2.1 Topiramate titrated to 50 mg/day or maximum tolerated dose < 50 mg | 3 | 575 | Odds Ratio (M‐H, Random, 95% CI) | 2.35 [1.60, 3.44] |
| 2.2 Topiramate titrated to 100 mg/day or maximum tolerated dose < 100 mg | 5 | 852 | Odds Ratio (M‐H, Random, 95% CI) | 3.49 [2.23, 5.45] |
| 2.3 Topiramate titrated to 200 mg/day or maximum tolerated dose < 200 mg | 6 | 1025 | Odds Ratio (M‐H, Random, 95% CI) | 2.49 [1.61, 3.87] |
| 3 Any adverse event Show forest plot | 4 | Risk Difference (M‐H, Random, 95% CI) | Subtotals only | |
| 3.1 Topiramate titrated to 50 mg/day or maximum tolerated dose < 50 mg | 1 | 120 | Risk Difference (M‐H, Random, 95% CI) | 0.05 [‐0.07, 0.17] |
| 3.2 Topiramate titrated to 100 mg/day or maximum tolerated dose < 100 mg | 2 | 873 | Risk Difference (M‐H, Random, 95% CI) | 0.09 [0.03, 0.15] |
| 3.3 Topiramate titrated to 200 mg/day or maximum tolerated dose < 200 mg | 1 | 213 | Risk Difference (M‐H, Random, 95% CI) | 0.20 [0.08, 0.32] |
| 4 Anorexia Show forest plot | 8 | Risk Difference (M‐H, Random, 95% CI) | Subtotals only | |
| 4.1 Topiramate titrated to 50 mg/day or maximum tolerated dose < 50 mg | 3 | 584 | Risk Difference (M‐H, Random, 95% CI) | 0.01 [‐0.04, 0.07] |
| 4.2 Topiramate titrated to 100 mg/day or maximum tolerated dose < 100 mg | 5 | 1631 | Risk Difference (M‐H, Random, 95% CI) | 0.06 [0.02, 0.10] |
| 4.3 Topiramate titrated to 200 mg/day or maximum tolerated dose < 200 mg | 5 | 999 | Risk Difference (M‐H, Random, 95% CI) | 0.08 [0.05, 0.12] |
| 5 Fatigue Show forest plot | 6 | Risk Difference (M‐H, Random, 95% CI) | Subtotals only | |
| 5.1 Topiramate titrated to 50 mg/day or maximum tolerated dose < 50 mg | 2 | 464 | Risk Difference (M‐H, Random, 95% CI) | 0.04 [‐0.07, 0.15] |
| 5.2 Topiramate titrated to 100 mg/day or maximum tolerated dose < 100 mg | 5 | 1631 | Risk Difference (M‐H, Random, 95% CI) | 0.04 [0.01, 0.06] |
| 5.3 Topiramate titrated to 200 mg/day or maximum tolerated dose < 200 mg | 4 | 959 | Risk Difference (M‐H, Random, 95% CI) | 0.08 [0.04, 0.13] |
| 6 Memory problems Show forest plot | 5 | Risk Difference (M‐H, Random, 95% CI) | Subtotals only | |
| 6.1 Topiramate titrated to 50 mg/day or maximum tolerated dose < 50 mg | 2 | 464 | Risk Difference (M‐H, Random, 95% CI) | 0.04 [‐0.01, 0.09] |
| 6.2 Topiramate titrated to 100 mg/day or maximum tolerated dose < 100 mg | 3 | 758 | Risk Difference (M‐H, Random, 95% CI) | 0.04 [0.01, 0.06] |
| 6.3 Topiramate titrated to 200 mg/day or maximum tolerated dose < 200 mg | 5 | 999 | Risk Difference (M‐H, Random, 95% CI) | 0.08 [0.06, 0.11] |
| 7 Nausea Show forest plot | 6 | Risk Difference (M‐H, Random, 95% CI) | Subtotals only | |
| 7.1 Topiramate titrated to 50 mg/day or maximum tolerated dose < 50 mg | 2 | 464 | Risk Difference (M‐H, Random, 95% CI) | ‐0.01 [‐0.10, 0.09] |
| 7.2 Topiramate titrated to 100 mg/day or maximum tolerated dose < 100 mg | 5 | 1631 | Risk Difference (M‐H, Random, 95% CI) | 0.02 [‐0.01, 0.04] |
| 7.3 Topiramate titrated to 200 mg/day or maximum tolerated dose < 200 mg | 4 | 959 | Risk Difference (M‐H, Random, 95% CI) | 0.06 [0.02, 0.11] |
| 8 Paresthesia Show forest plot | 8 | Risk Difference (M‐H, Random, 95% CI) | Subtotals only | |
| 8.1 Topiramate titrated to 50 mg/day or maximum tolerated dose < 50 mg | 3 | 584 | Risk Difference (M‐H, Random, 95% CI) | 0.21 [‐0.02, 0.43] |
| 8.2 Topiramate titrated to 100 mg/day or maximum tolerated dose < 100 mg | 5 | 1631 | Risk Difference (M‐H, Random, 95% CI) | 0.33 [0.18, 0.48] |
| 8.3 Topiramate titrated to 200 mg/day or maximum tolerated dose < 200 mg | 5 | 999 | Risk Difference (M‐H, Random, 95% CI) | 0.44 [0.39, 0.49] |
| 9 Taste disturbance Show forest plot | 6 | Risk Difference (M‐H, Random, 95% CI) | Subtotals only | |
| 9.1 Topiramate titrated to 50 mg/day or maximum tolerated dose < 50 mg | 2 | 464 | Risk Difference (M‐H, Random, 95% CI) | 0.14 [0.07, 0.21] |
| 9.2 Topiramate titrated to 100 mg/day or maximum tolerated dose < 100 mg | 5 | 1623 | Risk Difference (M‐H, Random, 95% CI) | 0.07 [0.01, 0.12] |
| 9.3 Topiramate titrated to 200 mg/day or maximum tolerated dose < 200 mg | 4 | 786 | Risk Difference (M‐H, Random, 95% CI) | 0.14 [0.09, 0.19] |
| 10 Weight loss Show forest plot | 6 | Risk Difference (M‐H, Random, 95% CI) | Subtotals only | |
| 10.1 Topiramate titrated to 50 mg/day or maximum tolerated dose < 50 mg | 2 | 464 | Risk Difference (M‐H, Random, 95% CI) | 0.04 [0.01, 0.07] |
| 10.2 Topiramate titrated to 100 mg/day or maximum tolerated dose < 100 mg | 4 | 1270 | Risk Difference (M‐H, Random, 95% CI) | 0.06 [0.03, 0.09] |
| 10.3 Topiramate titrated to 200 mg/day or maximum tolerated dose < 200 mg | 5 | 999 | Risk Difference (M‐H, Random, 95% CI) | 0.09 [0.07, 0.12] |
| 11 MSQ‐role function restrictive Show forest plot | 2 | Mean Difference (IV, Random, 95% CI) | Subtotals only | |
| 11.1 Topiramate titrated to 50 mg/day or maximum tolerated dose < 50 mg | 2 | 463 | Mean Difference (IV, Random, 95% CI) | 5.83 [2.25, 9.41] |
| 11.2 Topiramate titrated to 100 mg/day or maximum tolerated dose < 100 mg | 2 | 474 | Mean Difference (IV, Random, 95% CI) | 10.08 [6.55, 13.60] |
| 11.3 Topiramate titrated to 200 mg/day or maximum tolerated dose < 200 mg | 2 | 458 | Mean Difference (IV, Random, 95% CI) | 10.36 [6.68, 14.04] |
| 12 MSQ‐role function prevention Show forest plot | 2 | Mean Difference (IV, Random, 95% CI) | Subtotals only | |
| 12.1 Topiramate titrated to 50 mg/day or maximum tolerated dose < 50 mg | 2 | 463 | Mean Difference (IV, Random, 95% CI) | 2.84 [‐0.24, 5.92] |
| 12.2 Topiramate titrated to 100 mg/day or maximum tolerated dose < 100 mg | 2 | 474 | Mean Difference (IV, Random, 95% CI) | 6.39 [3.37, 9.41] |
| 12.3 Topiramate titrated to 200 mg/day or maximum tolerated dose < 200 mg | 2 | 458 | Mean Difference (IV, Random, 95% CI) | 5.06 [1.87, 8.25] |
| 13 MSQ‐emotional function Show forest plot | 2 | Mean Difference (IV, Random, 95% CI) | Subtotals only | |
| 13.1 Topiramate titrated to 50 mg/day or maximum tolerated dose < 50 mg | 2 | 463 | Mean Difference (IV, Random, 95% CI) | 4.58 [0.61, 8.54] |
| 13.2 Topiramate titrated to 100 mg/day or maximum tolerated dose < 100 mg | 2 | 474 | Mean Difference (IV, Random, 95% CI) | 10.22 [6.31, 14.14] |
| 13.3 Topiramate titrated to 200 mg/day or maximum tolerated dose < 200 mg | 2 | 458 | Mean Difference (IV, Random, 95% CI) | 8.45 [4.38, 12.52] |
| 14 SF‐36 role physical Show forest plot | 2 | Mean Difference (IV, Random, 95% CI) | Subtotals only | |
| 14.1 Topiramate titrated to 50 mg/day or maximum tolerated dose < 50 mg | 2 | 463 | Mean Difference (IV, Random, 95% CI) | 3.00 [‐3.89, 9.90] |
| 14.2 Topiramate titrated to 100 mg/day or maximum tolerated dose < 100 mg | 2 | 474 | Mean Difference (IV, Random, 95% CI) | 10.80 [‐2.42, 24.03] |
| 14.3 Topiramate titrated to 200 mg/day or maximum tolerated dose < 200 mg | 2 | 458 | Mean Difference (IV, Random, 95% CI) | 8.59 [0.65, 16.52] |
| 15 SF‐36 vitality Show forest plot | 2 | Mean Difference (IV, Random, 95% CI) | Subtotals only | |
| 15.1 Topiramate titrated to 50 mg/day or maximum tolerated dose < 50 mg | 2 | 463 | Mean Difference (IV, Random, 95% CI) | 2.08 [‐4.68, 8.84] |
| 15.2 Topiramate titrated to 100 mg/day or maximum tolerated dose < 100 mg | 2 | 474 | Mean Difference (IV, Random, 95% CI) | 4.48 [‐7.77, 16.73] |
| 15.3 Topiramate titrated to 200 mg/day or maximum tolerated dose < 200 mg | 2 | 458 | Mean Difference (IV, Random, 95% CI) | 1.36 [‐4.52, 7.24] |
| 16 SF‐36 physical functioning Show forest plot | 2 | Mean Difference (IV, Random, 95% CI) | Subtotals only | |
| 16.1 Topiramate titrated to 50 mg/day or maximum tolerated dose < 50 mg | 2 | 463 | Mean Difference (IV, Random, 95% CI) | 0.54 [‐3.28, 4.36] |
| 16.2 Topiramate titrated to 100 mg/day or maximum tolerated dose < 100 mg | 2 | 474 | Mean Difference (IV, Random, 95% CI) | 2.78 [‐3.29, 8.86] |
| 16.3 Topiramate titrated to 200 mg/day or maximum tolerated dose < 200 mg | 2 | 458 | Mean Difference (IV, Random, 95% CI) | ‐0.96 [‐5.27, 3.35] |
| 17 SF‐36 bodily pain Show forest plot | 2 | Mean Difference (IV, Random, 95% CI) | Subtotals only | |
| 17.1 Topiramate titrated to 50 mg/day or maximum tolerated dose < 50 mg | 2 | 463 | Mean Difference (IV, Random, 95% CI) | 4.35 [0.04, 8.66] |
| 17.2 Topiramate titrated to 100 mg/day or maximum tolerated dose < 100 mg | 2 | 474 | Mean Difference (IV, Random, 95% CI) | 6.35 [‐1.29, 14.00] |
| 17.3 Topiramate titrated to 200 mg/day or maximum tolerated dose < 200 mg | 2 | 458 | Mean Difference (IV, Random, 95% CI) | 5.12 [‐1.25, 11.49] |
| 18 SF‐36 general health Show forest plot | 2 | Mean Difference (IV, Random, 95% CI) | Subtotals only | |
| 18.1 Topiramate titrated to 50 mg/day or maximum tolerated dose < 50 mg | 2 | 463 | Mean Difference (IV, Random, 95% CI) | 1.45 [‐2.18, 5.08] |
| 18.2 Topiramate titrated to 100 mg/day or maximum tolerated dose < 100 mg | 2 | 474 | Mean Difference (IV, Random, 95% CI) | 4.18 [‐1.21, 9.57] |
| 18.3 Topiramate titrated to 200 mg/day or maximum tolerated dose < 200 mg | 2 | 458 | Mean Difference (IV, Random, 95% CI) | 2.58 [‐1.00, 6.15] |
| 19 SF‐36 social functioning Show forest plot | 2 | Mean Difference (IV, Random, 95% CI) | Subtotals only | |
| 19.1 Topiramate titrated to 50 mg/day or maximum tolerated dose < 50 mg | 2 | 463 | Mean Difference (IV, Random, 95% CI) | 2.00 [‐1.92, 5.92] |
| 19.2 Topiramate titrated to 100 mg/day or maximum tolerated dose < 100 mg | 2 | 474 | Mean Difference (IV, Random, 95% CI) | 3.13 [‐3.73, 9.99] |
| 19.3 Topiramate titrated to 200 mg/day or maximum tolerated dose < 200 mg | 2 | 458 | Mean Difference (IV, Random, 95% CI) | 1.94 [‐2.07, 5.96] |
| 20 SF‐36 role emotional Show forest plot | 2 | Mean Difference (IV, Random, 95% CI) | Subtotals only | |
| 20.1 Topiramate titrated to 50 mg/day or maximum tolerated dose < 50 mg | 2 | 463 | Mean Difference (IV, Random, 95% CI) | 2.30 [‐4.56, 9.16] |
| 20.2 Topiramate titrated to 100 mg/day or maximum tolerated dose < 100 mg | 2 | 474 | Mean Difference (IV, Random, 95% CI) | 4.64 [‐3.39, 12.68] |
| 20.3 Topiramate titrated to 200 mg/day or maximum tolerated dose < 200 mg | 2 | 458 | Mean Difference (IV, Random, 95% CI) | 2.75 [‐4.99, 10.48] |
| 21 SF‐36 mental health Show forest plot | 2 | Mean Difference (IV, Random, 95% CI) | Subtotals only | |
| 21.1 Topiramate titrated to 50 mg/day or maximum tolerated dose < 50 mg | 2 | 463 | Mean Difference (IV, Random, 95% CI) | 1.19 [‐4.59, 6.98] |
| 21.2 Topiramate titrated to 100 mg/day or maximum tolerated dose < 100 mg | 2 | 474 | Mean Difference (IV, Random, 95% CI) | 2.58 [‐5.65, 10.81] |
| 21.3 Topiramate titrated to 200 mg/day or maximum tolerated dose < 200 mg | 2 | 458 | Mean Difference (IV, Random, 95% CI) | 1.57 [‐4.21, 7.35] |
| Outcome or subgroup title | No. of studies | No. of participants | Statistical method | Effect size |
| 1 Headache frequency (change from baseline to post‐treatment, or post‐treatment alone) Show forest plot | 3 | Mean Difference (IV, Random, 95% CI) | Subtotals only | |
| 1.1 Topiramate 100 mg versus 50 mg | 2 | 479 | Mean Difference (IV, Random, 95% CI) | ‐0.71 [‐1.32, ‐0.10] |
| 1.2 Topiramate 200 mg versus 50 mg | 2 | 463 | Mean Difference (IV, Random, 95% CI) | ‐0.96 [‐1.53, ‐0.40] |
| 1.3 Topiramate 200 mg versus 100 mg | 3 | 756 | Mean Difference (IV, Random, 95% CI) | 0.03 [‐0.55, 0.61] |
| 2 Responders (patients with ≥ 50% reduction in headache frequency) Show forest plot | 3 | Odds Ratio (M‐H, Random, 95% CI) | Subtotals only | |
| 2.1 Topiramate 100 mg versus 50 mg | 2 | 478 | Odds Ratio (M‐H, Random, 95% CI) | 1.80 [1.25, 2.60] |
| 2.2 Topiramate 200 mg versus 50 mg | 2 | 462 | Odds Ratio (M‐H, Random, 95% CI) | 1.66 [1.15, 2.41] |
| 2.3 Topiramate 200 mg versus 100 mg | 3 | 756 | Odds Ratio (M‐H, Random, 95% CI) | 0.93 [0.69, 1.24] |
| 3 MSQ‐role function restrictive Show forest plot | 2 | Mean Difference (IV, Random, 95% CI) | Subtotals only | |
| 3.1 Topiramate 100 mg versus 50 mg | 2 | 479 | Mean Difference (IV, Random, 95% CI) | 4.22 [0.65, 7.80] |
| 3.2 Topiramate 200 mg versus 50 mg | 2 | 463 | Mean Difference (IV, Random, 95% CI) | 4.55 [0.82, 8.28] |
| 3.3 Topiramate 200 mg versus 100 mg | 2 | 474 | Mean Difference (IV, Random, 95% CI) | 0.31 [‐3.37, 3.99] |
| 4 MSQ‐role function prevention Show forest plot | 2 | Mean Difference (IV, Random, 95% CI) | Subtotals only | |
| 4.1 Topiramate 100 mg versus 50 mg | 2 | 479 | Mean Difference (IV, Random, 95% CI) | 3.54 [0.48, 6.60] |
| 4.2 Topiramate 200 mg versus 50 mg | 2 | 463 | Mean Difference (IV, Random, 95% CI) | 2.28 [‐2.13, 6.69] |
| 4.3 Topiramate 200 mg versus 100 mg | 2 | 474 | Mean Difference (IV, Random, 95% CI) | ‐1.18 [‐6.67, 4.30] |
| 5 MSQ‐emotional function Show forest plot | 2 | Mean Difference (IV, Random, 95% CI) | Subtotals only | |
| 5.1 Topiramate 100 mg versus 50 mg | 2 | 479 | Mean Difference (IV, Random, 95% CI) | 5.62 [1.67, 9.58] |
| 5.2 Topiramate 200 mg versus 50 mg | 2 | 463 | Mean Difference (IV, Random, 95% CI) | 3.90 [‐0.21, 8.02] |
| 5.3 Topiramate 200 mg versus 100 mg | 2 | 474 | Mean Difference (IV, Random, 95% CI) | ‐1.73 [‐5.80, 2.34] |
| 6 SF‐36 role physical Show forest plot | 2 | Mean Difference (IV, Random, 95% CI) | Subtotals only | |
| 6.1 Topiramate 100 mg versus 50 mg | 2 | 479 | Mean Difference (IV, Random, 95% CI) | 7.70 [‐8.27, 23.67] |
| 6.2 Topiramate 200 mg versus 50 mg | 2 | 463 | Mean Difference (IV, Random, 95% CI) | 5.51 [‐5.17, 16.19] |
| 6.3 Topiramate 200 mg versus 100 mg | 2 | 474 | Mean Difference (IV, Random, 95% CI) | ‐2.20 [‐9.31, 4.90] |
| 7 SF‐36 vitality Show forest plot | 2 | Mean Difference (IV, Random, 95% CI) | Subtotals only | |
| 7.1 Topiramate 100 mg versus 50 mg | 2 | 479 | Mean Difference (IV, Random, 95% CI) | 2.44 [‐3.05, 7.92] |
| 7.2 Topiramate 200 mg versus 50 mg | 2 | 463 | Mean Difference (IV, Random, 95% CI) | ‐0.63 [‐4.64, 3.39] |
| 7.3 Topiramate 200 mg versus 100 mg | 2 | 474 | Mean Difference (IV, Random, 95% CI) | ‐3.01 [‐9.38, 3.35] |
| 8 SF‐36 physical functioning Show forest plot | 2 | Mean Difference (IV, Random, 95% CI) | Subtotals only | |
| 8.1 Topiramate 100 mg versus 50 mg | 2 | 479 | Mean Difference (IV, Random, 95% CI) | 2.35 [‐1.02, 5.72] |
| 8.2 Topiramate 200 mg versus 50 mg | 2 | 463 | Mean Difference (IV, Random, 95% CI) | ‐1.44 [‐4.92, 2.04] |
| 8.3 Topiramate 200 mg versus 100 mg | 2 | 474 | Mean Difference (IV, Random, 95% CI) | ‐3.75 [‐7.18, ‐0.32] |
| 9 SF‐36 bodily pain Show forest plot | 2 | Mean Difference (IV, Random, 95% CI) | Subtotals only | |
| 9.1 Topiramate 100 mg versus 50 mg | 2 | 479 | Mean Difference (IV, Random, 95% CI) | 2.13 [‐1.83, 6.08] |
| 9.2 Topiramate 200 mg versus 50 mg | 2 | 463 | Mean Difference (IV, Random, 95% CI) | 0.85 [‐3.27, 4.96] |
| 9.3 Topiramate 200 mg versus 100 mg | 2 | 474 | Mean Difference (IV, Random, 95% CI) | ‐1.16 [‐5.23, 2.91] |
| 10 SF‐36 general health Show forest plot | 2 | Mean Difference (IV, Random, 95% CI) | Subtotals only | |
| 10.1 Topiramate 100 mg versus 50 mg | 2 | 479 | Mean Difference (IV, Random, 95% CI) | 2.72 [‐0.76, 6.21] |
| 10.2 Topiramate 200 mg versus 50 mg | 2 | 463 | Mean Difference (IV, Random, 95% CI) | 1.13 [‐4.36, 6.62] |
| 10.3 Topiramate 200 mg versus 100 mg | 2 | 474 | Mean Difference (IV, Random, 95% CI) | ‐1.60 [‐8.85, 5.65] |
| 11 SF‐36 social functioning Show forest plot | 2 | Mean Difference (IV, Random, 95% CI) | Subtotals only | |
| 11.1 Topiramate 100 mg versus 50 mg | 2 | 479 | Mean Difference (IV, Random, 95% CI) | 1.13 [‐5.53, 7.79] |
| 11.2 Topiramate 200 mg versus 50 mg | 2 | 463 | Mean Difference (IV, Random, 95% CI) | ‐0.06 [‐4.07, 3.96] |
| 11.3 Topiramate 200 mg versus 100 mg | 2 | 474 | Mean Difference (IV, Random, 95% CI) | ‐1.05 [‐5.56, 3.46] |
| 12 SF‐36 role emotional Show forest plot | 2 | Mean Difference (IV, Random, 95% CI) | Subtotals only | |
| 12.1 Topiramate 100 mg versus 50 mg | 2 | 479 | Mean Difference (IV, Random, 95% CI) | 2.33 [‐3.79, 8.45] |
| 12.2 Topiramate 200 mg versus 50 mg | 2 | 463 | Mean Difference (IV, Random, 95% CI) | 0.63 [‐5.69, 6.94] |
| 12.3 Topiramate 200 mg versus 100 mg | 2 | 474 | Mean Difference (IV, Random, 95% CI) | ‐1.65 [‐7.92, 4.63] |
| 13 SF‐36 mental health Show forest plot | 2 | Mean Difference (IV, Random, 95% CI) | Subtotals only | |
| 13.1 Topiramate 100 mg versus 50 mg | 2 | 479 | Mean Difference (IV, Random, 95% CI) | 1.31 [‐1.87, 4.49] |
| 13.2 Topiramate 200 mg versus 50 mg | 2 | 463 | Mean Difference (IV, Random, 95% CI) | 0.40 [‐2.87, 3.67] |
| 13.3 Topiramate 200 mg versus 100 mg | 2 | 474 | Mean Difference (IV, Random, 95% CI) | ‐0.87 [‐4.10, 2.36] |
| Outcome or subgroup title | No. of studies | No. of participants | Statistical method | Effect size |
| 1 Responders (patients with ≥ 50% reduction in headache frequency) Show forest plot | 1 | Odds Ratio (M‐H, Random, 95% CI) | Totals not selected | |
| 2 MIDAS score Show forest plot | 1 | Mean Difference (IV, Random, 95% CI) | Totals not selected | |
| Outcome or subgroup title | No. of studies | No. of participants | Statistical method | Effect size |
| 1 Headache frequency (post‐treatment) Show forest plot | 1 | Mean Difference (IV, Random, 95% CI) | Totals not selected | |
| 2 Responders (patients with ≥ 50% reduction in headache frequency) Show forest plot | 1 | Odds Ratio (M‐H, Random, 95% CI) | Totals not selected | |
| Outcome or subgroup title | No. of studies | No. of participants | Statistical method | Effect size |
| 1 Headache frequency (change from baseline to post‐treatment, or post‐treatment alone) Show forest plot | 2 | 342 | Mean Difference (IV, Random, 95% CI) | ‐0.14 [‐0.61, 0.34] |
| 1.1 Topiramate 50 mg versus propranolol 80 mg | 1 | 60 | Mean Difference (IV, Random, 95% CI) | ‐0.37 [‐1.15, 0.41] |
| 1.2 Topiramate 100 mg versus propranolol 160 mg | 1 | 282 | Mean Difference (IV, Random, 95% CI) | 0.0 [‐0.60, 0.60] |
| 2 Responders (patients with ≥ 50% reduction in headache frequency) Show forest plot | 1 | Odds Ratio (M‐H, Random, 95% CI) | Totals not selected | |
| Outcome or subgroup title | No. of studies | No. of participants | Statistical method | Effect size |
| 1 Headache frequency (post‐treatment) Show forest plot | 2 | 120 | Mean Difference (IV, Random, 95% CI) | ‐0.90 [‐1.58, ‐0.22] |
| 2 MIDAS score Show forest plot | 1 | Mean Difference (IV, Random, 95% CI) | Totals not selected | |
| Outcome or subgroup title | No. of studies | No. of participants | Statistical method | Effect size |
| 1 Headache frequency (change from baseline to post‐treatment) Show forest plot | 1 | Mean Difference (IV, Random, 95% CI) | Totals not selected | |
| 2 Responders (patients with ≥ 50% reduction in headache frequency) Show forest plot | 1 | Odds Ratio (M‐H, Random, 95% CI) | Totals not selected | |
| 3 Change from baseline in MSQoL Show forest plot | 1 | Mean Difference (IV, Random, 95% CI) | Totals not selected | |