Drenaje abdominal profiláctico después de la cirugía pancreática
Información
- DOI:
- https://doi.org/10.1002/14651858.CD010583.pub4Copiar DOI

- Base de datos:
-
- Cochrane Database of Systematic Reviews
- Versión publicada:
-
- 21 junio 2018see what's new
- Tipo:
-
- Intervention
- Etapa:
-
- Review
- Grupo Editorial Cochrane:
-
Grupo Cochrane de Salud digestiva
- Copyright:
-
- Copyright © 2018 The Cochrane Collaboration. Published by John Wiley & Sons, Ltd.
Cifras del artículo
Altmetric:
Citado por:
Autores
Contributions of authors
Conceiving the review: WZ.
Designing the review: SH.
Co‐ordinating the review: ZL.
Designing search strategies: WZ, SH.
Study selection: WZ, SH.
Data extraction: JX, ML.
Writing the review: WZ, SH.
Providing general advice on the review: NC.
Securing funding for the review: ZL.
Performing previous work that was the foundation of the current study: YC.
Sources of support
Internal sources
-
Chongqing Medical University, China.
Provided funding for the review
External sources
-
No sources of support supplied
Declarations of interest
WZ: none known.
SH: none known.
YC: none known.
JX: none known.
ML: none known.
NC: none known.
ZL: none known.
Acknowledgements
We acknowledge the contribution of authors of previous version of this review: Yao Cheng, Jie Xia, Mingliang Lai, Nansheng Cheng, Sirong He.
We acknowledge the help and support of the Cochrane Upper Gastrointestinal and Pancreatic Diseases Review Group. The authors would also like to thank the following editors and peer referees who provided comments to improve the review: Sarah Rhodes (Editor), Adam Berger, Alfretta Vanderheyden, and Paul Moayyedi (Editor), to Megan Prictor for copy editing the review, and Victoria Pennick for copy editing the updated review.
The Methods section of this review is based on a standard template used by Cochrane Upper Gastrointestinal and Pancreatic Diseases Review Group.
Version history
| Published | Title | Stage | Authors | Version |
| 2021 Dec 18 | Prophylactic abdominal drainage for pancreatic surgery | Review | Sirong He, Jie Xia, Wei Zhang, Mingliang Lai, Nansheng Cheng, Zuojin Liu, Yao Cheng | |
| 2018 Jun 21 | Prophylactic abdominal drainage for pancreatic surgery | Review | Wei Zhang, Sirong He, Yao Cheng, Jie Xia, Mingliang Lai, Nansheng Cheng, Zuojin Liu | |
| 2016 Oct 21 | Prophylactic abdominal drainage for pancreatic surgery | Review | Yao Cheng, Jie Xia, Mingliang Lai, Nansheng Cheng, Sirong He | |
| 2015 Aug 21 | Prophylactic abdominal drainage for pancreatic surgery | Review | Su Peng, Yao Cheng, Chen Yang, Jiong Lu, Sijia Wu, Rongxing Zhou, Nansheng Cheng | |
| 2013 Jun 12 | Prophylactic abdominal drainage for pancreatic surgery | Protocol | Yao Cheng, Chen Yang, Yixin Lin, Jiong Lu, Sijia Wu, Rongxing Zhou, Nansheng Cheng | |
Differences between protocol and review
Because overall infectious complications were not reported, we chose two types of infectious complication (intra‐abdominal infection and wound infection) for the 'Summary of findings' table.
Keywords
MeSH
Medical Subject Headings (MeSH) Keywords
Medical Subject Headings Check Words
Humans;
PICO
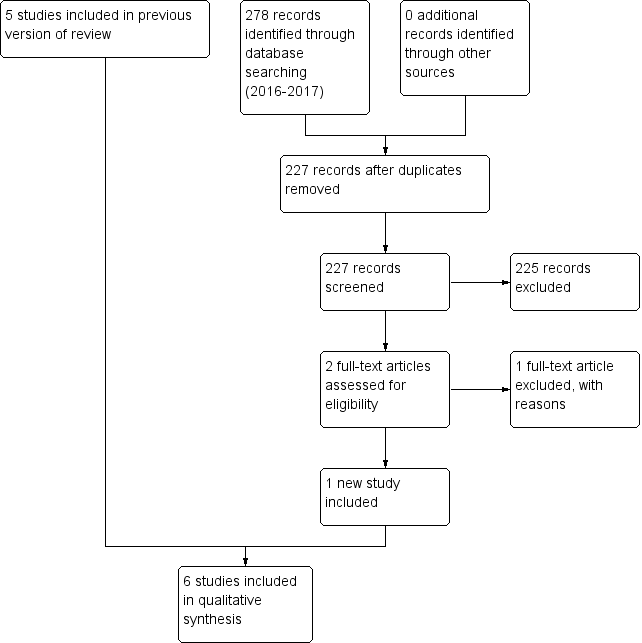
Study flow diagram: 2018 review update

Risk of bias graph: review authors' judgements about each risk of bias item presented as percentages across all included studies

Risk of bias summary: review authors' judgements about each risk of bias item for each included study

Comparison 1 Drain use versus no drain use, Outcome 1 Mortality (30 days).

Comparison 1 Drain use versus no drain use, Outcome 2 Mortality (90 days).
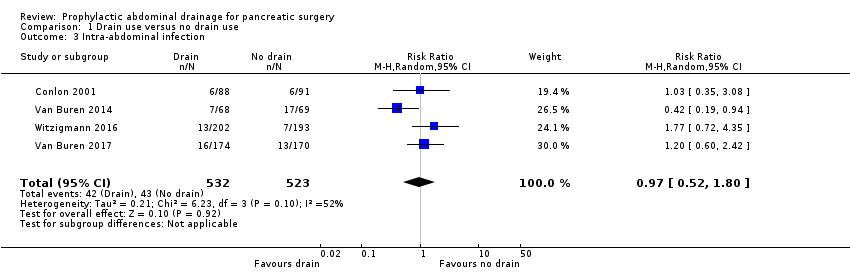
Comparison 1 Drain use versus no drain use, Outcome 3 Intra‐abdominal infection.
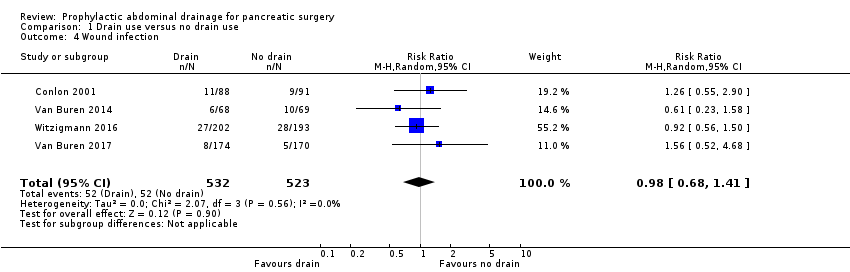
Comparison 1 Drain use versus no drain use, Outcome 4 Wound infection.
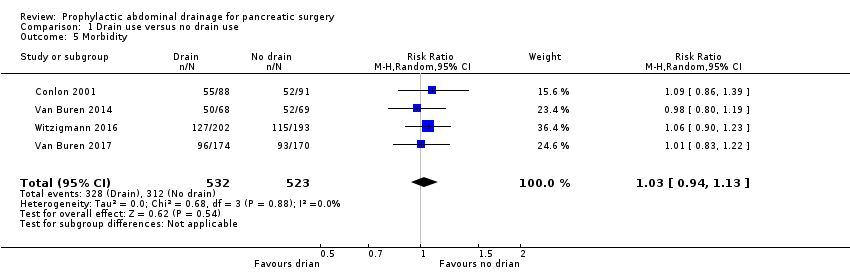
Comparison 1 Drain use versus no drain use, Outcome 5 Morbidity.

Comparison 1 Drain use versus no drain use, Outcome 6 Length of hospital stay (days).
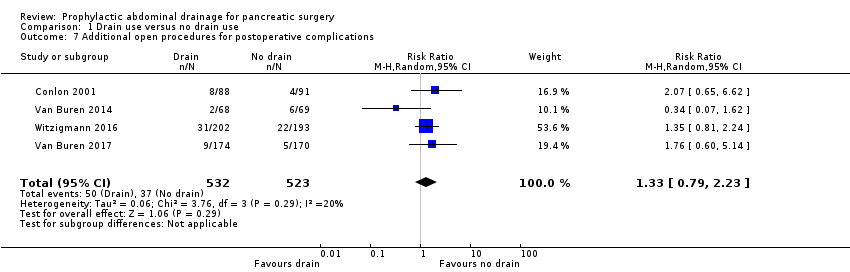
Comparison 1 Drain use versus no drain use, Outcome 7 Additional open procedures for postoperative complications.

Comparison 1 Drain use versus no drain use, Outcome 8 Additional radiological interventions for postoperative complications.
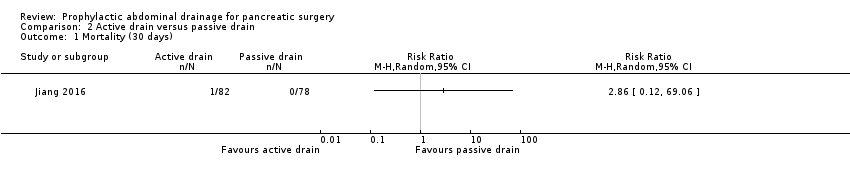
Comparison 2 Active drain versus passive drain, Outcome 1 Mortality (30 days).
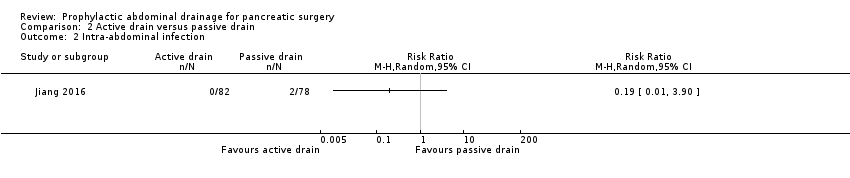
Comparison 2 Active drain versus passive drain, Outcome 2 Intra‐abdominal infection.

Comparison 2 Active drain versus passive drain, Outcome 3 Wound infection.

Comparison 2 Active drain versus passive drain, Outcome 4 Morbidity.
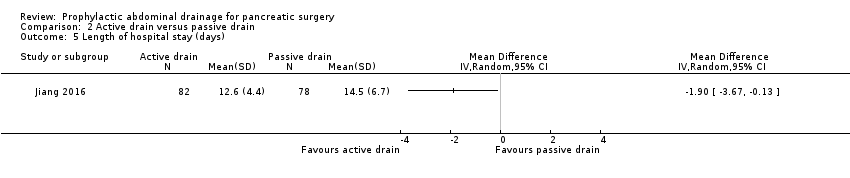
Comparison 2 Active drain versus passive drain, Outcome 5 Length of hospital stay (days).
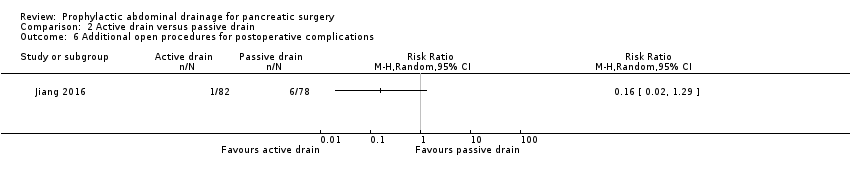
Comparison 2 Active drain versus passive drain, Outcome 6 Additional open procedures for postoperative complications.
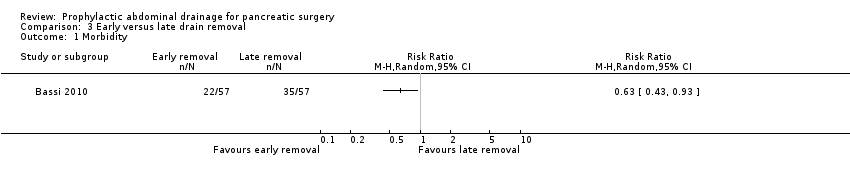
Comparison 3 Early versus late drain removal, Outcome 1 Morbidity.
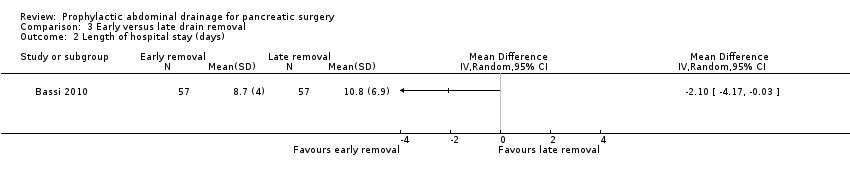
Comparison 3 Early versus late drain removal, Outcome 2 Length of hospital stay (days).

Comparison 3 Early versus late drain removal, Outcome 3 Hospital costs (EUR).

Comparison 3 Early versus late drain removal, Outcome 4 Additional open procedures for postoperative complications.

Comparison 4 Drain use versus no drain use sensitivity analysis for missing data, Outcome 1 Mortality (90 days) ‐ worst‐case scenario.
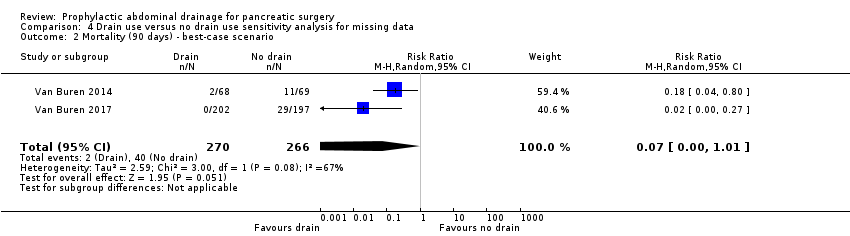
Comparison 4 Drain use versus no drain use sensitivity analysis for missing data, Outcome 2 Mortality (90 days) ‐ best‐case scenario.
| Drain use versus no drain use for pancreatic surgery | ||||||
| Patient or population: people undergoing elective open pancreatic resections | ||||||
| Outcomes | Anticipated absolute effects* (95% CI) | Relative effect | No of participants | Certainty of the evidence | Comments | |
| Risk with no drain use | Risk with drain use | |||||
| Mortality Follow‐up: 30 days | 23 per 1000 | 18 per 1000 (7 to 46) | RR 0.78 | 1055 | ⊕⊕⊕⊝ | |
| Mortality Follow‐up: 90 days | 42 per 1000 | 10 per 1000 (3 to 38) | RR 0.23 | 478 | ⊕⊕⊕⊝ | |
| Intra‐abdominal infection Follow‐up: 30 days | 82 per 1000 | 80 per 1000 (43 to 148) | RR 0.97 | 1055 | ⊕⊝⊝⊝ | |
| Wound infection Follow‐up: 30 days | 99 per 1000 | 97 per 1000 (68 to 140) | RR 0.98 | 1055 | ⊕⊕⊝⊝ | |
| Drain‐related complications Follow‐up: 30 days | See comment | See comment | Not estimable | 179 | ⊕⊕⊝⊝ | There was 1 drain‐related complication in the drainage group. The drainage tube was broken. |
| Morbidity Follow‐up: 30 days | 597 per 1000 | 614 per 1000 (561 to 674) | RR 1.03 | 1055 | ⊕⊕⊕⊝ | |
| Length of hospital stay Follow‐up: 30 days | The mean length of hospital stay in the no drain groups was 13.8 days | The mean length of hospital stay in the drain groups was | MD ‐0.66 (‐1.60 to 0.29) | 711 | ⊕⊕⊕⊝ | |
| Hospital costs Follow‐up: 30 days | Not reported | |||||
| Additional open procedures for postoperative complications Follow‐up: 30 days | 71 per 1000 | 94 per 1000 (56 to 158) | RR 1.33 | 1055 | ⊕⊕⊝⊝ | |
| Additional radiological interventions for postoperative complications Follow‐up: 30 days | 121 per 1000 | 105 per 1000 (48 to 227) | RR 0.87 | 660 | ⊕⊝⊝⊝ | |
| Pain Follow‐up: 30 days | Not reported | |||||
| Quality of life Follow‐up: 30 days FACT‐PA questionnaire: scale 0 to 144, where higher values indicate better quality of life | The mean quality of life score in the no drain group was 104 points | The mean quality of life score in the drain groups was | Not estimable (see comment) | 399 | ⊕⊕⊝⊝ | The study reported the mean quality of life score, without mentioning the standard deviation. |
| * The basis for the assumed risk was the control group proportion in the study. The risk in the intervention group (and its 95% confidence interval) is based on the assumed risk in the control group and the relative effect of the intervention (and its 95% CI). CI: Confidence interval; RR: Risk ratio; MD: mean difference. | ||||||
| GRADE Working Group grades of evidence | ||||||
| 1 Downgraded one level for serious imprecision (very few events, confidence interval of risk ratio overlapped 0.75 and 1.25). | ||||||
| Active drain versus passive drain for pancreatic surgery | ||||||
| Patient or population: people undergoing elective open pancreatic resections | ||||||
| Outcomes | Anticipated absolute effects* (95% CI) | Relative effect | No of participants | Quality of the evidence | Comments | |
| Risk with passive drain | Risk with active drain | |||||
| Mortality Follow‐up: 30 days | 1 per 1000 | 3 per 1000 (0 to 69) | RR 2.86 | 160 | ⊕⊕⊝⊝ | There were no events in the control arm. A risk of "1 per 1000" was chosen for illustration. RR was calculated using a correction factor and should be interpreted with caution. |
| Mortality Follow‐up: 90 days | Not reported | |||||
| Intra‐abdominal infection Follow‐up: 30 days | 26 per 1000 | 5 per 1000 (0 to 100) | RR 0.19 | 160 | ⊕⊝⊝⊝ | |
| Wound infection Follow‐up: 30 days | 90 per 1000 | 61 per 1000 (21 to 184) | RR 0.68 | 160 | ⊕⊝⊝⊝ | |
| Drain‐related complications Follow‐up: 30 days | Not reported | |||||
| Morbidity Follow‐up: 30 days | 321 per 1000 | 218 per 1000 (131 to 369) | RR 0.68 | 160 | ⊕⊕⊝⊝ | |
| Length of hospital stay Follow‐up: 30 days | The mean length of hospital stay in the passive drain group was 14.5 days | The mean length of hospital stay in the active drain group was | MD ‐1.90 (‐3.67 to ‐0.13) | 160 | ⊕⊕⊝⊝ | |
| Hospital costs Follow‐up: 30 days | Not reported | |||||
| Additional open procedures for postoperative complications Follow‐up: 30 days | 77 per 1000 | 12 per 1000 (2 to 99) | RR 0.16 | 160 | ⊕⊝⊝⊝ | |
| Additional radiological interventions for postoperative complications Follow‐up: 30 days | Not reported | |||||
| Pain Follow‐up: 30 days | Not reported | |||||
| Quality of life Follow‐up: 30 days | Not reported | |||||
| * The basis for the assumed risk was the control group proportion in the study. The risk in the intervention group (and its 95% confidence interval) is based on the assumed risk in the control group and the relative effect of the intervention (and its 95% CI). | ||||||
| GRADE Working Group grades of evidence | ||||||
| 1 Downgraded two levels for very serious imprecision (small sample sizes, very few events, confidence intervals of risk ratios overlapped 0.75 and 1.25). | ||||||
| Early versus late drain removal for pancreatic surgery | ||||||
| Patient or population: people undergoing elective open pancreatic resections Setting: hospital | ||||||
| Outcomes | Anticipated absolute effects* (95% CI) | Relative effect | No of participants | Quality of the evidence | Comments | |
| Risk with late drain removal | Risk with early drain removal | |||||
| Mortality Follow‐up: 30 days | There was no mortality in either group. | 114 | ⊕⊕⊕⊝ | |||
| Mortality Follow‐up: 90 days | Not reported | |||||
| Intra‐abdominal infection Follow‐up: 30 days | Not reported | |||||
| Wound infection Follow‐up: 30 days | Not reported | |||||
| Drain‐related complications Follow‐up: 30 days | Not reported | |||||
| Morbidity Follow‐up: 30 days | 614 per 1000 | 387 per 1000 (264 to 571) | RR 0.63 | 114 | ⊕⊕⊝⊝ | |
| Length of hospital stay Follow‐up: 30 days | The mean length of hospital stay in the late removal group was 10.8 days | The mean length of hospital stay in the early removal group was | MD ‐2.10 (‐4.17 to ‐0.03) | 114 | ⊕⊕⊝⊝ | |
| Hospital costs Follow‐up: 30 days | The mean hospital costs in the late removal group was EUR 12140.00 | The mean hospital costs in the early removal group was EUR 2069 lower | MD ‐2069.00 (‐3872.26 to ‐265.74) | 114 | ⊕⊕⊝⊝ | |
| Additional open procedures for postoperative complications Follow‐up: 30 days | 18 per 1000 | 6 per 1000 | RR 0.33 | 114 | ⊕⊝⊝⊝ | |
| Additional radiological interventions for postoperative complications Follow‐up: 30 days | Not reported | |||||
| Pain Follow‐up: 30 days | Not reported | |||||
| Quality of life Follow‐up: 30 days | Not reported | |||||
| * The basis for the assumed risk was the control group proportion in the study. The risk in the intervention group (and its 95% confidence interval) is based on the assumed risk in the control group and the relative effect of the intervention (and its 95% CI). | ||||||
| GRADE Working Group grades of evidence | ||||||
| 1 Publication bias could not be assessed because of the few number of studies. | ||||||
| Outcome or subgroup title | No. of studies | No. of participants | Statistical method | Effect size |
| 1 Mortality (30 days) Show forest plot | 3 | 711 | Risk Ratio (M‐H, Random, 95% CI) | 0.78 [0.31, 1.99] |
| 2 Mortality (90 days) Show forest plot | 2 | 478 | Risk Ratio (M‐H, Random, 95% CI) | 0.23 [0.06, 0.90] |
| 3 Intra‐abdominal infection Show forest plot | 4 | 1055 | Risk Ratio (M‐H, Random, 95% CI) | 0.97 [0.52, 1.80] |
| 4 Wound infection Show forest plot | 4 | 1055 | Risk Ratio (M‐H, Random, 95% CI) | 0.98 [0.68, 1.41] |
| 5 Morbidity Show forest plot | 4 | 1055 | Risk Ratio (M‐H, Random, 95% CI) | 1.03 [0.94, 1.13] |
| 6 Length of hospital stay (days) Show forest plot | 3 | 711 | Mean Difference (IV, Random, 95% CI) | ‐0.66 [‐1.60, 0.29] |
| 7 Additional open procedures for postoperative complications Show forest plot | 4 | 1055 | Risk Ratio (M‐H, Random, 95% CI) | 1.33 [0.79, 2.23] |
| 8 Additional radiological interventions for postoperative complications Show forest plot | 3 | 660 | Risk Ratio (M‐H, Random, 95% CI) | 0.87 [0.40, 1.87] |
| Outcome or subgroup title | No. of studies | No. of participants | Statistical method | Effect size |
| 1 Mortality (30 days) Show forest plot | 1 | Risk Ratio (M‐H, Random, 95% CI) | Totals not selected | |
| 2 Intra‐abdominal infection Show forest plot | 1 | Risk Ratio (M‐H, Random, 95% CI) | Totals not selected | |
| 3 Wound infection Show forest plot | 1 | Risk Ratio (M‐H, Random, 95% CI) | Totals not selected | |
| 4 Morbidity Show forest plot | 1 | Risk Ratio (M‐H, Random, 95% CI) | Totals not selected | |
| 5 Length of hospital stay (days) Show forest plot | 1 | Mean Difference (IV, Random, 95% CI) | Totals not selected | |
| 6 Additional open procedures for postoperative complications Show forest plot | 1 | Risk Ratio (M‐H, Random, 95% CI) | Totals not selected | |
| Outcome or subgroup title | No. of studies | No. of participants | Statistical method | Effect size |
| 1 Morbidity Show forest plot | 1 | Risk Ratio (M‐H, Random, 95% CI) | Totals not selected | |
| 2 Length of hospital stay (days) Show forest plot | 1 | Mean Difference (IV, Random, 95% CI) | Totals not selected | |
| 3 Hospital costs (EUR) Show forest plot | 1 | Mean Difference (IV, Random, 95% CI) | Totals not selected | |
| 4 Additional open procedures for postoperative complications Show forest plot | 1 | Risk Ratio (M‐H, Random, 95% CI) | Totals not selected | |
| Outcome or subgroup title | No. of studies | No. of participants | Statistical method | Effect size |
| 1 Mortality (90 days) ‐ worst‐case scenario Show forest plot | 2 | 536 | Risk Ratio (M‐H, Random, 95% CI) | 2.15 [0.05, 89.11] |
| 2 Mortality (90 days) ‐ best‐case scenario Show forest plot | 2 | 536 | Risk Ratio (M‐H, Random, 95% CI) | 0.07 [0.00, 1.01] |